Abstract
Cells employ signaling pathways to make decisions in response to changes in their immediate environment. Transforming growth factor beta (TGF-β) is an important growth factor that regulates many cellular functions in development and disease. Although the molecular mechanisms of TGF-β signaling have been well studied, our understanding of this pathway is limited by the lack of tools that allow the control of TGF-β signaling with high spatiotemporal resolution. Here, we developed an optogenetic system (optoTGFBRs) that enables the precise control of TGF-β signaling in time and space. Using the optoTGFBRs system, we show that TGF-β signaling can be selectively and sequentially activated in single cells through the modulation of the pattern of light stimulations. By simultaneously monitoring the subcellular localization of TGF-β receptor and Smad2 proteins, we characterized the dynamics of TGF-β signaling in response to different patterns of blue light stimulations. The spatial and temporal precision of light control will make the optoTGFBRs system as a powerful tool for quantitative analyses of TGF-β signaling at the single cell level.
Keywords: cell signaling, TGF-beta, optogenetics, Smad2
Graphical Abstract
Transforming growth factor beta (TGF-β) signaling has an important role in controlling many cellular processes including cell proliferation, differentiation, migration, tissue development and homeostasis.1,2 Abnormal TGF-β signaling activities have been connected to a variety of diseases, such as cancer, fibrosis and inflammation. Therefore, the TGF-β signaling pathway has been an attractive target for drug development.3,4
The active form of TGF-β is a 25 kDa dimer that binds the homodimer of TGF-β type II receptors (TβRII) to facilitate the formation of a complex with a TGF-β type I receptors (TβRI) homodimer.5 The constitutively active kinase TβRII catalyzes transphosphorylation of the TβRI and therefore activates the kinase activity of TβRI. In the canonical TGF-β signaling pathway, the receptor-regulated effector proteins (Smad2 and Smad3) are phosphorylated at a C-terminal SSXS motif by the activated TβRI. Smad2 and Smad3 then bind Smad4 and translocate to the nucleus.6,7 These Smad complexes bind DNA in conjunction with other transcription factors and regulate the expression of hundreds of target genes.8,9
Several approaches have been developed to control TGF-β signaling in order to study how its activation affects cellular responses. For examples, synthetic activation of TGF-β signaling was achieved by chemically induced dimerization of chimeric TGF-β receptors.10,11 In addition, synthetic surfaces presenting peptide ligands to TGF-β receptors have also been designed to promote TGF-β signaling.12 Recently, near-infrared light was used to release active TGF-β ligand from small latent complex conjugated with single-walled carbon nanotube.13 Numerous studies have aimed at directly inhibiting TGF-β signaling components. Small molecular inhibitors have been screened to inhibit the kinase activity of TβRI.14,15 Monoclonal antibodies and antisense oligonucleotides/RNAs designed to inhibit TGF-β ligands were also developed.16–19 While these chemical tools are able to modulate TGF-β signaling, it remains challenging to quickly and specifically manipulate TGF-β receptor activity without the presence of ligands. It is even more difficult to regulate TGF-β signaling with spatial and temporal precision.
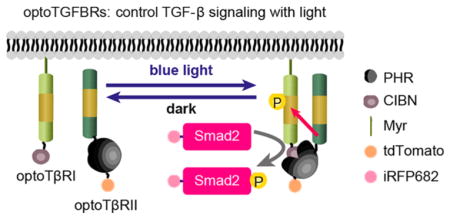
The advent of optogenetics has provided excellent tools, by which cell signaling can be controlled using light stimulation. 20–27 In this study, we report a synthetic tool of TGF-β signaling pathway, optoTGFBRs, which allows precise manipulation of TGF-β signaling with spatial and temporal resolution. In the optoTGFBRs system, fast and precise control of interactions between synthetic TβRI and TβRII is achieved through the reversible interaction between the N-terminal end of CIB1 (CIBN) and the PHR domain of Cryptochrome2 (CRY2) upon blue-light illumination.28,29 The activation of Smad2 can be specifically and quantitatively manipulated by fine-tuning the power of blue light. Additionally, we show that TGF-β/Smad signaling can be spatiotemporal controlled at the single cell level using the optoTGFBRs system. Finally, we demonstrate that Smad dynamics are uncoupled from TGF-β receptors complex formation, which allows us to generate diverse types of Smad2 signaling dynamics by modulating the pattern of light illuminations with the optoTGFBRs system.
RESULTS
Development of a Light Inducible OptoTGFBRs System
We designed an optogenetic system for activating TGF-β signaling by using the PHR-CIBN protein dimerization system. We screened multiple potential pairs of PHR and CIBN domain fused with TβRI and/or TβRII proteins. Our initial screen results indicate that HeLa cells expressing synthetic TβRI and TβRII at the plasma membrane have either no Smad2 nuclear translocation upon blue light stimulation, or high basal levels of Smad2 nuclear accumulation without light stimulation (Table S1). In addition, it appears that Smad2 signaling could not be activated by blue light when the PHR and CIBN domains are fused at the N-terminal of TβRI and TβRII proteins. Eventually we identified an optically controlled system, optoTGFBRs, that is able to activate TGF-β signaling (Figure 1A,B). As TβRII is constitutively active, we hypothesized that light-activated interaction of CIBN-PHR would bring TβRII and TβRI into close proximity, leading to the formation of TβRI/TβRII complex and the activation of Smad2 in the absence of the TGF-β ligand. To simultaneously monitor the formation of TGF-β receptors complex and Smad signaling dynamics, we established an optoTGFBRs-HeLa cell line stably coexpressing the optoTβRI protein (Myr-cytTβRI-CIBN, the cytoplasmic region of TβRI was fused with the CIBN domain and anchored at the plasma membrane with a myristoylation sequence) and the optoTβRII protein (cytTβRII-PHR-tdTomato, the PHR domain of CRY2 was fused to the cytoplasmic region of TβRII tagged with tdTomato). In addition, human Smad2 protein tagged with iRFP682 (iRFP-Smad2) is stably expressed to report Smad2 activation.
Figure 1.
The development of the optoTGFBRs system. (A) Schematic representation of the wild type TGF-β/Smad signaling (WT) and the optoTGFBRs system. (B) The design of the OptoTGFBRs construct. OptoTβRI, the cytoplasmic region of TGBFR1 was inserted between the myristoylation signal peptide (Myr) and CIBN. OptoTβRII, the PHR domain of CRY2 was fused to the cytoplasmic region of TβRII tagged with tdTomato. TM, transmembrane region.
To check the plasma membrane localization of the Myr-TβRI-CIBN fusion protein, we expressed the Myr-TβRI-CIBN fusion protein with a monomeric cerulean fluorescence tag (Myr-cytTβRI-CIBN-mCer) in HeLa cells. The Myr-cytTβRI-CIBN-mCer protein locates at the plasma membrane, indicating that the myristoylation signal peptide successfully anchored the CIBN-TβRI protein to the plasma membrane (Figure S1). We also confirmed that the cytTβRII-PHR-tdTomato protein has a cytoplasmic localization in optoTGFBRs-HeLa cells (Figure 2A). The expression of Myr-TβRI-CIBN, cytTβRII-PHR-tdTomato and iRFP-Smad2 proteins in optoTGFBRs-HeLa cells were validated by immunoblotting experiments (Figure S2).
Figure 2.
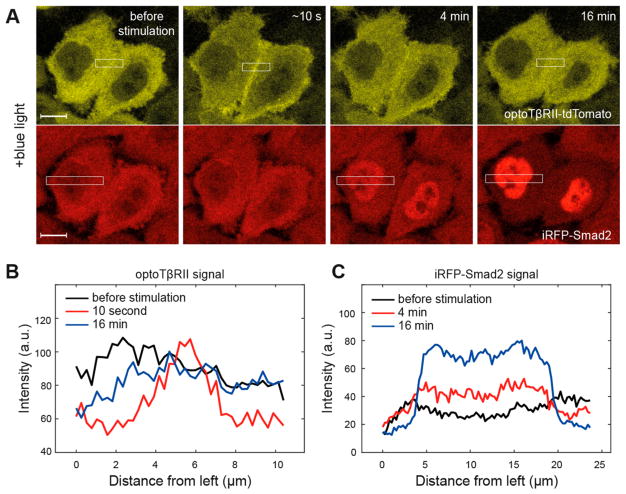
The optoTGFBRs system: a light induced switch to drive TGF-β/Smad signaling. (A) Representative fluorescent images of optoTβRII (cytTβRII-PHR-tdTomato, yellow) and iRFP-Smad2 (red) from optoTGFBRs-HeLa cells, illuminated by a short pulse of blue light (pixel dwell time, 6.3 μs). (B–C) The mean intensity level of optoTβRII and iRPF-Smad2 fluorescence signal within the white squares marked in panel A.
In order to examine the functionality of the optoTGFBRs system, we performed time-lapse live cell imaging experiments and confirmed that blue light activates the canonical TGF-β/Smad pathway. To activate Smad signaling, optoTGFBRs-HeLa cells were illuminated with a short pulse of blue light (488 nm, 12.4 μW). After illumination, TβRII-PHR-tdTomato proteins were recruited into the plasma membrane within seconds and iRFP-Smad2 proteins were translocated into the nucleus in minutes, reflecting the formation of heteromeric TβRI/TβRII complexes and Smad activation, respectively (Figure 2). The observed fast association and dissociation kinetics of the optoTGFBRs system are consistent with the fast turn-on and turn-off rates of the CRY2/CIBN dimerizer system.29,30 We also found that Smad2 signaling can be activated by stimulating the optoTGFBRs-HeLa cells with two-photon excitation at 860 nm (Figure S3). These results suggest that the optoTGFBRs system allows us to control and analyze the TGF-β signaling at the single cell level and even potentially in vivo.
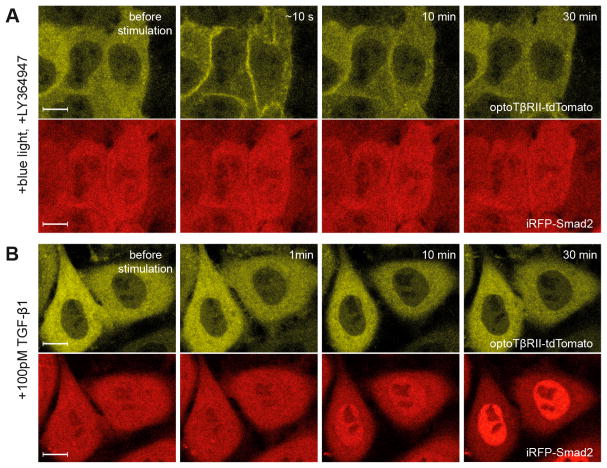
The light-induced Smad2 activation can be specifically blocked by the selective inhibitor of TGF-β receptors (LY364947) in optoTGFBRs-HeLa cells (Figure 3A). The TGF-β1 ligand can induce iRFP-Smad2 activation in optoTGFBRs-HeLa cells without the recruitment of the cytTβRII-PHR-tdTomato to the plasma membrane (Figure 3B). In addition, trypan blue staining and MTT cell viability tests indicated that the blue light stimulations used in this study are not phototoxic to optoTGFBRs-HeLa or HeLa cells (Figure 4). These results suggest that TGF-β/Smad signaling could be specifically activated upon blue light stimulation in the optoTGFBRs system.
Figure 3.
The responses of optoTGFBRs system to TGF-β receptor inhibitor and TGF-β ligand. Representative fluorescent images of optoTβRII (cytTβRII-PHR-tdTomato, yellow) and iRFP-Smad2 (red) from optoTGFBRs-HeLa cells. (A) Illuminated by a short pulse of blue light (pixel dwell time, 6.3 μs) in the presence of TGF-β receptor kinase inhibitor LY364947. (B) Stimulated with 100 pM TGF-β1 ligand. Scale bars: 10 μm.
Figure 4.
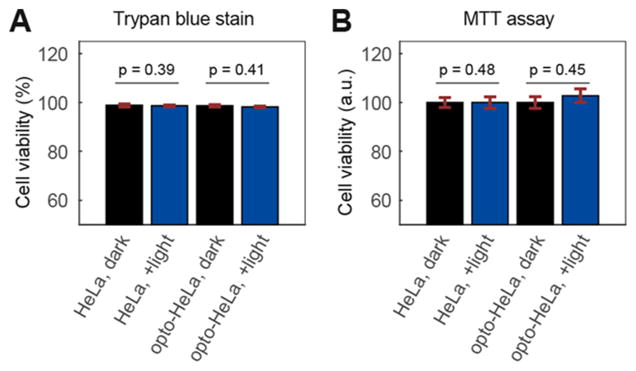
Cell viability assays for optoTGFBRs-HeLa cells after 24 h of blue light illumination (488 nm, 0.8 mW/cm2). (A) Trypan blue stain assay, (B) MTT cell viability assay. Error bars in A and B show the standard errors of the mean from 6 and 16 replicates, respectively. The p-values were calculated using a two-sample t test.
Light Induces Smad2 Phosphorylation and Downstream Gene Expression with OptoTGFBRs
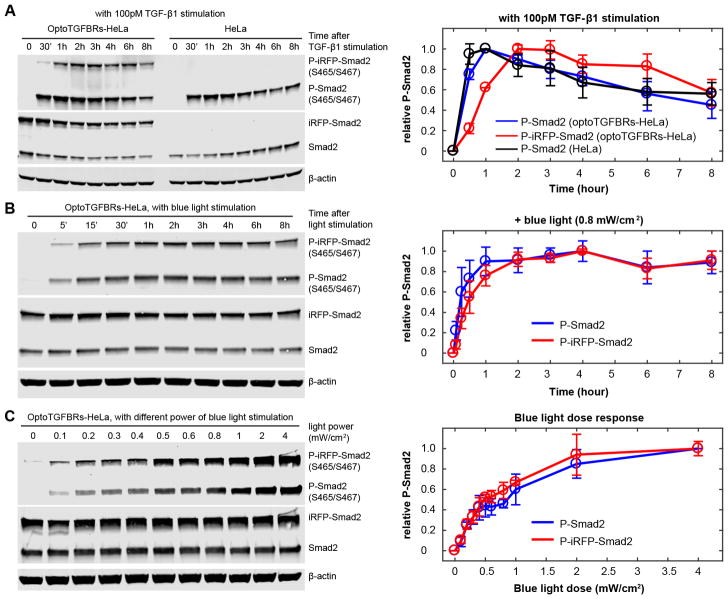
To further investigate the function of the optoTGFBRs system, we compared the phosphorylation of Smad2 in optoTGFBRs-HeLa cells to that in nontransduced HeLa cells when they are treated with TGF-β1. Immunoblotting analysis shows that Smad2 phosphorylation is increased and sustained in both optoTGFBRs-HeLa and HeLa cells upon TGF-β1 stimulation, although the phosphorylation of iRFP-Smad2 protein peaks slightly later than that of endogenous Smad2 protein (Figure 5A). Similar dynamics of endogenous Smad2 and iRFP-Smad2 phosphorylation were observed in the blue light illuminated optoTGFBRs-HeLa cells (Figure 5B). In addition, the amplitude of Smad2 phosphorylation in optoTGFBRs-HeLa cells can be modulated by fine-tuning the power of blue light (Figure 5C). Furthermore, we found that the blue light can efficiently induce the expression of downstream TGF-β responsive genes (Figure S4).
Figure 5.
Smad2 phosphorylation responses in optoTGFBRs-HeLa cells. (A) Time course of P-Smad2 response to 100 pM TGF-β1 ligand stimulation. (B) Time course of P-Smad2 response to continuous blue light illumination (488 nm, 0.8 mW/cm2). (C) P-Smad2 response at 45 min after different power of blue light stimulations. Relative P-Smad2 level was quantified as the ratio of P-Smad2 to corresponding Smad2 signal (normalized with the maximal signal in each time course). Error bars show the standard deviations from three replicates.
Control of TGF-β/Smad Signaling in Time and Space with OptoTGFBRs at the Single Cell Level
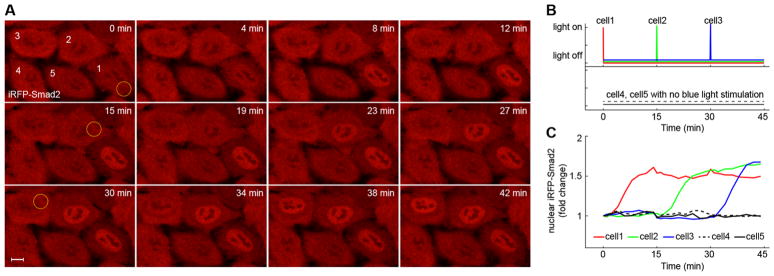
To demonstrate the dynamic spatial activation of TGF-β signaling, we generated sequential activation of Smad signaling in single cells. At different time points, we illuminated one specific optoTGFBRs-HeLa cell with a short pulse of blue light while surrounding cells were kept in dark. As shown in Figure 6 and Movie S1, when single cells were sequentially illuminated, Smad2 signaling was activated in each cell according to the same sequence. This result indicates that it is possible to control the activation of TGF-β signaling in single cells with high spatial and temporal resolution using the optoTGFBRs system.
Figure 6.
Spatiotemporal control of Smad2 signaling in optoTGFBRs-HeLa cells. (A) One short pulse of blue light (488 nm, 12.4 μW with pixel dwell time, 100 μs) was used to illuminate the yellow circle area of cell 1, cell 2, cell 3 at 0 min, 15 and 30 min, respectively. Representative fluorescent images of iRFP-Smad2 from optoTGFBRs-HeLa cells show selective and sequential nuclear Smad2 accumulation in different cells. (B) Schematic representation of the light stimulation for the marked cells in panel A. (C) Quantification of nuclear Smad2 signaling dynamics of the marked cells in panel A. See also Movie S1. Scale bar: 10 μm.
Generating Complex Smad2 Signaling Dynamics by Manipulating the Pattern of Light Stimulations
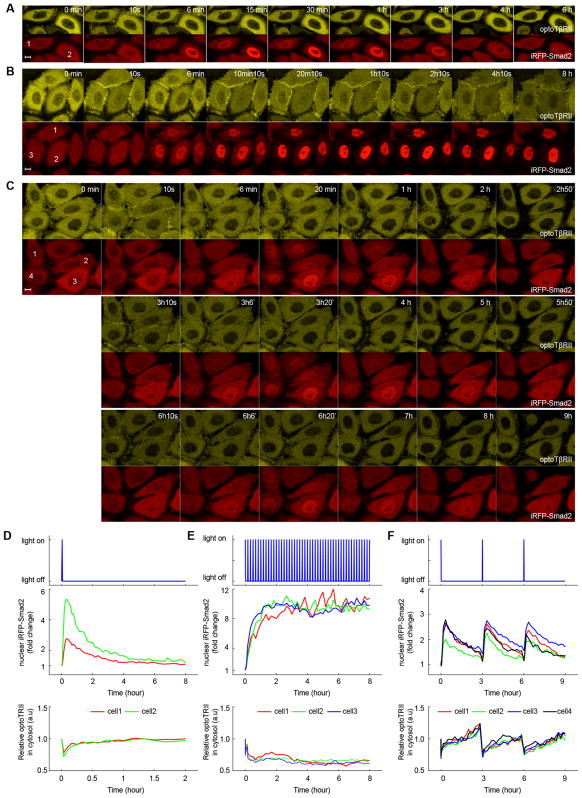
To simultaneously monitor the dynamics of TGF-β receptor and Smad2 signaling, we performed long-term live cell imaging experiments with the optoTGFBRs-HeLa cells. We stimulated optoTGFBRs-HeLa cells with a very short pulse of blue light (pixel dwell time: 6.3 μs/pixel, which is the time the focused laser dwells on each pixel). As shown in Figure 7A, 7D and Movie S2, TβRII-PHR-dTomato proteins are recruited to the plasma membrane and reach maximum recruitment within seconds. After the light is turned off, TβRII-PHR-tdTomato proteins dissociate with TβRI and return to cytoplasm, reaching its prestimulation levels within 15 min. However, Smad2 activation and deactivation processes are much slower. Although the amplitude of Smad2 nuclear accumulation varies among individual cells, the peak time of nuclear Smad2 signaling is very robust at about 20 min after cells are exposed to a short pulse of blue light. The deactivation of Smad2 is much slower than the recovery of cytoplasmic optoTβRII receptor signal. This result suggests that the dynamics of Smad2 signaling and TGF-β receptors occur on different time scales.
Figure 7.
Dynamics of Smad2 signaling in optoTGFBRs-HeLa cells stimulated with repeated pulses of blue light at different frequencies. (A) With one short pulse of light illumination. (B) With repeated pulses of light stimulation every 10 min. (C) With repeated pulses of light stimulation every 3 h. Scale bar: 10 μm. Light power for each pulse: 488 nm, 12.4 μW with pixel dwell time of 3.15 μs. (D–F) Quantification of nuclear Smad2 and cytoplasmic optoTβRII signaling dynamics shown in panel A–C. See also Movie S2–S4.
As there is a delay of about 90 min between Smad2 deactivation and TGF-β receptors complex dissociation processes, we speculate that such a delay feature would enable TGF-β signaling pathway to filter high frequency of input signal changes and remember the previous input signal for a short time. To test this hypothesis, we stimulated optoTGFBRs-HeLa cells with repeated pulses of blue light stimulation at different frequencies. When the period of pulsed light is much shorter than the receptor-Smad signaling delay time, a sustained Smad2 signaling response was observed (Figure 7B, 7E, Movie S3). In contrast, at low frequency of pulsed light stimulations, the Smad2 signaling showed oscillated transient responses (Figure 7C, 7F, Movie S4). Therefore, we can easily generate transient, sustained or oscillated Smad2 signaling by using different patterns of light stimulations.
To test whether different blue light stimulations can mimic similar TGF-β ligand stimulations for Smad signaling activation, we used a published mathematical model to predict Smad2 signaling responses to different pulses of TGF-β stimulations. We also quantified the Smad2 signaling responses to the same patterns of blue light stimulations from dozens of optoTGFBRs-HeLa cells, which show similar dynamics as the model predictions (Figure S5). These results are consistent with the experimental and modeling analyses of TGF-β/Smad dynamics with pulses of TGF-β ligand stimulations.31–33
DISCUSSION
In this study, we reported a new optogenetic system that enables the precise, rapid, and reversible activation of TGF-β/Smad signaling pathway with blue light. With the high spatiotemporal resolution of the optoTGFBRs system, it is now possible to simultaneously characterize the dynamics of the upstream TGF-β receptors signaling and downstream Smad2 signaling in single cells. In addition, the amplitude and kinetics of TGF-β receptors and Smad2 activity can be controlled by fine-tuning the pattern of light stimulation.
Although traditional chemical and genetic approaches (e.g., small molecule inhibition, RNA silencing, genetic knockdown/knockout perturbations) have helped us to identify the functions of key molecular mechanisms in regulating TGF-β signaling, these tools have common limitations such as potential off-target effects on cellular responses, difficult removal and low spatial precision. Moreover, it has been shown that TGF-β ligand is internalized and degraded by cells,34,35 which makes it difficult to control the dose of TGF-β ligand over time. The optoTGFBRs system has advantages to overcome these problems due to the technical advancement of optical control. More importantly, the optoTGFBRs system can be used to control TGF-β signaling dynamics with high spatiotemporal precision at the single cell level, while the classical biological tools are unable to manipulate cell behaviors with the single cell resolution. Therefore, the optoTGFBRs system is complementary to chemical tools and provides additional control of TGF-β signaling activity in time and space with light.
The optoTGFBRs system is potentially useful for other applications. The basic design of the optoTGFBRs system can be generalized to build activating modules for other members of TGF-β superfamily, which could be helpful to study the role TGF-β signaling for cell fate specification during embryonic development. A recent study adapted the light-oxygen-voltage (LOV) based optogenetic system to activate Nodal signaling using a photoactivatable Nodal receptor Opto-acvr1b/2b.36 While this Opto-acvr1b/2b system is adequate to elucidate the role of Nodal signaling duration for cell fate decision at population level, it could not monitor the dynamics of the upstream nodal receptor signaling in single cells. In this Optoacvr1b/2b system, both nodal receptors are expressed at the plasma membrane by injecting zebrafish embryos with optoacvr1b/2b mRNA. Unlike the design of the Opto-acvr1b/2b system, the optoTGFBRs system allows the simultaneous visualization of TGF-β receptors dynamics and Smad activation at the single cell level. In the optoTGFBRs system, the optoTβRI receptor is attached at the plasma membrane, while the optoTβRII receptor is spatially separated and expressed in cytoplasm. The spatial separation of optoTβRI and optoTβRII can avoid high level of basal TGF-β signaling. As the spatial localization of optoTβRII receptor can be changed upon light stimulation, the optoTGFBRs system is able to report the formation and dissociation of TGF-β receptors complexes. Moreover, iRFP-Smad2 is coexpressed to indicate the downstream Smad signaling. This property could help to establish quantitative relationship between the upstream TGF-β receptor signal and downstream Smad signaling, which would be also helpful for quantitative modeling of the TGF-β signaling pathway. In addition, there is great potential to use the optoTGFBRs system to investigate how cells respond to complex signals, such as repeated pulses of signaling inputs, increasing input ramp and noisy signal inputs.31,32,37 Such artificial light inputs may help us to find new functions of TGF-β signaling.
The current generation of the optoTGFBRs system still has some limitations and could be further optimized for the study of TGF-β signaling. For example, optoTβRII and iRFP-Smad2 proteins are overexpressed with constitutive promoters (Figure S2). The overexpressed iRPF-Smad2 protein reaches its maximal activation slightly later than the endogenous Smad2 protein upon TGF-β ligand stimulation (Figure 5A), which might be due to the effect of iRFP-Smad2 overexpression, or the interference of iRFP tag with the speed of Smad2 phosphorylation. However, both the exogenously expressed iRFP-Smad2 and the endogenous Smad2 show similar phosphorylation activation dynamics in response to blue light stimulation (Figure 5B). One possible reason could be that the blue light leads to more efficient activation of TGF-β receptors compared with the TGF-β ligand. In the future, it will be useful to express these proteins from endogenous promoters with the CRISPR/Cas9-mediated knock-in approach.38,39 Such a new version of the optoTGFBRs system would be valuable for the study of TGF-β signaling under the conditions more similar to the physiological state. An alternative design of the optoTGFBRs system is to control the expression of these engineered TGF-β signaling proteins at different levels using inducible gene expression systems. In addition, it would be interesting to study the spatiotemporal control of downstream signaling responses by expressing the reporters for TGF-β responsive genes or the markers of TGF-β dependent cellular responses.
In summary, the spatial and temporal precision of light control allows the optoTGFBRs system to work as a novel analytical tool to disentangle and elucidate TGF-β signaling in various studies.
METHODS
Cell Culture and Transient Transfection
HeLa cells (American Type Culture Collection) were cultured in Dulbecco’s Modified Eagle Medium (Lonza, Catalog #BE12–707F) with 10% fetal bovine serum (Merck Biochrom, Catalog #S0615), 2 mM L-Glutamine (Gibco, Catalog #25030–024), 100 units/mL penicillin and 100 μg/mL streptomycin (Gibco, Catalog #15140–122) at 37 °C and 5% CO2. Cells were transiently transfected using a microporator (Neon Transfection System, Invitrogen) under optimized condition (980 V, 35 ms, 2 pulses) according to the manufacturer’s instructions. Transfected cells were plated on 96-well plate (ibidi, Catalog #89621) and incubated for at least 24 h before experiments.
Plasmids Preparation
To generate the light-inducible TGFBRs system, we used the sequence encoding the photolyase homology region of cryptochrome 2 (PHRCRY2; amino acids 1–489) that was codon optimized for mammalian expression,40 and the N-terminal part of CIB1 (CIBN; amino acid 1–147) from Arabidopsis thaliana.29 The PCR-amplified sequence encoding CIBN was cloned into pmCerulean-C1 vector (Clontech), which resulted in a plasmid encoding CIBN-mCerulean. The myristoylation sequence of Lyn (amino acids 1–11) was added to the N-terminus of CIBN, and the cytoplasmic region of mouse TβRI (amino acids 148–502, 100% homologous in mouse and human) was inserted between the myristoylation sequence and CIBN. To generate Myr-cytTβRI-CIBN, mCerulean sequence was deleted and blunted with Klenow enzyme. The cytTβRII-PHRCRY2-tdTomato construct was generated by inserting sequence encoding PHRCRY2 into the pmCitrine-C1 vector (Clontech). mCitrine was replaced with tdTomato and cytoplasmic region of mouse TβRII (amino acids 190–567) was cloned into the N terminus of PHRCRY2. Finally, we generated a pLNCX2-optoTGFBRs plasmid by combining the Myr-cytTβRI-CIBN and cytTβRII-PHRCRY2-tdTomato with 1:1 ratio using a P2A bicistronic linker sequence. The piRFP682-N1 plasmid was a gift from Vladislav Verkhusha (Addgene, #45459).41 To generate the iRFP682-C1 plasmid, the mCitrine sequence in the pmCitrine-C1 vector was replaced with FP-encoding sequences from the piRFP682-N1 plasmid. For the construction of iRFP682-Smad2, cDNA encoding Smad2 was amplified and inserted to the piRFP682-C1 plasmid. iRFP682-Smad2 was then amplified and replaced the EYFP-Smad2 of pREX-EYFP-Smad2-IRES-BSD (a gift from Xuedong Liu) to generate the pREX-iRFP682-Smad2-IRES-BSD for retroviral transfection.
Stable Cell Line Generation
We first generated the stable HeLa cell line (optoHeLa) expressing the Myr-cytTβRI-CIBN and cytTβRII-PHRCRY2-tdTomato proteins. Packaging cell HEK293T cells were plated onto two 60 mm dishes. After 24 h, pLNCX2-optoTGFBRs, VSV-G and pEQ-PAM3 retroviral vector plasmids were cotransfected into HEK293T cells using Lipofectamine LTX (Invitrogen) following the manufacturer’s protocol. Medium containing retroviral particles was filtered through a 0.45 μm syringe filter (Carl Roth, Catalog #XH43.1) 48 h after transfection. Viral supernatant was used immediately for transduction, or kept at −80 degrees for storage. For retroviral transduction, the filtered supernatant was mixed with 8 μg/mL of Polybrene (Merck Chemicals, Catalog #TR-1003-G) before added to target HeLa cells in 100 mm dishes. Infected HeLa cells were transferred to T75 flasks and treated with corresponding antibiotics for 2 weeks until clonal isolation. The selected clonal cell line was confirmed by confocal live cell imaging. We then generated the stable optoTGFBRs-HeLa cell line by stably transfecting the pREX-iRFP682-Smad2-IRES-BSD plasmid into the aforementioned optoHeLa cells using a similar approach.
Cell Lysate Preparation and Western Blot
HeLa and optoTGFBRs-HeLa cells were lysed in RIPA buffer (Cell Signaling, Catalog #9806, 20 mM Tris-HCl pH 7.5, 150 mM NaCl, 1 mM Na2EDTA, 1 mM EGTA, 1% NP-40, 1% sodium deoxycholate, 2.5 mM sodium pyrophosphate, 1 mM β-glycerophosphate, 1 mM Na3VO4, 1 μg/mL leupeptin), supplemented with 1 mM PMSF, 1 mM NaF, protease inhibitor cocktail (Roche, Catalog #04 693 132 001) and phosphatase inhibitor cocktail (Roche, Catalog #04 906 845 001). Protein concentrations were determined using Pierce BCA protein assay kit (Thermo Scientific, Catalog #23225) according to the manufacturer’s instructions.
SDS–PAGE gels were transferred onto nitrocellulose membrane. The following primary antibodies were used in this work: Phospho-Smad2 (Ser465/467) primary antibody (Cell Signaling, Catalog #3108) with a dilution of 1:500, Smad2 primary antibody (Cell Signaling, Catalog #3103) with a dilution of 1:1000, β-Actin primary antibody (Cell Signaling, Catalog #3700) with a dilution of 1:10 000, TGFBR1 primary antibody (Cell Signaling, Catalog #3712) with a dilution of 1:500, TGFBR2 primary antibody (Santa Cruz, Catalog #sc-400) with a dilution of 1:200. All the primary antibodies were incubated overnight at 4 °C. Secondary antibodies used for Western blot were antirabbit IgG (H+L) DyLight 800 4X PEG Conjugate (Cell Signaling, Catalog #5151, dilution: 1:15 000) and antimouse IgG (H+L) DyLight 680 Conjugate (Cell Signaling, Catalog #5470, dilution: 1:15 000). Western blot images were acquired using Odyssey CLx Imaging System (LICOR Biosciences, Catalog #9140).
LEDs Illumination Box
To illuminate cells in the experiments for Western blot assay, we used an illumination box with 475 nm LEDs (Roithner, Catalog #B56L5111P) made according to a previous study.42 The LEDs box was installed in a CO2 incubator for illuminating cells. The LED illumination power was measured with an optical power sensor (THORLABS, Catalog #S170C).
Cell Imaging and Photoactivation
Cell imaging experiments were performed using Zeiss LSM 710 NLO 2-photon/confocal laser scanning microscope, which was equipped with an incubator to maintain the samples at 37 °C and with 5% CO2. Cells were activated using a laser at 488 nm with the power of 12.4 μW (measured on the focus plane). The light intensity was adjusted by changing the scan speed to fine-tune pixel dwell time.
Microscope Imaging Analysis
The live cell imaging data were manually quantified with ImageJ. The nuclear Smad signal is quantified as the ratio of nuclear to cytoplasmic iRFP-Smad2 signal. The cytoplasmic cytTβRII-PHR-tdTomato level is quantified as the ratio of mean tdTomato intensity in cytoplasmic area to that in the imaging field. Multiple corresponding areas were quantified and the average values were calculated. Data points are shown as fold changes.
Cell Viability Assay
Cell viability tests were performed with trypan blue staining and MTT (3-(4,5-dimethylthiazol-2-yl)-2,5-diphenyltetrazolium bromide) assays. HeLa and optoTGFBRs-HeLa cells were plated in 24-well plates (2.5 × 10⁵ cells/well). After overnight incubation, cells were then keep in dark or exposed to blue light (488 nm, 0.8 mW/cm2) for 24 h. The percentage of viable cells were counted with trypan blue staining in Bio-Rad TC20 cell counter according to the manufacturer’s protocol. MTT assay was performed with the MTT reagent from SERVA (Catalog #20395).
RNA Isolation and qPCR Analysis
OptoTGFBRs-HeLa cells were treated as indicated in the figures before extraction of RNA using QIAGEN RNeasy Plus Mini Kit according to the manufacturer’s protocol. The mRNA from the samples was converted to cDNA using QIAGEN QuantiTect Reverse Transcription Kit, and the DNA was amplified in StepOnePlus Real-Time PCR System from Applied Biosystems. The primer sets are listed as below:
Human GAPDH, forward: CCACTCCTCCACCTTTGAC.
Human GAPDH, reverse: ACCCTGTTGCTGTAGCCA.
Human SMAD7, forward: ACCCGATGGATTTTCTCAAACC.
Human SMAD7, reverse: GCCAGATAATTCGTTCCCCCT.
Human TMEPAI, forward: GCACAGTGTCAGGCAACGG.
Human TMEPAI, reverse: AGATGGTGGGTGGCAGGTC.
Human PAI1, forward: GAGACAGGCAGCTCGGATTC.
Human PAI1, reverse: GGCCTCCCAAAGTGCATTAC.
Mathematical Modeling
Model simulations were implemented with SBML-PET-MPI.43 Details of the mathematical modeling, including initial conditions, parameter values and the system of ordinary differential equations, were described in a previous study.32
Supplementary Material
Acknowledgments
We would like to thank Graycen Wheeler for her proofreading of this paper. This work was supported by the grants to W.D.H from the Institute for Basic Science (IBS-R001-G1) and KAIST Institute for the BioCentury, and to Z.Z. from BMBF funded e:Bio SyBioT project (031A309) and DFG funded Research Training Groups for Computational Systems Biology (GRK 1772).
Footnotes
W.D.H. and Z.Z. conceived the idea, supervised the work. Y.L., M.L., G.W., D.D., and J.M.K. performed the experiments. Y.L., M.L., N.K., X.L. W.D.H. and Z.Z. analyzed the data. Z.Z. wrote the paper with the assistance from W.D.H., Y.L. and M.L.
Notes
The authors declare no competing financial interest.
The Supporting Information is available free of charge on the ACS Publications website at DOI: 10.1021/acssynbio.7b00225.
Figures S1–S5; Table S1 (PDF)
Movie S1 (AVI)
Movie S2 (AVI)
Movie S3 (AVI)
Movie S4 (AVI)
References
- 1.Akhurst RJ, Padgett RW. Matters of context guide future research in TGFbeta superfamily signaling. Sci Signaling. 2015;8:re10. doi: 10.1126/scisignal.aad0416. [DOI] [PubMed] [Google Scholar]
- 2.Massague J. TGFbeta signalling in context. Nat Rev Mol Cell Biol. 2012;13:616–630. doi: 10.1038/nrm3434. [DOI] [PMC free article] [PubMed] [Google Scholar]
- 3.Akhurst RJ, Hata A. Targeting the TGFbeta signalling pathway in disease. Nat Rev Drug Discovery. 2012;11:790–811. doi: 10.1038/nrd3810. [DOI] [PMC free article] [PubMed] [Google Scholar]
- 4.Colak S, ten Dijke P. Targeting TGF-β Signaling in Cancer. Trends in Cancer. 2017;3:56–71. doi: 10.1016/j.trecan.2016.11.008. [DOI] [PubMed] [Google Scholar]
- 5.Munger JS, Huang X, Kawakatsu H, Griffiths MJ, Dalton SL, Wu J, Pittet JF, Kaminski N, Garat C, Matthay MA, Rifkin DB, Sheppard D. The integrin alpha v beta 6 binds and activates latent TGF beta 1: a mechanism for regulating pulmonary inflammation and fibrosis. Cell. 1999;96:319–328. doi: 10.1016/s0092-8674(00)80545-0. [DOI] [PubMed] [Google Scholar]
- 6.Hata A, Chen YG. TGF-beta Signaling from Receptors to Smads. Cold Spring Harbor Perspect Biol. 2016;8:a022061. doi: 10.1101/cshperspect.a022061. [DOI] [PMC free article] [PubMed] [Google Scholar]
- 7.Zi Z, Chapnick DA, Liu X. Dynamics of TGF-beta/Smad signaling. FEBS Lett. 2012;586:1921–1928. doi: 10.1016/j.febslet.2012.03.063. [DOI] [PMC free article] [PubMed] [Google Scholar]
- 8.Hill CS. Transcriptional Control by the SMADs. Cold Spring Harbor Perspect Biol. 2016;8:a022079. doi: 10.1101/cshperspect.a022079. [DOI] [PMC free article] [PubMed] [Google Scholar]
- 9.Massague J, Seoane J, Wotton D. Smad transcription factors. Genes Dev. 2005;19:2783–2810. doi: 10.1101/gad.1350705. [DOI] [PubMed] [Google Scholar]
- 10.Stockwell BR, Schreiber SL. Probing the role of homomeric and heteromeric receptor interactions in TGF-beta signaling using small molecule dimerizers. Curr Biol. 1998;8:761–770. doi: 10.1016/s0960-9822(98)70299-4. [DOI] [PubMed] [Google Scholar]
- 11.Luo K, Lodish HF. Signaling by chimeric erythropoietin-TGF-beta receptors: homodimerization of the cytoplasmic domain of the type I TGF-beta receptor and heterodimerization with the type II receptor are both required for intracellular signal transduction. EMBO J. 1996;15:4485–4496. [PMC free article] [PubMed] [Google Scholar]
- 12.Li L, Klim JR, Derda R, Courtney AH, Kiessling LL. Spatial control of cell fate using synthetic surfaces to potentiate TGF-beta signaling. Proc Natl Acad Sci U S A. 2011;108:11745–11750. doi: 10.1073/pnas.1101454108. [DOI] [PMC free article] [PubMed] [Google Scholar]
- 13.Lin L, Liu L, Zhao B, Xie R, Lin W, Li H, Li Y, Shi M, Chen YG, Springer TA, Chen X. Carbon nanotube-assisted optical activation of TGF-beta signalling by near-infrared light. Nat Nanotechnol. 2015;10:465–471. doi: 10.1038/nnano.2015.28. [DOI] [PubMed] [Google Scholar]
- 14.Sawyer JS, Anderson BD, Beight DW, Campbell RM, Jones ML, Herron DK, Lampe JW, McCowan JR, McMillen WT, Mort N, Parsons S, Smith EC, Vieth M, Weir LC, Yan L, Zhang F, Yingling JM. Synthesis and activity of new aryl- and heteroaryl-substituted pyrazole inhibitors of the transforming growth factor-beta type I receptor kinase domain. J Med Chem. 2003;46:3953–3956. doi: 10.1021/jm0205705. [DOI] [PubMed] [Google Scholar]
- 15.Laping NJ, Grygielko E, Mathur A, Butter S, Bomberger J, Tweed C, Martin W, Fornwald J, Lehr R, Harling J, Gaster L, Callahan JF, Olson BA. Inhibition of transforming growth factor (TGF)-beta1-induced extracellular matrix with a novel inhibitor of the TGF-beta type I receptor kinase activity: SB-431542. Mol Pharmacol. 2002;62:58–64. doi: 10.1124/mol.62.1.58. [DOI] [PubMed] [Google Scholar]
- 16.Chang C. Agonists and Antagonists of TGF-beta Family Ligands. Cold Spring Harbor Perspect Biol. 2016;8:a021923. doi: 10.1101/cshperspect.a021923. [DOI] [PMC free article] [PubMed] [Google Scholar]
- 17.Lonning S, Mannick J, McPherson JM. Antibody targeting of TGF-beta in cancer patients. Curr Pharm Biotechnol. 2011;12:2176–2189. doi: 10.2174/138920111798808392. [DOI] [PubMed] [Google Scholar]
- 18.Schlingensiepen KH, Fischer-Blass B, Schmaus S, Ludwig S. Antisense therapeutics for tumor treatment: the TGF-beta2 inhibitor AP 12009 in clinical development against malignant tumors. Recent Results Cancer Res. 2008;177:137–150. doi: 10.1007/978-3-540-71279-4_16. [DOI] [PubMed] [Google Scholar]
- 19.Kwiatkowski W, Gray PC, Choe S. Engineering TGF-beta superfamily ligands for clinical applications. Trends Pharmacol Sci. 2014;35:648–657. doi: 10.1016/j.tips.2014.10.006. [DOI] [PubMed] [Google Scholar]
- 20.Wend S, Wagner HJ, Muller K, Zurbriggen MD, Weber W, Radziwill G. Optogenetic control of protein kinase activity in mammalian cells. ACS Synth Biol. 2014;3:280–285. doi: 10.1021/sb400090s. [DOI] [PubMed] [Google Scholar]
- 21.Toettcher JE, Weiner OD, Lim WA. Using optogenetics to interrogate the dynamic control of signal transmission by the Ras/Erk module. Cell. 2013;155:1422–1434. doi: 10.1016/j.cell.2013.11.004. [DOI] [PMC free article] [PubMed] [Google Scholar]
- 22.Kim N, Kim JM, Lee M, Kim CY, Chang KY, Heo WD. Spatiotemporal control of fibroblast growth factor receptor signals by blue light. Chem Biol. 2014;21:903–912. doi: 10.1016/j.chembiol.2014.05.013. [DOI] [PubMed] [Google Scholar]
- 23.Grusch M, Schelch K, Riedler R, Reichhart E, Differ C, Berger W, Ingles-Prieto A, Janovjak H. Spatiotemporally precise activation of engineered receptor tyrosine kinases by light. EMBO J. 2014;33:1713–1726. doi: 10.15252/embj.201387695. [DOI] [PMC free article] [PubMed] [Google Scholar]
- 24.Kyung T, Lee S, Kim JE, Cho T, Park H, Jeong YM, Kim D, Shin A, Kim S, Baek J, Kim J, Kim NY, Woo D, Chae S, Kim CH, Shin HS, Han YM, Kim D, Heo WD. Optogenetic control of endogenous Ca(2+) channels in vivo. Nat Biotechnol. 2015;33:1092–1096. doi: 10.1038/nbt.3350. [DOI] [PubMed] [Google Scholar]
- 25.Tischer D, Weiner OD. Illuminating cell signalling with optogenetic tools. Nat Rev Mol Cell Biol. 2014;15:551–558. doi: 10.1038/nrm3837. [DOI] [PMC free article] [PubMed] [Google Scholar]
- 26.Zhou XX, Chung HK, Lam AJ, Lin MZ. Optical control of protein activity by fluorescent protein domains. Science. 2012;338:810–814. doi: 10.1126/science.1226854. [DOI] [PMC free article] [PubMed] [Google Scholar]
- 27.Zhang K, Cui B. Optogenetic control of intracellular signaling pathways. Trends Biotechnol. 2015;33:92–100. doi: 10.1016/j.tibtech.2014.11.007. [DOI] [PMC free article] [PubMed] [Google Scholar]
- 28.Bugaj LJ, Choksi AT, Mesuda CK, Kane RS, Schaffer DV. Optogenetic protein clustering and signaling activation in mammalian cells. Nat Methods. 2013;10:249–252. doi: 10.1038/nmeth.2360. [DOI] [PubMed] [Google Scholar]
- 29.Kennedy MJ, Hughes RM, Peteya LA, Schwartz JW, Ehlers MD, Tucker CL. Rapid blue-light-mediated induction of protein interactions in living cells. Nat Methods. 2010;7:973–975. doi: 10.1038/nmeth.1524. [DOI] [PMC free article] [PubMed] [Google Scholar]
- 30.Valon L, Etoc F, Remorino A, di Pietro F, Morin X, Dahan M, Coppey M. Predictive Spatiotemporal Manipulation of Signaling Perturbations Using Optogenetics. Biophys J. 2015;109:1785–1797. doi: 10.1016/j.bpj.2015.08.042. [DOI] [PMC free article] [PubMed] [Google Scholar]
- 31.Sorre B, Warmflash A, Brivanlou AH, Siggia ED. Encoding of temporal signals by the TGF-beta pathway and implications for embryonic patterning. Dev Cell. 2014;30:334–342. doi: 10.1016/j.devcel.2014.05.022. [DOI] [PMC free article] [PubMed] [Google Scholar]
- 32.Zi Z, Feng Z, Chapnick DA, Dahl M, Deng D, Klipp E, Moustakas A, Liu X. Quantitative analysis of transient and sustained transforming growth factor-beta signaling dynamics. Mol Syst Biol. 2011;7:492. doi: 10.1038/msb.2011.22. [DOI] [PMC free article] [PubMed] [Google Scholar]
- 33.Vizan P, Miller DS, Gori I, Das D, Schmierer B, Hill CS. Controlling long-term signaling: receptor dynamics determine attenuation and refractory behavior of the TGF-beta pathway. Sci Signaling. 2013;6:ra106. doi: 10.1126/scisignal.2004416. [DOI] [PubMed] [Google Scholar]
- 34.Clarke DC, Brown ML, Erickson RA, Shi Y, Liu X. Transforming growth factor beta depletion is the primary determinant of Smad signaling kinetics. Mol Cell Biol. 2009;29:2443–2455. doi: 10.1128/MCB.01443-08. [DOI] [PMC free article] [PubMed] [Google Scholar]
- 35.Massague J, Kelly B. Internalization of transforming growth factor-beta and its receptor in BALB/c 3T3 fibroblasts. J Cell Physiol. 1986;128:216–222. doi: 10.1002/jcp.1041280212. [DOI] [PubMed] [Google Scholar]
- 36.Sako K, Pradhan SJ, Barone V, Ingles-Prieto A, Muller P, Ruprecht V, Capek D, Galande S, Janovjak H, Heisenberg CP. Optogenetic Control of Nodal Signaling Reveals a Temporal Pattern of Nodal Signaling Regulating Cell Fate Specification during Gastrulation. Cell Rep. 2016;16:866–877. doi: 10.1016/j.celrep.2016.06.036. [DOI] [PubMed] [Google Scholar]
- 37.Bugaj LJ, O’Donoghue GP, Lim WA. Interrogating cellular perception and decision making with optogenetic tools. J Cell Biol. 2017;216:25–28. doi: 10.1083/jcb.201612094. [DOI] [PMC free article] [PubMed] [Google Scholar]
- 38.Ratz M, Testa I, Hell SW, Jakobs S. CRISPR/Cas9-mediated endogenous protein tagging for RESOLFT super-resolution microscopy of living human cells. Sci Rep. 2015;5:9592. doi: 10.1038/srep09592. [DOI] [PMC free article] [PubMed] [Google Scholar]
- 39.Mali P, Yang L, Esvelt KM, Aach J, Guell M, DiCarlo JE, Norville JE, Church GM. RNA-guided human genome engineering via Cas9. Science. 2013;339:823–826. doi: 10.1126/science.1232033. [DOI] [PMC free article] [PubMed] [Google Scholar]
- 40.Lee S, Park H, Kyung T, Kim NY, Kim S, Kim J, Heo WD. Reversible protein inactivation by optogenetic trapping in cells. Nat Methods. 2014;11:633–636. doi: 10.1038/nmeth.2940. [DOI] [PubMed] [Google Scholar]
- 41.Shcherbakova DM, Verkhusha VV. Near-infrared fluorescent proteins for multicolor in vivo imaging. Nat Methods. 2013;10:751–754. doi: 10.1038/nmeth.2521. [DOI] [PMC free article] [PubMed] [Google Scholar]
- 42.Muller K, Zurbriggen MD, Weber W. Control of gene expression using a red- and far-red light-responsive bi-stable toggle switch. Nat Protoc. 2014;9:622–632. doi: 10.1038/nprot.2014.038. [DOI] [PubMed] [Google Scholar]
- 43.Zi Z. SBML-PET-MPI: a parallel parameter estimation tool for Systems Biology Markup Language based models. Bioinformatics. 2011;27:1028–1029. doi: 10.1093/bioinformatics/btr038. [DOI] [PubMed] [Google Scholar]
Associated Data
This section collects any data citations, data availability statements, or supplementary materials included in this article.


