

Abstract
Key points
The kinetics of NMDA receptor (NMDAR) signalling are a critical aspect of the physiology of excitatory synaptic transmission in the brain.
Here we develop a mechanistic description of NMDAR function based on the receptor tetrameric structure and the principle that each agonist‐bound subunit must undergo some rate‐limiting conformational change after agonist binding, prior to channel opening.
By fitting this mechanism to single channel data using a new MATLAB‐based software implementation of maximum likelihood fitting with correction for limited time resolution, rate constants were derived for this mechanism that reflect distinct structural changes and predict the properties of macroscopic and synaptic NMDAR currents.
The principles applied here to develop a mechanistic description of the heterotetrameric NMDAR, and the software used in this analysis, can be equally applied to other heterotetrameric glutamate receptors, providing a unifying mechanistic framework to understanding the physiology of glutamate receptor signalling in the brain.
Abstract
NMDA receptors (NMDARs) are tetrameric complexes comprising two glycine‐binding GluN1 and two glutamate‐binding GluN2 subunits. Four GluN2 subunits encoded by different genes can produce up to 10 different di‐ and triheteromeric receptors. In addition, some neurological patients contain a de novo mutation or inherited rare variant in only one subunit. There is currently no mechanistic framework to describe tetrameric receptor function that can be extended to receptors with two different GluN1 or GluN2 subunits. Here we use the structural features of glutamate receptors to develop a mechanism describing both single channel and macroscopic NMDAR currents. We propose that each agonist‐bound subunit undergoes some rate‐limiting conformational change after agonist binding, prior to channel opening. We hypothesize that this conformational change occurs within a triad of interactions between a short helix preceding the M1 transmembrane helix, the highly conserved M3 motif encoded by the residues SYTANLAAF, and the linker preceding the M4 transmembrane helix of the adjacent subunit. Molecular dynamics simulations suggest that pre‐M1 helix motion is uncorrelated between subunits, which we interpret to suggest independent subunit‐specific conformational changes may influence these pre‐gating steps. According to this interpretation, these conformational changes are the main determinants of the key kinetic properties of NMDA receptor activation following agonist binding, and so these steps sculpt their physiological role. We show that this structurally derived tetrameric model describes both single channel and macroscopic data, giving a new approach to interpreting functional properties of synaptic NMDARs that provides a logical framework to understanding receptors with non‐identical subunits.
Keywords: NMDA receptor, Synaptic mechanisms, modelling, Activation kinetics
Key points
The kinetics of NMDA receptor (NMDAR) signalling are a critical aspect of the physiology of excitatory synaptic transmission in the brain.
Here we develop a mechanistic description of NMDAR function based on the receptor tetrameric structure and the principle that each agonist‐bound subunit must undergo some rate‐limiting conformational change after agonist binding, prior to channel opening.
By fitting this mechanism to single channel data using a new MATLAB‐based software implementation of maximum likelihood fitting with correction for limited time resolution, rate constants were derived for this mechanism that reflect distinct structural changes and predict the properties of macroscopic and synaptic NMDAR currents.
The principles applied here to develop a mechanistic description of the heterotetrameric NMDAR, and the software used in this analysis, can be equally applied to other heterotetrameric glutamate receptors, providing a unifying mechanistic framework to understanding the physiology of glutamate receptor signalling in the brain.
Introduction
N‐Methyl‐d‐aspartate (NMDA) receptors are a subtype of ionotropic glutamate receptor with important roles in excitatory synaptic transmission, synaptic plasticity, learning and memory (Bliss & Collingridge, 1993; Cull‐Candy & Leszkiewicz, 2004; Traynelis et al. 2010; Paoletti et al. 2013). Their role as coincidence detectors and in spike timing‐dependent plasticity (Markram et al. 1997, 2012; Nevian & Sakmann, 2004; Froemke et al. 2010; Hao & Oertner, 2012) makes the time course of the synaptic NMDA receptor response an important determinant of circuit function in the central nervous system. Thus, insight into receptor function will enhance our understanding of excitatory synaptic transmission, as well as a wide range of processes in the brain. NMDA receptors are also implicated in multiple neurological diseases (Choi, 1992; Palmer, 2001; Hallett & Standeart, 2004; Ross et al. 2006; Preskorn et al. 2008, 2015; Kantrowitz & Javitt, 2010; Coyle, 2012; Paoletti et al. 2013; Parsons & Raymond, 2014; Yuan et al. 2015; Hu et al. 2016), and thus are a target for new therapeutically relevant classes of allosteric modulators that are currently being developed (Bettini et al. 2010; Costa et al. 2010; Mosley et al. 2010; Mullasseril et al. 2010; Acker et al. 2011; Ogden & Traynelis, 2013; Santangelo Freel et al. 2013; Khatri et al. 2014; Hackos et al. 2016; Strong et al. 2017; Swanger et al. 2018).
Receptor structure and subunit stoichiometry
Recent structural data (Karakas & Furukawa, 2014; Lee et al. 2014; Tajima et al. 2016; Zhu et al. 2016; Lü et al. 2017; Mesbahi‐Vasey et al. 2017) have yielded insight into the functional contributions of multiple domains within each subunit. The structural evidence emerging from these studies are complementary to many functional studies (Gielen et al., 2008, 2009; Yuan et al. 2009; Talukder et al. 2010; Talukder & Wollmuth, 2011; Zhu et al. 2013; Kazi et al. 2013, 2014; Borschel et al. 2015; Glasgow et al. 2015; Mayer, 2017) and can be used to inform new models of NMDA receptor function. For example, the NMDA receptor has twofold symmetry throughout its extracellular domain, dominated by heterodimerization of the GluN1/GluN2 amino terminal domains as well as the GluN1/GluN2 ligand binding domains. The interfaces within and between these heterodimers provide strong inter‐subunit and inter‐domain dependence to agonist binding (Mayer et al. 1989; Benveniste et al. 1990; Kew et al. 1996; Zheng et al. 2001) and define important new modulator binding sites (Karakas et al. 2011; Hansen et al. 2012; Hackos et al. 2016; Stroebel et al. 2016). The receptor complex undergoes a transition to fourfold symmetry approaching the ion channel pore, where linker regions connect the ligand binding domains to the highly conserved transmembrane domains (Karakas & Furukawa, 2014; Lee et al. 2014). This region includes the signature M3 gating motif (SYTANLAAF) as well as a critically positioned two‐turn cuff helix that lies parallel to the plasma membrane and is in van der Waals contact with the M3 transmembrane helix that occludes the pore in the closed state (Sobolevsky et al. 2009; Karakas et al. 2015; Tajima et al. 2016). Receptors composed of two identical GluN1 and two identical GluN2 subunits likely show equivalence in the rates of conformational change within subunit dimer pairs, while receptors with non‐identical GluN1 or GluN2 subunits (often referred to as triheteromeric receptors) will lack this symmetry (Lü et al. 2017).
Receptor activation
Within each subunit, conformational changes in the extracellular domains involve a closure of a bi‐lobed structure around glycine for GluN1 (Furukawa & Gouaux, 2003; Inanobe et al. 2005) and glutamate for GluN2 (Furukawa et al. 2005; Vance et al. 2011; Hansen et al. 2013). Several studies support the idea that NMDA receptors must bind two glutamate and two glycine molecules before they can open (Benveniste & Mayer, 1991; Clements & Westbrook, 1991). This is followed by at least two kinetically distinct conformational changes that precede extremely rapid opening of the ion channel (Banke & Traynelis, 2003; Schorge et al. 2005). The existence of these kinetically distinct conformations has been inferred from multiple components of the single channel current closed time distributions (Howe et al. 1991; Gibb & Colquhoun, 1992; Wyllie et al. 1998) as well as maximum likelihood fitting of recordings from a single active channel with kinetic models (Banke & Traynelis, 2003; Popescu et al. 2004; Auerbach & Zhou, 2005; Erreger et al. 2005; Schorge et al. 2005). The rates of these conformational changes logically must depend on the identity of the GluN1 and GluN2 subunits, and may reflect conformational changes within each subunit (Banke & Traynelis, 2003; Erreger et al. 2005) or concerted channel motions linking extracellular and transmembrane domains, such as a vertical movement of GluN1 pre‐M3 linker and the lateral separation of GluN2B pre‐M3 linker by 7 Å and 11 Å, respectively (Dai & Zhou, 2013; Tajima et al. 2016). These pre‐gating steps do not reflect the process of agonist‐induced closure of the bi‐lobed glutamate binding domain, as glutamate binding must occur on a sub‐millisecond time scale since responses to 1–4 ms application of a maximally effective concentration of glutamate produce a maximal response (Banke & Traynelis, 2003), indicating glutamate binding (including closure of the clamshell domain) is complete within a millisecond. Once the multimeric receptor has traversed these subunit‐dependent pre‐gating steps, channel opening likely occurs rapidly (with a rate too fast to measure) and involves dilatation of the gating ring by coordinated rearrangement of the M3 helical bundle crossing, which occludes the ion conducting pore in the resting state (Karakas et al. 2015; Tajima et al. 2016). A bend in the M3 helix within the SYTANLAAF motif just above the two‐turn pre‐M1 helix also may occur in response to tension produced by closure of the bi‐lobed agonist binding domain (Twomey & Sobolevsky, 2017; Twomey et al. 2017). Structural features of the receptor that control these functionally inferred pre‐gating conformational changes are currently unknown, but recent insights from disease‐causing mutations (Yuan et al. 2014; Chen et al. 2017; Ogden et al. 2017) are beginning to highlight specific regions of the protein as candidates for gating elements.
Triheteromeric NMDA receptors
There is a wealth of detailed functional studies of diheteromeric NMDA receptors that contain two identical GluN1 and two identical GluN2 subunits in the literature (Traynelis et al. 2010; Paoletti et al. 2013). However, several lines of evidence suggest that NMDA receptors often contain two different GluN2 subunits (Sheng et al. 1994; Chazot & Stephenson, 1997; Dunah et al. 1998; Rauner & Köhr, 2011; Delaney et al. 2013; Tovar et al. 2013). For example, the majority of synaptic NMDA receptors in the hippocampus contain one GluN2A and one GluN2B subunit (Rauner & Köhr, 2011; Tovar et al. 2013), and cerebellar Golgi cells, subthalamic nucleus and substantia nigra neurons express NMDA receptors with properties consistent with one GluN2B and one GluN2D subunit (Brickley et al. 2003; Jones & Gibb, 2005; Brothwell et al. 2008; Huang & Gibb, 2014; Swanger et al. 2015).
Recent advances in techniques to express receptors that contain two different GluN2 subunits in heterologous expression systems (Hatton & Paoletti, 2005; Hansen et al. 2014; Stroebel et al. 2014) reveal surprising properties for these triheteromeric receptors, such as substantial residual currents in saturating concentration of subunit‐selective allosteric antagonists, which cannot be explained by existing models of NMDA receptor function. Moreover, triheteromeric receptors have been shown to display kinetic activation and deactivation properties that are dominated by a single GluN2 subunit, with properties distinct from either diheteromeric receptor (Hansen et al. 2014; Sun et al. 2017). Finally, a large number of de novo GRIN1, GRIN2A and GRIN2B mutations exist in patients that are heterozygous for the affected allele (Yuan et al. 2015; Hu et al. 2016), increasing the likelihood that receptors will contain one wild type and one mutant NMDAR subunit. Thus, there is a need to develop models that explicitly identify individual receptor subunits in order to enable the evaluation of the mechanisms by which multimeric receptors with two different GluN1 or GluN2 subunits function, so that the synaptic and pharmacological properties of these receptors can be understood and exploited for therapeutic gain.
Mechanisms describing NMDA receptor activation
NMDA receptor activation mechanisms have been developed to describe both the slow rise and decay time course of synaptic currents (Lester & Jahr, 1992) as well as the greater complexities evident on analysing single channel data (Banke & Traynelis, 2003; Popescu et al. 2004; Auerbach & Zhou, 2005; Schorge et al. 2005). Here we have developed an approach to analyse the functional properties of receptors that explicitly represents each GluN1 and GluN2 subunit within a single diheteromeric tetrameric complex, which allows a logical progression to modelling receptors that contain two different GluN1 or GluN2 subunits, two different GluN1 splice variants or one copy of a disease‐associated de novo mutation. The approach relies on insight into structural elements provided by atomic level data as well as function‐altering mutations identified in human patients. The models derived from this insight represent transitions between conformational states that are compatible with existing structural data.
We use this approach to study single channel function of diheteromeric GluN1/GluN2A receptors, because they have been extensively studied at both macroscopic and single channel level (Wyllie et al. 1998, Popescu & Auerbach, 2003; Popescu et al. 2004; Auerbach & Zhou, 2005; Erreger & Traynelis, 2005, 2008; Erreger et al. 2005, 2007; Schorge et al. 2005; Wyllie et al. 2006; Kazi et al., 2013, 2014) and because GluN2A is a locus for disease‐associated human mutations (Endele et al. 2010; Lemke et al. 2013; Lesca et al. 2013). Our analyses confirm that our model can account for wild type GluN1/GluN2A receptor synaptic function.
Methods
Maintenance of HEK 293 cells
HEK 293 cells (ATCC CRL 1573, Rockville, MD, USA; hereafter HEK cells) were maintained in humidified 5% CO2 (at 37 °C) in Dulbecco's modified Eagle's medium with GlutaMax (Invitrogen, Carlsbad, CA, USA) supplemented with 10% dialysed fetal bovine serum, 10 μg ml−1 streptomycin, and 10 units ml−1 penicillin, as previously described (Yuan et al. 2009). Cells were trypsinized and plated onto glass coverslips (Warner Instruments, Hamden, CT, USA) coated with poly‐d‐lysine at 100 μg ml−1 for single channel and 5 μg ml−1 for whole‐cell recordings. Coverslips were transferred to 24‐well plates with 0.5 ml of supplemented media in each well.
Single channel recording and analysis
Cells were transfected using FuGENE 6 (Roche Diagnostics, Basel, Switzerland) with cDNA encoding green fluorescent protein (GFP), wild type GluN1‐1a (GenBank accession numbers U11418 and U08261; hereafter GluN1), and GluN2A (D13211) and GluN2B (U11419) at a ratio of 5:1:1 (GFP:GluN1:GluN2); total cDNA was 0.2 mg ml−1. All rat NMDA receptor subunit cDNAs were provided by Drs Heinemann (Salk Institute) and Nakanishi (Kyoto University). After transfection, the HEK cells were incubated for 12–24 h (timed to optimize observation of patches with a single active channel) in media supplemented with d,l‐2‐amino‐5‐phosphonovalerate (dl‐AP‐5) and 7‐chlorokynurenic acid (both at 200 μM) prior to patch clamp recordings.
Single channel recordings were made from excised outside‐out patches with an Axopatch 200B amplifier (Molecular Devices, Union City, CA, USA) at room temperature (23 °C) using thick‐wall glass pipettes (G150F‐4, Warner Instruments Inc., Hamden, CT, USA) coated with heat‐cured Sylgard (Dow Corning, Midland, MI, USA). Outside‐out patch recordings were chosen for these studies to reduce the occurrence of modal behaviour (Popescu & Auerbach, 2003) within the recording. Recording pipettes were fire‐polished to a final resistance of 8.5–11 ΜΩ. The holding potential was −80 mV. The internal (pipette) solution contained (in mM) 110 d‐gluconate, 110 CsOH, 30 CsCl, 5 HEPES, 4 NaCl, 0.5 CaCl2, 2 MgCl2, 5 BAPTA, 2 Na‐ATP, and 0.3 Na‐GTP (pH 7.35); the osmolality was adjusted to 300–310 mosmol kg−1 using CsCl or water. The external solution contained (in mM) 150 NaCl, 3 KCl, 10 HEPES, 30 d‐mannitol, 0.5 CaCl2, and 0.01 EDTA at pH 8.0. Recombinant GluN1/GluN2A channels in patches were activated by addition of 50 μM glycine and 1 mM glutamate to the external solution. The steady state response of channels was recorded during continuous perfusion of the agonist‐supplemented solution. Voltage‐clamp recordings were filtered at 8 kHz (−3 dB Bessel) and digitized at 40 kHz (pCLAMP 9). Current recordings were analysed off‐line following digital filtering at 4 kHz, and channel open and closed times determined from the idealization of the record by the time course fitting method using a step response function filtered at 4 kHz (SCAN software provided by Professor David Colquhoun, University College London, http://www.ucl.ac.uk/Pharmacology/dcpr95.html).
Before a patch recording was accepted for detailed analysis, the long‐term stability of the data record was checked for mode changes that could complicate model fitting (Blatz & Magleby, 1989; Colquhoun & Sigworth, 1995; Popescu & Auerbach, 2003) by making stability plots for amplitudes longer than 2.0 filter rise times, open times, closed times and open probability (P open) (Colquhoun & Sigworth, 1995). If the record was deemed stable, distributions of channel open times or closed times were fitted using the maximum likelihood method with probability density functions that were a sum of two exponential components for open times and five exponential components for closed times (Gibb & Colquhoun, 1992; Wyllie et al. 1998; Popescu et al. 2004; Erreger et al. 2005; Schorge et al. 2005; EKDIST, http://www.ucl.ac.uk/Pharmacology/dcpr95.html). Bursts of channel openings were defined using a critical closed time, t‐crit, which minimizes the number of long closed events that are misclassified as within rather than between bursts (Colquhoun & Sigworth, 1995). These analyses allowed selection of a set of low noise patches with stable and homogeneous properties. The number of channels in the patch was determined statistically as previously described (Colquhoun & Hawkes, 1990; Dravid et al. 2008). Only recordings with a low probability (P < 0.001) of containing more than one active channel were used for data analysis. The open and shut time properties for these four patches have been previously reported (Yuan et al. 2009).
Macroscopic current recording and analysis
All GluN2 cDNAs used for whole cell current recordings encoded a fusion protein containing the GluN2A C‐terminal domain fused to coiled‐coil C1 and C2 peptide tags followed by an endoplasmic reticulum (ER) retention signal fused in frame to the C‐terminal. This allowed control of the stoichiometry of GluN2 in surface receptors, as previously described (Hansen et al. 2014). The vector containing GluN1 also independently expressed GFP and was provided by Dr Kasper Hansen (University of Montana). HEK cells were maintained and plated onto glass coverslips coated with poly‐d‐lysine (5 μg ml−1) as described above and were transiently transfected using the calcium phosphate precipitation method with plasmid cDNAs encoding wild type GluN1/GluN2AC1/GluN2AC2, GluN1/GluN2BC1/GluN2BC2, or GluN1/GluN2AC1/GluN2BC2 as previously described (Chen & Okayama, 1987). NMDAR subunit cDNAs were co‐transfected with cDNAs at a ratio of 1.5:1:1:0.5 for GluN1:GluN2C1:GluN2C2:GFP (0.2 mg ml−1 total cDNA). dl‐AP‐5, 200 μM, and 7‐chlorokynurenic acid, 200 μM, were included in the culture media to prevent excessive NMDAR activation and to reduce excitotoxic cell death. Eighteen to 24 hours following transfection, coverslips containing HEK cells were transferred to a recording chamber and continuously perfused at 2 ml min−1 with the recording solution described above except with d‐mannitol reduced to 11 mM and pH adjusted to 7.4 by addition of NaOH. Microelectrodes were fabricated using thin‐walled filamented borosilicate glass (World Precision Instruments cat. no. TW150F‐4) pulled using a Flaming–Brown puller (Sutter Instrument P‐1000, Hitchin, Hertfordshire, UK) and filled with the same internal recording solution described above. Pipettes filled with internal solution had resistances of 3–4 MΩ when placed into the recording solution. The membrane potential of HEK cells was held at −40 mV using an Axopatch 200B patch‐clamp amplifier (Molecular Devices) and NMDAR current responses to brief (5 ms) or prolonged (1 s) rapid external application of glutamate (1 mM) and glycine (30 μM) were recorded at room temperature (23 °C), filtered at 8 kHz (−3 dB, 8 pole Bessel filter, Frequency Devices) and digitized at 20 kHz using a Digidata 1440A data acquisition system (Molecular Devices) controlled by Clampex 10.3 (Molecular Devices). Junction potential currents were used to confirm the duration of the brief application of agonist. The current response deactivation time course was fitted to the sum of one or two exponential functions using non‐linear least squares fitting in ChanneLab (Synaptosoft, Decatur, GA, USA).
To determine the macroscopic current time course, outside‐out patches were excised and placed in front of the rapid agonist application system, and responses recorded to application of 0.003 or 1 mM glutamate and 100 μM glycine. Recording solutions and pipettes were identical to those used to record single channels in outside‐out patches. At the end of the experiment, the patch was destroyed by applying pressure and the junction potential recorded by diluting the glutamate solution 25% to determine the duration of agonist application. Waveforms were averaged across patches and normalized to the peak response to maximally effective concentrations of glutamate and glycine.
Fitting of structure‐based mechanisms to the single channel data
Single channel openings were idealized by fitting a filtered step response function (4 kHz) to each instance of channel opening and closing to identify the correct interval and amplitude as described above. Conceptual models of channel function consisted of a set of rate constants representing the rates for transitions between hypothetical conformations proposed from structural information. Three different software implementations of the maximum likelihood fitting method with corrections for missed events due to recording bandwidth were used to evaluate the fit of different mechanisms to the idealized data: MIL (QuB software, http://www.qub.buffalo.edu, Qin et al. 1996, 1997), HJCFIT (Colquhoun & Hawkes, 1994, 1995) and a MATLAB (version R2016a, MathWorks, Natick, MA, USA) implementation of the approach of Hawkes et al. 1990; Jalali & Hawkes, 1992; Colquhoun & Hawkes, 1995; Colquhoun et al. 1996, 2003). All fitting algorithms gave virtually the same results, and thus the MATLAB code was used to estimate rate constants that would maximize the likelihood that the sequence of open and closed time durations in each data record can be described by a particular model (Colquhoun & Hawkes, 1995). The MATLAB code is available from https://github.com/ogdenkev/scfit and provides functions for reading idealized transitions from SCN files created by SCAN software and DWT files created by QuB software. The code also can load channel mechanisms from Excel files or from QMF model files created by QuB software.
Separate open and shut time resolutions (also called dead times) were imposed on the data prior to fitting. Only two states were allowed for fitting, namely open and closed. Hence sojourns were considered open if the amplitude was between −0.05 and −10 pA and shut if the amplitude was less than −0.05 pA (V m, −80 mV). The first dwell time was forced to be a resolved opening (i.e. longer than the open time resolution), and the last idealized dwell was forced to be a resolved closing. The equilibrium probabilities were calculated from the Q matrix and used as the starting state probabilities, except when fitting transitions within bursts of openings defined by a critical shut time. When bursts were used for fitting, the initial and final vectors of the likelihood account for the fact that the first opening preceded a shut time greater than the critical shut time and the last shut time was at least as long as the critical shut time (see eqns (5.8) and (5.11) of Colquhoun et al. 1996). The exact probability density function (p.d.f.) under the assumption of missing all events shorter than the open or shut time resolution was used to calculate the likelihood for dwells up to two multiples of the dead times. For dwells longer than two multiples of the dead time, the asymptotic approximation to the exact p.d.f. was used (Hawkes et al. 1992; Jalali & Hawkes, 1992). The likelihood for the entire series of idealized dwells was maximized using the `fminunc' function in MATLAB. Fitting was performed on the log‐transformed transition rates, which has the effect of transforming any constraints on the rates to be linear. Any constraints on the transition rates were then formulated into a linear combination of unconstrained variables using the QR factorization method (Golub & Van Loan, 1989; Qin et al. 1996).
Microscopic reversibility was enforced on the rate constants in the mechanism using the minimum spanning tree method of Colquhoun et al. (2004). Each mechanism was treated as an undirected graph with the states equivalent to nodes and the transitions between states equivalent to edges in the graph. Then a set of rates to constrain that would enforce microscopic reversibility were found by first finding a minimum spanning tree in the graph. This was accomplished in MATLAB using the graphminspantree function. Rates in the mechanism with physical or theoretical constraints were assigned a weight in the undirected graph to ensure they would be included in the minimum spanning tree, if possible. Once the minimum spanning tree was found, graph edges not part of the minimum spanning tree were selected to be constrained. Edges corresponded to transitions between states in the gating mechanism, and because each transition is reversible there are two rates associated with each edge. Therefore, given an edge not in the minimum spanning tree, there were two choices for which rate to constrain, and one of the rates was arbitrarily selected.
For each rate selected to be constrained so that the mechanism obeys microscopic reversibility, one of the cycles in the mechanism that contained the rate was found by determining the shortest path between the pair of states connected by the rate's corresponding transition. This was done using the graphshortestpath function in MATLAB. This cycle was used to set the constraint.
After constraining rates to enforce microscopic reversibility, physical or theoretical constraints were added. All constrained rates were transformed to be linear combinations of the free rates (Colquhoun et al. 2004). Rate constants representing equivalent subunit conformational changes were constrained to be equal, hence reducing the number of free parameters to be estimated, while retaining the principle of describing the rates of subunit‐specific protein conformational changes. Fitting was further simplified by assuming that, at the concentrations of glutamate (1 mM) and glycine (50 μM) used for these experiments, all subunits are agonist‐bound during the recording.
Fitting of structure‐based mechanisms to the macroscopic current responses
We also evaluated the compatibility of gating models with optimized rate constants from maximum likelihood fitting with macroscopic and synaptic current time course. We used SCALCS (http://www.ucl.ac.uk/Pharmacology/dcpr95.html) and Channelab to generate macroscopic waveforms by assuming glutamate binding and unbinding can only occur from GluN2 subunits that have not undergone a pre‐gating step. We also added desensitized states only from receptors where both subunits within a dimer had undergone pre‐gating steps (Sun et al. 2002; Furukawa et al. 2005). A model that included agonist binding was subsequently fitted simultaneously to two average macroscopic response waveforms recorded at different agonist concentrations in excised outside‐out patches under the same conditions as the single channels (e.g. pH 8.0, 0.5 mM Ca2+) as previously described by Erreger et al. (2005) using a non‐linear least squares algorithm (Channelab). We fixed the gating rates in the model to those determined from single channel maximum likelihood fitting described above and allowed the agonist association and dissociation rates in addition to rates governing entry into and exit from the desensitized states to vary (Erreger et al. 2005). We subsequently performed a sensitivity analysis by determining the sum of squares for normalized waveforms simulated with the agonist binding and desensitization rates varied over a range that encompassed the fitted values (see Appendix).
Homology modelling and molecular dynamics simulations
A human GluN1/GluN2B dihetero‐tetrameric glutamate‐ and glycine‐bound receptor homology model was generated from two GluN1/GluN2B crystal/cryo‐electron microscopy structures (PDBid: 4PE5 and 5FXH; Karakas & Furukawa, 2014; Tajima et al. 2016). The alignment of the target and template sequences was performed in MUSCLE (Edgar, 2004). Five homology models were generated using Modeller 9v14 (Sali & Blundel, 1993) and subjected to quality analysis using the PDBsum generator (Laskowski, 2009). For the generation of these models, ifenprodil was excluded from being incorporated and the pocket was relaxed during a final, short molecular dynamics stage in the Modeller script as well as during the equilibration molecular dynamics run. The top scoring model had an overall G‐factor of −0.14 indicative of a high quality model, and was prepared for further analysis within Maestro using the OPLS3 force field (Schrödinger Release 2017‐1; Protein Preparation Wizard; Epik version 3.7; Impact version 7.2; Prime version 4.5, Schrödinger, LLC, New York, NY, 2017). Hydrogen bond assignments were performed followed by subsequent optimized and visual inspection. All titratable residues were assigned their dominant protonation state at pH 7.0. An energy minimization was performed on the receptor to relieve unfavourable constraints.
The molecular dynamics equilibration and production run of the system was performed using Desmond (Desmond Molecular Dynamics System, D. E. Shaw Research, New York, NY, 2017). The optimized receptor was inserted into an equilibrated palmitoyl oleoyl phosphatidyl choline (POPC) bilayer. The system was neutralized by adding 60 sodium atoms, with the salt concentration set to 150 mM (NaCl). The system consisted of 3187 amino acids, 467 lipid molecules, 82,053 waters (Simple Point Charge (SPC)) and 516 salt atoms totalling ∼360,000 atoms with a box size of 6,529,931 Å3. The system was relaxed using the Desmond relaxation protocol. The equilibration run was followed by a 100 ns production run performed under constant Number, Pressure and Temperature (NPT) conditions using the Berendsen thermostat (310 K and 1.103 bar) and Particle Mesh Ewald (PME) electrostatics with a cutoff of 9 Å. Time step calculations were performed every 2 fs (Δt). Analysis of the molecular dynamics trajectory was performed in Desmond and Visual Molecular Dynamics (VMD) (Humphrey et al. 1996). The dynamic cross‐correlation of the pre‐M1 helices and protein were calculated using MD‐Task (Brown et al. 2017). All‐cross correlations are defined by
where n = t/Δt, N = number of steps (100 ns/Δt), t is the simulation time, Δt is the correlation interval, is the position of the alpha carbon residue i at step n and Cij is the correlation between i and j.
Thus a Cij of 1 is perfect concerted movement and a Cij of −1 is perfect mirroring between residues i and j at the given time interval. Since the transmembrane domains (TMD) of adjacent subunits are positioned approximately 90° about the y‐axis from one another, coordinates for all four subunits throughout all frames of the simulation were rotated such that they aligned with one another in the same quadrant. This was done to avoid missing potentially correlated motions as their cross‐correlations and covariances would be calculated as zero due to orthogonality (Hünenberger et al. 1995). Heatmaps that illustrate completely random, uncorrelated motion of the pre‐M1 helices were generated by shuffling the sequence of coordinates for each residue in the MD trajectory by frame using the Python function ‘random.shuffle()’. Each residue's coordinates were shuffled independently from those of the other residues.
Statistics
Data are expressed as means ± SEM and analysed using a one‐way ANOVA with Tukey's post hoc test. Significance for all tests was set at P < 0.05 and the number of observations was selected to give a power > 0.95 for a minimum detectable difference of 25% for rise time and 50% for exponential time constants (tau). Evaluation of multiple distinct parameters from the same waveform were corrected for familywise error using Holm's method of sequential adjustments. A sensitivity analysis was performed to investigate the shape of the likelihood surface around the optimum values of the rate constants estimated from single channel fitting. Statistical comparisons between models was made using a likelihood ratio test (Horn, 1987; Colquhoun & Sigworth, 1995).
Results
Recordings of GluN1/GluN2A single channel activity
We evaluated the properties of unitary currents in outside‐out patch clamp recordings of single rat GluN1/GluN2A receptors expressed in HEK cells. We selected a set of four outside‐out patch single channel recordings with low baseline noise that each contained one active channel for analysis. Channels were activated by saturating concentrations of glutamate (1 mM) and glycine (50 μM). We idealized these recordings at a resolution of 50 μs for open and closed times to obtain a sequence of 121,125 lifetimes as the receptor alternates between open and closed conformations of the pore (Fig. 1 A). We analysed recordings of individual channel openings, which were stable in duration (Fig. 1 B) and amplitude throughout the full experiment (Fig. 1 C). Analysis of the duration of open and closed lifetimes (Fig. 1 D and E) reveals the complex kinetic pattern of activity characteristic of NMDA receptor activation, as previously described in many different preparations (Jahr & Stevens, 1987; Cull‐Candy & Usowicz, 1989; Howe et al. 1991; Gibb & Colquhoun, 1992; Wyllie et al. 1998; Banke & Traynelis, 2003; Popescu & Auerbach, 2003; Auerbach & Zhou, 2005; Erreger et al. 2005; Erreger & Traynelis, 2008; Yuan et al. 2009). Table 1 summarizes the properties of these patches.
Figure 1. Single channel properties of GluN1/GluN2A diheteromeric NMDA receptor currents.
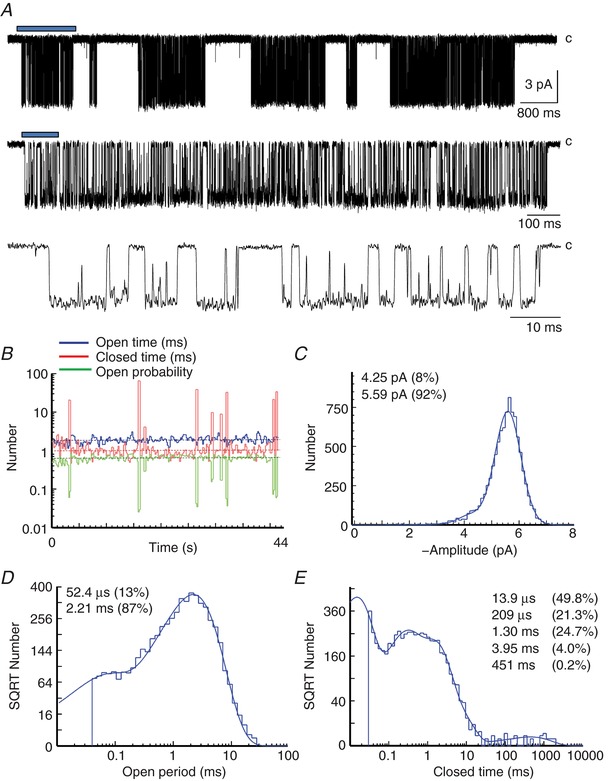
A, a representative recording illustrates the complex pattern of channel openings and closings observed when GluN1/GluN2A receptors are activated by high agonist concentration (1 mM glutamate, 50 μM glycine; membrane potential −80 mV). The record was filtered at 4 kHz for display. B, each bin in the kinetic stability plot shows a running average of 50 intervals (total 18,311 events) with increments of 25 intervals between averages. Horizontal dashed lines represent overall mean values for the whole data record (duration 44 s). Mean shut time was 2.95 ms, mean open time was 2.10 ms, and P open was 0.416 for this patch. Resolution for openings and closings was 40 μs. C, the distribution of channel amplitudes was determined from time course fitting. The maximum likelihood fit of two Gaussian components (standard deviation 0.47 pA) is superimposed as a probability density function; mean amplitude and relative area are inset. D, distributions of channel open times were fitted with a mixture of two exponential components. E, distribution of channel closed times was fitted with a mixture of five exponential components.
Table 1.
Properties of GluN1/GluN2A activated with 1 mM glutamate and 50 μM glycine
| Baseline r.m.s. noise | 0.27 ± 0.04 pA | |
| Single channel current | 5.41 ± 0.05 pA | |
| Mean open time | 1.7 ± 0.2 ms | |
| Open probability | 0.39 ± 0.06 | |
| Open tauFAST | 0.13 ± 0.06 ms | 10 ± 2% |
| Open tauSLOW | 1.8 ± 0.2 ms | 90 ± 2% |
| Closed tau1 | 22 ± 4 μs | 32 ± 2% |
| Closed tau2 | 0.22 ± 0.04 ms | 24 ± 4% |
| Closed tau3 | 1.03 ± 0.09 ms | 35 ± 3% |
| Closed tau4 | 3.3 ± 0.4 ms | 9 ± 2% |
| Closed tau5 | 1000 ± 400 ms | 0.21 ± 0.04% |
| Chord conductance | 53 ± 2 pS | 8 ± 2% |
| Chord conductance | 69.3 ± 0.3 pS | 92 ± 2% |
Data are means ± SEM from 4 patches. For fitted histograms, the relative area of the individual components are given as % (right hand column). Significant figures presented were determined by the first digit of the SEM (see https://arxiv.org/ftp/arxiv/papers/1301/1301.1034.pdf). r.m.s., root mean square.
More than 90% of channel openings appeared to arise from a single conductance level, with a smaller sublevel accounting for 8% of openings. Open time histograms for all conductance levels were best described by the sum of two exponential functions, suggesting at least two energetically distinct open channel conformations (Fig. 1 D). For GuN2A receptors, more than 99% of closed periods were less than ∼30 ms duration. At the high agonist concentrations used in this study, the occasional long‐lived closed periods (∼1 s duration), represented by closed tau5 (Table 1) are much too long to represent agonist unbinding and re‐binding and so we interpret these as likely reflecting desensitized receptor conformation(s) (Fig. 1 E). In order to define bursts of openings, excluding the long desensitized periods, the closed time distribution exponential parameters were used to calculate the value of t‐crit (mean, 37 ± 4.8 ms). At saturating agonist concentration, closed times within bursts would also include occasions when an agonist unbinds and rebinds. However, because glutamate and glycine are high affinity agonists at the NMDA receptor, the expected frequency of agonist unbinding and re‐binding events was low (∼16 s−1) for the mechanisms analysed in this study, compared to the observed average of 352 channel closings per second of burst time. Thus, these closed times within bursts mainly contain information about pre‐gating receptor conformations that must be traversed en route to channel opening (Banke & Traynelis, 2003; Schorge et al. 2005; Erreger et al. 2005; Yuan et al. 2009). In order to fit the data with mechanisms that do not include any desensitized states, we used a t‐crit of 35 ms to identify bursts of openings, where within each burst, all openings are separated by closed periods shorter than t‐crit.
Subunit‐dependent gating mechanism for tetrameric receptors
We first set out to use this high‐quality dataset to develop a model of the mechanism underlying GluN1/GluN2A NMDA receptor activation that would reflect structural features of receptor function. Our goal was to relate the activation steps that follow ligand binding to conformational changes in individual subunits that would allow subsequent analysis of receptors with non‐identical GluN1 or GluN2 subunits. We therefore focused on modelling the resolvable, kinetically distinct conformations (out of many that must exist) necessary to describe the behaviour of a fully liganded receptor prior to agonist‐induced channel opening. Because the receptor is a tetrameric protein containing two GluN1 and two GluN2 subunits, we describe a mechanism that allows a pre‐gating conformational change that is influenced by each of the four subunits to occur in any order. Each of the receptor protein conformational changes inferred from the data record could reside entirely within a single subunit, or reflect unique interactions between subunits (Ogden et al. 2017; Chen et al. 2017). We envision these pre‐gating changes to involve one or more of the short linker segments connecting the bi‐lobed agonist binding domains to the transmembrane elements, as perturbations in the linkers can perturb receptor function (Talukder & Wollmuth, 2011; Kazi et al. 2013, 2014; Ogden et al. 2017) while recognizing that, in principle, changes in any part of the protein structure may affect function. Because the linkers exist at the interface between two‐ and fourfold symmetry, we speculate these movements are likely distinct for GluN1 and GluN2 subunits as suggested by comparison with the analogous AMPA receptor GluA2 structure (Twomey et al. 2017).
Figure 2 illustrates this mechanism, which conceptualizes some of the key steps in the response of a synaptic receptor to glutamate release that we seek to evaluate. For simplicity we hypothesize that following agonist binding, each subunit undergoes some as yet unknown conformational change (that will also involve residues of adjacent subunits) in a key gating region, represented in the diagram in Fig. 2 A and B as a change in the position of a spring connecting the ligand binding domain to the channel. When this change has occurred in some subset of the four agonist‐bound subunits that comprise the tetrameric receptor, the probability that the pore will rapidly dilate to allow current flow is greatly increased. Figure 2 C shows one hypothetical example of this in which opening occurs when all four subunits undergo this pre‐gating step. However, a single open state is not sufficient to account for the data. Two different open states are needed to account for the consistent presence of two exponential components in distributions of single channel open times in our data set (Fig. 1 D) and across many GluN2A receptor studies (Qin et al. 1996; Wyllie et al. 1998; Popescu et al. 2004; Erreger et al. 2005; Schorge et al. 2005; Auerbach & Zhou, 2005). The model in Fig. 2 contains nine channel closed states, which are sufficient to reflect the most complex closed time histograms described in the literature reporting five or six distinguishable exponential components (Fig. 1 E) (Wyllie et al. 1998, 2006; Popescu et al. 2004; Erreger et al. 2005; Auerbach & Zhou, 2005; Yuan et al. 2009). Imposition of constraints based on the symmetry of the tetramer, the assumption that the rate of a conformational change in a subunit is constant regardless of changes in other subunits (see also dimer model below) and enforcement of microscopic reversibility together reduce the number of free parameters considerably.
Figure 2. A model of subunit‐dependent conformational changes for a tetrameric diheteromeric receptor.

A, space‐fill of the GluN1/GluN2B receptor is shown (Karakas & Furukawa, 2014; Lee et al. 2014) with the ligand binding domain and pore shown as a diagrammatic representation of the tetrameric assembly of subunits. B, illustration of steps within each subunit hypothesized to precede opening of the pore. These include the binding of agonist to the bi‐lobed agonist binding domain that involves domain closure (left) and a conformational change in a linker between the agonist binding domain and the transmembrane domain that is distinct from domain closure (right). C, a mechanism is shown that treats each subunit as independently able to undergo a pre‐gating conformational change once the ligand binding sites are occupied. This allows subunits to participate in a pre‐gating conformational change in any order, and when all four subunits have undergone this change, the probability that the ion channel rapidly opens in an all‐or‐none fashion is greatly increased. Ligand binding steps are not represented in this mechanism.
Pre‐M1 helix controls the rate of channel activation after agonist binding
We and others have previously evaluated the functional effects on channel properties of disease‐associated de novo mutations located in or near the pre‐M1 helix (e.g. Alsaloum et al. 2016; Ogden et al. 2017). This two‐turn cuff helix lies parallel to the outer leaf of the plasma membrane and is in van der Waals contact with the M3 transmembrane helix of the same subunit, which is thought to form the channel gate (Sobolevsky et al. 2009; Karakas & Furukawa, 2014, Lee et al. 2014; Twomey & Sobolevsky, 2017). In addition, the GluN2 pre‐M1 helix is in close proximity to conserved residues in the pre‐M4 linker shown to critically control gating (Talukder et al. 2010; Yuan et al. 2014; Amin et al. 2017; Chen et al. 2017). We have proposed that this trio of interactions (GluN1‐pre‐M1/GluN1‐M3/GluN2‐pre‐M4 and the GluN2‐pre‐M1/GluN2‐M3/GluN1‐pre‐M4) are involved in the stabilization of the closed state, for which a helical bundle crossing of all four M3 helices occludes ion permeation (Ogden et al. 2017; Chen et al. 2017). We further hypothesize that conformational changes in pre‐M1/M3/M4 interactions in at least a subset of subunits is a prerequisite to the rapid, coordinated movement of the M3 helices that results in an almost instantaneous opening of the channel, giving the unitary current flowing through one channel its square step‐like appearance. We suggest that these two unique gating triads present in each GluN1/GluN2 dimer each undergo the required pre‐gating conformational changes at distinguishable rates, and thus are candidates for the physical basis of pre‐gating steps evident in shut time histograms from agonist‐bound receptors (Banke & Traynelis, 2003; Popescu & Auerbach, 2003; Schorge et al. 2005; Erreger et al. 2005). A role for the M3 helices generating channel opening is consistent with the large number of disease‐associated variants located in these regions that affect channel open probability (e.g. Yuan et al. 2014; Ogden et al. 2017; Chen et al. 2017).
The de novo disease‐associated mutation P552R in the pre‐M1 GluN2A (but not GluN1 pre‐M1) alters NMDA current rise time in response to rapid glutamate application in a manner dependent on the number of mutant GluN2A subunits present in the receptor (Ogden et al. 2017). This suggests that each subunit may independently undergo a distinct conformational change that precedes gating (Fig. 2). To explore this point further, we expressed GluN1/GluN2A receptors that contained 0, 1 or 2 copies of GluN2A‐P552R. To determine if this was a general phenomenon, we also expressed GluN1/GluN2B with 0, 1 or 2 copies of the analogous mutation (P553R). After applying glutamate to each cell for a brief duration (5 ms), we rapidly moved each cell to a glutamate‐free solution to evaluate the current response rise time in the absence of glutamate. We reasoned that under this protocol the rate of rise of the current response (estimated by least‐squares fit to the currents as a function of time) must reflect conformational changes after agonist binding and prior to channel opening, since glutamate was removed from the extracellular solution after a few milliseconds, well before the receptor had fully activated. We found that receptors with 0 or 1 copy of GluN2A‐P552R or GluN2B‐P553R can become activated at rates similar to wild type receptors, as there was no detectable difference between the 10–90% current response rise times (Table 2). However, receptors with two copies of GluN2A‐P552R or two copies of GluN2B‐P553R respond over an order of magnitude more slowly, with the response continuing to rise long after glutamate had been removed by the rapid perfusion system (Fig. 3 A and B). The lack of effect on activation rate of one mutated GluN2 subunit in the tetrameric receptor complex supports the idea that NMDA receptor open states can be reached when either one or both GluN2 subunits have undergone some conformational change. The ability of a channel to open at the same rate as wild type even with one impaired GluN2 subunit suggests that the receptor may reach an open state independent of the conformation of the second, mutant GluN2 subunit.
Table 2.
Di‐ and triheteromeric NMDA receptor macroscopic response properties
| Rise time (ms) | tau1 (ms) | tau2 (ms) | % tau1 | Weighted tau (ms) | n | |
|---|---|---|---|---|---|---|
| 2A/2A | 8.3 ± 0.5 | 33 ± 3.0 | 147 ± 28 | 88 ± 3.5 | 41 ± 3.7 | 12 |
| 2A‐P552R/2A | 9.5 ± 1.0 | 67 ± 16 | 367 ± 38 | 49 ± 8.1 | 260 ± 39 | 9 |
| 2A‐P552R/2A‐P552R | 230 ± 14*† | 1200 ± 140 | 4040 ± 655 | 77 ± 19 | 1900 ± 180*† | 8 |
| 2B/2B | 15 ± 1.0 | 210 ± 16 | 744 ± 31 | 46 ± 13 | 496 ± 25 | 16 |
| 2B‐P553R/2B | 43 ± 3.2 | 310 ± 29 | 3990 ± 255 | 37 ± 4.0 | 2600 ± 140* | 8 |
| 2B‐P553R/2B‐P553R | 960 ± 83*† | 5780 ± 300 | — | 100 ± 0 | 5780 ± 300*† | 8 |
| 2A/2B | 8.0 ± 0.3 | 64 ± 6.6 | 425 ± 101 | 91 ± 2.0 | 78 ± 5.7 | 14 |
| 2A‐P552R/2B | 12 ± 1.0 | 440 ± 76 | 1790 ± 394 | 84 ± 8.7 | 540 ± 58* | 9 |
| 2A‐P552R/2B‐P553R | 330 ± 21*† | 1900 ± 130 | — | 100 ± 0 | 1900 ± 130*† | 9 |
NMDARs were expressed in HEK cells, and whole cell current recordings made under voltage clamp in response to the rapid application of glutamate for 5 ms (see Methods). Means ± SEM are shown for all parameters to two significant figures where 'n' is the number of observations. The weighted tau was determined from the fitted tau values from two exponential functions, with the exception of 2B‐P553R/2B‐P553R and 2A‐P552R/2B‐P553R, which deactivated with a time course described by only one exponential. * P < 0.001 compared to wild type, one‐way ANOVA, Tukey post hoc, multiple comparisons, † P < 0.001 compared to single‐copy mutants, one‐way ANOVA, Tukey post hoc, multiple comparisons. F values for rise time for 2A/2A, 2B/2B and 2A/2B were F 2,26 = 347, F 2,29 = 198 and F 2,30 = 295, respectively. F values for weighted tau for 2A/2A, 2B/2B and 2A/2B were F 2,26 = 118, F 2,29 = 235 and F 2,30 = 161, respectively. The sequential approach of Holm was used to correct familywise error.
Figure 3. Representative current responses following brief (5 ms, black arrow) application of glutamate (1000 μM) plus glycine (30 μM) onto cells bathed in glycine.
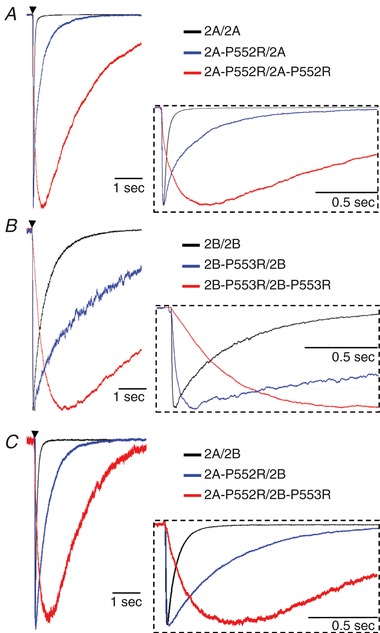
GluN1/GluN2A receptors (A) and GluN1/GluN2B receptors (B) containing zero (black), one (blue), or two (red) mutated GluN2 subunits. A single copy of the mutation slows deactivation by 6‐fold for GluN1/GluN2A and 5‐fold for GluN1/GluN2B. Two copies of the mutation slows deactivation by 46‐fold for GluN1/GluN2A and 11‐fold for GluN1/GluN2B. C, representative traces following the application of glutamate (1000 μM) plus glycine (30 μM) for 5 ms (black arrow) onto cells bathed in glycine (30 μM) and expressing GluN1/GluN2A/GluN2B (black), GluN1/GluN2A‐P552R/GluN2B (blue), or GluN1/GluN2A‐P552R/GluN2B‐P553R (red). GluN1/GluN2A‐P552R/GluN2B and GluN1/GluN2A‐P552R/GluN2B‐P553R slow deactivation by 7‐fold and 24‐fold, respectively. For all panels, the inset shows that a single copy of the mutation does not alter the response rise time, but two copies of the mutation slows the rise time.
Triheteromeric receptors may open after a single GluN2 subunit has undergone pre‐gating
A large number of NMDARs in the central nervous system contain two different GluN2 subunits, including hippocampal synaptic receptors that contain GluN1/GluN2A/GluN2B (Rauner & Köhr, 2011; Tovar et al. 2013). To evaluate whether these triheteromeric receptors can activate normally when one GluN2 subunit contains a function impairing pre‐M1 Pro–Arg substitution, we co‐expressed GluN1/GluN2A/GluN2B triheteromeric receptors with an engineered C‐terminal that allowed for control over the stoichiometry of cell surface receptors (Hansen et al. 2014). We introduced a single copy of GluN2A‐P552R (Ogden et al. 2017) into the triheteromeric receptor complex and assessed the response time course (Fig. 3 C). We used the GluN2B‐selective inhibitor ifenprodil (Hansen et al. 2014) in control experiments to ensure that the currents we recorded reflected triheteromeric receptors. For cells transfected with GluN1/GluN2AC1‐P552R/GluN2BC2, if appreciable GluN2BC2 escaped the ER and formed diheteromeric GluN1/GluN2BC2 receptors that reached the surface, then the observed peak current will be higher than that of the triheteromeric receptor alone.
The GluN2B selective inhibitor ifenprodil at 3 μM should reduce the peak current of diheteromeric GluN1/GluN2BC2 receptors by ∼90%, while reducing the triheteromeric peak current by ∼30%. We observed only partial block (38%) of the current amplitude of responses from GluN1/GluN2AC1/GluN2BC2 transfected cells, consistent with the previously reported effects of ifenprodil on GluN2A/GluN2B triheteromeric receptors (Hatton & Paoletti, 2005; Hansen et al. 2014). Additionally, when applied to GluN2AC1‐P552R/GluN2BC2 and GluN2AC1‐P552R/GluN2BC2‐P553R triheteromeric receptors, 3 μM ifenprodil reduced peak current by 58 ± 5.5% (n = 9) and 43 ± 6.1% (n = 9), respectively. The effects of ifenprodil on current responses from cells transfected with GluN1, GluN2AC1‐P552R and GluN2BC2 suggest that contributions to macroscopic current by diheteromeric GluN1/GluN2BC2 receptors that escaped ER retention are minimal.
As observed with diheteromeric receptors (Fig. 3 A and B), introduction of a single copy of GluN2A‐P552R mutation in pre‐M1 did not markedly slow the current response rise time of triheteromeric GluN1/GluN2A‐P552R/GluN2B receptors to brief (5 ms) application of glutamate (Fig. 3 C; Table 2), suggesting a triheteromeric GluN2A/GluN2B receptor can open when a single wild type GluN2B subunit has undergone pre‐gating. By contrast, triheteromeric receptors where both GluN2 subunits carry the mutation, 2A‐P552R/2B‐P553R activate approximately 30‐fold more slowly (Table 2). Because the functional effect of the GluN2 proline mutation is conserved between 2A and 2B and across the 2A/2B triheteromer, this result strongly supports the conclusion that the pre‐M1 region of GluN2A and 2B subunits is an important determinant of the rate of receptor activation.
Pre‐M1 helices move independently between subunits in molecular dynamics simulations
An assumption of the tetrameric models is that the pre‐gating steps can occur independently in different subunits. While the flexible nature of the pre‐M1 and pre‐M4 linkers is consistent with this idea, the close association of these two elements with the SYTANLAAF region of the M3 helices, which themselves are in close association with the M3 regions on other subunits, raises the possibility that the movement of the pre‐gating linker regions are correlated between subunits, and not fully independent. To test this idea, we ran a 1000 ns molecular dynamics simulation on a full‐length solvated GluN1/GluN2B dimeric receptor embedded in a lipid bilayer (Fig. 4 A and B). We chose GluN1/GluN2B for molecular dynamics simulations because a crystallographic dataset exists for this receptor (see Methods), and because of data (see Fig. 3) showing similar dependence of GluN1/GluN2A and GluN1/GluN2B macroscopic rise time on the number of mutant GluN2 subunits in the complex. The structures used as our starting points were crystallized in the presence of glutamate, glycine and ifenprodil (Karakas & Furukawa, 2014) and so are in an ‘active but inhibited’ conformation. Ifenprodil was excluded from the generation of the glutamate‐ and glycine‐bound model that we ran molecular dynamics on (Tajima et al. 2016). Therefore, we hypothesize that in this structure, pre‐gating motions are possible. We evaluated the cross‐correlation of the pre‐M1 helix of GluN1 and GluN2B at 100, 500, 1000, 5000 and 10,000 ps intervals.
Figure 4. Simulated movement of pre‐M1 helices is not strongly correlated across subunits.
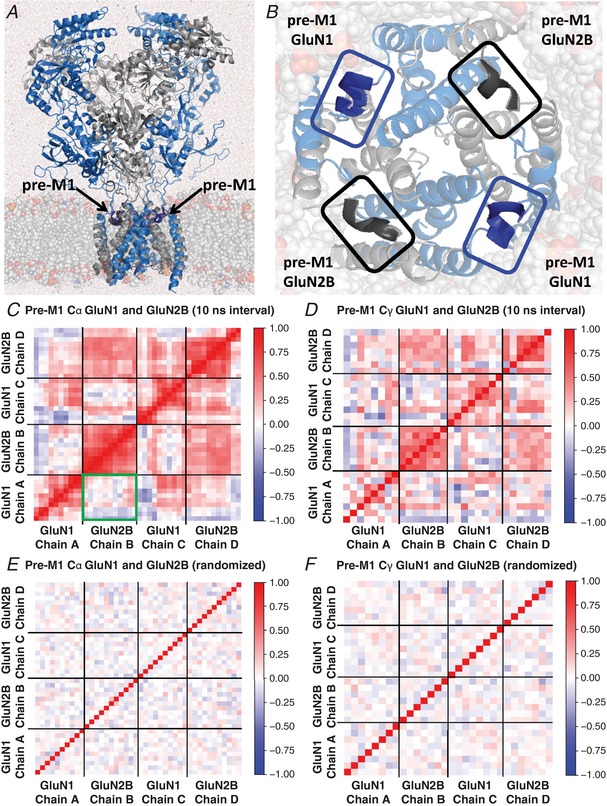
A, the hydrated GluN1/GluN2B (blue/grey) receptor was embedded in a lipid bilayer. B, the pre‐M1 linker regions are expanded with the transmembrane region and the membrane (translucent). C, heatmap of the dynamic cross‐correlation between the Cα atoms from each of 10 residues in the pre‐M1 of GluN1 (residues 551–560) and 11 residues in the pre‐M1 of GluN2B (residues 547–557) for chains A–D (chains labelled clockwise from top left) was determined from the first 500 ns of a 1 μs molecular dynamics run; identical results were obtained when analysing the full run (not shown). The section in the green box highlights a lack of correlation between pre‐M1 helices of adjacent subunits. D, the cross‐correlation of the Cγ atoms for 8 residues from the pre‐M1 of GluN1 and 7 residues from the pre‐M1 of GluN2B for chains A–D is shown. The red boxes forming a diagonal line indicate a perfect correlation of either the Cα or Cγ atoms of the pre‐M1 for both the GluN1 and the GluN2B chains to themselves. Only weak inverse correlation is observed with the correlation coefficient r ranging between 0 and 0.57; weak inverse correlations for subunits on opposite sides of the receptor are shown as red due to the rotation of the subunits to overcome orthogonality to the adjacent chains as described in the Methods. The cross‐correlation measurements shown at time intervals of 10 ns throughout the 500 ns simulation were consistent with those in the other time intervals. E and F, heatmaps were generated by shuffling the frames from the molecular dynamics trajectories shown in C and D to depict the absence of correlation that would be observed for completely random motion of the helices using 10 ns intervals for each Cα and Cγ, respectively. Cross correlations were determined as described in the Methods.
The analysis was conducted with respect to a trajectory aligned on the four M3 helices of diheteromeric GluN1/GluN2B. This alignment ensures that the correlations measured reflect movement of the residues in the pre‐M1 helix and eliminated noise introduced by rigid body motion of the receptor as well as local domain shifting when correlations are calculated based on the full receptor. Red pixels in the correlation maps in Fig. 4 C and D signify concerted movement in the same direction of Cα atoms (Fig. 4 C) and Cγ atoms (Fig. 4 D) of amino acid residues 551–560 from GluN1 (LDSFMQPFQS) and 547–556 of GluN2B (PSAFLEPFSA) while the blue regions represent fluctuations, which are negatively correlated for subunits when geometrically superimposed. The heatmaps show the lack of correlation of movement of the Cα and Cγ atoms of the pre‐M1 helices (Fig. 4 C–F). At steps of up to 10 ns we found only weak inverse correlation of the pre‐M1 regions, consistent with the assumption of independence of these linker regions (Fig. 4 C). Although, in principle, the subunits of a multi‐subunit protein are never entirely independent, these analyses suggest GluN2 pre‐M1 helices move independently in closed channels, supporting representation of these steps as independent in our gating scheme.
Explicit subunit pre‐gating steps can describe GluN1/GluN2 single channels
We subsequently developed an explicit activation mechanism, illustrated in Fig. 5, for a receptor that contains two identical GluN1 and two identical GluN2 subunits, with two open states. Based on this mechanism, each agonist‐bound subunit of the receptor can independently undergo a pre‐gating conformational change, perhaps in the pre‐M1 helix (indicated by open or filled symbols) in the GluN1 subunits (rates k +f and k −f) or GluN2 subunits (rates k +s and k −s) in any order (Fig. 5 A). The two open states can interconvert (rate constants k 12 and k 21), and are reached by distinct opening rates, β1 and β2 (α1 and α2 are distinct closing rates). The model is constructed assuming the glycine and glutamate binding sites on the GluN1 and GluN2 subunits, respectively, are occupied at high concentrations of glycine (50 μM, > 35 × EC50) and glutamate (1 mM, ∼300 × EC50) relative to their EC50 values. We assumed that there is no cooperativity in these conformational changes nor in the dimer‐dependent desensitization rates, such that subunit transition rates are constant regardless of the conformational state of the other three subunits or whether changes occur within the partner dimer. Consideration of results with one mutant and one wild type GluN2 subunit (Fig. 3) led to the hypothesized open state connectivity where channel opening may occur when both GluN1 subunits and either one (or both) of the GluN2 subunits has undergone pre‐gating.
Figure 5. Fitting a tetrameric NMDAR model to single channel GluN1/GluN2A data.
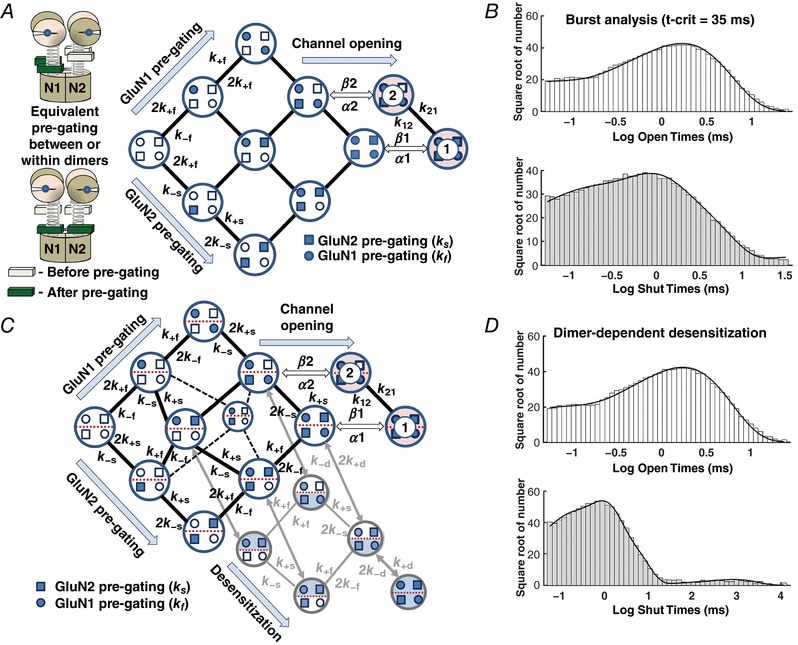
A, pre‐gating conformational changes within each subunit are explicitly shown for all four subunits. Rate constants subscripted ‘f’ refer to GluN1 subunit‐dependent transitions and ‘s’ refer to GluN2 subunit transitions. Greek letters β and α refer to channel opening and closing rates, respectively, while the transition rates between open states 1 and 2 are denoted k 12 and k 21. For clarity, not all rate constants are shown. Inset cartoon illustrates the fourfold symmetry of the transmembrane region and no interaction between subunits within or between dimers at the level of the pre‐gating conformational change. B, the best fit of this mechanism to all data simultaneously (including correction for limited recording bandwidth; see Methods) produces predicted open and closed time distributions that closely match those recorded, as shown by the superposition of predicted and measured closed and open time distributions. C, a mechanism that explicitly considers the pre‐gating transitions within subunit dimers (delineated by dashed red lines) and dimer‐dependent desensitization (with rate constants k +d and k ‐d). Desensitization may occur whenever both subunits in a dimer have undergone pre‐gating transitions. Note that for a receptor where one GluN1 and one GluN2 subunit have undergone pre‐gating transitions, either the subunits are in the same dimer, or they are in separate dimers. D, the best fit of this mechanism to all data (without use of t‐crit) produces open and closed time distributions that closely match those recorded, as shown by the superposition of predicted and measured closed and open durations shown as histograms.
The data shown above (Fig. 3) for the human de novo mutation GluN2A‐P552R and the analogous mutation GluN2B‐P553R suggest a possible explanation as to why a receptor with two mutant GluN2A subunits opens ∼30‐fold more slowly than wild type receptors, while a receptor with a single mutant subunit can open at a rate comparable to wild type receptors. Receptors engineered to contain only one of these mutant subunits activated with a rate very similar to wild type receptors, raising the possibility that only one GluN2 subunit needs to undergo pre‐gating before the channel can open. Thus GluN1‐GluN2AP552R‐GluN2B receptors had a 10–90% rise time (12 ms) that is reminiscent of a diheteromeric GluN1‐GluN2B receptor (15 ms), as opposed to GluN1‐GluN2A (8 ms). We predict that the converse construct of GluN1‐GluN2A‐GluN2BP553R would have a 10–90% rise time that is close to GluN1‐GluN2A. However, we could not confirm this in these experiments as a pharmacological tool equivalent to ifenprodil that would allow a significant contribution of GluN2A diheteromers to the macroscopic current to be discounted is not available for GluN2A receptors. Compared to the mechanism described in Fig. 2, the mechanism shown in Fig. 5 A accounts for the idea that channel opening may occur after only one of the GluN2 subunits have undergone pre‐gating by allowing a second conformation (two GluN1 active, one GluN2 active) within the scheme to undergo channel opening. Having two open states is consistent with the presence of two exponential components in the channel open time distribution (Fig. 1, Table 1), and the idea that opening can occur when not all subunits are active is reminiscent of AMPA receptors, which can open without agonist binding to all four subunits (Rosenmund et al. 1998).
Several studies have found significant negative correlation between the duration of an opening and the duration of the adjacent shut time for NMDA receptors (Gibb & Colquhoun, 1992; Schorge et al. 2005; Wyllie et al. 2006). Correlations are evident in conditional distributions of open times of hippocampal NMDA receptors, but are not strong for diheteromeric GluN2A receptors (Auerbach & Zhuo, 2005; Erreger et al. 2005). This data set had a small but statistically significant negative correlation between the duration of adjacent open and shut times (r = −0.015; P < 0.01) indicating that there is more than one ‘gateway’ state between open and closed states (Colquhoun & Hawkes, 1987), which is accounted for in the model shown in Fig. 5 A by allowing receptors with two GluN1 and one GluN2 active subunits to open. The correlations in the reaction scheme are implicitly taken into account in our implementation of maximum likelihood fitting of the mechanism to the sequence of open and closed times in the data record (Hawkes et al. 1992). Maximum likelihood fitting of this model to the sequence of open and closed durations within bursts identified with a t‐crit of 35 ms (see Methods) revealed that this mechanism fits the data from the four GluN1/GluN2A patches analysed here remarkably well (Fig. 5 B). Table 3 summarizes the rates obtained from fitting the model in Fig. 5.
Table 3.
Summary of model fitted rate constants
| Non‐desensitizing model, burst analysis (t‐crit 35 ms) | Desensitizing model | ||||
|---|---|---|---|---|---|
| Composite fit (s−1) | Mean ± SEM (s−1) | Composite fit (s−1) | Mean ± SEM (s−1) | ||
| k 12 | 568 | 1170 ± 656 | k 12 | 1390 | 2330 ± 906 |
| k 21 | 17700 | 16400 ± 2270 | k 21 | 15200 | 12900 ± 2560 |
| α1 | 525 | 428 ± 87 | α1 | 344 | 250 ± 71 |
| β1 | 4580 | 4390 ± 1190 | β1 | 4130 | 3300 ± 919 |
| α2 | 8730 | 8080 ± 818 | α2 | 5670 | 4830 ± 1290 |
| β2 | 1580 | 2350 ± 944 | β2 | 3550 | 4840 ± 1190 |
| k +f | 5000 | 4940 ± 560 | k+ f | 4580 | 5470 ± 854 |
| k −f | 2500 | 2630 ± 301 | k −f | 2500 | 3420 ± 818 |
| k +s | 11.1 | 14.0 ± 5.17 | k +s | 256 | 236 ± 19 |
| k −s | 8.56 | 9.31 ± 1.60 | k −s | 225 | 230 ± 47 |
| k +d | — | — | k +d | 5.28 | 4.57 ± 0.860 |
| k −d | — | — | k −d | 1.78 | 2.34 ± 0.470 |
| LL | −41,728 | −41,403 | LL | −42,130 | −41,805 |
Rate constants estimated from composite fit of all patch data (first column) and given as the mean ± SEM to 3 significant figures from fits to each of 4 patches. The total number of open–closed transitions was 108,467; LL is the log‐likelihood.
Dimer‐dependent receptor activation and desensitization
While the burst analysis presented above provides an excellent fit to the data, we were surprised by the unusually slow rate constants representing GluN2 subunit pre‐gating (k +s rates ∼10 s−1; Table 2). These slowed the simulated macroscopic activation to a rate incompatible with the kinetics of GluN2A receptor relaxations (Wyllie et al. 1998; Vicini et al. 1998; Popescu & Auerbach, 2003; Popescu et al. 2004; Erreger et al. 2005). We reasoned that these slow rates may partly reflect optimization of the model to account for the proportion of the sojourns into desensitized states that are of shorter duration than t‐crit of 35 ms. To test whether such misclassification of closed times following isolation of bursts with a t‐crit impacted the determination of fitted rates for subunit pre‐gating steps, we developed a second model to fit to the full data set (without application of a t‐crit) in which the receptor can undergo a desensitizing conformational change. Because glutamate receptor desensitization is a dimer‐dependent phenomenon (Sun et al. 2002) and NMDA receptors have a dimer‐of‐dimers structure for the agonist binding domains (Furukawa et al. 2005), we modified the model shown in Fig. 5 A to include recognition of when GluN1 and GluN2 pre‐gating steps have occurred within a dimer (Alsaloum et al. 2016). We further assume that desensitization is possible whenever one GluN1 and one GluN2 subunit within the same dimer have undergone a pre‐gating conformational change. We therefore termed this a ‘dimer‐dependent desensitization’ model in order to capture the extra connectivity in this model. Figure 5 C illustrates this concept. An advantage of using this approach is that all information in the data record are included in model fitting without exclusion of long closed periods. In addition, this dimer mechanism includes two explicit configurations for when one GluN1 and one GluN2 pre‐gating step has occurred: either both occur within a dimer, or each occurs in separate dimers. Figure 5 D illustrates that maximum likelihood fitting of this mechanism to the single channel data provides an excellent description of the data. Table 3 summarizes the rate constants found from fitting these data with the dimer‐dependent desensitization model. The predicted histograms reveal a modest improvement in the fit, which can be observed in slightly higher maximum log likelihood (−41,728 vs. −41,730, see Table 3). Thus, explicit representation of a dimer‐dependent conformational change is compatible with the data for diheteromeric GluN1/GuN2A receptors. Interestingly, inclusion of desensitized states in the model accelerated the estimated rate constants for the hypothesized GluN2 subunit steps (k s rates > 100 s−1), consistent with the idea that even a small number of closed periods in the single channel record misclassified as within bursts can impact on determination of the model parameters (Colquhoun et al. 2003; Schorge et al. 2005).
The tetrameric subunit‐dependent mechanism predicts synaptic response properties
One goal in this exploration of a structurally based NMDA receptor activation mechanism is to gain insight into synaptic function of NMDA receptors in health and disease. Thus, a crucial test of new mechanisms with rates derived from fitting single channel data is that they should also reproduce the properties of synaptic receptors. For GluN1/GluN2A receptors, the model should respond to a rapid synaptic‐like pulse of 1 mM glutamate with a rapid rise time and high peak P open (e.g. P open ∼0.5, 10–90% rise time of < 10 ms). The deactivation time course following rapid removal of glutamate, as occurs at the synapse, should be compatible with both the synaptic exponential time course, with a weighted tau close to time constants (50–90 ms) reported for GluN2A‐containing synaptic receptors in cerebellar neurons (Traynelis et al. 1993; Cathala et al. 2000; Prybylowski et al. 2002; Lu et al. 2006), as well as the deactivation time course for recombinant GluN1/GluN2A receptors (weighted tau ∼40 ms).
Figure 6 A shows our conceptualization of the binding of glutamate to the tetrameric model shown in Fig. 5 A. We assume a reciprocal relationship between the pre‐gating step and agonist binding, where by analogy with nicotinic acetylcholine receptors (Auerbach, 2013), the probability of the subunit gating step transition is very low (but not zero) for the unbound subunit and relatively high for the bound subunit. We also assume that once the subunit pre‐gating step has occurred (and also if a dimer has desensitized), the probability of agonist unbinding is very low. Similarly, we assume glutamate only binds appreciably to GluN2 subunits for which the pre‐gating step has not occurred. We do not represent glycine binding, and assume in this model that the GluN1 subunits have bound glycine at all times. It may be that pre‐gating steps require both glutamate and glycine to be bound in a dimer, although this is not tested here. We also explicitly model desensitization as a dimer‐dependent phenomenon, with desensitization only occurring from receptor conformations where all four subunits have bound agonist and for which both subunits within a heterodimer are activated (Furukawa et al. 2005). Two further desensitizing steps are possible in this model if desensitization of one dimer can occur while the GluN2 subunit of the partner dimer has not bound glutamate. However, addition of these desensitizing steps did not appreciably alter the macroscopic response characteristics of the receptor or rates inferred from fitting single channel data (data not shown) and so these are not included in Fig. 6 A.
Figure 6. Glutamate binding to a structurally based model of receptor activation.
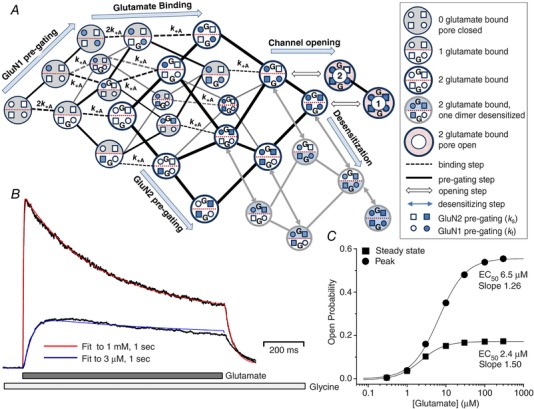
A, glutamate binds prior to subunit‐dependent pre‐gating steps (glycine is assumed to be bound at all subunits). For each binding step (dashed lines), only the association rate k +A is shown for clarity; the dissociation rate k ‐A is not shown. B, macroscopic currents from GluN1/GluN2A were recorded from excised outside‐out patches in response to rapid application of 1 mM or 3 μM glutamate for 1 s. A least squares fitting algorithm was used to optimize glutamate association and dissociation rates and the rates describing the entry and exit from the desensitized state by simultaneously fitting the model in A to both waveforms. The best fit is shown superimposed onto the macroscopic currents. C, simulated concentration–effect curves for the peak and steady state response to a 2 s application of variable concentrations of glutamate. The smooth curves are the Hill equation fitted to the simulated data according to Response = Maximum/(1 + (EC50/[glutamate])) where EC50 is the concentration of glutamate that generates a half‐maximal response and N H is the Hill slope.
Figure 6 B shows the average macroscopic current responses of GluN1/GluN2A receptors in excised patches (n = 9) activated by 1 s pulses of 1 mM or 3 μM glutamate co‐applied with saturating glycine (100 μM), which was also in the control solution. The response characteristics are consistent with those previously described for recombinant diheteromeric GluN1/GluN2A receptors, and show the expected activation time course: pronounced desensitization in the sustained presence of agonist and rapid deactivation following glutamate removal (Wyllie et al. 1998; Vicini et al. 1998; Popescu et al. 2004; Erreger et al. 2005). To determine the microscopic glutamate association and dissociation rates, we fitted the model shown in Fig. 6 A simultaneously to the two waveforms with pre‐gating rates fixed to those determined from fitting single channel data (Table 3), as previously described (Erreger et al. 2005). This approach allows estimation of the glutamate association and dissociation rates, as well as the desensitization rates that can best reproduce the slow, complex rise time observed for submaximal agonist concentrations as well as the rapid activation and slower deactivation observed when NMDA receptors are briefly exposed to a saturating concentration of glutamate. From this least squares fitting we obtained a microscopic glutamate association rate k +A of 6.7 × 10⁶ M−1 s−1 and a dissociation rate k ‐A of 65 s−1. We also determined from these macroscopic responses the rates for the onset of (k +d = 7.41 s−1) and recovery from desensitization (k −d = 1.54 s−1). The desensitization rates were nearly identical to those determined from fitting the single channel records (k +d = 5.28 s−1, k −d = 1.78 s−1, Table 3). While fitted rates are model dependent because the connectivity of states differs between models, the fitted glutamate association and dissociation rates here are nevertheless remarkably similar to the rates previously described for GluN1/GluN2A receptor agonist binding (Popescu et al. 2004; Schorge et al. 2005).
Using the fitted rates, we can simulate the concentration–effect relationships for peak and steady state current response to prolonged glutamate application (Fig. 6 C), as well as the response to a brief synaptic‐like glutamate concentration profile. The simulated macroscopic response to 1 mM glutamate applied for 1 s had a 10–90% rise time of 5 ms. The peak and steady state concentration–effect curves predicted from these rates in response to prolonged glutamate application (in saturating glycine) had EC50 values of 6.5 and 2.4 μM glutamate, respectively (Fig. 6 C). The simulated response to brief synaptic‐like instantaneously rising and exponentially decaying glutamate concentration profiles (1.1 mM, tau 1.2 ms; Clements et al. 1992) had a 10–90% rise time of 4 ms (Fig. 7 A), compatible with NMDA receptor‐mediated synaptic whole cell currents in the mature hippocampus, cortex or cerebellar granule cells (Hestrin et al. 1992; Flint et al. 1997; Cathala et al. 2000; Prybylowski et al. 2002; Lu et al. 2006). The simulated synaptic response deactivated with a time course that could be best fitted by a single exponential function with a time constant of 40 ms. Varying the peak concentration of the synaptic waveform gave an EC50 for synaptic activation of 190 μM glutamate and a Hill slope of 1.66 (Fig. 7 B).
Figure 7. Fitted parameters predict synaptic signalling characteristics.
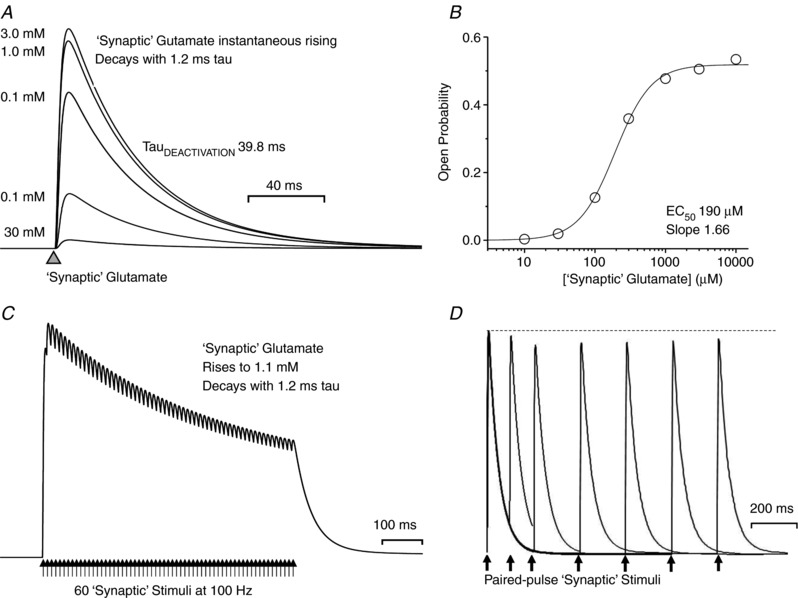
A, simulated responses are superimposed to variable concentrations of glutamate (in saturating glycine) that rise instantaneously and relax with a time constant of 1.2 ms. B, the concentration–response curve for current responses in A fitted to the Hill equation (Fig. 6 legend). C, simulated response to a train of 21 synaptic‐like glutamate stimuli that each rise to 1.1 mM and decay exponentially with a time constant of 1.2 ms. D, the time course for recovery from desensitization induced by a single synaptic stimulus was determined using a double pulse protocol with a variable interval. The time constant for recovery from desensitization was determined by Amplitude2/Amplitude1 = (1 − exp(−time/tau)).
Sustained simulated application of saturating glutamate (1 mM) to excised patches for 2 s produced a macroscopic response waveform that relaxed back to a current level lower than the peak response with a variable time course. The mean response waveform from macroscopic responses (Fig. 6 B) to 1 mM glutamate (100 μM glycine) in nine patches was best described by a dual exponential function with a fast time constant of 119 ms (13%) and a slow time constant of 511 ms (87%). Macroscopic responses simulated using fitted rate constants from the single channel data had a similar dual exponential time course for desensitization in response to prolonged glutamate application, with a fast time constant of 151 ms (12%) and a slow time constant of 437 ms (88%). Receptor desensitization can have a significant effect on the NMDA receptor current during high frequency synaptic transmission (Tong et al. 1995; Popescu et al. 2004; Erreger et al. 2005). We subsequently used these fitted parameters to simulate the synaptic response to multiple synaptic‐like pulses of glutamate that instantaneously rose to 1.1 mM, and decayed to baseline exponentially with a time constant of 1.2 ms (Clements et al. 1992). Trains of synaptic‐like stimuli produced an incremental reduction in the synaptic current amplitude that was predicted to decrease exponentially with a time constant of tauDESEN = 0.38 s to a steady state of 35% of the initial peak. This decay in synaptic peak amplitude will depend on the frequency of stimulation (Fig. 7 C). Evaluation of the recovery from desensitization using pairs of synaptic stimuli (Fig. 7 D) with a variable interval revealed a tauRECOVERY of 2.1 s, compatible with the desensitization rates determined from both the single channel record and the macroscopic response time course. This desensitization and recovery time course may be neuroprotective during epileptic discharge and so is an important aspect of the receptor‐channel kinetics.
Discussion
Current conceptual formulations of NMDA receptor function have been greatly facilitated by emerging concepts about glutamate receptor structure (Mayer, 2017). We now know that the subunits of the heterotetrameric glutamate receptors are arranged as a pair of heterodimers in a 1‐2‐1‐2 order around the ion channel for both kainate (Reiner et al. 2012; Paramo et al. 2017) and NMDA receptors (Sobolevsky et al. 2009; Salussolia et al. 2011; Riou et al. 2012; Karakas & Furukawa, 2014; Lee et al. 2014). The main result of this study is the development of a structurally constrained model of receptor activation that uniquely represents all four NMDA receptor subunits in a way consistent with the subunit composition. This model can account for single channel and macroscopic properties, and allows analysis of modification or exchange of individual subunits.
Distinct subunit‐specific contributions to NMDA receptor activation
Each NMDA receptor subunit comprises four semi‐autonomous domains, including an amino terminal domain that is hypothesized to bind allosteric regulators, an agonist binding domain that binds glycine (GluN1) or glutamate (GluN2), a transmembrane domain that shares structural similarity to potassium channels, and an intracellular domain that provides binding sites for multiple scaffolding partners and modulatory proteins, as well as molecular tags that specify receptor trafficking (Paoletti et al. 2013; Wyllie et al. 2013; Zhou & Wollmuth, 2017; Iacobucci & Popescu, 2017). Within the context of this structural framework, explicit physical models of agonist binding, receptor desensitization, negative allosteric modulation, and concerted pore dilatation have emerged (Benveniste et al. 1990; Clements et al. 1992; Nahum‐Levy et al. 2001; Schorge et al. 2005; Talukder & Wollmuth, 2011; Hansen et al. 2012; Dai & Zhou, 2013; Yi et al. 2016; Mesbahi‐Vasey et al. 2017; Zhou & Wollmuth, 2017) allowing conceptualization of models of receptor function that can be constrained to be consistent with both the physical structure of the receptor and with functional data from both single channel and macroscopic current recordings.
For diheteromeric NMDA receptors, the alternating 1‐2‐1‐2 subunit arrangement provides a symmetry in the receptor structure (Sobolevsky et al. 2009; Salussolia et al. 2011; Riou et al. 2012; Karakas & Furukawa, 2014; Lee et al. 2014; Tajima et al. 2016) that we reflect in constraining the rates for two distinct conformational changes that precede rapid pore dilatation (Fig. 2). We propose that these conformational changes reflect two distinct sets of linker/TMD interactions that involve both subunits (Ogden & Traynelis, 2013; Amin et al. 2017; Chen et al. 2017; Ogden et al. 2017). We propose a relatively slow conformational change described by rate constants (Table 3) k +s and k‐ s of 256 s−1 and 225 s−1, respectively (Figs 2 C, and 5 A and C) dominated by GluN2 that involves a triad comprising the GluN2 pre‐M1 helix and GluN2 SYTANLAAF region, together with GluN1 pre‐M4 linker as illustrated conceptually in Fig. 8. These three regions have conserved function and are under the strongest purifying selection in their respective proteins, as shown by the reduced variability in these regions in the healthy population (Swanger et al. 2016; Ogden et al. 2017). We assume that the rate for rearrangement of this region will be the same for both instances of it given the symmetry described above. Similarly, we propose a conformational change (rate constants k +f and k ‐f of 4580 s−1 and 2500 s−1) that reflects rearrangement of the triad comprising the GluN1 SYTANLAAF region of M3, GluN1 pre‐M1 helix and GluN2 pre‐M4 linker (Fig. 8). We again exploit symmetry to propose that these two triads move at the same rate. Molecular dynamics simulations were made to test the hypothesis that atomic movements within the pre‐M1 helices act independently of each other. Larger domain motions involve ensembles of atomic movements and if atomic movements are not correlated this would be consistent with the assumption in the model that the pre‐gating rate constant for each subunit is independent of the state of the other subunits. A caveat to this idea is that the molecular dynamics simulations run for 1 μs while the expected lifetime of the pre‐gating states of the receptor in our model is in the order of 100 μs. Given that we cannot detect correlations with the movement of the pre‐M1 helices at short time points, it seems likely there would be less correlation at longer time periods.
Figure 8. Three key motifs hypothesized to form two pairs of triads that may underlie the subunit‐dependent rates of pre‐gating conformational changes.
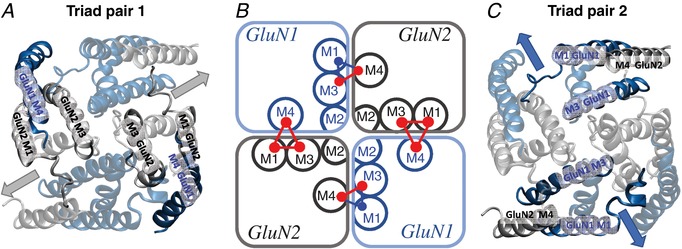
A, ribbon structure of the transmembrane domains and linker regions of the NMDA receptor highlighting the GluN1 subunit pre‐M4 region and GluN2 subunit pre‐M1 and M3‐SYTANLAAF and regions that we propose come together to form a pre‐gating ‘triad’ whose movement forms a rate‐limiting step in receptor activation following agonist binding and preceding pore opening. B, schematic diagram illustrates the four proposed NMDA receptor gating triads. Two triads are hypothesized to be dominated by the pre‐M1 and M3‐SYTANLAAF motifs of a GluN2 subunit and the GluN1 pre‐M4 (as shown in A). C, two additional triads are formed by the pre‐M1 and M3‐SYTANLAAF regions of a GluN1 subunit and the GluN2 pre‐M4. Pore dilation movements are represented by gray arrows in A for GluN2 subunits and blue arrows in C for GluN1 subunits. The pre‐M1 motif of GluN1 is hypothesized to have a reduced influence on receptor activation (and so coloured blue), given the differential effects of pre‐M1 mutations in GluN1 and GluN2 (Ogden et al. 2017).
We note that within this triad only GluN1 SYTANLAAF and GluN2 pre‐M4 are under purifying selection, with apparently less functional contribution of GluN1 pre‐M1 (Ogden et al. 2017), which may amplify the role of the GluN2 pre‐M4 (Amin et al. 2017). The implementation of this symmetry for diheteromeric receptors will allow a logical progression to analysis of triheteromeric receptor function where the GluN2 symmetry of subunit structure is lost (Lu et al. 2017) and therefore any functional model for triheteromeric receptors must be able to allow the rates for the gating arrangements dominated by individual subunits to differ.
In Fig. 6 we show that using rates derived from single channel fitting, the macroscopic properties of diheteromeric GluN1/GluN2A receptors can be accurately reproduced by mechanisms incorporating transitions representing subunit‐dependent clamshell closure around the agonist, unique subunit‐dependent conformational changes that we hypothesize reflect movement of interacting linker regions that precede gating (e.g. Tajima et al. 2016), and a dimer‐dependent desensitization reflecting a conformational change at the interface between the GluN1‐GluN2 agonist binding domains (Furukawa et al. 2005; Alsaloum et al. 2016). These mechanisms are also consistent with data describing unique roles of the linker regions in gating (Kazi et al. 2013, 2014; Ogden & Traynelis, 2013; Ogden et al. 2017; Chen et al. 2017; Zhou & Wollmuth, 2017). Our macroscopic current recordings (Fig. 6) show that GluN2A receptors respond to rapid application of glutamate with a current that rises to a peak open probability of about 0.5 with a 10–90% rise time that is less than 10 ms. Following rapid removal of glutamate, the current response deactivates with a time constant of about 40 ms (Wyllie et al. 1998; Vicini et al. 1998; Erreger & Traynelis, 2005; Zhang et al. 2008). During prolonged agonist application (Fig. 6) in dialysed outside‐out patches GluN2A receptors desensitize to a steady state level that is approximately 20% of the peak current, which we assume involves the agonist binding domain dimer interface, given the strong precedent established in AMPA receptors (Sun et al. 2002).
Interactions between subunits
A key feature of the twofold symmetry in the extracellular domain of the NMDA receptors is the arrangement of a pair of glycine‐binding GluN1 subunits and two glutamate‐binding GluN2 subunits (GluN2A–D). The GluN2 subunit is well known to influence receptor properties, including the time course of NMDA receptor‐mediated synaptic transmission, agonist potency, Mg2+ sensitivity, Ca2+ permeability, single channel conductance and open probability (Erreger et al. 2004; Cull‐Candy & Leszkiewicz, 2004; Yuan et al. 2009; Traynelis et al. 2010; Paoletti et al. 2013; Wyllie et al. 2013; Glasgow et al. 2015; Iacobucci & Popescu, 2017). This variation in receptor properties is exploited at different developmental stages and in different brain regions to endow synapses with specific properties. The rapidly deactivating GluN2A subunit shortens the window for integration of synaptic activity and shifts synaptic signalling properties towards more rapid and high fidelity signalling (Flint et al. 1997; Lu et al. 2001; Carmignoto & Vicini, 1992; Hestrin, 1992; Markram et al. 2012; Wyllie et al. 2013). The model we present here provides a mechanistic basis (represented by k +s and k ‐s rate constants) to understand the differences in properties observed between diheteromeric receptors containing different GluN2 subunits (Erreger et al. 2005, 2007). However, it remains unclear whether this form of model will reproduce intriguing interactions between GluN2 subunits, such as the GluN2A domination of the response time course of triheteromeric GluN1/GluN2A/GluN2B NMDARs or variations in glycine affinity (Hansen et al. 2014; Sun et al. 2017).
Influence of subunit‐dependent pre‐gating transition rates on agonist affinity
It is well established that there is a negative cooperativity between glutamate and glycine binding (Mayer et al. 1989; Vycklicky et al. 1990; Benveniste & Mayer, 1991; Nahum‐Levy et al. 2001), and there is strong evidence for allosteric interactions between the binding of N‐terminal domain ligands and agonist affinity (Zheng et al. 2001; Erreger & Traynelis, 2008). Therefore, it is quite likely that interactions at the extracellular subunit interfaces transmit allosteric effects between subunits. The current form of model includes dimer‐dependent desensitization and could also represent agonist binding domain–dimer interactions, but not allosteric amino terminal domain–agonist binding domain interactions. We explored the influence of receptor pre‐gating (k s and k f rate constants) on glutamate and glycine macroscopic affinity by simulations using the set of rate constants we derived from fitting single‐channel and macroscopic currents. In the absence of glycine the channel cannot open, and the receptor mechanism can only visit a small subset of the states illustrated in Fig. 6 A: those states where the GluN1 subunits have not undergone pre‐gating. The calculated macroscopic glutamate binding affinity for the receptor will therefore depend only on the values of the k +A, k ‐A and k +s and k ‐s rate constants. The macroscopic EC50 for glutamate binding under these conditions is 1.8 μM. In the presence of saturating glycine where the mechanism can visit all states shown in Fig. 6 A, the glutamate steady state EC50 is 3.0 μM, showing that at least a portion of the glutamate–glycine allosteric interactions could reflect availability of pre‐gating states following binding of both glutamate and glycine.
It remains unknown whether a GluN2 pre‐gating step might take place only after the partner GluN1 has bound glycine, for example. Our current model (Fig. 6) has subunit gating steps that are independent, but our working hypothesis that gating triads (Fig. 8) are the structural correlate of these pre‐gating steps suggests elements of GluN1 and GluN2 influence each pre‐gating step, even if a single subunit may dominate the rate. Excised outside‐out patches from HEK cells expressing GluN1/GluN2A that are bathed in maximal glutamate (100 μM) and activated by rapidly applying glutamate and glycine (1 mM) produce current responses that activate at the same speed (10–90% rise time 9.3 ± 0.5 ms, n = 3, data not shown) as patches activated by glutamate described above (Table 2). This result argues against the idea that the slower GluN2‐dependent pre‐gating step can occur without glycine binding, because if they could, one would predict a faster rise time of the receptor response dominated by k +f . Thus, additional experimental work remains in order to understand the exact role of glycine binding in NMDA receptor activation.
Receptor desensitization
Desensitization describes the process whereby a response is decreased in the continued presence of a stimulus. Sun et al. (2002) proposed that a physical rearrangement of the dimer interface that exists between agonist binding domains represents a model for desensitization for AMPA receptors (Meyerson et al. 2014), and there is evidence to suggest that NMDA receptors share mechanistic features of desensitization with AMPA receptors (Furukawa et al. 2005; Alsaloum et al. 2016) in addition to kinetic influences from both N‐terminal and C‐terminal (Iacobucci & Popescu, 2017) domains. Although we still do not know the physical basis for desensitization in NMDA receptors, the long‐lived closed periods that are very evident in single channel recordings (Fig. 1 A) are considered to represent ‘desensitized’ receptor states. There are several structural precedents that could explain the existence of these long‐lived closed states, and thus we retain the nomenclature of desensitized states. Following the precedent established in the AMPA receptor literature (Sun et al. 2002; Meyerson et al. 2014), we have explicitly modelled transitions to these desensitized states as closed states that occur when all four subunits have bound agonist and both GluN1 and GluN2 subunits within at least one heterodimer are activated, as opposed to when only four subunits in the receptor have completed pre‐gating. When the equivalent model to that in Fig. 5 C (but with entry to a single desensitized state only possible after all four subunits have competed pre‐gating) is fitted to our data set, the log‐likelihood for this model is much less favourable (likelihood ratio test P < 0.001, d.f. = 16). Thus, inclusion of explicit desensitization steps allows the macroscopic model to reproduce properties of agonist‐dependent desensitization (Figs 6 and 7) and correctly account for the macroscopic agonist affinity (Fig. 6). We recognize that the data we use to evaluate desensitization are from dialysed patches, which show greater desensitization (Sather et al. 1990) even though deactivation is largely unchanged by patch excision (Lester et al. 1990; Lester & Jahr, 1992).
Differential subunit contributions to receptor activation
While we have assumed non‐cooperativity between subunits, there is ample evidence to show that each GluN2 subunit within the triheteromeric GluN1/GluN2A/GluN2B receptor contributes to the functional properties of these receptors. Specifically, triheteromeric receptors display unique macroscopic properties that are different from those of either diheteromeric receptor (Hansen et al. 2014; Stroebel et al. 2014; Sun et al. 2017). Additionally, similar observations of unique properties for receptors with non‐equivalent GluN2 subunits have been made for diheteromeric receptors with one subunit containing a point mutation (e.g. Yuan et al. 2014; Li et al. 2016; Swanger et al. 2016; Ogden et al. 2017). A particularly striking example involves de novo mutations at a proline residue within the pre‐M1 helix of the agonist binding domain‐TMD linker in GluN1, GluN2A and GluN2B (Ogden et al. 2017). For GluN2, but not GluN1, mutation of this proline to an arginine produces an incremental slowing of the deactivation rate, dependent on the number of mutant subunits in the tetrameric complex. In addition, the receptor macroscopic current rise time and single channel conductances change only when two copies of the mutant GluN2 subunit are present. With two mutant copies, the response to a brief pulse of glutamate continues to rise slowly, long after the glutamate has been removed, which indicates that these effects involve changes to the pre‐gating steps rather than agonist binding (Ogden et al. 2017). Based on these two independent but related concepts, we characterized triheteromeric GluN1/GluN2A/GluN2B receptors (Fig. 3) containing the GluN2A‐P552R mutation or both GluN2A‐P552R and GluN2B‐P553R mutations. Our results showed that the GluN2A‐P552R/GluN2B receptor responses show a deactivation time course that is slowed by approximately 7‐fold, but retained the wild type‐like rise time. This result is consistent with the effects of the P552R mutation on diheteromeric receptors, and supports our hypothesis (as represented in the mechanisms shown in Figs 5 and 6) that channel opening can occur when only one of the two GluN2 subunits have completed pre‐gating.
Relation to other mechanisms describing pre‐gating transitions in channel activation
Finally, this model captures many shared features of other models that can successfully reproduce the kinetics of ligand‐gated ion channel activation. For example, a linear reaction scheme with three adjacent closed states and two adjacent open states (C‐C‐C‐O‐O model) is able to reproduce a surprisingly wide range of diheteromeric GluN1/GluN2A channel properties when data within clusters (disregarding agonist binding and desensitized states) are analysed (Auerbach & Zhou, 2005; Erreger et al. 2005; Iacobucci & Popescu, 2017), and elements of this model could be captured in a portion of our grid model along the vector representing pre‐gating conformational changes. Addition of agonist binding and desensitized states allows a linear model to reproduce the time course of both synaptic and macroscopic currents (Lester & Jahr, 1992; Iacobucci & Popescu, 2017) without invoking subunit‐dependent properties. Likewise, the concept of subunit pre‐gating states has been applied successfully to tetrameric models of the cyclic nucleotide gated (CNG) channels (Ruiz & Karpan, 1999) and the BK Ca2+ activated potassium channels (reviewed in Magleby, 2003). As with our NMDA receptor model, the BK and CNG channel models also included the possibility of channel opening when three of the four subunits have undergone pre‐gating. In contrast, a pre‐gating model that successfully describes the pentameric glycine receptors (Burzomato et al. 2004) has three pre‐gating steps, so the model does not directly relate gating to conformational changes in individual receptor subunits. Likewise, NMDA models (e.g. C‐C‐C‐O‐O) that include pre‐gating steps in a linear sequence are not subunit related (e.g. Fig. 4 of Iacobucci & Popescu, 2017). Models describing NMDA receptor activation that include gating cycles with fast and slow steps and agonist binding (Banke et al. 2003; Erreger et al. 2005; Schorge et al. 2005; Wyllie et al. 2006) are also captured in the subunit specific models investigated here. Thus, we view our approach as entirely compatible with previously described mechanisms that gave high‐precision matches to single channel data sets, while in addition, here we incorporate key subunit‐dependent features of current structurally derived models of NMDA receptors.
Appendix
A sensitivity analysis was performed for the model rate constants estimated by fitting single channel and macroscopic data. In the case of single channel data, this allows an investigation of the sensitivity of the shape of the likelihood surface near the maximum to small changes in a single parameter. For rate constants estimated by least squares fitting of macroscopic currents, the sensitivity of the sum of squares can be determined for small changes in parameter values around the best‐fit value for the glutamate binding (k +A) and unbinding (k ‐A) rates, and rates for desensitization (k +d, k −d). The results are illustrated for the k s and k f rate constants in Fig. A1 A–D and for k +d, k −d, k +A and k −A in Fig. A1 E–H.
Figure A1. Sensitivity analysis of model rate constants.
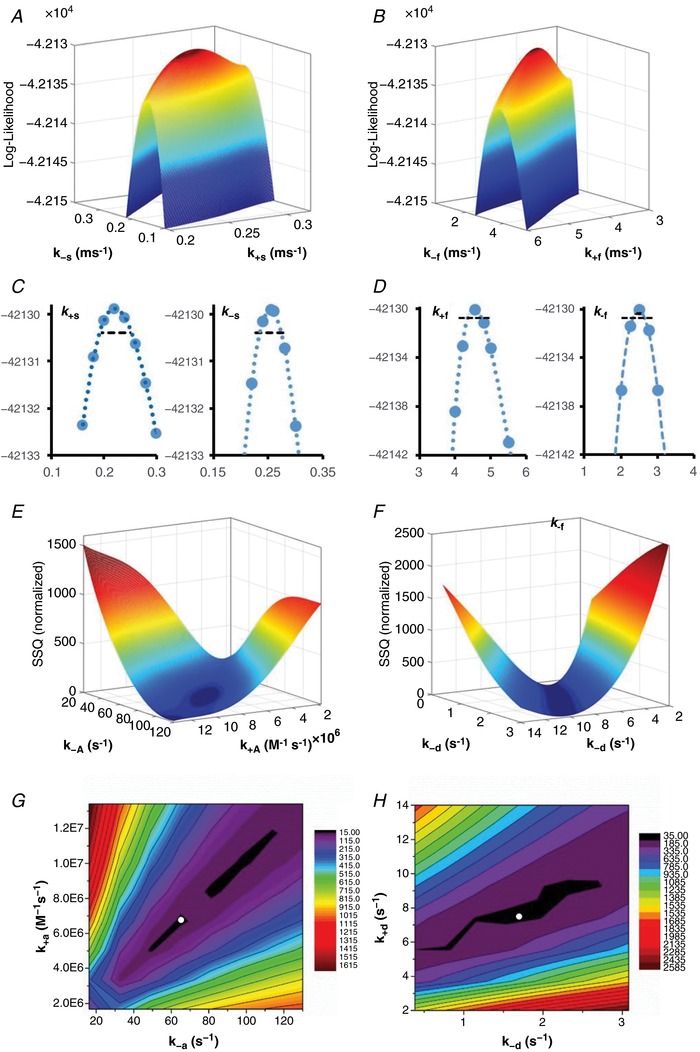
A and B demonstrate how the likelihood surface around the maximum depends on the value of the rate constants k+ s and k‐ s (A) and k+ f and k‐ f (B). C and D illustrate estimation of the 0.5 unit log‐likelihood intervals for k‐ s, k +s, k‐ f and k +f, respectively. For each panel, filled symbols show the best‐fit log‐likelihood found when the data set are fitted with the parameter fixed at the values shown on the x‐axis. Dashed lines show the shape of a cubic polynomial used to interpolate the value of the parameter corresponding to a log‐likelihood of 0.5 units less than the maximum. The peak of each curve corresponds to the best‐fit value of the rate constant (k‐ s = 220 s−1, k +s = 254 s−1, k ‐f = 4550 s−1, k +f = 2490 s−1) and the values of the rate constant giving a log‐likelihood value of 0.5 less than the maximum were then found numerically and are indicated by horizontal dashed lines. These were; k ‐s = 187 s−1 and 258 s−1; k +s = 227 s−1 and 282 s−1; k ‐f = 4379 s−1 and 4709 s−1; k +f = 2403 s−1 and 2561 s−1. E and F illustrate how the sum of squares (SSQ) obtained from fitting macroscopic current data depends on the values of the glutamate association (k +A) and dissociation (k ‐A) rates, and the rates for the onset (k +d) and recovery (k ‐d) from desensitization. G and H show the surface contour for the SSQ landscape with the minima indicated by a white dot.
The values of k +s and k‐ s (Fig. A1 A) and k +f and k‐ f (Fig. A1 B) were modestly correlated with the likelihood approaching a single peak at the best‐fit values of the parameters while for k +A, k −A and for k +d, k −d the best‐fit values are at the minimum of a valley in the sum of squares surface. Figure A1 C and D illustrates the estimation of likelihood intervals for k +s and k −s (Fig. A1 C) and k +f and k −f (Fig. A1 D). Likelihood intervals were estimated by fixing the value of the test rate constant at the value shown on the x‐axis and maximizing the value of the log‐likelihood with respect to the other rate constants in the mechanism (Colquhoun & Sigworth, 1995). These data demonstrate that the estimated rate constants were well determined by the fitting process k +s = 256 s−1 (0.5 unit likelihood interval range 227–282 s−1) and k −s = 225 s−1 (187–258 s−1) and k +f = 2500 s−1 (2403–2561 s−1) and k −f = 4550 s−1 (4379–4709 s−1).
The least squares fitting of the model to the macroscopic waveforms in Fig. 6 yielded a glutamate association rate constant k +A of 6.7 × 10⁶ M−1 s−1 and a dissociation rate constant k −A of 65 s−1, which yielded a sum of squares difference of 5.51; this value is unitless because it was calculated from the waveforms normalized to the maximal peak current. A sensitivity analysis was conducted over a range of rate constants, with k +A values ranging from 1.68 × 10⁶ to 1.34 × 10⁷ M−1 s−1 and k −A values ranging from 16.25 to 130 s−1. The sum of squared differences (SSQ) was calculated from the simulated waveform and recorded mean waveform for each possible combination of rates for both waveforms shown in Fig. 6 (Fig. A1 A). The best fit of the model in Fig. 6 to the macroscopic waveforms yielded onset of and recovery from desensitization rates k −d of 1.54 s−1 and k +d of 7.41 s−1, respectively. Rates of onset of and recovery from desensitization were also co‐varied and the sum of squares difference determined for all combinations. k −d was varied between 0.385 and 3.08 s −1 and k +d was varied between 1.85 and 14.8 s−1. Figure A1 E and F plots the sum of squares for each co‐varied pair of rates for association and dissociation rate constants (Fig. A1 E), with desensitization rates held constant to those determined from the best fit. Similarly, the onset and recovery of desensitization were co‐varied, with association and dissociation held constant to those determined from the best fit (Fig. A1 F). The sensitivity analysis confirms the presence of a single minimum in the least squares surface generated when fitting the model in Fig. 6. However, Fig. A1 G and H reveals that the relation between the SSQ and parameter values has a shallow basin with minimum value (shown as a white circle) indicating the fit will give similar values for the glutamate equilibrium dissociation constant (k −A/k +A) along the floor of the basin.
Comparison of fitted models with different paths to the open state
We compared the model determined in Figs 5 and 6 with a virtually identical model in which opening can only occur when all four (not 3) pre‐gating transitions have occurred (Fig. A2). While this model can produce a good fit to the single channel data, the log‐likelihood for this model was significantly less favourable, and the pre‐gating rate constants were slower (Table A1). These data suggest that our representation of activation when either three or four pre‐gating steps have occurred is more compatible with the data. Fitting this model to the same macroscopic current response waveforms (Fig. A2) produced an accurate fit, but with different glutamate association and dissociation rates. Using the fitted rates, we can simulate the concentration–effect relationships for peak and steady state current response to prolonged glutamate application, as well as the response to the brief synaptic glutamate concentration profile. The peak and steady state concentration–effect curves predicted from these rates in response to prolonged glutamate application (in saturating glycine) had EC50 values of 6.5 (peak) and 2.5 μM glutamate (steady state). Sustained simulated application of saturating glutamate (1 mM) to excised patches for 3 s produced a rapidly activating (10–90% rise time 5 ms) macroscopic response waveform that relaxed back to a current level lower than the peak response with a time course that can be described by a dual exponential with a fast time constant of 146 ms (10%) and a slow time constant of 423 ms (90%). The simulated response to a synaptic‐like instantaneously rising exponentially decaying (1.1 mM, tau 1.2 ms; Clements et al. 1992) glutamate concentration profile had a 10–90% rise time of 4 ms and deactivated with a time course that was best fitted by a single exponential function with time constant of 37 ms, compatible with the model in Fig. 6. Varying the peak synaptic glutamate concentration gave an EC50 value for synaptic activation of 201 μM glutamate and a Hill slope of 1.32. While the parameters determined from a model where opening of the channel only occurs following all four pre‐gating steps can reproduce some features of NMDA receptor macroscopic activation, we favour the model with two distinct paths to the open state (Figs 5 and 6) because it logically accounts for the rise time dependence on number of mutant subunits (Fig. 3), allows for correlations in open times, produces a better fit to the single channel data, and yields a glutamate EC50 that matches experimental values.
Figure A2. Evaluation of a model that can only reach the open state when all four pre‐gating steps have occurred.
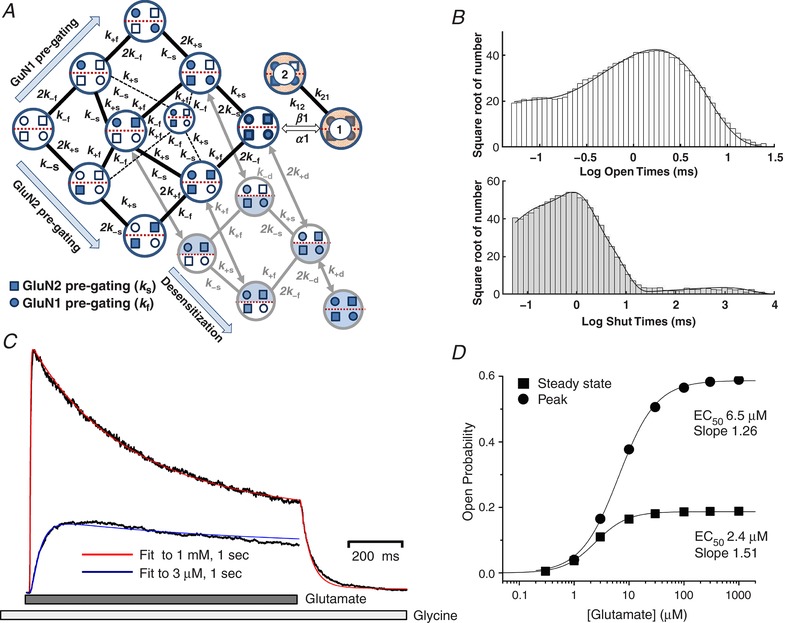
A, model that is identical to that in Fig. 5, except that channel opening can only occur from a state with all four activated pre‐gating steps. For clarity, not all rate constants are shown for desensitizing steps. B, super‐position of predicted open and closed duration histograms from a maximum likelihood fit of the model in A to the idealized data. C, macroscopic curves were the same as in Fig. 6, except that they were fitted by the model in A with glutamate binding sites added as described for Fig. 6. D, predicted peak (filled circles) and steady state (filled squares) P open curves.
Table A1.
Comparison of rate constants from models with different paths to the open state
| Single channel fit | Macroscopic fit | Single channel fit | Macroscopic fit | |
|---|---|---|---|---|
| model (Figs 5 and 6) | model (Figs 5 and 6) | model (Fig. A2) | model (Fig. A2) | |
| k 12 | 1390 | 1390 | 15000 | 15000 |
| k 21 | 15200 | 15200 | 4110 | 4110 |
| α1 | 344 | 344 | 3700 | 3700 |
| β1 | 4130 | 4130 | 4010 | 4010 |
| α2 | 5670 | 5670 | — | — |
| β2 | 3550 | 3550 | — | — |
| k +f | 4580 | 4580 | 4880 | 4880 |
| k −f | 2500 | 2500 | 2730 | 2730 |
| k +s | 256 | 256 | 572 | 572 |
| k −s | 225 | 225 | 87.3 | 87.3 |
| k +d | 5.28 | 7.41 | 3.32 | 4.63 |
| k −d | 1.78 | 1.54 | 1.81 | 1.60 |
| k +A | — | 6.7 × 10⁶ | — | 1.3 × 10⁷ |
| k −A | — | 65 | — | 483 |
| LL | −42130 | — | −42144 | — |
All rate constants in s−1 except k +A, which is in M−1 s−1. Rates were estimated from composite fit of all patch data given to 3 significant figures. The total number of open–closed transitions was 108,467; LL is the log likelihood. Rates shown in italics were fixed during macroscopic fitting so the number of free parameters for macroscopic fits was 4 (shown in bold), while in the single channel fits there were 11 (k 12 is determined by microscopic reversibility) free parameters for the model used in Figs 5 and 6, and A2 for the model in Fig. A2.
Additional information
Competing interests
S.F.T. is a co‐founder of NeurOp Inc., a PI on a research grant from Janssen to Emory University, and a member of the Scientific Advisory Board for Sage Therapeutics.
Author contributions
K.K.O., M.J.M. and K.M.V. conducted experiments at Emory University. K.K.O. implemented the missed event fitting in MATLAB. S.A.K., P.B. and C.B. performed molecular dynamics simulations and analyses. D.C.L. contributed to interpretation of molecular dynamics data. K.K.O., M.J.M., S.F.T., S.A.K. and A.J.G. performed data analysis. A.J.G. and S.F.T. performed simulations. All authors contributed to writing the manuscript. All authors have approved the final version of the manuscript and agree to be accountable for all aspects of the work. All persons designated as authors qualify for authorship, and all those who qualify for authorship are listed.
Funding
This work was supported by the National Institute of Neurological Disorders and Stroke (NINDS, NIH) (NS036654, NS065371; S.F.T.), the Wellcome Trust (A.J.G.) and the BBSRC (A.J.G.).
Acknowledgements
We thank Phoung Le and Jing Zhang for outstanding technical assistance. We thank Chris Shelley for critical comments on the manuscript.
Biography
Alasdair Gibb is a graduate of the University of Strathclyde in Scotland and currently is Professor of Pharmacology at University College London. His research interests are in the properties of ion channel receptors and synaptic transmission. He has been Editor and Distributing Editor of The Journal of Physiology, an Editor of the British Journal of Pharmacology and is currently an Editor of Molecular Pharmacology. Professor Gibb is lead organizer of the British Pharmacological Society General and Advanced Receptor Theory Workshops and is a lecturer on the IBRO VLTP programme delivering neuroscience teaching to postgraduate students in developing countries.

Edited by: Ian Forsythe & David Wyllie
Linked articles This article is highlighted by a Perspective by Wyllie. To read this Perspective, visit https://doi.org/10.1113/JP276664.
References
- Acker TM, Yuan H, Hansen KB, Vance KM, Ogden KK, Jensen HS, Burger PB, Mullasseril P, Snyder JP, Liotta DC & Traynelis SF (2011). Mechanism for noncompetitive inhibition by novel GluN2C/D N‐methyl‐d‐aspartate receptor subunit‐selective modulators. Mol Pharmacol 80, 782–795. [DOI] [PMC free article] [PubMed] [Google Scholar]
- Alsaloum M, Kazi R, Gan Q, Amin J & Wollmuth LP (2016). A molecular determinant of subtype‐specific desensitization in ionotropic glutamate receptors. J Neurosci 36, 2617–2622. [DOI] [PMC free article] [PubMed] [Google Scholar]
- Amin JB, Salussolia CL, Chan K, Regan MC, Dai J, Zhou HX, Furukawa H, Bowen ME & Wollmuth LP (2017). Divergent roles of a peripheral transmembrane segment in AMPA and NMDA receptors. J Gen Physiol 149, 661–680. [DOI] [PMC free article] [PubMed] [Google Scholar]
- Auerbach A (2013). The energy and work of a ligand‐gated ion channel. J Mol Biol 425, 1461–1475. [DOI] [PMC free article] [PubMed] [Google Scholar]
- Auerbach A & Zhou Y (2005). Gating reaction mechanisms for NMDA receptor channels. J Neurosci 25, 7914–7923. [DOI] [PMC free article] [PubMed] [Google Scholar]
- Banke TG & Traynelis SF (2003). Activation of NR1/NR2B NMDA receptors. Nat Neurosci 6, 144–145. [DOI] [PubMed] [Google Scholar]
- Benveniste M, Clements J, Vyklický L Jr & Mayer ML (1990). A kinetic analysis of the modulation of N‐methyl‐d‐aspartic acid receptors by glycine in mouse cultured hippocampal neurones. J Physiol 428, 333–357. [DOI] [PMC free article] [PubMed] [Google Scholar]
- Benveniste M & Mayer ML (1991). Kinetic analysis of antagonist action at N‐methyl‐d‐aspartic acid receptors. Two binding sites each for glutamate and glycine. Biophys J 59, 560–573. [DOI] [PMC free article] [PubMed] [Google Scholar]
- Bettini E, Sava A, Griffante C, Carignani C, Buson A, Capelli AM, Negri M, Andreetta F, Senar‐Sancho SA, Guiral L & Cardullo F (2010). Identification and characterization of novel NMDA receptor antagonists selective for NR2A‐over NR2B‐containing receptors. J Pharmacol Exp Ther 335, 636–644. [DOI] [PubMed] [Google Scholar]
- Blatz, A & Magleby K (1989). Adjacent interval analysis distinguishes among gating mechanisms for the fast chloride channel from rat skeletal muscle. J Physiol 410, 561–585. [DOI] [PMC free article] [PubMed] [Google Scholar]
- Bliss TV & Collingridge GL (1993). A synaptic model of memory: long‐term potentiation in the hippocampus. Nature 361, 31–39. [DOI] [PubMed] [Google Scholar]
- Borschel WF, Cummings KA, Tindell LK & Popescu GK (2015). Kinetic contributions to gating by interactions unique to N‐methyl‐d‐aspartate (NMDA) receptors. J Biol Chem 290, 26846–26855. [DOI] [PMC free article] [PubMed] [Google Scholar]
- Brickley SG, Misra C, Mok MH, Mishina M & Cull‐Candy SG (2003). NR2B and NR2D subunits coassemble in cerebellar Golgi cells to form a distinct NMDA receptor subtype restricted to extrasynaptic sites. J Neurosci 23, 4958–4966. [DOI] [PMC free article] [PubMed] [Google Scholar]
- Brothwell SL, Barber JL, Monaghan DT, Jane DE, Gibb AJ & Jones S (2008). NR2B‐ and NR2D‐containing synaptic NMDA receptors in developing rat substantia nigra pars compacta dopaminergic neurones. J Physiol 586, 739–750. [DOI] [PMC free article] [PubMed] [Google Scholar]
- Brown DK, Penkler DL, Sheik O, Amamuddy C, Ross AR, Atilgan C & Tastan Bishop O (2017). MD‐TASK: a software suite for analyzing molecular dynamics trajectories. Bioinformatics 33, 2768–2771. [DOI] [PMC free article] [PubMed] [Google Scholar]
- Burzomato V, Beato M, Groot-Kormelink PJ, Colquhoun D & Sivilotti LG (2004). Single-channel behavior of heteromeric alpha1beta glycine receptors: an attempt to detect a conformational change before the channel opens. J Neurosci 24, 10924–10940. [DOI] [PMC free article] [PubMed] [Google Scholar]
- Carmignoto G & Vicini S (1992). Activity‐dependent decrease in NMDA receptor responses during development of the visual cortex. Science 258, 1007–1011. [DOI] [PubMed] [Google Scholar]
- Cathala L, Misra C & Cull‐Candy SG (2000). Developmental profile of the changing properties of NMDA receptors at cerebellar mossy fiber‐granule cell synapses. J Neurosci 20, 5899–5905. [DOI] [PMC free article] [PubMed] [Google Scholar]
- Chazot PL & Stephenson FA (1997). Molecular dissection of native mammalian forebrain NMDA receptors containing the NR1 C2 exon: direct demonstration of NMDA receptors comprising NR1, NR2A, and NR2B subunits within the same complex. J Neurochem 69, 2138–2144. [DOI] [PubMed] [Google Scholar]
- Chen C & Okayama H (1987). High‐efficiency transformation of mammalian cells by plasmid DNA. Mol Cell Biol 7, 2745–2752. [DOI] [PMC free article] [PubMed] [Google Scholar]
- Chen W, Shieh C, Swanger SA, Tankovic A, Au M, McGuire M & Traynelis SF (2017). GRIN1 mutation associated with intellectual disability alters NMDA receptor trafficking and function. J Hum Genet 62, 589–597. [DOI] [PMC free article] [PubMed] [Google Scholar]
- Choi DW (1992). Excitotoxic cell death. J Neurobiol 23, 1261–1276. [DOI] [PubMed] [Google Scholar]
- Clements JD, Lester RA, Tong G, Jahr CE & Westbrook GL (1992). .The time course of glutamate in the synaptic cleft. Science 258, 1498–1501. [DOI] [PubMed] [Google Scholar]
- Clements JD & Westbrook GL (1991). Activation kinetics reveal the number of glutamate and glycine binding sites on the N‐methyl‐d‐aspartate receptor. Neuron 7, 605–613. [DOI] [PubMed] [Google Scholar]
- Colquhoun D, Dowsland KA, Beato M & Plested AJ (2004). How to impose microscopic reversibility in complex reaction mechanisms. Biophys J 86, 3510–3518. [DOI] [PMC free article] [PubMed] [Google Scholar]
- Colquhoun D, Hatton CJ & Hawkes AG (2003). The quality of maximum likelihood estimates of ion channel rate constants. J Physiol 547, 699–728. [DOI] [PMC free article] [PubMed] [Google Scholar]
- Colquhoun D & Hawkes AG (1987). A note on correlations in single ion channel records. Proc R Soc Lond B Biol Sci 230, 15–52. [DOI] [PubMed] [Google Scholar]
- Colquhoun D & Hawkes A (1990). Stochastic properties of ion channel openings and bursts in a membrane patch that contains two channels: evidence concerning the number of channels present when a record containing only single openings is observed. Proc R Soc Lond B Biol Sci 240, 453–477. [DOI] [PubMed] [Google Scholar]
- Colquhoun D & Hawkes AG (1994). The interpretation of single channel recordings. In Microelectrode Techniques: The Plymouth Workshop Handbook, 2nd edn, ed. Ogden D, pp. 141–188. The Company of Biologists Ltd, Cambridge, UK. [Google Scholar]
- Colquhoun D & Hawkes AG (1995). A Q‐matrix cookbook In Single‐Channel Recording, 2nd edn, ed. Sakmann B & Neher E, pp. 589–633. Plenum Press, New York. [Google Scholar]
- Colquhoun D, Hawkes AG & Srodzinski K (1996). Joint distributions of apparent open and shut times of single‐ion channels and maximum likelihood fitting of mechanisms. Philos Trans A Math Phys Eng Sci 354, 2555–2590. [Google Scholar]
- Colquhoun D & Sigworth FJ (1995). Fitting and statistical analysis of single‐channel records In Single‐Channel Recording, 2nd edn, ed. Sakmann B & Neher E, pp. 483–587. Plenum Press, New York. [Google Scholar]
- Costa BM, Irvine MW, Fang G, Eaves RJ, Mayo‐Martin MB, Skifter DA, Jane DE & Monaghan DT (2010). A novel family of negative and positive allosteric modulators of NMDA receptors. J Pharmacol Exp Ther 335, 614–621. [DOI] [PMC free article] [PubMed] [Google Scholar]
- Coyle JT (2012). NMDA receptor and schizophrenia: a brief history. Schizophr Bull 38, 920–926. [DOI] [PMC free article] [PubMed] [Google Scholar]
- Cull‐Candy SG & Leszkiewicz DN (2004). Role of distinct NMDA receptor subtypes at central synapses. Sci STKE 2004, re16. [DOI] [PubMed] [Google Scholar]
- Cull‐Candy SG & Usowicz MM (1989). On the multiple‐conductance single channels activated by excitatory amino acids in large cerebellar neurones of the rat. J Physiol 415, 555–582. [DOI] [PMC free article] [PubMed] [Google Scholar]
- Dai J & Zhou HX (2013). An NMDA receptor gating mechanism developed from MD simulations reveals molecular details underlying subunit‐specific contributions. Biophys J 104, 2170–2181. [DOI] [PMC free article] [PubMed] [Google Scholar]
- Delaney AJ, Sedlak PL, Autuori E, Power JM & Sah P (2013). Synaptic NMDA receptors in basolateral amygdala principal neurons are triheteromeric proteins: physiological role of GluN2B subunits. J Neurophysiol 109, 1391–1402. [DOI] [PubMed] [Google Scholar]
- Dravid SM, Prakash A & Traynelis SF (2008). Activation of recombinant NR1/NR2C NMDA receptors. J Physiol 586, 4425–4439. [DOI] [PMC free article] [PubMed] [Google Scholar]
- Dunah AW, Luo J, Wang YH, Yasuda RP & Wolfe BB (1998). Subunit composition of N‐methyl‐d‐aspartate receptors in the central nervous system that contain the NR2D subunit. Mol Pharmacol 53, 429–437. [DOI] [PubMed] [Google Scholar]
- Edgar RC (2004). MUSCLE: a multiple sequence alignment method with reduced time and space complexity. BMC Bioinformatics 5, 113. [DOI] [PMC free article] [PubMed] [Google Scholar]
- Endele S, Rosenberger G, Geider K, Popp B, Tamer C, Stefanova I & Pientka FK (2010). Mutations in GRIN2A and GRIN2B encoding regulatory subunits of NMDA receptors cause variable neurodevelopmental phenotypes. Nat Genet 42, 1021–1026. [DOI] [PubMed] [Google Scholar]
- Erreger K, Chen PE, Wyllie DJ & Traynelis SF (2004). Glutamate receptor gating. Crit Rev Neurobiol 16, 187–224. [DOI] [PubMed] [Google Scholar]
- Erreger K, Dravid SM, Banke TG, Wyllie DJ & Traynelis SF (2005). Subunit‐specific gating controls rat NR1/NR2A and NR1/NR2B NMDA channel kinetics and synaptic signalling profiles. J Physiol 563, 345–358. [DOI] [PMC free article] [PubMed] [Google Scholar]
- Erreger K, Geballe MT, Kristensen AS, Chen PE, Hansen KB, Lee CJ, Yuan H, Le P, Lyuboslavsky PN, Micale N, Jørgensen L, Clausen RP, Wyllie DJ, Snyder JP & Traynelis SF (2007). Subunit‐specific agonist activity at NR2A, NR2B, NR2C, and NR2D containing N‐methyl‐d‐aspartate glutamate receptors. Mol Pharmacol 72, 907–920. [DOI] [PubMed] [Google Scholar]
- Erreger K & Traynelis SF (2005). Allosteric interaction between zinc and glutamate binding domains on NR2A causes desensitization of NMDA receptors. J Physiol 569, 381–393. [DOI] [PMC free article] [PubMed] [Google Scholar]
- Erreger K & Traynelis SF (2008). Zinc inhibition of rat NR1/NR2A N‐methyl‐d‐aspartate receptors. J Physiol 586, 763–778. [DOI] [PMC free article] [PubMed] [Google Scholar]
- Flint AC, Maisch US, Weishaupt JH, Kriegstein AR & Monyer H (1997). NR2A subunit expression shortens NMDA receptor synaptic currents in developing neocortex. J Neurosci 17, 2469–2476. [DOI] [PMC free article] [PubMed] [Google Scholar]
- Froemke RC, Letzkus JJ, Kampa BM, Hang GB & Stuart GJ (2010). Dendritic synapse location and neocortical spike‐timing‐dependent plasticity. Front Synaptic Neurosci 2, 29. [DOI] [PMC free article] [PubMed] [Google Scholar]
- Furukawa H & Gouaux E (2003). Mechanisms of activation, inhibition and specificity: crystal structures of NR1 ligand‐binding core. EMBO J 22, 1–13. [DOI] [PMC free article] [PubMed] [Google Scholar]
- Furukawa H, Singh SK, Mancusso R & Gouaux E (2005). Subunit arrangement and function in NMDA receptors. Nature 438, 185–192. [DOI] [PubMed] [Google Scholar]
- Gibb AJ & Colquhoun D (1992). Activation of N‐methyl‐d‐aspartate receptors by L‐glutamate in cells issociated from adult rat hippocampus. J Physiol 456, 143–179. [DOI] [PMC free article] [PubMed] [Google Scholar]
- Gielen M, Le Goff A, Stroebel D, Johnson JW, Neyton J & Paoletti P (2008). Structural rearrangements of NR1/NR2A NMDA receptors during allosteric inhibition. Neuron 57, 80–93. [DOI] [PMC free article] [PubMed] [Google Scholar]
- Gielen M, Siegler Retchless B, Mony L, Johnson JW & Paoletti P (2009). Mechanism of differential control of NMDA receptor activity by NR2 subunits. Nature 459, 703–707. [DOI] [PMC free article] [PubMed] [Google Scholar]
- Glasgow NG, Siegler Retchless B & Johnson JW (2015). Molecular bases of NMDA receptor subtype‐dependent properties. J Physiol 593, 83–95. [DOI] [PMC free article] [PubMed] [Google Scholar]
- Golub GH & Van Loan CF (1989). Matrix Computations. Johns Hopkins University Press, Baltimore. [Google Scholar]
- Hackos DH, Lupardus PJ, Grand T, Chen Y, Wang TM, Reynen P, Gustafson A, Wallweber HJ, Volgraf M, Sellers BD, Schwarz JB, Paoletti P, Sheng M, Zhou Q & Hanson JE (2016). Positive allosteric modulators of GluN2A‐containing NMDARs with distinct modes of action and impacts on circuit function. Neuron 89, 983–999. [DOI] [PubMed] [Google Scholar]
- Hallett PJ & Standaert DG (2004). Rationale for and use of NMDA receptor antagonists in Parkinson's disease. Pharmacol Ther 102, 155–174. [DOI] [PubMed] [Google Scholar]
- Hansen KB, Ogden KK & Traynelis SF (2012). Subunit‐selective allosteric inhibition of glycine binding to NMDA receptors. J Neurosci 32, 6197–6208. [DOI] [PMC free article] [PubMed] [Google Scholar]
- Hansen KB, Ogden KK, Yuan H & Traynelis SF (2014). Distinct functional and pharmacological properties of triheteromeric GluN1/GluN2A/GluN2B NMDA receptors. Neuron 81, 1084–1096. [DOI] [PMC free article] [PubMed] [Google Scholar]
- Hansen KB, Tajima N, Risgaard R, Perszyk RE, Jørgensen L, Vance KM, Ogden KK, Clausen RP, Furukawa H & Traynelis SF (2013). Structural determinants of agonist efficacy at the glutamate binding site of N‐methyl‐d‐aspartate receptors. Mol Pharmacol 84, 114–127. [DOI] [PMC free article] [PubMed] [Google Scholar]
- Hao J & Oertner TG (2012). Depolarization gates spine calcium transients and spike‐timing‐dependent potentiation. Curr Opin Neurobiol 22, 509–515. [DOI] [PubMed] [Google Scholar]
- Hatton CJ & Paoletti P (2005). Modulation of triheteromeric NMDA receptors by N‐terminal domain ligands. Neuron 46, 261–274. [DOI] [PubMed] [Google Scholar]
- Hawkes AG, Jalali A & Colquhoun D (1990). The distributions of the apparent open times and shut times in a single channel record when brief events cannot be detected. Philos Trans A Math Phys Eng Sci 332, 511–538 [DOI] [PubMed] [Google Scholar]
- Hawkes AG, Jalali A & Colquhoun D (1992). Asymptotic distributions of apparent open times and shut times in a single channel record allowing for the omission of brief events. Phil Trans R Soc Lond B Biol Sci 337, 383–404. [DOI] [PubMed] [Google Scholar]
- Hestrin S (1992). Developmental regulation of NMDA receptor‐mediated synaptic currents at a central synapse. Nature 357, 686–689. [DOI] [PubMed] [Google Scholar]
- Horn R (1987). Statistical methods for model discrimination. Applications to gating kinetics and permeation of the acetylcholine receptor channel. Biophys J 51, 255–263. [DOI] [PMC free article] [PubMed] [Google Scholar]
- Howe JR, Cull‐Candy SG & Colquhoun D (1991). Currents through single glutamate receptor channels in outside‐out patches from rat cerebellar granule cells. J Physiol 432, 143–202. [DOI] [PMC free article] [PubMed] [Google Scholar]
- Hu C, Chen W, Myers SJ, Yuan H & Traynelis SF (2016). Human GRIN2B variants in neurodevelopmental disorders. J Pharmacol Sci 132, 115–121. [DOI] [PMC free article] [PubMed] [Google Scholar]
- Huang Z & Gibb AJ (2014). Mg2+ block properties of triheteromeric GluN1–GluN2B–GluN2D NMDA receptors on neonatal rat substantia nigra pars compacta dopaminergic neurones. J Physiol 592, 2059–2078. [DOI] [PMC free article] [PubMed] [Google Scholar]
- Humphrey W, Dalke A & Schulten K (1996). VMD: visual molecular dynamics. J Mol Graph 14, 33–38.</bib> [DOI] [PubMed] [Google Scholar]
- Hünenberger PH, Mark AE & van Gunsteren WF (1995). Fluctuation and cross‐correlation analysis of protein motions observed in nanosecond molecular dynamics simulations. J Mol Biol 252, 492–503. [DOI] [PubMed] [Google Scholar]
- Iacobucci GJ & Popescu GK (2017). NMDA receptors: linking physiological output to biophysical operation. Nat Rev Neurosci 18, 236–249. [DOI] [PMC free article] [PubMed] [Google Scholar]
- Inanobe A, Furukawa H & Gouaux E (2005). Mechanism of partial agonist action at the NR1 subunit of NMDA receptors. Neuron 47, 71–84. [DOI] [PubMed] [Google Scholar]
- Jahr CE & Stevens C (1987). Glutamate activates multiple single channel conductances in hippocampal neurons. Nature 325, 522–525. [DOI] [PubMed] [Google Scholar]
- Jalali A & Hawkes AG (1992). Generalised eigenproblems arising in aggregated Markov processes allowing for time interval omission. Adv Appl Probab 24, 302–321. [Google Scholar]
- Jones S & Gibb AJ (2005). Functional NR2B‐ and NR2D‐containing NMDA receptor channels in rat substantia nigra dopaminergic neurones. J Physiol 569, 209–221. [DOI] [PMC free article] [PubMed] [Google Scholar]
- Kantrowitz JT & Javitt DC (2010). N‐methyl‐d‐aspartate (NMDA) receptor dysfunction or dysregulation: the final common pathway on the road to schizophrenia? Brain Res Bull 83, 108–121. [DOI] [PMC free article] [PubMed] [Google Scholar]
- Karakas E & Furukawa H (2014). Crystal structure of a heterotetrameric NMDA receptor ion channel. Science 344, 992–997. [DOI] [PMC free article] [PubMed] [Google Scholar]
- Karakas E, Regan MC & Furukawa H (2015). Emerging structural insights into the function of ionotropic glutamate receptors. Trends Biochem Sci 40, 328–337. [DOI] [PMC free article] [PubMed] [Google Scholar]
- Karakas E, Simorowski N & Furukawa H (2011). Subunit arrangement and phenylethanolamine binding in GluN1/GluN2B NMDA receptors. Nature 475, 249–253. [DOI] [PMC free article] [PubMed] [Google Scholar]
- Kazi R, Dai J, Sweeney C, Zhou HX & Wollmuth LP (2014). Mechanical coupling maintains the fidelity of NMDA receptor‐mediated currents. Nat Neurosci 17, 914–922. [DOI] [PMC free article] [PubMed] [Google Scholar]
- Kazi R, Gan Q, Talukder I, Markowitz M, Salussolia CL & Wollmuth LP (2013). Asynchronous movements prior to pore opening in NMDA receptors. J Neurosci 33, 12052–12066. [DOI] [PMC free article] [PubMed] [Google Scholar]
- Kew J, Trube G & Kemp J (1996). A novel mechanism of activity‐dependent NMDA receptor antagonism describes the effect of ifenprodil in rat cultured cortical neurones. J Physiol 497, 761–772. [DOI] [PMC free article] [PubMed] [Google Scholar]
- Khatri A, Burger PB, Swanger SA, Hansen KB, Zimmerman S, Karakas E & Traynelis SF (2014). Structural determinants and mechanism of action of a GluN2C‐selective NMDA receptor positive allosteric modulator. Mol Pharmacol 86, 548–560. [DOI] [PMC free article] [PubMed] [Google Scholar]
- Laskowski RA (2009). PDBsum new things. Nucleic Acids Res 37, D355–D359. [DOI] [PMC free article] [PubMed] [Google Scholar]
- Lee C‐H, Lu W, Michel JC, Goehring A, Du J, Song X & Gouaux E (2014). NMDA receptor structures reveal subunit arrangement and pore architecture. Nature 511, 191–197. [DOI] [PMC free article] [PubMed] [Google Scholar]
- Lemke JR, Lal D, Reinthaler EM, Steiner I, Nothnagel M, Alber M, Geider K, Laube B, Schwake M, Finsterwalder K, Franke A, Schilhabel M, Jähn JA, Muhle H, Boor R, Van Paesschen W, Caraballo R, Fejerman N, Weckhuysen S, De Jonghe P, Larsen J, Møller RS, Hjalgrim H, Addis L, Tang S, Hughes E, Pal DK, Veri K, Vaher U, Talvik T, Dimova P, Guerrero López R, Serratosa JM, Linnankivi T, Lehesjoki AE, Ruf S, Wolff M, Buerki S, Wohlrab G, Kroell J, Datta AN, Fiedler B, Kurlemann G, Kluger G, Hahn A, Haberlandt DE, Kutzer C, Sperner J, Becker F, Weber YG, Feucht M, Steinböck H, Neophythou B, Ronen GM, Gruber‐Sedlmayr U, Geldner J, Harvey RJ, Hoffmann P, Herms S, Altmüller J, Toliat MR, Thiele H, Nürnberg P, Wilhelm C, Stephani U, Helbig I, Lerche H, Zimprich F, Neubauer BA, Biskup S & von Spiczak S (2013). Mutations in GRIN2A cause idiopathic focal epilepsy with rolandic spikes. Nat Genet 45, 1067–1072. [DOI] [PubMed] [Google Scholar]
- Lesca G, Rudolf G, Bruneau N, Lozovaya N, Labalme A, Boutry‐Kryza N, Salmi M, Tsintsadze T, Addis L, Motte J, Wright S, Tsintsadze V, Michel A, Doummar D, Lascelles K, Strug L, Waters P, de Bellescize J, Vrielynck P, de Saint Martin A, Ville D, Ryvlin P, Arzimanoglou A, Hirsch E, Vincent A, Pal D, Burnashev N, Sanlaville D & Szepetowski P (2013). GRIN2A mutations in acquired epileptic aphasia and related childhood focal epilepsies and encephalopathies with speech and language dysfunction. Nat Genet 45, 1061–1066. [DOI] [PubMed] [Google Scholar]
- Lester RA, Clements JD, Westbrook GL & Jahr CE (1990). Channel kinetics determine the time course of NMDA receptor‐mediated synaptic currents. Nature 346, 565–567. [DOI] [PubMed] [Google Scholar]
- Lester RA & Jahr CE (1992). NMDA channel behavior depends on agonist affinity. J Neurosci 12, 635–643. [DOI] [PMC free article] [PubMed] [Google Scholar]
- Li D, Yuan H, Ortiz‐Gonzalez XR, Marsh ED, Tian L, McCormick EM, Kosobucki GJ, Chen W, Schulien AJ, Chiavacci R, Tankovic A, Naase C, Brueckner F, von Stülpnagel‐Steinbeis C, Hu C, Kusumoto H, Hedrich UB, Elsen G, Hörtnagel K, Aizenman E, Lemke JR, Hakonarson H, Traynelis SF & Falk MJ (2016). GRIN2D recurrent de novo dominant mutation causes a severe epileptic encephalopathy treatable with NMDA receptor channel blockers. Am J Hum Genet 99, 802–816. [DOI] [PMC free article] [PubMed] [Google Scholar]
- Lu C, Fu Z, Karavanov I, Yasuda RP, Wolfe BB, Buonanno A & Vicini S (2006). NMDA receptor subtypes at autaptic synapses of cerebellar granule neurons. J Neurophysiol 96, 2282–2294. [DOI] [PubMed] [Google Scholar]
- Lu HC, Gonzalez E & Crair MC (2001). Barrel cortex critical period plasticity is independent of changes in NMDA receptor subunit composition. Neuron 32, 619–634. [DOI] [PubMed] [Google Scholar]
- Lü W, Du J, Goehring A & Gouaux E (2017). Cryo‐EM structures of the triheteromeric NMDA receptor and its allosteric modulation. Science 355, eaal3729. [DOI] [PMC free article] [PubMed] [Google Scholar]
- Magleby KL (2003). Gating mechanism of BK (Slo1) channels: so near, yet so far. J Gen Physiol 121, 81–96. [DOI] [PMC free article] [PubMed] [Google Scholar]
- Markram H, Gerstner W & Sjöström PJ (2012). Spike‐timing‐dependent plasticity: a comprehensive overview. Front Synaptic Neurosci 4, 2. [DOI] [PMC free article] [PubMed] [Google Scholar]
- Markram H, Lubke J, Frotscher M & Sakmann B (1997). Regulation of synaptic efficacy by coincidence of postsynaptic APs and EPSPs. Science 275, 213–215. [DOI] [PubMed] [Google Scholar]
- Mayer ML (2017). The challenge of interpreting glutamate‐receptor ion‐channel structures Biophys J 113, 2143–2151. [DOI] [PMC free article] [PubMed] [Google Scholar]
- Mayer ML, Vyklicky L Jr & Clements J (1989). Regulation of NMDA receptor desensitization in mouse hippocampal neurons by glycine. Nature 338, 425–427. [DOI] [PubMed] [Google Scholar]
- Mesbahi‐Vasey S, Veras L, Yonkunas M, Johnson JW & Kurnikova MG (2017). All atom NMDA receptor transmembrane domain model development and simulations in lipid bilayers and water. PLoS One 12, e0177686. [DOI] [PMC free article] [PubMed] [Google Scholar]
- Meyerson JR, Kumar J, Chittori S, Rao P, Pierson J, Bartesaghi A, Mayer ML & Subramaniam S (2014). Structural mechanism of glutamate receptor activation and desensitization. Nature 514, 328–334. [DOI] [PMC free article] [PubMed] [Google Scholar]
- Mosley CA, Acker TM, Hansen KB, Mullasseril P, Andersen KT, Le P, Vellano KM, Bräuner‐Osborne H, Liotta DC & Traynelis SF (2010). Quinazolin‐4‐one derivatives: A novel class of noncompetitive NR2C/D subunit‐selective N‐methyl‐d‐aspartate receptor antagonists. J Med Chem 53, 5476–5490. [DOI] [PMC free article] [PubMed] [Google Scholar]
- Mullasseril P, Hansen KB, Vance KM, Ogden KK, Yuan H, Kurtkaya NL, Santangelo R, Orr AG, Le P, Vellano KM, Liotta DC & Traynelis SF (2010). A subunit‐selective potentiator of NR2C‐and NR2D‐containing NMDA receptors. Nat Commun 1, 90. [DOI] [PMC free article] [PubMed] [Google Scholar]
- Nahum‐Levy R, Lipinski D, Shavit S & Benveniste M (2001). Desensitization of NMDA receptor channels is modulated by glutamate agonists. Biophys J 80, 2152–2166. [DOI] [PMC free article] [PubMed] [Google Scholar]
- Nevian T & Sakmann B (2004). Single spine Ca2+ signals evoked by coincident EPSPs and backpropagating action potentials in spiny stellate cells of layer 4 in the juvenile rat somatosensory barrel cortex. J Neurosci 24, 1689–1699. [DOI] [PMC free article] [PubMed] [Google Scholar]
- Ogden KK, Chen W, Swanger SA, McDaniel MJ, Fan LZ, Hu C, Tankovic A, Kusumoto H, Kosobucki GJ, Schulien AJ, Su Z, Pecha J, Bhattacharya S, Petrovski S, Cohen AE, Aizenman E, Traynelis SF & Yuan H (2017). Molecular mechanism of disease‐associated mutations in the pre‐M1 helix of NMDA receptors and potential rescue pharmacology. PLoS Genet 13, e1006536. [DOI] [PMC free article] [PubMed] [Google Scholar]
- Ogden KK & Traynelis SF (2013). Contribution of the M1 transmembrane helix and pre‐M1 region to positive allosteric modulation and gating of N‐methyl‐d‐aspartate receptors. Mol Pharmacol 83, 1045–1056. [DOI] [PMC free article] [PubMed] [Google Scholar]
- Palmer GC (2001). Neuroprotection by NMDA receptor antagonists in a variety of neuropathologies. Curr Drug Targets 2, 241–271. [DOI] [PubMed] [Google Scholar]
- Paoletti P, Bellone C & Zhou Q (2013). NMDA receptor subunit diversity: impact on receptor properties, synaptic plasticity and disease. Nat Rev Neurosci 14, 383–400. [DOI] [PubMed] [Google Scholar]
- Paramo T, Brown PMGE, Musgaard M, Bowie D & Biggin PC (2017). Functional validation of heteromeric kainate receptor models. Biophys J 113, 2173–2177. [DOI] [PMC free article] [PubMed] [Google Scholar]
- Parsons MP & Raymond LA (2014). Extrasynaptic NMDA receptor involvement in central nervous system disorders. Neuron 82, 279–293. [DOI] [PubMed] [Google Scholar]
- Popescu G & Auerbach A (2003). Modal gating of NMDA receptors and the shape of their synaptic response. Nat Neurosci 5, 476–483. [DOI] [PubMed] [Google Scholar]
- Popescu G, Robert A, Howe JR & Auerbach A (2004). Reaction mechanism determines NMDA receptor response to repetitive stimulation. Nature 430, 790–793. [DOI] [PubMed] [Google Scholar]
- Preskorn SH, Baker B, Kolluri S, Menniti FS, Krams M & Landen JW (2008). An innovative design to establish proof of concept of the antidepressant effects of the NR2B subunit selective N‐methyl‐D‐aspartate antagonist, CP‐101,606, in patients with treatment‐refractory major depressive disorder. J Clin Psychopharmacol 28, 631–637. [DOI] [PubMed] [Google Scholar]
- Preskorn S, Macaluso M, Mehra DV, Zammit G, Moskal JR & Burch RM; GLYX‐13 Clinical Study Group (2015). Randomized proof of concept trial of GLYX‐13, an N‐methyl‐D‐aspartate receptor glycine site partial agonist, in major depressive disorder nonresponsive to a previous antidepressant agent. J Psychiatr Pract 21, 140–149. [DOI] [PubMed] [Google Scholar]
- Prybylowski K, Fu Z, Losi G, Hawkins LM, Luo J, Chang K, Wenthold RJ & Vicini S (2002). Relationship between availability of NMDA receptor subunits and their expression at the synapse. J Neurosci 22, 8902–8910. [DOI] [PMC free article] [PubMed] [Google Scholar]
- Qin F, Auerbach A & Sachs F (1996). Estimating single‐channel kinetic parameters from idealized patch clamp data containing missed events. Biophys J 70, 264–280. [DOI] [PMC free article] [PubMed] [Google Scholar]
- Qin F, Auerbach A & Sachs F (1997). Maximum likelihood estimation of aggregated Markov processes. Proc Biol Sci 264, 375–383. [DOI] [PMC free article] [PubMed] [Google Scholar]
- Rauner C & Köhr G (2011). Triheteromeric NR1/NR2A/NR2B receptors constitute the major N‐methyl‐d‐aspartate receptor population in adult hippocampal synapses. J Biol Chem 286, 7558–7566. [DOI] [PMC free article] [PubMed] [Google Scholar]
- Reiner A, Arant RJ & Isacoff EY (2012). Assembly stoichiometry of the GluK2 /GluK5 kainate receptor complex. Cell Rep 1, 234–240. [DOI] [PMC free article] [PubMed] [Google Scholar]
- Riou M, Stroebel D, Edwardson JM & Paoletti P (2012). An alternating GluN1‐2‐1‐2 subunit arrangement in mature NMDA receptors. PLoS One 7, e35134. [DOI] [PMC free article] [PubMed] [Google Scholar]
- Rosenmund C, Stern‐Bach Y & Stevens CF (1998).The tetrameric structure of a glutamate receptor channel. Science 280, 1596–1599. [DOI] [PubMed] [Google Scholar]
- Ross CA, Margolis RL, Reading SA, Pletnikov M & Coyle JT (2006). Neurobiology of schizophrenia. Neuron 52, 139–153. [DOI] [PubMed] [Google Scholar]
- Ruiz M, Karpen JW (1999). Opening mechanism of a cyclic nucleotide‐gated channel based on analysis of single channels locked in each liganded state. J Gen Physiol 113, 873–895. [DOI] [PMC free article] [PubMed] [Google Scholar]
- Sali A & Blundel TL (1993). Comparative protein modelling by satisfaction of spatial restraints. J Mol Biol 234, 779–815. [DOI] [PubMed] [Google Scholar]
- Salussolia CL, Prodromou ML, Borker P & Wollmuth LP (2011). Arrangement of subunits in functional NMDA receptors. J Neurosci 31, 11295–11304. [DOI] [PMC free article] [PubMed] [Google Scholar]
- Santangelo Freel RM, Ogden KK, Strong KL, Khatri A, Chepiga KM, Jensen HS, Traynelis SF & Liotta DC (2013). Synthesis and structure activity relationship of tetrahydroisoquinoline‐based potentiators of GluN2C and GluN2D containing N‐methyl‐d‐aspartate receptors. J Med Chem 56, 5351–5381. [DOI] [PMC free article] [PubMed] [Google Scholar]
- Sather W, Johnson J, Henderson G & Ascher P (1990). Glycine‐insensitive desensitization of NMDA responses in cultured mouse embryonic neurons. Neuron 4, 725–731. [DOI] [PubMed] [Google Scholar]
- Schorge S, Elenes S & Colquhoun D (2005). Maximum likelihood fitting of single channel NMDA activity with a mechanism composed of independent dimers of subunits. J Physiol 569, 395–418. [DOI] [PMC free article] [PubMed] [Google Scholar]
- Sheng M, Cummings J, Roldan LA, Jan YN & Jan LY (1994). Changing subunit composition of heteromeric NMDA receptors during development of rat cortex. Nature 368, 144–147. [DOI] [PubMed] [Google Scholar]
- Sobolevsky AI, Rosconi MP & Gouaux E (2009). X‐ray structure, symmetry and mechanism of an AMPA‐subtype glutamate receptor. Nature 462, 745–756. [DOI] [PMC free article] [PubMed] [Google Scholar]
- Stroebel D, Buhl DL, Knafels JD, Chanda PK, Green M, Sciabola S, Mony L, Paoletti P & Pandit J (2016). A novel binding mode reveals two distinct classes of NMDA receptor GluN2B‐selective antagonists. Mol Pharmacol 89, 541–551. [DOI] [PMC free article] [PubMed] [Google Scholar]
- Stroebel D, Carvalho S, Grand T, Zhu S & Paoletti P (2014). Controlling NMDA receptor subunit composition using ectopic retention signals. J Neurosci 34, 16630–16636. [DOI] [PMC free article] [PubMed] [Google Scholar]
- Strong KL, Epplin MP, Bacsa J, Butch CJ, Burger PB, Menaldino DS, Traynelis SF & Liotta DC (2017). The structure‐activity relationship of a tetrahydroisoquinoline class of N‐methyl–aspartate receptor modulators that potentiates GluN2B‐containing N‐methyl‐d‐aspartate receptors. J Med Chem 60, 5556–5585. [DOI] [PMC free article] [PubMed] [Google Scholar]
- Sun W, Hansen KB & Jahr CE (2017). Allosteric interactions between NMDA receptor subunits shape the developmental shift in channel properties. Neuron 94, 58–64. [DOI] [PMC free article] [PubMed] [Google Scholar]
- Sun Y, Olson R, Horning M, Armstrong N, Mayer M & Gouaux E (2002). Mechanism of glutamate receptor desensitization. Nature 417, 245–253. [DOI] [PubMed] [Google Scholar]
- Swanger SA, Vance KM, Acker TM, Zimmerman SS, DiRaddo JO, Myers SJ, Bundgaard C, Mosley CA, Summer SL, Menaldino DS, Jensen HS, Liotta DC & Traynelis SF (2018). A novel negative allosteric modulator selective for GluN2C/2D‐containing NMDA receptors inhibits synaptic transmission in hippocampal interneurons. ACS Chem Neurosci 9, 306–319. [DOI] [PMC free article] [PubMed] [Google Scholar]
- Swanger SA, Vance KM, Pare JF, Sotty F, Fog K, Smith Y & Traynelis SF (2015). NMDA receptors containing the GluN2D subunit control neuronal function in the subthalamic nucleus. J Neurosci 35, 15971–15983. [DOI] [PMC free article] [PubMed] [Google Scholar]
- Swanger SA, Chen W, Wells G, Burger PB, Tankovic A, Bhattacharya S, Strong KL, Hu C, Kusumoto H, Zhang J, Adams DR, Millichap JJ, Petrovski S, Traynelis SF & Yuan H (2016). Mechanistic insight into NMDA receptor dysregulation by rare variants in the GluN2A and GluN2B agonist binding domains. Am J Hum Genet 99, 1261–1280. [DOI] [PMC free article] [PubMed] [Google Scholar]
- Tajima N, Karakas E, Grant T, Simorowski N, Diaz‐Avalos R, Grigorieff N & Furukawa H (2016). Activation of NMDA receptors and the mechanism of inhibition by ifenprodil. Nature 534, 63–68. [DOI] [PMC free article] [PubMed] [Google Scholar]
- Talukder I, Borker P & Wollmuth LP (2010). Specific sites within the ligand‐binding domain and ion channel linkers modulate NMDA receptor gating. J Neurosci 30, 11792–11804. [DOI] [PMC free article] [PubMed] [Google Scholar]
- Talukder I & Wollmuth LP (2011). Local constraints in either the GluN1 or GluN2 subunit equally impair NMDA receptor pore opening. J Gen Physiol 138, 179–194. [DOI] [PMC free article] [PubMed] [Google Scholar]
- Tong G, Shepherd D & Jahr CE (1995). Synaptic desensitization of NMDA receptors by calcineurin. Science 267, 1510–1512. [DOI] [PubMed] [Google Scholar]
- Tovar KR, McGinley MJ & Westbrook GL (2013). Triheteromeric NMDA receptors at hippocampal synapses. J Neurosci 33, 9150–9160. [DOI] [PMC free article] [PubMed] [Google Scholar]
- Traynelis SF, Silver RA & Cull‐Candy SG (1993). Estimated conductance of glutamate receptor channels activated during EPSCs at the cerebellar mossy fiber‐granule cell synapse. Neuron 11, 279–289. [DOI] [PubMed] [Google Scholar]
- Traynelis SF, Wollmuth LP, McBain CJ, Menniti FS, Vance KM, Ogden KK, Hansen KB, Yuan H, Myers SJ & Dingledine R (2010). Glutamate receptor ion channels: structure, regulation, and function. Pharmacol Rev 62, 405–496. [DOI] [PMC free article] [PubMed] [Google Scholar]
- Twomey EC & Sobolevsky AI (2017). Structural mechanisms of gating in ionotropic glutamate receptors. Biochemistry 57, 267–276 [DOI] [PMC free article] [PubMed] [Google Scholar]
- Twomey EC, Yelshanskaya MV, Grassucci RA, Frank J & Sobolevsky AI (2017). Channel opening and gating mechanism in AMPA‐subtype glutamate receptors. Nature 549, 60–65. [DOI] [PMC free article] [PubMed] [Google Scholar]
- Vance KM, Simorowski N, Traynelis SF & Furukawa H (2011). Ligand‐specific deactivation time course of GluN1/GluN2D NMDA receptors. Nat Commun 2, 294. [DOI] [PMC free article] [PubMed] [Google Scholar]
- Vicini S, Wang JF, Li JH, Zhu WJ, Wang YH, Luo JH, Wolfe BB & Grayson DR (1998). Functional and pharmacological differences between recombinant N‐methyl‐d‐aspartate receptors. J Neurophysiol 79, 555–566. [DOI] [PubMed] [Google Scholar]
- Vyklický L Jr, Benveniste M & Mayer ML (1990). Modulation of N‐methyl‐d‐aspartic acid receptor desensitization by glycine in mouse cultured hippocampal neurones. J Physiol 428, 313–331. [DOI] [PMC free article] [PubMed] [Google Scholar]
- Wyllie DJ, Behe P & Colquhoun D (1998). Single‐channel activations and concentration jumps: comparison of recombinant NR1a/NR2A and NR1a/NR2D NMDA receptors. J Physiol 510, 1–18. [DOI] [PMC free article] [PubMed] [Google Scholar]
- Wyllie DJ, Johnston AR, Lipscombe D & Chen PE (2006). Single‐channel analysis of a point mutation of a conserved serine residue in the S2 ligand‐binding domain of the NR2A NMDA receptor subunit. J Physiol 574, 477–489. [DOI] [PMC free article] [PubMed] [Google Scholar]
- Wyllie DJ, Livesey MR & Hardingham GE (2013). Influence of GluN2 subunit identity on NMDA receptor function. Neuropharmacology 74, 4–17. [DOI] [PMC free article] [PubMed] [Google Scholar]
- Yi F, Mou TC, Dorsett KN, Volkmann RA, Menniti FS, Sprang SR & Hansen KB (2016). Structural basis for negative allosteric modulation of GluN2A‐containing NMDA receptors. Neuron 91, 1316–1329. [DOI] [PMC free article] [PubMed] [Google Scholar]
- Yuan H, Hansen KB, Vance KM, Ogden KK & Traynelis SF (2009). Control of NMDA receptor function by the NR2 subunit amino‐terminal domain. J Neurosci 29, 12045–12058. [DOI] [PMC free article] [PubMed] [Google Scholar]
- Yuan H, Hansen KB, Zhang J, Pierson TM, Markello TC, Fajardo KV, Holloman CM, Golas G, Adams DR, Boerkoel CF, Gahl WA & Traynelis SF (2014). Functional analysis of a de novo GRIN2A missense mutation associated with early‐onset epileptic encephalopathy. Nat Commun 5, 3251. [DOI] [PMC free article] [PubMed] [Google Scholar]
- Yuan H, Low C‐M, Moody OA, Jenkins A & Traynelis SF (2015). Ionotropic GABA and glutamate receptor mutations and human neurologic diseases. Mol Pharmacol 88, 203–217. [DOI] [PMC free article] [PubMed] [Google Scholar]
- Zhang W, Howe JR & Popescu GK (2008). Distinct gating modes determine the biphasic relaxation of NMDA receptor currents. Nat Neurosci 11, 1373–1375. [DOI] [PMC free article] [PubMed] [Google Scholar]
- Zheng F, Erreger K, Low CM, Banke T, Lee CJ, Conn PJ & Traynelis SF (2001). Allosteric interaction between the amino terminal domain and the ligand binding domain of NR2A. Nat Neurosci 4, 894–901. [DOI] [PubMed] [Google Scholar]
- Zhou HX & Wollmuth LP (2017). Advancing NMDA receptor physiology by integrating multiple approaches. Trends Neurosci 40, 129–137. [DOI] [PMC free article] [PubMed] [Google Scholar]
- Zhu S, Stein RA, Yoshioka C, Lee CH, Goehring A, Mchaourab HS & Gouaux E (2016). Mechanism of NMDA receptor inhibition and activation. Cell 165, 704–714. [DOI] [PMC free article] [PubMed] [Google Scholar]
- Zhu S, Stroebel D, Yao CA, Taly A & Paoletti P (2013). Allosteric signaling and dynamics of the clamshell‐like NMDA receptor GluN1 N‐terminal domain. Nat Struct Mol Biol 20, 477–485. [DOI] [PubMed] [Google Scholar]