Abstract
An on-demand, closed RT-qPCR, the GeneXpert (GX) system, has the potential to provide biomarker information in low resourced settings and elsewhere. We used this system with a research use only version of the Breast Cancer STRAT4 cartridge that measures the mRNA expression levels of ERBB2, ESR1, PGR and MKi67. Here we evaluated the impact of non-macrodissected (non m-d) versus macrodissected (m-d) samples using STRAT4 on formalin-fixed, paraffin-embedded (FFPE) core needle biopsies. Two cohorts were assessed: 1) 60 FFPE infiltrating ductal carcinoma (IDCA) cases and 2) 20 FFPE IDCA cases with ductal carcinoma in situ (DCIS) with a range of HER2 expression as determined by clinical immunohistochemistry and fluorescence in situ hybridization (IHC/FISH). We observed about half of the core needle biopsy area as invasive tumor in both IDCA (mean = 51.5%) and IDCA with DCIS (mean = 53.5%) cohorts, but also found the mRNA levels were independent of tumor area. We found excellent agreement of the mRNA transcript level between the paired samples, m-d versus non m-d, for ERBB2, ESR1, PGR and MKi67 for both the IDCA and IDCA with DCIS cohorts. No significant difference (P > 0.99) was observed when we compared the mRNA transcript level between the paired samples m-d versus non m-d. In addition we noted a significant concordance (P < 0.001) between RT-qPCR and IHC/FISH for HER2-positivity, ER-positivity and PR-positivity, independent of specimen dissection. These data suggest that mRNA expression for ERBB2, ESR and PGR is sufficiently low in surrounding tissue cells such that macrodissection is not required for assessment of key breast cancer mRNA markers and is independent of the amount of input tumor. This approach may be valuable in settings lacking pathology expertise or using specimen types, such as fine needle aspirates, where it may be challenging to separate non-tumor from tumor tissue.
INTRODUCTION
Breast cancer is one of the most common cancers in women worldwide in both developing and developed countries.1, 2 Worldwide, newly diagnosed breast cancer cases are estimated at approximately 1.7 million annually, with the highest numbers observed in Europe (30%) and the US (12%).2 Over the years, breast cancer mortality in the developed world has decreased by 36% due to improved treatment and early detection.3 Overexpression of human epidermal growth factor (HER2/ERBB2) at the gene and protein level is a standard of care in the US and Europe for breast cancer patients since it is predictive of response to HER2-targeted therapies.4, 5 Estrogen receptor (ESR/ESR1) and progesterone receptor (PGR/PGR) are prognostic factors for aggressive disease and predict response to tamoxifen and other hormonal therapies.6–9
The measurement of HER2, ER, PR and sometimes Ki-67 protein expression by immunohistochemistry (IHC) represents the standard of care in the clinic. In addition, ERBB2 copy number status is often assessed by fluorescence in situ hybridization (FISH) when HER2 IHC results are equivocal.10 While mRNA is used to assess these same markers as part of the commonly used OncotypeDx test, mRNA is not commonly used as the basis for therapeutic regimen selection, and is not endorsed in the ASCO/CAP guidelines.11 One reason for this is that the in situ value of IHC tests is thought to prevent the false positive tests that might be seen due to contaminating mRNA expression for these key markers in non-tumor tissue.
Here, we determine whether mRNA expression for key breast cancer markers, ERBB2, ESR1, PGR and MKi67, is equivalent in non-macrodissected sections (non m-d) compared with tumor specific macro-dissected sections (m-d) using core needle biopsies with infiltrating ductal carcinoma (IDCA) and IDCA with ductal carcinoma in situ (DCIS) using a real-time quantitative reverse transcription polymerase chain reaction (RT-qPCR) assay (GeneXpert® Breast Cancer STRAT4 RUO Assay, Cepheid, Sunnyvale, CA, USA). Additionally, we assessed the correlation between RT-qPCR and clinically determined immunohistochemistry (IHC)/ fluorescence in situ hybridization (FISH) for HER2-positivity, ER-positivity and PgR-positivity in the paired samples, non m-d versus m-d.
MATERIALS AND METHODS
Patient and tissues
Breast carcinoma patient cohorts were selected by screening the tumor bank of Yale University for 60 FFPE IDCA and 20 FFPE IDCA with DCIS diagnosed between 2012 and 2015. The results for CLIA-certified HER2 IHC/FISH scoring according to the American Society of Clinical Oncology, and the College of American Pathologists (ASCO/CAP) guidelines were extracted from the pathology reports. The tissues were collected under IRB protocol ID 9505008219.
Area Measurement
Samples were sectioned at the Yale pathology tissue service. Imaging of Hematoxylin and Eosin (H&E) sections were completed on Aperio ScanScope Console (v10.2.0.2352). Tumor, stroma, and DCIS areas circled by a pathologist were measured using pen and annotation tool of Aperio ImageScope (v12.3.2.8013).
GeneXpert Breast Cancer STRAT4 assay
The BC STRAT4 assay was performed as previously described.12 Briefly, 5μM thick FFPE tissue sections were collected either as a whole tissue section, non m-d, or macrodissected, m-d, to collect tumor only. Samples were lysed using 5μl Proteinase K and 260μl FFPE lysis reagent and incubated for 30 minutes at 80°C. Then, 260μL of ≥95% ethanol was added to the lysed samples and vortexed to mix. The mixture was transferred to a BC STRAT4 cartridge and tested on the GX system. This assay isolates the total RNA, performs a 1-step RT-PCR and provides Ct values for the endogenous control, CYFIP, and the target genes, ERBB2, ESR1, PGR and MKi67. Results were expressed as a dCt value, defined as the Ct of the control gene (CYFIP1) minus the Ct of each of the target genes (ERBB2, ESR1, PGR or MKi67). The BC STRAT4 dCt cutoffs for ERBB2, ESR, PGR and MKi67 were established in a breast cancer patient cohort, based on the highest concordance achieved between relative RNA amplification and corresponding protein expression by IHC as the gold standard.13
Statistical Analysis
All data sets were analyzed and plotted using GraphPad Prism v7.0 software for Windows (GraphPad Software, Inc., La Jolla, CA). The concordance between non m-d and m-d groups was assessed using linear regression coefficient (R2). The comparison amongst non m-d and m-d groups was performed using 2-tailed unpaired student t tests. Fisher’s exact test two-sided was used to compare the RT-qPCR and IHC results for HER2-positivity, ER-positivity and PgR-positivity. All P values under 0.05 were considered statistically significant.
RESULTS
Tumor epithelium and DCIS area in cohorts
Tumor epithelium and DCIS were circled and the percentage of tumor area was measured to assess the stroma and DCIS components present in all breast cancer samples (Fig. 1). The distribution of percentage tumor epithelium area in the IDCA cohort is shown in Table 1. Similarly, the distributions of percentage tumor epithelium and percentage DCIS area in the IDCA cohort is shown in Table 2. We observed about half of the core needle biopsy area as stroma in both the IDCA (mean percentage tumor = 51.5%) and IDCA with DCIS (mean percentage tumor = 53.5%) cohorts. The percentage tumor epithelium in this small cohort ranges from 13% to 100%. In addition, we found a range of DCIS positivity of 0.1% – 5.4% in the IDCA with DCIS cohort.
Figure 1.
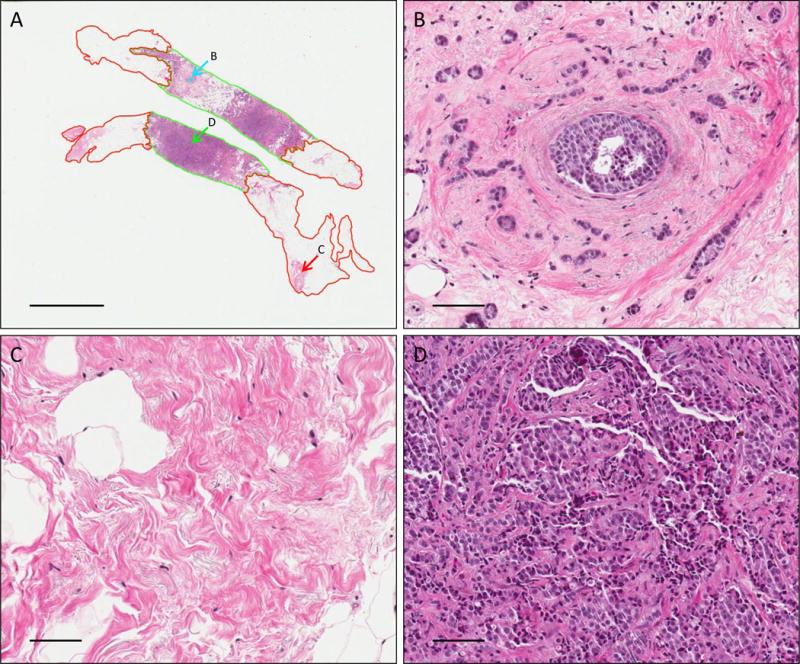
Representative images of H&E stained IDCA with DCIS breast cancer section showing overall view of the core needle biopsy (A), DCIS tumor area (B), non-tumor tissue area (C) and tumor tissue area (D). Magnification panels and scale bar shown at (A) are 0.6X and 4mm and (B–D) are 20X and 100um. Green represents tumor area, red represents stroma area and cyan represents DCIS area.
Table 1.
Percentage epithelial tumor area in the IDCA cohort.
| % Tumor Epithelium, HER2 0+, n = 13 | |
| Mean | 49.5 |
| Median | 39 |
| SD | 26.2 |
| Minimum | 22 |
| Maximum | 100 |
| % Tumor Epithelium, HER2 1+, n = 17 | |
| Mean | 57.2 |
| Median | 58 |
| SD | 21.3 |
| Minimum | 25 |
| Maximum | 94 |
| % Tumor Epithelium, HER2 2+, n = 16 | |
| Mean | 55.5 |
| Median | 60 |
| SD | 21.6 |
| Minimum | 13 |
| Maximum | 85 |
| % Tumor Epithelium, HER2 3+, n = 14 | |
| Mean | 42 |
| Median | 41 |
| SD | 22.7 |
| Minimum | 14 |
| Maximum | 85 |
Table 2.
Percentage epithelial tumor and DCIS area in the IDCA with DCIS cohort.
| % Tumor Epithelium | % DCIS | |
|---|---|---|
| HER2 0+, n = 5 | ||
| Mean | 46.8 | 0.6 |
| Median | 28 | 0.4 |
| SD | 29.9 | 0.6 |
| Minimum | 22 | 0.1 |
| Maximum | 81 | 1.5 |
| HER2 1+, n = 8 | ||
| Mean | 55.3 | 1.2 |
| Median | 55.5 | 0.7 |
| SD | 18.1 | 1.2 |
| Minimum | 20 | 0.1 |
| Maximum | 77 | 3.9 |
| HER2 2+, n = 7 | ||
| Mean | 58.6 | 1.7 |
| Median | 52 | 0.9 |
| SD | 24.5 | 2.0 |
| Minimum | 30 | 0.1 |
| Maximum | 97 | 5.4 |
Breast cancer mRNA markers assessed as a function of macrodissection
To evaluate the impact of macrodissection we measured mRNA expression of key breast cancer genes, ERBB2, ESR1, PGR and MKi67, between the paired samples non m-d versus m-d from 60 FFPE IDCA cases and 20 FFPE IDCA with DCIS cases with a range of HER2 expression determined by HER2 IHC/FISH. We saw excellent agreement of the resulting dCt values, between the paired samples, m-d versus non m-d, for ERBB2 (R2=0.95), ESR1 (R2=0.91), PGR (R2=0.90) and MKi67 (R2=0.90) in the IDCA cohort (Fig. 2). Since contaminating DCIS in IDCA specimens could potentially contribute ERBB2 mRNA signal to in vitro assays, a second cohort was assessed where DCIS accompanied IDCA in every case. Here, high concordance of the resulting dCt between the paired samples, m-d versus non m-d, was observed for ERBB2 (R2=0.70), ESR1 (R2=0.97), PGR (R2=0.99) and MKi67 (R2=0.66) (Fig. 3). Experiments were performed in triplicates for cases closer to the ERBB2 threshold (−0.5 < dCt <−1.5) and the agreement between non m-d versus m-d samples for every case was observed (Supplemental Figure 1). When clinical cutoffs for the various analytes are applied, the concordance remains strong, no specimen in either cohort changed from positive to negative or vica versa as a function of non m-d or m-d for ERBB2 and ESR (Table 3 and 4). In addition, no significant difference (P > 0.99) was observed when we compared the dCt between the paired samples, m-d versus non m-d, for ERBB2, ESR1, PGR and MKi67 in the IDCA cohort (Fig. 4) and IDCA with DCIS cohort (Fig. 5).
Figure 2. Correlation between non m-d versus m-d samples for RT-qPCR in IDCA cohort.
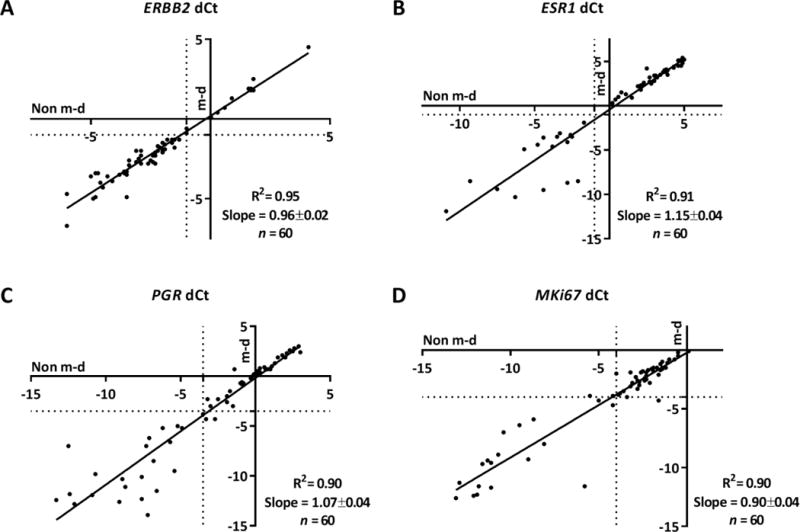
Regression of mRNA quantification for ERBB2 (A), ESR1 (B), PGR (C), and MKi67 (D). The respective R2 and slope values are indicated in the chart. Non m-d: not macrodissected and m-d: macrodissected.
Figure 3. Correlation between non m-d versus m-d samples for RT-qPCR in IDCA with DCIS cohort.
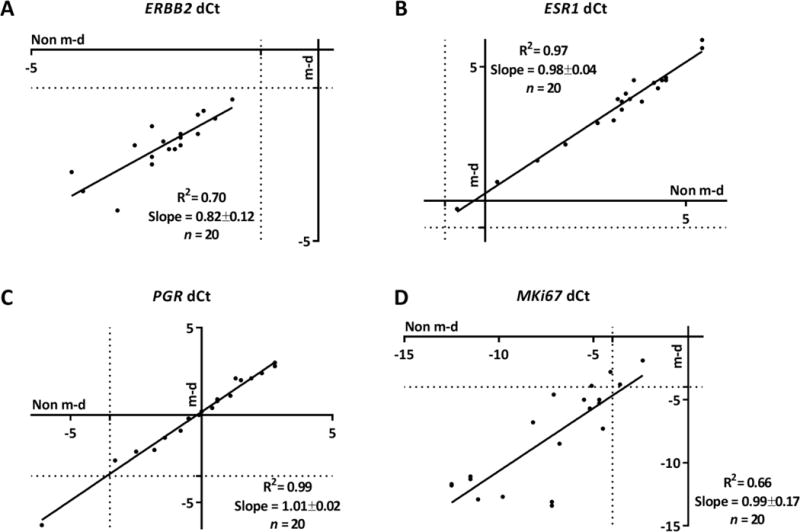
Regression of mRNA quantification for ERBB2 (A), ESR1 (B), PGR (C), and MKi67 (D). The respective R2 and slope values are indicated in the chart. Non m-d: not macrodissected and m-d: macrodissected.
Table 3.
Concordance between RT-qPCR and IHC/FISH for HER2 in IDCA cohort.
| Non m-d samples (P < 0.001; sensitivity = 0.86; specificity = 1; PPV = 1; NPV = 0.96) | |||
| HER2 Positive | HER2 Negative | Total | |
| dCt ≥−1 | 12 | 0 | 12 |
| dCt <−1 | 2 | 46 | 48 |
| Total | 14 | 46 | 60 |
| m-d samples (P < 0.001; sensitivity = 0.86; specificity = 1; PPV = 1; NPV = 0.96) | |||
| HER2 Positive | HER2 Negative | Total | |
| dCt ≥−1 | 12 | 0 | 12 |
| dCt <−1 | 2 | 46 | 48 |
| Total | 14 | 46 | 60 |
Table 4.
Concordance between RT-qPCR and IHC/FISH for ESR in IDCA cohort.
| Non m-d samples (P < 0.001; sensitivity = 0.98; specificity = 1; PPV = 1; NPV = 0.94) | |||
| ER Positive | ER Negative | Total | |
| dCt ≥−1 | 43 | 0 | 43 |
| dCt <−1 | 1 | 16 | 17 |
| Total | 44 | 16 | 60 |
| m-d samples (P < 0.001; sensitivity = 0.98; specificity = 1; PPV = 1; NPV = 0.94) | |||
| ER Positive | ER Negative | Total | |
| dCt ≥−1 | 43 | 0 | 43 |
| dCt <−1 | 1 | 16 | 17 |
| Total | 44 | 16 | 60 |
Figure 4. Comparison between pathologist determined IHC/FISH and RT-qPCR for non m-d versus m-d samples in IDCA cohort.
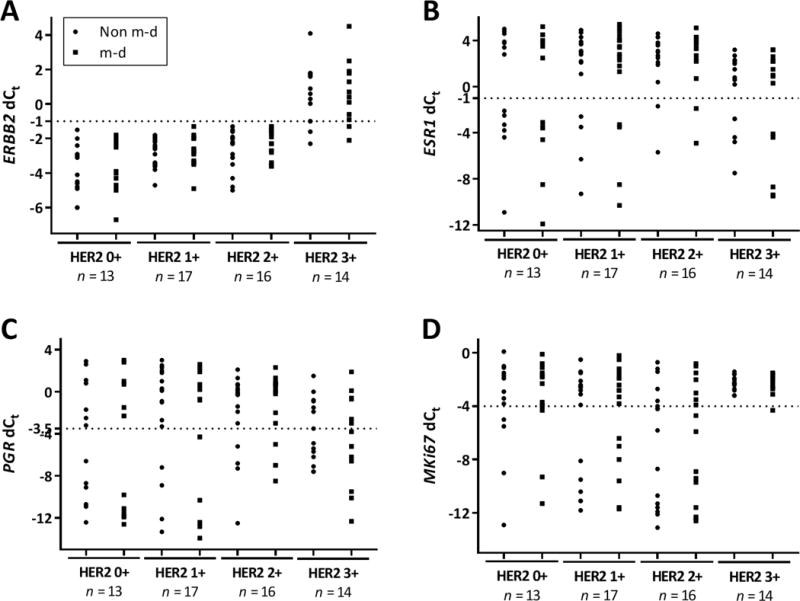
Dot plot showing mRNA quantification of ERBB2 (A), ESR1 (B), PGR (C), and MKi67 (D) determined to be 0+, 1+, 2+ and 3+ by IHC and confirmed by FISH. Non m-d: not macrodissected and m-d: macrodissected.
Figure 5. Comparison between pathologist determined IHC/FISH and RT-qPCR for non m-d versus m-d samples in IDCA with DCIS cohort.
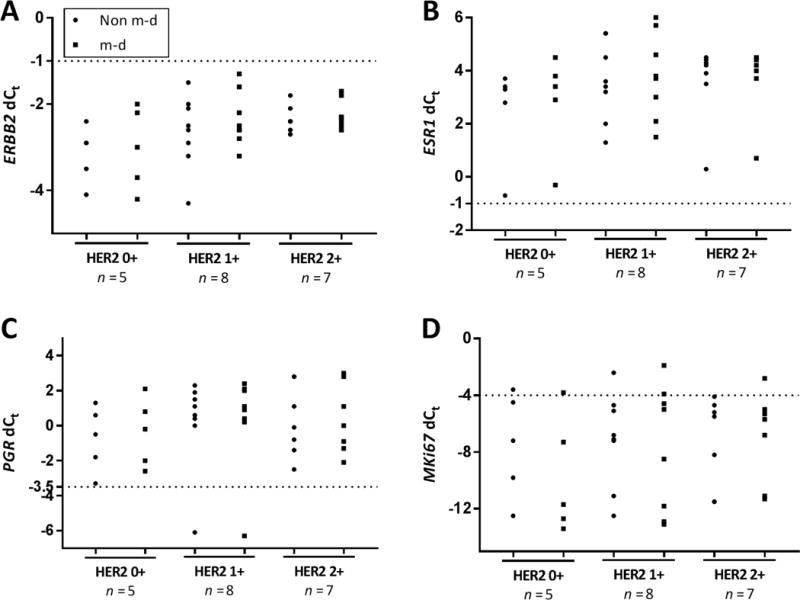
Dot plot showing mRNA quantification of ERBB2 (A), ESR1 (B), PGR (C), and MKi67 (D) determined to be 0+, 1+ and 2+ by IHC and confirmed by FISH. Non m-d: not macrodissected and m-d: macrodissected.
Concordance between RT-qPCR and IHC/FISH measurements
To assess the concordance agreement between RT-qPCR and IHC/FISH classification we used the predefined BC STRAT4 dCt cutoffs for ERBB2, ESR and PGR positivity and compared those to clinical IHC/FISH results in the IDCA cohort.12, 13 We found a significant concordance between RT-qPCR and IHC/FISH for HER2-positivity for the paired samples, non m-d and m-d (95.0%; P < 0.001; sensitivity = 0.86; specificity = 1; PPV = 1; NPV = 0.96) (Table 3), ESR-positivity for the paired samples, non m-d and m-d (98.3%; P < 0.001; sensitivity = 0.98; specificity = 1; PPV = 1; NPV = 0.94) (Table 4) and PGR-positivity for the paired samples, non m-d (86.7%; P < 0.001; sensitivity = 0.86; specificity = 0.88; PPV = 1; NPV = 0.71) versus m-d (88.3%; P < 0.001; sensitivity = 0.84; specificity = 1; PPV = 1; NPV = 0.71) (Table 5), respectively.
Table 5.
Concordance between RT-qPCR and IHC/FISH for PGR in IDCA cohort.
| Non m-d samples (P < 0.001; sensitivity = 0.86; specificity = 0.88; PPV = 0.95; NPV = 0.71) | |||
| PR Positive | PR Negative | Total | |
| dCt ≥−3.5 | 37 | 2 | 39 |
| dCt <−3.5 | 6 | 15 | 21 |
| Total | 43 | 17 | 60 |
| m-d samples (P < 0.001; sensitivity = 0.84; specificity = 1; PPV = 1; NPV = 0.71) | |||
| PR Positive | PR Negative | Total | |
| dCt ≥−3.5 | 36 | 0 | 36 |
| dCt <−3.5 | 7 | 17 | 24 |
| Total | 43 | 17 | 60 |
RT-qPCR dCt scores were independent of tumor epithelium and DCIS area
We assessed the area specific distribution of mRNA expression in both the IDCA and IDCA with DCIS cohorts. The mRNA transcript levels of ERBB2, ESR1, PGR and MKi67 were independent of the percent epithelial tumor area present in the IDCA and IDCA with DCIS cohorts (Fig 6A, B and data not shown). Furthermore, the mRNA transcript levels of ERBB2, ESR1, PGR and MKi67 were also independent of the percent DCIS area present in IDCA with DCIS cohort (Fig 6C, D and data not shown).
Figure 6. Area specific distribution of mRNA expression in IDCA and IDCA with DCIS cohort.
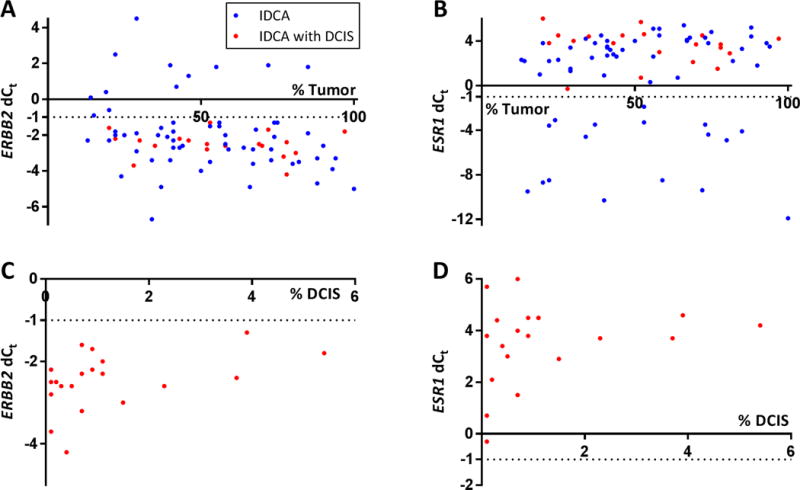
Scatterplots depicting distribution of the percentage epithelial tumor area (A, B) and percentage DCIS area (C, D) versus mRNA quantification for ERBB2 (A, C) and ESR1 (B and D) in IDCA and IDCA with DCIS cohort.
DISCUSSION
Breast cancer tissues show both architectural and cellular heterogeneity, representing a blend of tumor cells, healthy epithelial ducts, surrounding stroma and, sometimes DCIS cells. Therefore, RNA or protein in vitro extracts from whole tissue lysates also represent the presence of a variety of cell populations in the tissue under examination and potentially limits the ability to identify tumor cell-specific signals. As a consequence, several methods have been reported for tissue microdissection, including gross dissection of frozen tissue blocks,14 irradiation of manually ink-stained sections,15 touch preparations of frozen tissue specimens,16 macrodissection with manual tools,17–19 and laser capture microdissection.20 The simplest of these methods is manual tool macro-dissection of the FFPE slide. This has been the method adopted and is in routine use for the OncotypeDx test, MammaTyper assay and possibly other RNA-based tests. Recently, Laible et al. showed that microdissection of FFPE tissue sections did not appear to be necessary for the MammaTyper assay which assigns breast cancer specimens into the molecular subtypes according to the mRNA expression of ERBB2, ESR1, PGR and MKi67.21 Our results with STRAT4 supports this study as we found no differences between results obtained using macrodissection and whole sections for the same targets. A few cases show discordance between RT-QPCR and IHC/FISH. This could be due to variance inherent in assays or actual discordance due to biological variance between RNA levels and protein levels, since no all RNA is translated. Similarly, not all cases with FISH amplification show increased protein and this may be a similar biological phenomenon.
IHC is the current practice for the measurements of HER2, ER, PR and Ki-67 protein expression in breast cancer and ERBB2 status is assessed by FISH when HER2 IHC results are equivocal.10 Over the years, the measurement of RNA for breast cancer markers has emerged using several commercially available platforms 22–24, most significantly for multi-parameter prognostic testing. However simple qRT-PCR has failed to gain acceptance for HER2 assessment. Here we showed a significant concordance (P < 0.001) between the GeneXpert closed-system RT-qPCR assay and IHC/FISH scoring for HER2, ER and PR for the paired samples, non m-d versus m-d. These results suggest that the closed-system RT-qPCR assay may have potential to be utilized in parallel to current practice for the measurements of HER2, ER and PR.
There are a number of limitations to this work. Perhaps the most significant is that it is underpowered to assess concordance with IHC. While we show concordance here, the main focus of this work is the comparison of m-d vs non m-d. Other larger studies are underway to assess concordance between IHC and RT-PCR. Since mixed population of invasive carcinoma and DCIS can create discrepancies in biomarker expression. Future studies might address this issue by focusing on cases with HER2 overexpression in DCIS, but not in an adjacent invasive component. Also, this the work focused on HER2, we did not assess cases with small foci of ER/PR-negative invasive carcinoma that have significant amounts of benign grandular tissue. This could contribute to false positive results and may be addressed in future studies. Another limitation of this work is the focus on core needle biopsies. While our intention was only to assess small specimens (core biopsies), in the future we will attempt to assess FNA and whole, full sized resection specimens. The conclusions of this work cannot necessarily be applied to other specimen types.
CONCLUSION
In summary, we compared mRNA expression for key breast cancer markers in non m-d versus m-d in IDCA and IDCA with DCIS cohorts and found that m-d of whole sections is not required for accurate assessment of these genes in a closed system RT-qPCR assay. The simplicity of the assay workflow may be particularly valuable in low resourced settings where routine access to pathology expertise and to high quality IHC/FISH is challenging.
Supplementary Material
Acknowledgments
We would like to thank Lori Charette and the team at the Yale Pathology Tissue Service for production of the high-quality tissue sections used in this study. This work was supported by a research agreement from Cepheid.
ABBREVIATIONS
- GX
GeneXpert system
- m-d
macrodissected
- FFPE
formalin-fixed paraffin-embedded
- IDCA
infiltrating ductal carcinoma
- DCIS
ductal in situ carcinoma
- HER2
human epidermal growth factor receptor 2
- ER
Estrogen receptor
- PR
progesterone receptor
- Ki-67
marker of proliferation Ki-67
- IHC
immunohistochemistry
- FISH
fluorescence in situ hybridization
- RT-qPCR
quantitative reverse transcription polymerase chain reaction
- dCt
delta cycle threshold
- ASCO/CAP
American Society of Clinical Oncology, and the College of American Pathologists
Footnotes
AUTHORS’ CONTRIBUTION
DLR conceived the study, supervised the analysis and revised the final version of the manuscript. SG carried out the RT-qPCR assay, analysis of data and wrote the manuscript, in addition to selecting the cohort and extracting IHC/FISH data from the pathology reports. NRM performed area measurement analysis. DEC provided tissue and pathology review. KH, JW, WW and BR provided technical assistance. MB provided financial support to carry out the study. All authors have read and approved the final version of the manuscript.
CONFLICT OF INTEREST
References
- 1.American Cancer Society. Cancer Facts and Figures 2016. Atlanta, GA: American Cancer Society; 2016. [Google Scholar]
- 2.International Agency for Research on Cancer (IARC) and World Health Organisation (WHO) GLOBOCAN 2012: Estimated cancer incidence, mortality and prevalence worldwide in 2012. Available form http://globocan.iarc.fr/old/FactSheets/cancers/breast-new.asp.
- 3.American Cancer Society. Breast Cancer Facts and Figures 2015–2016. Atlanta, GA: American Cancer Society; 2015. [Google Scholar]
- 4.Press MF, Slamon DJ, Flom KJ, et al. Evaluation of HER-2/neu gene amplification and overexpression: comparison of frequently used assay methods in a molecularly characterized cohort of breast cancer specimens. J Clin Oncol. 2002;20(14):3095–3105. doi: 10.1200/JCO.2002.09.094. [DOI] [PubMed] [Google Scholar]
- 5.Senkus E, Kyriakides S, Ohno S, et al. Primary breast cancer: ESMO Clinical Practice Guidelines for diagnosis, treatment and follow-up. Ann Oncol. 2015;26(Suppl 5):v8–30. doi: 10.1093/annonc/mdv298. [DOI] [PubMed] [Google Scholar]
- 6.Fisher B, Redmond C, Brown A, et al. Influence of tumor estrogen and progesterone receptor levels on the response to tamoxifen and chemotherapy in primary breast cancer. J Clin Oncol. 1983;1(4):227–241. doi: 10.1200/JCO.1983.1.4.227. [DOI] [PubMed] [Google Scholar]
- 7.Rose C, Thorpe SM, Lober J, et al. Therapeutic effect of tamoxifen related to estrogen receptor level. Recent Results Cancer Res. 1980;71:134–141. doi: 10.1007/978-3-642-81406-8_19. [DOI] [PubMed] [Google Scholar]
- 8.Stierer M, Rosen H, Weber R, et al. Immunohistochemical and biochemical measurement of estrogen and progesterone receptors in primary breast cancer. Correlation of histopathology and prognostic factors. Ann Surg. 1993;218(1):13–21. doi: 10.1097/00000658-199307000-00004. [DOI] [PMC free article] [PubMed] [Google Scholar]
- 9.Sunderland MC, Osborne CK. Tamoxifen in premenopausal patients with metastatic breast cancer: a review. J Clin Oncol. 1991;9(7):1283–1297. doi: 10.1200/JCO.1991.9.7.1283. [DOI] [PubMed] [Google Scholar]
- 10.Matos LL, Trufelli DC, de Matos MG, et al. Immunohistochemistry as an important tool in biomarkers detection and clinical practice. Biomark Insights. 2010;5:9–20. doi: 10.4137/bmi.s2185. [DOI] [PMC free article] [PubMed] [Google Scholar]
- 11.Wolff AC, Hammond ME, Hicks DG, et al. Recommendations for human epidermal growth factor receptor 2 testing in breast cancer: American Society of Clinical Oncology/College of American Pathologists clinical practice guideline update. J Clin Oncol. 2013;31(31):3997–4013. doi: 10.1200/JCO.2013.50.9984. [DOI] [PubMed] [Google Scholar]
- 12.Wasserman BE, Carvajal-Hausdorf DE, Ho K, et al. High concordance of a closed-system, RT-qPCR breast cancer assay for HER2 mRNA, compared to clinically determined immunohistochemistry, fluorescence in situ hybridization, and quantitative immunofluorescence. Lab Invest. 2017 doi: 10.1038/labinvest.2017.93. [DOI] [PMC free article] [PubMed] [Google Scholar]
- 13.Wu NC, Wong W, Ho K, et al. Xpert® Breast Cancer STRAT4* Assay Demonstrates High Concordance with Central IHC and FISH testing in FFPE Breast Tumor Tissues. Poster presented at: 39th Annual San Antonio Breast Cancer Symposium; 2016 Dec 6–10; San Antonio, TX. Available From http://sabcs16.posterview.com/nosl/p/P1-03-03. [Google Scholar]
- 14.Radford DM, Fair K, Thompson AM, et al. Allelic loss on a chromosome 17 in ductal carcinoma in situ of the breast. Cancer Res. 1993;53(13):2947–2949. [PubMed] [Google Scholar]
- 15.Shibata D, Hawes D, Li ZH, et al. Specific genetic analysis of microscopic tissue after selective ultraviolet radiation fractionation and the polymerase chain reaction. Am J Pathol. 1992;141(3):539–543. [PMC free article] [PubMed] [Google Scholar]
- 16.Kovach JS, McGovern RM, Cassady JD, et al. Direct sequencing from touch preparations of human carcinomas: analysis of p53 mutations in breast carcinomas. J Natl Cancer Inst. 1991;83(14):1004–1009. doi: 10.1093/jnci/83.14.1004. [DOI] [PubMed] [Google Scholar]
- 17.Emmert-Buck MR, Roth MJ, Zhuang Z, et al. Increased gelatinase A (MMP-2) and cathepsin B activity in invasive tumor regions of human colon cancer samples. Am J Pathol. 1994;145(6):1285–1290. [PMC free article] [PubMed] [Google Scholar]
- 18.Noguchi S, Motomura K, Inaji H, et al. Clonal analysis of predominantly intraductal carcinoma and precancerous lesions of the breast by means of polymerase chain reaction. Cancer Res. 1994;54(7):1849–1853. [PubMed] [Google Scholar]
- 19.Zhuang Z, Vortmeyer AO. Applications of tissue microdissection in cancer genetics. Cell Vis. 1998;5(1):43–48. [PubMed] [Google Scholar]
- 20.Emmert-Buck MR, Bonner RF, Smith PD, et al. Laser capture microdissection. Science. 1996;274(5289):998–1001. doi: 10.1126/science.274.5289.998. [DOI] [PubMed] [Google Scholar]
- 21.Laible M, Schlombs K, Kaiser K, et al. Technical validation of an RT-qPCR in vitro diagnostic test system for the determination of breast cancer molecular subtypes by quantification of ERBB2, ESR1, PGR and MKI67 mRNA levels from formalin-fixed paraffin-embedded breast tumor specimens. BMC Cancer. 2016;16:398. doi: 10.1186/s12885-016-2476-x. [DOI] [PMC free article] [PubMed] [Google Scholar]
- 22.Park MM, Ebel JJ, Zhao W, et al. ER and PR Immunohistochemistry and HER2 FISH versus Oncotype DX: Implications for Breast Cancer Treatment. The Breast Journal. 2014;20(1):37–45. doi: 10.1111/tbj.12223. [DOI] [PubMed] [Google Scholar]
- 23.Duffy MJ, Walsh S, McDermott EW, et al. Chapter One – Biomarkers in Breast Cancer: Where Are We and Where Are We Going? In: Gregory SM, editor. Advances in Clinical Chemistry. Elsevier; 2015. pp. 1–23. [DOI] [PubMed] [Google Scholar]
- 24.Hagemann Ian S. Molecular Testing in Breast Cancer: A Guide to Current Practices. Archives of Pathology & Laboratory Medicine. 2016;140(8):815–824. doi: 10.5858/arpa.2016-0051-RA. [DOI] [PubMed] [Google Scholar]
Associated Data
This section collects any data citations, data availability statements, or supplementary materials included in this article.


