

Abstract
The analysis of neural dynamics in several brain cortices has consistently uncovered low-dimensional manifolds that capture a significant fraction of neural variability. These neural manifolds are spanned by specific patterns of correlated neural activity, the “neural modes.” We discuss a model for neural control of movement in which the timedependent activation of these neural modes is the generator of motor behavior. This manifold-based view of motor cortex may lead to a better understanding of how the brain controls movement.
Since the work of Herbert Jasper (Jasper et al., 1958) and Ed Evarts (Evarts, 1968), cortical function has been studied by recording single neuron activity while animals perform a variety of behaviors, including decision making (Newsome et al., 1989), sensation (Wurtz, 1969), and movement (Georgopoulos et al., 1982; Humphrey et al., 1970).
In the motor system, the main focus of this article, single neuron studies typically involved recordings during repeated, stereotypical movements. Many of these experiments sought explicit representations that relate single-neuron activity to specific movement covariates, including but not limited to target position, endpoint and joint kinematics, endpoint forces, and muscle activity (Evarts, 1968; Georgopoulos et al., 1982; Humphrey et al., 1970; Morrow et al., 2007; Thach, 1978). Although some of these efforts involved the decoding of population activity (Georgopoulos et al., 1982), they were restricted to models of non-interacting neurons whose individual activity was associated with specific movement covariates.
However, some of these studies also identified single neurons whose activity did not represent movement parameters (Churchland and Shenoy, 2007; Fetz, 1992; Scott, 2008). If neurons in primary motor cortex (M1) were to represent movement parameters, those representations ought to be most evident in corticomotoneuronal (CM) cells, which make direct connections onto spinal motoneurons (Fetz, 1992). Yet, many of these CM cells do not represent any specific movement covariate (Fetz et al., 1989).
The ultimate role of M1 is to generate movement, not to represent it (Churchland et al., 2012; Cisek, 2006; Scott, 2004); thus it is not surprising that many M1 neurons do not relate to any single movement covariate. The search for representations at the singleneuron level might actually divert us from understanding the neural control of movement. Early neural network simulations indicated that individual neurons need not explicitly encode movement covariates when the goal of M1 population activity is to generate realistic muscle activation patterns (Fetz, 1992).
The role of neurons that do not explicitly represent any movement covariate can be explained by recent work based on optimal feedback control theory, which postulates that the goal of motor cortex is to produce a desired movement and force, taking into account the state of the muscles. This hypothesis avoids the need for explicit representation of movement covariates by single neurons, though some neurons may still represent movement covariates or high level task characteristics as a byproduct of the necessary control signals (Scott, 2008; Todorov, 2000).
Recent and accelerating technical developments provide the experimental tools for monitoring the activity of large numbers of neurons, as well as the statistical and modeling tools for analyzing how these neural populations perform the computations necessary to plan and execute movement (Gao and Ganguli, 2015). The challenge of understanding the neural control of movement by analyzing neural population activity is formidable, as population activity in any specific area not only reflects its intrinsic dynamics, but must also respond to its inputs and generate output projections based on the computations being performed (Sussillo et al., 2015). A simplification arises from the fact that neural computations are based on the joint activity of interconnected neurons (Fetz, 1992; Hatsopoulos et al., 1998; Shenoy et al., 2013); the resulting population activity is thus likely constrained by the connectivity of the underlying network.
Here we argue that the underlying network connectivity constrains the possible patterns of population activity (Okun et al., 2015; Sadtler et al., 2014; Tsodyks et al., 1999), and that the possible patterns are confined to a low-dimensional manifold (Stopfer et al., 2003; Yu et al., 2009) spanned by a few independent patterns that we call neural modes. These modes capture a significant fraction of population covariance. It is the activation of these neural modes, rather than the activity of single neurons, that provides the basic building blocks of neural dynamics and function (Luczak et al., 2015; Sadtler et al., 2014; Shenoy et al., 2013).
We thus propose a generative model of the activity of individual neurons based on the activation of neural modes, and explain how the parameters of the model can be identified using dimensionality reduction methods. We then review work showing that these neural modes span task-specific neural manifolds in premotor and motor cortices. We propose that neural manifolds spanned by a surprisingly small number of neural modes are likely to simplify the neural control of movement, and speculate on the potential learning mechanisms underlying the emergence of this low-dimensional organization.
From single neurons to neural manifolds
Current multi-electrode arrays (MEAs) allow for the simultaneous recording of about a hundred neurons. This is many more than the small numbers recorded with single electrodes, but still a tiny fraction of the total number of neurons involved in movement generation. Despite this limitation, Brain-Machine Interfaces (BMIs) based on these MEAs are able to predict reasonably well many behavioral variables (Carmena et al., 2003; Ethier et al., 2012; Serruya et al., 2002).
What is the underlying reason for this success? Intuitively, it is the high degree of correlation and redundancy across individual neural activity. This intuition has been recently made precise in elegant arguments on the low dimensionality of the stereotypical motor behaviors used in most motor control studies (Gao and Ganguli, 2015). The relatively small number of independent signals needed to control behavior during the execution of such tasks only requires a small number of independent neural signals. These neural signals are the latent variables (Cunningham and Yu, 2014) that describe the dynamics of the neural modes.
The participation of individual neurons in neural modes is illustrated in Fig. 1A. Note that each neural mode includes a large fraction of the neurons in the population, and that a given neuron can participate in several neural modes. In this view, the time-dependent activity of individual neurons is simply a reflection of the latent variables (Fig. 1B) (Kaufman et al., 2016; Kobak et al., 2016; Macke et al., 2011). Consider the neural space in Fig. 1C; each axis represents the activity of one of the N recorded neurons (here, N=3). Assuming that network connectivity constrains the possible patterns of population activity (Okun et al., 2015; Sadtler et al., 2014; Tsodyks et al., 1999), the population dynamics will not explore the full high-dimensional neural space, but instead remain confined to a low-dimensional surface within the full space, the neural manifold. In the simplest linear case, the neural manifold is flat, as the hyperplane in Fig. 1C, spanned by the two neural modes,.u1 and u2
Figure 1. The neural manifold hypothesis.
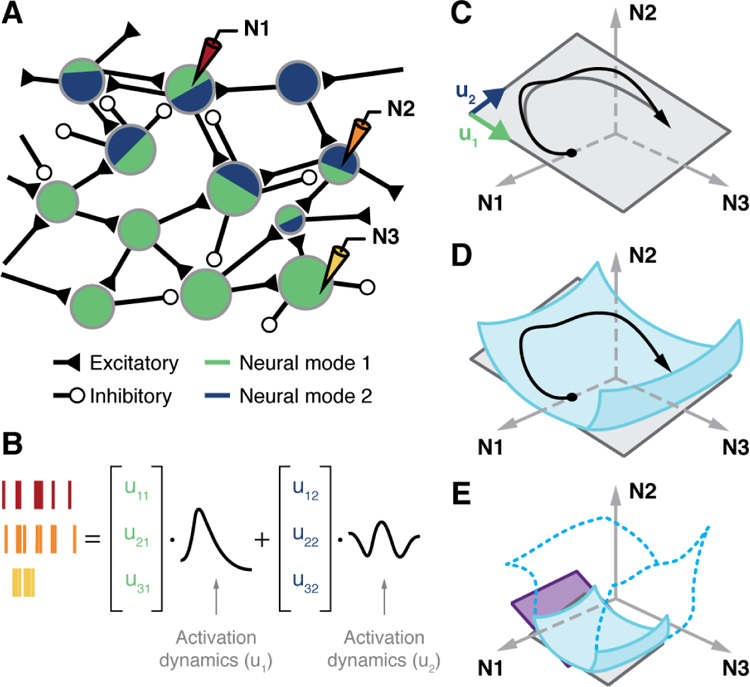
A) Latent variables as a generative model for population activity. The relative area of the blue/green regions in each neuron represents the magnitude of the contribution of each latent variable to the neuron’s activity. B) Spikes from three recorded neurons during task execution as a linear combination of two latent variables. C) Trajectory of time-varying population activity in the neural space of the three recorded neurons (black). The trajectory is mostly confined to the neural manifold, a plane shown in gray, spanned by the neural modes u1 and u2. D) A curved, nonlinear neural manifold, shown in blue. Linear methods would capture a flat, local approximation to a small task-specific region of the manifold. E) Linear manifolds for two different tasks shown as gray and purple planes. Are these two planes local linear approximations to different regions within a large, continuous manifold (transparent surface with blue contour), or are they distinct task-specific manifolds that may or not share neural modes?
This geometrical picture illustrates a possible generative model for the dynamics of individual neurons: the activity ni(t) of the ith neuron, 1 ≤ i ≤N , results from a linear combination of latent variables Lj(t) plus additive noise εi:
| 1 |
Here, Lj(t) is the jth latent variable, the time-dependent activation of the jth neural mode. Each latent variable results from projecting the neural population activity onto the corresponding neural mode. The coefficient uij in the linear combination quantifies the contribution of the jth latent variable to the activity of the ith neuron. These participation weights relate to the internal connectivity of the network (Okun et al., 2015). The noise term represents intrinsic neural noise, and potentially other processes not accounted for in the model. By construction, neural population activity remains within the neural manifold except for small fluctuations (see how close the actual black trajectory is to the gray trajectory projected into the manifold in Fig. 1C).
Dimensionality reduction techniques allow us to study neural population dynamics by finding a set of neural modes that span the neural manifold and identify relevant population features (Cunningham and Yu, 2014). Common linear techniques for dimensionality reduction, such as principal component analysis (PCA) and factor analysis (FA), identify neural modes as dominant patterns of covariation across neurons and yield the parameters of the generative model (Eq. 1; Fig. 1B).
As an illustration, we show that neural data recorded during an isometric wrist task (Fig. 2A,B) is largely accounted for by the latent variables in Fig. 2C. The lowdimensionality of the neural manifold follows from the rapid increase of the explained variance with the number of neural modes (Fig. 2D).
Figure 2. Latent variables for an isometric center-out task.

A) Monkey performing an isometric eight-target center-out wrist task. The targets are color coded (inset). The same target color code is used for the curves shown in panels B and C. B) Peristimulus time histogram for three out of the 68 neurons recorded in a single session. C) Latent variables track the activation of the three leading neural modes, identified with PCA. In panels B and C, target presentation (“Tgt on”) is followed by movement onset (“Mov”) after about 140 ms. D) Variance explained as function of the number of PCA neural modes. Ten modes sufficed to account for about 70% of the variance.
Neural manifolds: a framework to study neural control of movement
The concept of the neural manifold and its associated latent variables has been used in a series of recent studies that replace the search for movement representation by single neurons to consider instead movement planning and execution based on the activation of a few neural modes (Ahrens et al., 2012; Bruno et al., 2015; Churchland et al., 2012, 2010a, 2010b; Churchland and Shenoy, 2007; Elsayed et al., 2016; Kaufman et al., 2016, 2014; Michaels et al., 2016; Overduin et al., 2015; Sadtler et al., 2014; Santhanam et al., 2009; Sussillo et al., 2015).
One of the earliest findings of a neural manifold for movement control comes from Shenoy and colleagues (Santhanam et al., 2009), who analyzed population activity recorded with an MEA implanted in the arm area of dorsal premotor cortex (PMd) during a delayed center-out reach task. Single-neuron activity in PMd correlates with the direction toward the end point of an upcoming reach movement (Riehle and Requin, 1989; Shen and Alexander, 1997). Shenoy and colleagues used FA to obtain neural modes that accounted for the observed shared variance of individual neurons. They found that a three-dimensional manifold sufficed to identify target-specific clusters of latent activity during the delay period (Fig. 3A).
Figure 3. Neural modes in motor cortices.
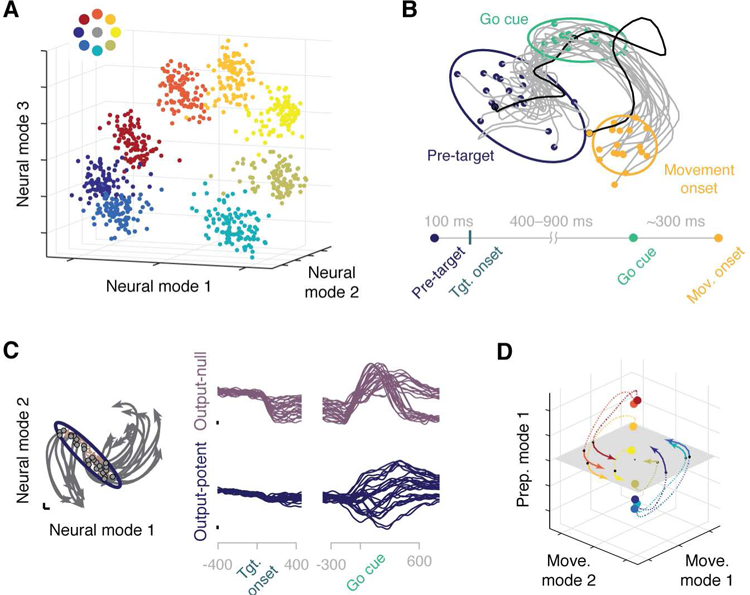
A) Preparatory activity in PMd for an eight-target reach task. A neural manifold spanned by three neural modes reveals target-specific clusters. The targets are color coded (inset). Each point represents activity measured during the delay period for one trial. Adapted from (Santhanam et al., 2009). B) Population variability in PMd is reduced by stimulus presentation. For a delayed reach task (timeline at bottom of panel), population activity trajectories for individual trials are shown in gray in a twodimensional manifold. The “Pre-target” confidence ellipsoid shrinks during “Go cue”, as trajectories get closer together. Adapted from (Churchland et al., 2010b). C) The null space allows for movement preparation without execution. Population activity trajectories for each reach condition are shown in gray in a two-dimensional manifold. Preparatory activity sets the corresponding initial conditions (gray circles within purple ellipsoid). Null (purple, top) and potent (dark blue, bottom) latent variables, defined with respect to EMG activity, are shown on the right. Adapted from (Kaufman et al., 2014). D) Neural modes associated with movement preparation and execution span different manifolds. Two movement modes span a plane (in gray), while the orthogonal preparation mode spans a line that contains the initial conditions (colored circles). Projections of the full trajectories onto the movement manifold resemble the traces in panel C. Trajectories are color coded for each target, as per panel A. Adapted from (Elsayed et al., 2016).
A subsequent study (Churchland et al., 2010b) showed a systematic decrease in the trial-to-trial variability in the neural dynamics of both PMd and primary visual cortex (V1) following stimulus onset, as demonstrated in two-dimensional visualizations of the latent variables (Fig. 3B). The low-dimensional manifold was characterized using Gaussian Process Factor Analysis (GPFA), a method that combines FA with temporal smoothing through a Gaussian kernel, to extract the low-dimensional trajectories defined by the latent variables during individual trials. The method was proposed and compared to static methods like PCA and FA in an earlier paper (Yu et al., 2009) that identified variability reduction following target presentation in PMd data.
The notion of a neural manifold and its associated latent variables was subsequently used by Churchland, Shenoy, and colleagues (Churchland et al., 2012, 2010a) to explain how neural activity in both PMd and M1 during movement planning (Riehle and Requin, 1989) does not generate movement during the delay preceding a go signal (Cisek and Kalaska, 2005). To explain how M1 could prepare movement without causing it, the same group (Kaufman et al., 2014) identified a six-dimensional neural manifold using PCA, then built a linear model that related these latent variables to three muscle synergies (d’Avella et al., 2003; Tresch and Jarc, 2009), also identified by PCA. Based on this linear model, they divided the neural manifold into a potent space, whose activity controls muscle activity, and a null space, whose activity does not affect muscle activity (Kaufman et al., 2014) (Fig. 3C). They showed that preparatory activity lies in the null space; this condition-dependent activity provides an initialization from which the population dynamics evolve to generate the desired movement (Churchland et al., 2012, 2010a; Kaufman et al., 2014). In a recent follow-up study, the same group expanded this analysis to show that preparatory and movement activity lie in orthogonal spaces within the manifold, and that population dynamics evolve from one to the other (Elsayed et al., 2016) (Fig. 3D).
The separation between potent and null spaces was also used by Slutzky and colleagues to investigate the long-term stability of BMIs (Flint et al., 2016). They found that the stability of all recorded neurons was not uniformly necessary to achieve stable BMI control, and showed that neural activity in the potent space was significantly more stable than neural activity in the null space. This finding provided evidence supporting the postulate that optimal feedback control allows the brain to control activity in the potent space, while activity in the null space can vary from trial to trial (Todorov and Jordan, 2002).
Together, these studies strongly support the existence of low-dimensional manifolds in motor cortices. The notion that latent variables may constitute the building blocks of population activity allows us to consider the activity of individual neurons as onedimensional samples of the manifold dynamics. These studies also suggest that the constraints embodied by the neural manifolds simplify movement generation by providing a small number of signals that are independently controlled to achieve a desired behavior (Giszter, 2015; Mussa-Ivaldi and Solla, 2004; Overduin et al., 2015; Shenoy et al., 2013; Thoroughman and Shadmehr, 2000).
Emergence of neural manifolds through learning
Neural manifolds embody patterns of correlated activity; we hypothesize that these correlations reflect the connectivity of the underlying network of neurons. Since longterm learning can alter cortical connectivity (Fu et al., 2012; Rioult-Pedotti et al., 1998), we address potential connections between learning and the emergence of neural manifolds.
A revealing connection between neural manifolds and learning was discovered by Batista, Yu, and colleagues (Sadtler et al., 2014), who used a BMI paradigm in monkeys to address the question of why some motor skills are easier to learn than others. They used FA to identify a ten-dimensional neural manifold, and built a linear decoder from these latent variables into a two-dimensional center-out task. Once the monkeys had learned the task, the decoder was modified in one of two ways; see Fig. 4A. When the modification required the use of existing neural modes (a within-manifold perturbation), the monkeys easily adapted in a single session (Fig. 4 B). In contrast, when the modification required the acquisition of new neural modes (an outside-manifold perturbation), the task proved significantly harder to learn (Fig. 4C). The same group subsequently showed that monkeys could learn new neural modes (Oby et al., 2015) if they were guided to generate these new patterns progressively, over many days. These results suggest that short-term adaptation may be based on the generation of new combinations of preexisting neural modes, while long-term learning may require generating new neural modes. If neural modes arise from a neural circuitry that constrains spatiotemporal patterns of activity, it is not surprising that modifying a neural manifold is more difficult than simply learning to use an existing neural manifold in novel ways.
Figure 4. Neural manifolds and learning.
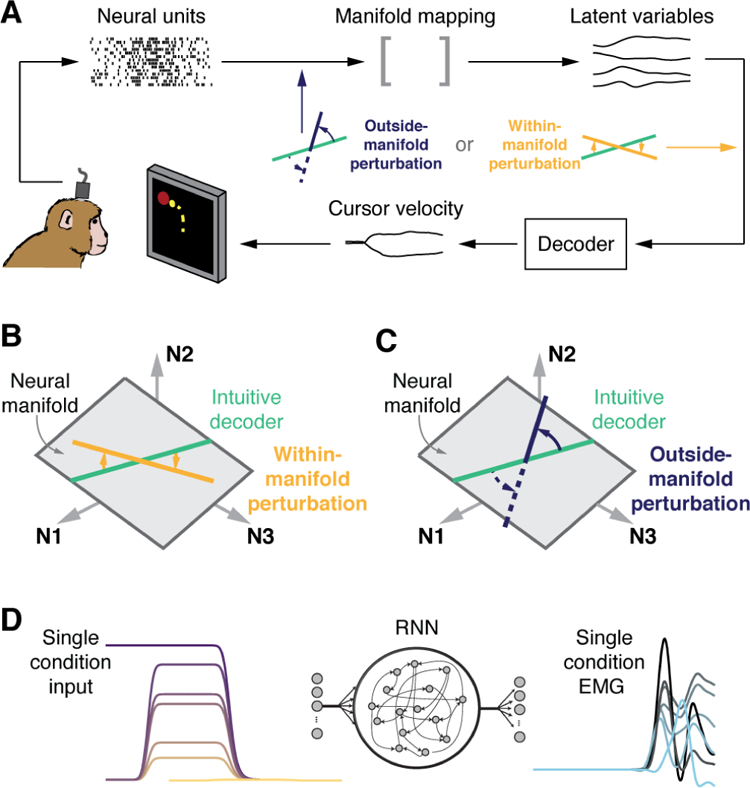
A) Existing neural modes facilitate the adaptation to variations of a learned task. In a BMI paradigm, ten latent variables representing the recorded activity of M1 neurons were mapped onto x and y components of cursor velocity. Once monkeys were proficient with the BMI, a B) within-manifold or C) outside-manifold perturbation was imposed on the decoder inputs. Adaptation to B required a change in the relative activation of existing neural modes, while C required the acquisition of new neural modes through changes in neural comodulation patterns. Adapted from (Sadtler et al., 2014). D) A recurrent neural network was trained to generate condition-specific EMG patterns selected through inputs representing preparatory activity. The latent variables that described the population activity of the trained recurrent network closely resembled those associated with the experimental data. Adapted from (Sussillo et al., 2015).
A connection between the emergence of neural manifolds and learning also arises from a simulation (Sussillo et al., 2015) in which a Recurrent Neural Network (RNN) was trained to output the correct activity pattern for seven muscles recorded during a reach task (Churchland et al., 2012) (Fig. 4D). In the RNN model, training refers to learning the connections between neurons to obtain a network able to perform the desired function, in analogy with the modification of synaptic connectivity in biological learning. Latent variables were then identified for the data generated by the trained RNN, and compared to those for the experimental data. The experimental data were best reproduced by the simplest RNN connectivity that allowed the network to output the measured muscle activity. A similar result was subsequently achieved with an RNN trained to output the x and y components of hand velocity for a delayed center-out reach task (Michaels et al., 2016).
In a complementary simulation study (Hennequin et al., 2014), Gerstner and colleagues proposed a neural network model with random excitatory recurrent connections and inhibitory connections that were learned to achieve stable population dynamics. This balanced network generated population activity patterns whose associated latent variables also exhibited the damped oscillations experimentally observed in the latent variables during reaching (Churchland et al., 2012). It is quite interesting that a network model not trained to produce a specific output – kinematics or muscle activity – but to stabilize its internal dynamics also exhibits oscillatory latent variables.
Neural manifolds in non-motor brain cortices
Although we have focused on neural manifolds in motor cortices, it is important to remark that neural manifolds seem to be widely present across the brain. A number of studies have shown that the largely heterogeneous activity patterns of individual neurons in monkey (Kobak et al., 2016; Machens et al., 2010; Mante et al., 2013; Markowitz et al., 2015) and rat (Durstewitz et al., 2010) prefrontal cortex, monkey (Churchland et al., 2010b) and rat (Forsberg et al., 2016) V1, rat olfactory cortex (Kobak et al., 2016), rat thalamus (Chapin and Nicolelis, 1999), rat parietal cortex (Raposo et al., 2014), locust olfactory system (Stopfer et al., 2003), aplysia pedal ganglion (Bruno et al., 2015), and perhaps the entire zebrafish brain (Ahrens et al., 2012) can be explained as generated by a small set of latent variables associated with neural modes. In all these studies, neural modes and their time-varying activation helped describe previously unexplained mechanisms of neural function.
Studies of sensory cortices have provided clear evidence of network connectivity constraints on the activity of individual neurons. In the cat V1, the instantaneous activity of strongly tuned neurons is tightly linked to the population activity measured with optical imaging, both in response to stimulus presentation and during spontaneous activity (Tsodyks et al., 1999). Experiments in auditory and somatosensory cortices of awake and anesthetized rats further examined the relation between spontaneous and stimulus-evoked activity (Luczak et al., 2009) and found a surprising degree of conservation across these distinct regimes. The authors identified neural modes for spontaneous population activity, and found that neural modes in response to stimuli lay within the same neural manifold. Interestingly, the evoked responses sampled a smaller portion of the manifold than the spontaneous activity, an organization of population activity also found in monkey V1 (Cowley et al., 2016).
Recent experiments in both mouse and monkey V1, and in rat auditory cortex demonstrated that the correlation between single neuron activity and population activity is the same during both spontaneous and stimulus-evoked activity (Okun et al., 2015). These authors demonstrated that correlations between individual neurons and the population significantly predict all pairwise correlations among the neurons. The degree of correlation between individual neurons and the population displays three interesting properties: 1) it predicts the responses of individual neurons during optogenetic stimulation of the surrounding population, suggesting that the relationship between population activity and that of a single neuron is causal; 2) it predicts the estimated number of synapses that a neuron receives from its neighbors, relating activity correlations to the underlying network structure; 3) it correlates strongly with the participation weight of the first FA factor on the activity of each neuron. Together, these results provide convincing if not direct evidence that network connectivity underlies the interactions among neurons captured by dimensionality reduction methods and the resulting neural modes.
Open questions
The prevalence of neural manifolds across brain areas highlights their importance as a tool to understand brain function and reinforces the idea that neural processing may be built upon latent variables rather than on the activity of single neurons. The concept of neural manifolds is not restricted to flat surfaces; the manifold might well be a nonlinear surface within the neural space (Fig. 1D). However, for stereotypical laboratory tasks as those discussed here, linear methods such as PCA or FA capture a large amount of the neural covariance. If the task-specific neural dynamics explore only a limited region within the manifold, a local linear approximation to a nonlinear neural manifold would work quite well (see the gray and purple planes in Fig. 1E). For complex behaviors whose dynamics explore a larger region of neural space, linear methods may provide poor estimates of the neural manifold. Nonlinear methods for dimensionality reduction such as Locally Linear Embedding (LLE) (Roweis and Saul, 2000), Isomap (Tenenbaum et al., 2000), or Autoencoder Neural Networks (Hinton and Salakhutdinov, 2006) might be needed.
These nonlinear methods have already been used in non-motor brain areas. Analysis of population data from the locust antennal lobe during an odor identification task using LLE revealed odor-specific neural manifolds that contain trajectories corresponding to different concentrations of the same odor (Stopfer et al., 2003). The analysis of the population activity of retinal ganglion cells using Isomap (Ganmor et al., 2015) identified activity clusters corresponding to similar visual stimuli. It remains an open question whether nonlinear methods might reveal mechanisms for the neural control of movement that linear methods have not revealed.
The studies discussed here focus on neural manifolds associated with specific tasks. Since organisms are able to execute a rich repertoire of motor tasks, how are the corresponding neural manifolds organized with respect to each other within the neural space? The neural space may contain distinct neural manifolds, each associated with a specific task. What is then the relationship among these distinct manifolds? Is each manifold spanned by its own unique neural modes, or do tasks in a class share some neural modes that represent common features? These are virtually unexplored questions; note however a recent suggestion that preparation and execution of a movement correspond to orthogonal but related manifolds (Elsayed et al., 2016). Whether a similar finding applies to manifolds corresponding to the execution of different tasks is yet unknown.
An alternative is that all motor behaviors might lie within a single, possibly nonlinear, universal neural manifold, with each task sampling a different region (Fig. 1E). Because the tasks commonly studied are simple and stereotypical, the manifolds extracted from the recorded neural data may capture only a small region of the universal manifold, a region spanned by task-specific neural modes. This picture agrees with theoretical arguments that limiting the complexity of behavior also constrains the dimensionality of the neural manifolds (Gao and Ganguli, 2015). In this view, recording larger populations of neurons may not yield new insights; only by recording population activity during naturalistic, complex behaviors will we uncover the true underlying neural manifold.
We have argued that motor behaviors are generated by the time-varying activation of a small set of neural modes, population-wide activity patterns arising from network connectivity that define a low-dimensional manifold in neural space. We argue that the transition from a neuron-centric to a manifold-centric view of neural activity fosters a important advance in our understanding of brain function. Experiments involving longer and more complex motor tasks will require the development of increasingly sophisticated techniques for recording and data analysis; all these will be critical to advance our understanding of the relation between network connectivity, the resulting neural manifolds, and motor behaviors.
Acknowledgement
This work was supported in part by Grant NS053603 from the National Institute of Neurological Disorder and Stroke (L.E. Miller), by Grant NS094748 from the National Institute of Neurological Disorder and Stroke (S.A. Solla), by Grant FP7-PEOPLE-2013-IOF-627384 from the Commission of the European Union (J.A. Gallego), and by Grant F31-NS092356 from the National Institute of Neurological Disorder and Stroke and Grant T32-HD07418 from the National Center for Medical Rehabilitation Research (M.G. Perich). We thank Carolina Massumoto for the monkey illustration.
Footnotes
Publisher's Disclaimer: This is a PDF file of an unedited manuscript that has been accepted for publication. As a service to our customers we are providing this early version of the manuscript. The manuscript will undergo copyediting, typesetting, and review of the resulting proof before it is published in its final citable form. Please note that during the production process errors may be discovered which could affect the content, and all legal disclaimers that apply to the journal pertain.
References
- Ahrens MB, Li JM, Orger MB, Robson DN, Schier AF, Engert F, Portugues R, 2012. Brain-wide neuronal dynamics during motor adaptation in zebrafish. Nature 485, 471–477. [DOI] [PMC free article] [PubMed] [Google Scholar]
- Bruno AM, Frost WN, Humphries MD, 2015. Modular deconstruction reveals the dynamical and physical building blocks of a locomotion motor program. Neuron 86, 304– 318. [DOI] [PMC free article] [PubMed] [Google Scholar]
- Carmena JM, Lebedev M a, Crist RE, O’Doherty JE, Santucci DM, Dimitrov DF, Patil PG, Henriquez CS, Nicolelis M. a L, 2003. Learning to control a brain-machine interface for reaching and grasping by primates. PLoS Biol 1, E42. [DOI] [PMC free article] [PubMed] [Google Scholar]
- Chapin JK, Nicolelis MAL, 1999. Principal component analysis of neuronal ensemble activity reveals multidimensional somatosensory representations. J. Neurosci. Methods 94, 121–140. [DOI] [PubMed] [Google Scholar]
- Churchland MM, Cunningham JP, Kaufman MT, Foster JD, Nuyujukian P, Ryu SI, Shenoy KV, 2012. Neural population dynamics during reaching. Nature [DOI] [PMC free article] [PubMed] [Google Scholar]
- Churchland MM, Cunningham JP, Kaufman MT, Ryu SI, Shenoy KV, 2010a. Cortical Preparatory Activity: Representation of Movement or First Cog in a Dynamical Machine? Neuron 68, 387–400. [DOI] [PMC free article] [PubMed] [Google Scholar]
- Churchland MM, Shenoy K V, 2007 Temporal complexity and heterogeneity of single-neuron activity in premotor and motor cortex. J Neurophysiol 97, 4235–4257. [DOI] [PubMed] [Google Scholar]
- Churchland MM, Yu BM, Cunningham JP, Sugrue LP, Cohen MR, Corrado GS, Newsome WT, Clark AM, Hosseini P, Scott BB, Bradley DC, Smith MA, Kohn A, Movshon JA, Armstrong KM, Moore T, Chang SW, Snyder LH, Lisberger SG, Priebe NJ, Finn IM, Ferster D, Ryu SI, Santhanam G, Sahani M, Shenoy K V., 2010b. Stimulus onset quenches neural variability: a widespread cortical phenomenon. Nat. Neurosci 13, 369–378. [DOI] [PMC free article] [PubMed] [Google Scholar]
- Cisek P, 2006. Preparing for speed. Focus on “Preparatory activity in premotor and motor cortex Reflects the speed of the upcoming reach”. J.Neurophysiol 96, 2842–3. doi: 10.1152/jn.00857.2006 [DOI] [PubMed] [Google Scholar]
- Cisek P, Kalaska JF, 2005. Neural correlates of reaching decisions in dorsal premotor cortex: specification of multiple direction choices and final selection of action. Neuron 45, 801–14. [DOI] [PubMed] [Google Scholar]
- Cowley BR, Smith MA, Kohn A, Yu BM, 2016. Stimulus-driven population activity patterns in macaque primary visual cortex. PLOS Comput. Biol 12, e1005185. [DOI] [PMC free article] [PubMed] [Google Scholar]
- Cunningham JP, Yu BM, 2014. Dimensionality reduction for large-scale neural recordings. Nat. Neurosci 17, 1500–1509. [DOI] [PMC free article] [PubMed] [Google Scholar]
- d’Avella A, Saltiel P, Bizzi E, 2003. Combinations of muscle synergies in the construction of a natural motor behavior. Nat. Neurosci 6, 300–308. [DOI] [PubMed] [Google Scholar]
- Durstewitz D, Vittoz NM, Floresco SB, Seamans JK, 2010. Abrupt transitions between prefrontal neural ensemble states accompany behavioral transitions during rule learning. Neuron 66, 438–448. [DOI] [PubMed] [Google Scholar]
- Elsayed GF, Lara AH, Kaufman MT, Churchland MM, Cunningham JP, 2016. Reorganization between preparatory and movement population responses in motor cortex. Nat. Commun 13239. [DOI] [PMC free article] [PubMed] [Google Scholar]
- Ethier C, Oby ER, Bauman MJ, Miller LE, 2012. Restoration of grasp following paralysis through brain-controlled stimulation of muscles. Nature 485, 368–71. [DOI] [PMC free article] [PubMed] [Google Scholar]
- Evarts E V, 1968 Relation of pyramidal tract activity to force exerted during voluntary movement. J. Neurophysiol 31, 14–27. [DOI] [PubMed] [Google Scholar]
- Fetz EE, 1992. Are movement parameters recognizable coded in the activity of single neurons? Behav. Brain Sci [Google Scholar]
- Fetz EE, Cheney PD, Mewes K, Palmer S, 1989. Control of forelimb muscle activity by populations of corticomotoneuronal and rubromotoneuronal cells. Prog. Brain Res 80, 43749–30. [DOI] [PubMed] [Google Scholar]
- Flint RD, Scheid MR, Wright ZA, Solla SA, Slutzky MW, 2016. Long-Term Stability of Motor Cortical Activity: Implications for Brain Machine Interfaces and Optimal Feedback Control. J. Neurosci 36, 3623–3632. [DOI] [PMC free article] [PubMed] [Google Scholar]
- Forsberg LE, Bonde LH, Harvey MA, Roland PE, 2016. The Second Spiking Threshold: Dynamics of Laminar Network Spiking in the Visual Cortex. Front. Syst. Neurosci 10, 1–21. [DOI] [PMC free article] [PubMed] [Google Scholar]
- Fu M, Yu X, Lu J, Zuo Y, 2012. Repetitive motor learning induces coordinated formation of clustered dendritic spines in vivo. Nature 1, 92–95. [DOI] [PMC free article] [PubMed] [Google Scholar]
- Ganmor E, Segev R, Schneidman E, 2015. A thesaurus for a neural population code. Elife 4, 1–19. [DOI] [PMC free article] [PubMed] [Google Scholar]
- Gao P, Ganguli S, 2015. On simplicity and complexity in the brave new world of large-scale neuroscience. Curr. Opin. Neurobiol 32, 148–155. [DOI] [PubMed] [Google Scholar]
- Georgopoulos AP, Kalaska JF, Caminiti R, Massey JT, 1982. On the relations between the direction of two-dimensional arm movements and cell discharge in primate motor cortex. J. Neurosci 2, 1527–1537. [DOI] [PMC free article] [PubMed] [Google Scholar]
- Giszter SF, 2015. Motor primitives-new data and future questions. Curr. Opin. Neurobiol 33, 156–165. [DOI] [PMC free article] [PubMed] [Google Scholar]
- Hatsopoulos NG, Ojakangas CL, Paninski L, Donoghue JP, 1998. Information about movement direction obtained from synchronous activity of motor cortical neurons. Proc. Natl. Acad. Sci 95, 15706–11. [DOI] [PMC free article] [PubMed] [Google Scholar]
- Hennequin G, Vogels TP, Gerstner W, 2014. Optimal control of transient dynamics in balanced networks supports generation of complex movements. Neuron 82, 1394–1406. [DOI] [PMC free article] [PubMed] [Google Scholar]
- Hinton GE, Salakhutdinov RR, 2006. Reducing the dimensionality of data with neural networks. Science 313, 504–7. [DOI] [PubMed] [Google Scholar]
- Humphrey DR, Schmidt EM, Thompson WD, 1970. Predicting measures of motor performance from multiple cortical spike trains. Science 170, 758–762. [DOI] [PubMed] [Google Scholar]
- Jasper H, Ricci GF, Doane B, 1958. Ciba Foundation Symposium - Neurological Basis of Behaviour, in: Wolstenholme G, O’Connor C (Eds.), . John Wiley & Sons, Ltd., Chichester, UK. [Google Scholar]
- Kaufman MT, Churchland MM, Ryu SI, Shenoy K V, 2014 Cortical activity in the null space: permitting preparation without movement. Nat. Neurosci 17, 440–8. [DOI] [PMC free article] [PubMed] [Google Scholar]
- Kaufman MT, Seely JS, Sussillo D, Ryu SI, Shenoy KV, Churchland MM, 2016. The Largest Response Component in the Motor Cortex Reflects Movement Timing but Not Movement Type. eNeuro 3. [DOI] [PMC free article] [PubMed] [Google Scholar]
- Kobak D, Brendel W, Constantinidis C, Feierstein CE, Kepecs A, Mainen ZF, Qi XL, Romo R, Uchida N, Machens CK, 2016. Demixed principal component analysis of neural population data. Elife 5, 1–36. [DOI] [PMC free article] [PubMed] [Google Scholar]
- Luczak A, Barthó P, Harris KD, 2009. Spontaneous Events Outline the Realm of Possible Sensory Responses in Neocortical Populations. Neuron 62, 413–425. [DOI] [PMC free article] [PubMed] [Google Scholar]
- Luczak A, McNaughton BL, Harris KD, 2015. Packet-based communication in the cortex. Nat. Rev. Neurosci 16, 745–755. [DOI] [PubMed] [Google Scholar]
- Machens CK, Romo R, Brody CD, 2010. Functional, but not anatomical, separation of “what” and “when” in prefrontal cortex. J. Neurosci 30, 350–60. [DOI] [PMC free article] [PubMed] [Google Scholar]
- Macke JH, Buesing L, Cunningham JP, Yu BM, Shenoy KV, Sahani M, 2011. Empirical models of spiking in neuronal populations. Adv. Neural Inf. Process. Syst 24, 1–9. [Google Scholar]
- Mante V, Sussillo D, Shenoy KV, Newsome WT, 2013. Context-dependent computation by recurrent dynamics in prefrontal cortex. Nature 503, 78–84. [DOI] [PMC free article] [PubMed] [Google Scholar]
- Markowitz D, Curtis CE, Pesaran B, 2015. Multiple component networks support working memory in prefrontal cortex. Proc Natl Acad Sci USA 112, 11084–11089. [DOI] [PMC free article] [PubMed] [Google Scholar]
- Michaels JA, Dann B, Scherberger H, 2016. Neural Population Dynamics during Reaching Are Better Explained by a Dynamical System than Representational Tuning. PLOS Comput. Biol 12, e1005175. [DOI] [PMC free article] [PubMed] [Google Scholar]
- Morrow MM, Jordan LR, Miller LE, 2007. Direct comparison of the task-dependent discharge of M1 in hand space and muscle space. J. Neurophysiol 97, 1786–98. [DOI] [PMC free article] [PubMed] [Google Scholar]
- Mussa-Ivaldi FA, Solla SA, 2004. Neural primitives for motion control. IEEE J. Ocean. Eng 29. [Google Scholar]
- Newsome WT, Britten KH, Movshon J, 1989. Neuronal correlates of a perceptual decision. Nature 341, 52–54. [DOI] [PubMed] [Google Scholar]
- Oby E, Degenhart A, Tyler-kabara E, Yu B, Batista A, 2015. Network constraints dictate the timescale of learning new brain-computer interfaces, in: Annual Meeting of the Society for Neuroscience Chicago, IL. [Google Scholar]
- Okun M, Steinmetz N. a., Cossell L, Iacaruso MF, Ko H, Barthó P, Moore T, Hofer SB, Mrsic-Flogel TD, Carandini M, Harris KD, 2015. Diverse coupling of neurons to populations in sensory cortex. Nature 521, 511–515. [DOI] [PMC free article] [PubMed] [Google Scholar]
- Overduin S. a., D’Avella A, Roh J, Carmena JM, Bizzi E, 2015. Representation of Muscle Synergies in the Primate Brain. J. Neurosci 35, 12615–24. [DOI] [PMC free article] [PubMed] [Google Scholar]
- Raposo D, Kaufman MT, Churchland AK, 2014. A category-free neural population supports evolving demands during decision-making. Nat. Neurosci 17, 1784–1792. [DOI] [PMC free article] [PubMed] [Google Scholar]
- Riehle A, Requin J, 1989. Monkey primary motor and premotor cortex: single-cell activity related to prior information about direction and extent of an intended movement. J. Neurophysiol 61, 534–49. [DOI] [PubMed] [Google Scholar]
- Rioult-Pedotti MS, Friedman D, Hess G, Donoghue JP, 1998. Strengthening of horizontal cortical connections following skill learning. Nat. Neurosci 1, 230–4. [DOI] [PubMed] [Google Scholar]
- Roweis ST, Saul LK, 2000. Nonlinear dimensionality reduction by locally linear embedding. Science 290, 2323–2326. [DOI] [PubMed] [Google Scholar]
- Sadtler PT, Quick KM, Golub MD, Chase SM, Ryu SI, Tyler-Kabara EC, Yu BM, Batista AP, 2014. Neural constraints on learning. Nature 512, 423–6. [DOI] [PMC free article] [PubMed] [Google Scholar]
- Santhanam G, Yu BM, Gilja V, Ryu SI, Afshar A, Sahani M, Shenoy KV, 2009. Factor-Analysis Methods for Higher-Performance Neural Prostheses. J. Neurophysiol 102, 1315–1330. [DOI] [PMC free article] [PubMed] [Google Scholar]
- Scott S, 2004. Optimal Feedback Control and the Neural Basis of Volitional Motor Control. Nat. Rev. Neurosci 5, 532–546. [DOI] [PubMed] [Google Scholar]
- Scott SH, 2008. Inconvenient truths about neural processing in primary motor cortex. J. Physiol 586, 1217–24. [DOI] [PMC free article] [PubMed] [Google Scholar]
- Serruya MD, Hatsopoulos NG, Paninski L, Fellows MR, Donoghue JP, 2002. Instant neural control of a movement signal. Nature 416, 141–2. [DOI] [PubMed] [Google Scholar]
- Shen L, Alexander GE, 1997. Preferential representation of instructed target location versus limb trajectory in dorsal premotor area. J. Neurophysiol 77, 1195–1212. [DOI] [PubMed] [Google Scholar]
- Shenoy KV, Sahani M, Churchland MM, 2013. Cortical control of arm movements: a dynamical systems perspective. Annu. Rev. Neurosci 36, 337–59. [DOI] [PubMed] [Google Scholar]
- Stopfer M, Jayaraman V, Laurent G, 2003. Intensity versus identity coding in an olfactory system. Neuron 39, 991–1004. [DOI] [PubMed] [Google Scholar]
- Sussillo D, Churchland MM, Kaufman MT, Shenoy K V, 2015 A neural network that finds a naturalistic solution for the production of muscle activity. Nat. Neurosci 18, 1025–33. [DOI] [PMC free article] [PubMed] [Google Scholar]
- Tenenbaum JB, de Silva V, Langford JC, 2000. A global geometric framework for nonlinear dimensionality reduction. Science 290, 2319–23. [DOI] [PubMed] [Google Scholar]
- Thach WT, 1978. Correlation of neural discharge with pattern and force of muscular activity, joint position, and direction of intended next movement in motor cortex and cerebellum. J. Neurophysiol 41, 654–676. [DOI] [PubMed] [Google Scholar]
- Thoroughman K. a, Shadmehr R, 2000. Learning of action through adaptive combination of motor primitives. Nature 407, 742–7. [DOI] [PMC free article] [PubMed] [Google Scholar]
- Todorov E, 2000. Direct cortical control of muscle activation in voluntary arm movements: a model. Nat. Neurosci 3, 391–398. [DOI] [PubMed] [Google Scholar]
- Todorov E, Jordan MI, 2002. Supp Optimal feedback control as a theory of motor coordination. Nat. Neurosci 5, 1226–1235. [DOI] [PubMed] [Google Scholar]
- Tresch MC, Jarc A, 2009. The case for and against muscle synergies. Curr. Opin. Neurobiol 19, 601–7. [DOI] [PMC free article] [PubMed] [Google Scholar]
- Tsodyks M, Kenet T, Grinvald A, Arieli A, 1999. Linking spontaneous activity of single cortical neurons and the underlying functional architecture. Science 286, 1943–1946. [DOI] [PubMed] [Google Scholar]
- Wurtz RH, 1969. Visual receptive fields of striate cortex neurons in awake monkeys. J. Neurophysiol 32, 727–42. [DOI] [PubMed] [Google Scholar]
- Yu BM, Cunningham JP, Santhanam G, Ryu SI, Shenoy KV, Sahani M, 2009. Gaussian-Process Factor Analysis for Low-Dimensional Single-Trial Analysis of Neural Population Activity. J. Neurophysiol 102, 614–635. [DOI] [PMC free article] [PubMed] [Google Scholar]