

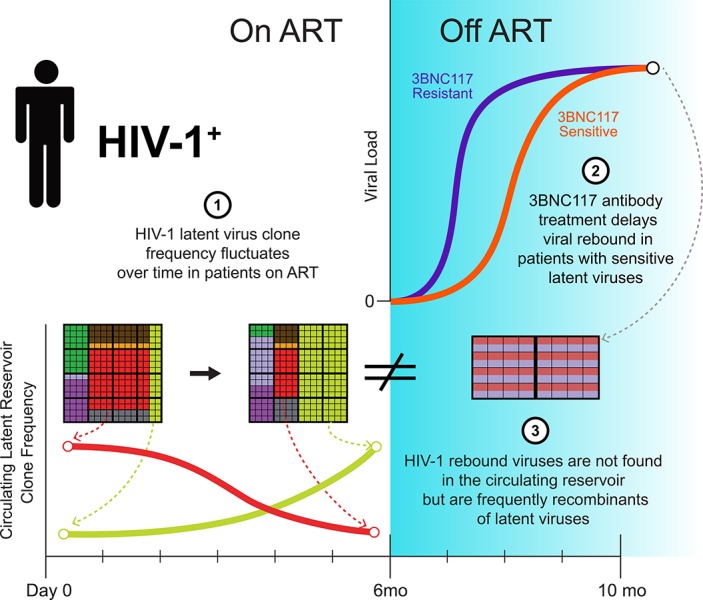
In the setting of a clinical trial evaluating the anti–HIV-1 antibody 3BNC117, Cohen et al. demonstrate that rebound viruses that emerge following interruption of antiretroviral therapy are distinct from circulating latent viruses. Rebound viruses often appear to be recombinants between isolated latent viruses.
Abstract
A clinical trial was performed to evaluate 3BNC117, a potent anti–HIV-1 antibody, in infected individuals during suppressive antiretroviral therapy and subsequent analytical treatment interruption (ATI). The circulating reservoir was evaluated by quantitative and qualitative viral outgrowth assay (Q2VOA) at entry and after 6 mo. There were no significant quantitative changes in the size of the reservoir before ATI, and the composition of circulating reservoir clones varied in a manner that did not correlate with 3BNC117 sensitivity. 3BNC117 binding site amino acid variants found in rebound viruses preexisted in the latent reservoir. However, only 3 of 217 rebound viruses were identical to 868 latent viruses isolated by Q2VOA and near full-length sequencing. Instead, 63% of the rebound viruses appeared to be recombinants, even in individuals with 3BNC117-resistant reservoir viruses. In conclusion, viruses emerging during ATI in individuals treated with 3BNC117 are not the dominant species found in the circulating latent reservoir, but frequently appear to represent recombinants of latent viruses.
Graphical Abstract
Introduction
Small-molecule antiretroviral drugs are highly effective in suppressing HIV-1 viremia. However, therapy needs to be lifelong because it fails to eliminate a reservoir of latent HIV-1 viruses integrated into the genome of infected cells (Chun et al., 1997; Finzi et al., 1997). Significant efforts are currently focused on therapies, including immunotherapies, to target the reservoir to achieve sustainable antiretroviral therapy (ART)-free remission (Churchill et al., 2016; Martin and Siliciano, 2016).
The immunotherapeutic agents that are clinically most advanced in this respect are newly discovered broad and potent monoclonal antibodies (broadly neutralizing antibodies [bNAbs]) that recognize the HIV-1 envelope protein expressed on the surface of infected cells and virions (Halper-Stromberg and Nussenzweig, 2016). These new antibodies protect against and suppress infection in mice and macaques (Klein et al., 2012; Barouch et al., 2013; Horwitz et al., 2013; Shingai et al., 2013, 2014; Halper-Stromberg et al., 2014; Gautam et al., 2016). In human clinical trials, they suppress viremia and delay viral rebound in the setting of treatment interruption (Caskey et al., 2015, 2017; Lynch et al., 2015; Bar et al., 2016; Scheid et al., 2016). Most importantly, immunotherapy differs from small-molecule drugs in that antibodies can eliminate circulating virus and infected cells through Fc-mediated effector mechanisms (Igarashi et al., 1999; Halper-Stromberg et al., 2014; Lu et al., 2016; Horwitz et al., 2017). In addition, bNAb administration is associated with development of potent antiviral CD8+ T cell immunity in macaques (Nishimura et al., 2017).
Infusion of VRC01, an anti–CD4 binding site antibody, in the setting of continued ART did not measurably alter the size of the latent reservoir in six individuals (Lynch et al., 2015). However, the sensitivity of circulating reservoir viruses to VRC01 was not determined, and the relationship of latent viruses to plasma viruses that emerge during an analytical treatment interruption (ATI) was not examined.
Here we evaluate the effects of 3BNC117, a broad and potent anti–CD4 binding site bNAb (Scheid et al., 2011, 2016; Caskey et al., 2015), in the setting of continued ART administration and during treatment interruption. We report on the dynamics of resistant and sensitive viruses in the latent HIV reservoir over a 6-mo period before ATI, and the relationship between latent and rebound viruses.
Results
Study participants
15 HIV-1–infected participants virologically suppressed on ART were enrolled and underwent ATI (Table 1, Table S1, and Fig. S1). Participants received four intravenous infusions of 3BNC117 at 30 mg/kg at week 0, week 12, week 24, and week 27 (Fig. 1 A). Leukapheresis was performed at week −2 and week 23 to collect peripheral blood mononuclear cells (PBMCs) for analyses of the latent reservoir. ART was discontinued 2 d after the week 24 infusion. To evaluate the effects of 3BNC117 on viruses with a range of neutralization sensitivities, participants were not screened for 3BNC117 sensitivity before enrollment. All participants had a viral load of less than 50 copies/ml at day 0. The median baseline CD4+ T cell count was 688 cells/mm3, with a range of 391–1,418 cells/mm3. Most participants entered the study on a nonnucleoside reverse-transcriptase inhibitor (NNRTI)-based ART regimen. Consistent with prior observations, 10 of the 15 participants (67%) had baseline bulk outgrowth culture viruses with 3BNC117 IC50 titers <2.0 µg/ml (Table S1; Scheid et al., 2016; Cohen et al., 2018).
Table 1. Characteristics of participants at baseline (n = 15).
| Characteristics | |
|---|---|
| Male sex - n (%) | 14 (93) |
| Median age (range) | 43 (26–58) |
| Race or ethnicity | |
| White non-Hispanic | 5 |
| Black non-Hispanic | 6 |
| Hispanic, regardless of race | 3 |
| Multiple, non-Hispanic | 1 |
| HIV RNA <50 copies/ml (day 0) – n (%) | 15 (100) |
| CD4 T cell count – cells/mm3 | |
| Median (range) | 688 (391–1,418) |
| Nadir CD4 T cell count – cells/mm3 | |
| Median (range) | 350 (250-500) |
| Years since starting ART | |
| Median (range) | 11 (1-21) |
| Years on uninterrupted ART | |
| Median (range) | 7 (2-16) |
| ART regimen – n (%) | |
| Integrase inhibitor based | 5 (33) |
| Protease inhibitor based | 2 (13) |
| NNRTI based | 8 (53) |
| 3BNC117 IC50 <2.0 µg/ml – n (%) | 10 (67) |
Figure 1.

Changes in the circulating latent reservoir before treatment interruption. (A) Study design; blue arrows represent 3BNC117 infusions. (B) Change in IUPM of HIV-1 between week −2 and week 23, as determined by Q2VOA. There were no significant changes in IUPM between these two time points for any participant (defined by a more than sixfold change; Crooks et al., 2015). (C) Pie charts depicting the distribution of culture-derived env sequences from the two time points. The number in the inner circle indicates the total number of env sequences analyzed. White represents sequences isolated only once across both time points (singles), and colored areas represent identical sequences that appear more than once (clones). The size of the pie slice is proportional to the size of the clone. Red arrows denote clones that change in size between the two time points. These data include a second set of independent experiments that were performed for five participants to confirm reproducibility (Fig. S3). (D) Fluctuations within the latent reservoirs of each participant. Changes are measured in log2 fold change of IUPM between week −2 and week 23. Full bars represent clones, and empty bars represent all singles as one group. P values from Fisher’s exact test (two-sided) are shown for participants with significant changes between the two time points. ***, P < 0.001; *, P < 0.05. Colored boxes below each bar represent the 3BNC117 IC50 titer of the particular clone. NT, not tested.
Safety and pharmacokinetics
Infusions of 3BNC117 were generally well tolerated. One serious adverse event deemed not related to 3BNC117 occurred in a participant who required hospitalization for a psychotic episode associated with a new diagnosis of bipolar disorder. This participant was subsequently removed from the study before entering the ATI phase. 14 of the 15 participants who completed the study received all four infusions of 3BNC117. One participant received only three infusions because viral load results demonstrating viral rebound were available before the fourth infusion. 29 adverse events were considered at least possibly related to 3BNC117. Among these, three were graded as moderate and one was graded as severe. Complete data on adverse events is provided in Table S2. In many participants, CD4+ T cell counts transiently declined during the ATI period (Table S3). The adverse event profile observed here is similar to what has been reported in prior trials with 3BNC117 (Caskey et al., 2015; Scheid et al., 2016). The average half-life of 3BNC117 was 14.7 d, slightly shorter than the half-life of 17 d in HIV-uninfected individuals, but very similar to that previously reported for individuals receiving ART (Caskey et al., 2015; Scheid et al., 2016).
Size of the latent reservoir
The quantitative and qualitative viral outgrowth assay (Q2VOA) was used to examine the effect of 3BNC117 on the latent reservoir (Lorenzi et al., 2016). CD4+ T lymphocytes were collected by leukapheresis at weeks −2 and 23, during which time the participants remained on suppressive ART and received two infusions of 3BNC117 at weeks 0 and 12, maintaining detectable 3BNC117 serum levels for most of the 23-wk period. Q2VOA was performed for 10 participants: the first nine to enter the ATI phase of the trial (with the exception of participant 604, whose virus could not be grown in Q2VOA) and participant 616. Nine of these participants had samples available from both week −2 and week 23 (participant 609 declined the week 23 leukapheresis).
The infectious units per million (IUPM) of latently infected CD4+ T cells among these nine participants at weeks −2 and 23 ranged from 0.33 to 1.9 and 0.47 to 4.0, respectively. We found no significant changes in IUPM between the two time points for any participant (defined by a more than sixfold change; Crooks et al., 2015; Fig. 1 B). We conclude that two doses of 3BNC117 administered over 23 wk in the setting of suppressive ART does not measurably reduce the size of the latent reservoir.
The latent reservoir is dynamic over a 6-mo period
To examine the molecular nature of the replication-competent viruses in the latent reservoir, we sequenced env from latent viruses isolated by Q2VOA at weeks −2 and 23. An average of 1.18 × 10⁸ CD4+ T lymphocytes were cultured per participant per time point, yielding an average of 40 independent env sequences per participant per time point (Table S4). Phylogenetic analysis showed that each participant analyzed was infected with epidemiologically unrelated clade B viruses (Fig. S2). The clonal structure of the latent reservoir differed among the participants analyzed and could be divided into three categories: dominated by a single clone (603, 610, and 616); dominated by multiple clones (601, 602, 605, 611, and 613); or nonclonal (608; Fig. 1 C). Overall, 57% of viral sequences in the reservoir were clonal, which is consistent with previous studies (Lorenzi et al., 2016; Bui et al., 2017; Hosmane et al., 2017; Lee et al., 2017).
When comparing the two time points, we observed clonal fluctuations that varied from appearance or disappearance of clones to large alterations in their relative size. For example, a clone from participant 602 comprised 11% of the circulating reservoir at week −2 but 42% of the circulating reservoir at week 23 (Fig. 1 C). These differences could not be ascribed to variability in the assay, as determined by independently repeating the analysis on samples from five individuals (Fig. S3). Using the Q2VOA data and Bayesian inference, we inferred the IUPM of each clone at each time point. In five of the nine participants, there were statistically significant fluctuations within the circulating reservoir, indicating that the observed changes in the composition of the reservoir between the two time points was very unlikely to be the result of finite sampling alone (Fig. 1 D). However, these fluctuations were not correlated with the sensitivity of the outgrown viruses to 3BNC117, with some resistant clones decreasing in size and some sensitive clones increasing in size (Fig. 1 D). We conclude that the size of latent reservoir clones in circulation fluctuates over a 6-mo interval in individuals treated with 3BNC117 while on suppressive ART, and that this effect is independent of bNAb sensitivity.
3BNC117 delays viral rebound in sensitive participants
Participants received two additional doses of 3BNC117 2 d before and 3 wk after ART interruption (Fig. 1 A). Viral rebound occurred between 2 and 17 wk thereafter (Fig. S4). The average time to rebound was 5.5 wk, which was a significant delay compared with historical controls (P < 0.0001; Fig. 2 A). The size of the latent reservoir, as determined by Q2VOA at week 23, did not correlate with time to rebound (Fig. 2 B).
Figure 2.

Time to rebound following treatment interruption. (A) Kaplan–Meier plot comparing viral rebound in 52 historical controls who underwent ATI without antibody treatment (black), and the 15 participants (red) who underwent ATI with 3BNC117 infusions. Y axis indicates percentage of participants with viral loads below 200 RNA copies/ml, x axis indicates weeks after ATI. The P value is based on the log-rank test (two-sided). (B) Dot plot representing the relationship between IUPM at week 23 and time to rebound for all participants for whom Q2VOA was performed. The P value was calculated using the Spearman correlation (two sided). (C) Dot plot representing the 3BNC117 sensitivities of latent and rebound viruses. Q2VOA-derived latent viruses are shown as blue circles, and culture-derived rebound viruses as red circles. Culture-derived rebound viruses could not be obtained from participants 611, 613, and 616. (D) Dot plot representing the correlation between 3BNC117 sensitivity of the most resistant virus isolated by Q2VOA and week of rebound. The P value was calculated using the Spearman correlation (two-sided). (E) Kaplan–Meier plot comparing viral rebound in 52 historical controls (black), and five participants (red) whose latent reservoirs were found to contain viruses resistant to 3BNC117 (IC50 > 2.0 µg/ml) by Q2VOA. (F) Kaplan–Meier plot comparing viral rebound in 52 historical controls (black), and five participants (red) whose latent reservoirs were found to only contain viruses sensitive to 3BNC117 (IC50 ≤ 2.0 µg/ml) by Q2VOA.
To determine whether there was a correlation between the antibody sensitivity of the latent reservoir and time to rebound, we examined the antibody sensitivity of Q2VOA-derived viruses. For many participants, latent viruses exhibited a range of sensitivities to 3BNC117 and other bNAbs that target distinct epitopes (Lorenzi et al., 2016; Tables S5 and S6). For example, viruses obtained by Q2VOA for participant 601 ranged from sensitive (IC50 = 1.45 µg/ml) to completely resistant to 3BNC117 (IC50 > 50 µg/ml; Fig. 2 C, blue circles). Participant 616, who demonstrated the longest delay in time to rebound, harbored a reservoir that was both highly sensitive and of restricted neutralization diversity (Fig. 2 C). The 3BNC117 IC50 titer of the most resistant latent virus isolated from each of these participants correlated with time to rebound (P = 0.04, R2 = 0.44; Fig. 2 D). Overall, individuals with latent viruses that were resistant (IC50 > 2.0 µg/ml) had an average time to rebound of 3.6 wk, while those with sensitive viruses had an average time to rebound of 9.2 wk (Fig. 2, E and F). Thus, preexisting resistance within the latent reservoir is predictive of bNAb efficacy.
To assess the neutralization sensitivity of rebound viruses, single genome analysis (SGA) was performed on plasma, and outgrowth cultures were performed using PBMCs obtained at the time of rebound. For seven participants, outgrown viruses from the time of rebound were identical or highly similar to plasma SGA viruses (Dataset S1). Thus, the viruses isolated from rebounding cells are often similar to those isolated by plasma SGA.
Neutralization titers were determined for the viruses isolated from PBMC cultures (Cohen et al., 2018). Overall, the 3BNC117 IC50 titers measured on the rebound viruses were similar to those found among the corresponding individual’s latent viruses (Fig. 2 C, red circles). We conclude that the circulating latent viruses isolated by Q2VOA are representative of the overall neutralization profile present within the latent reservoir.
Rebound and latent viruses are distinct
Plasma rebound viruses isolated by SGA were compared with Q2VOA-derived latent viruses. Participants harboring resistant latent viruses demonstrated polyclonal rebound, while participants with sensitive latent viruses had restricted rebound diversity, as previously observed (Scheid et al., 2016; Fig. 3). Although some rebound viruses were closely related to reservoir viruses, only 3 of 217 rebound env sequences were identical to the 768 Q2VOA-derived latent viruses isolated from nine participants (Fig. 3 and Dataset S2). Moreover, the three exceptions were all found in a single individual (participant 602) and represented only 9.7% of all rebound sequences isolated from that participant (Fig. 3). Although the majority of analyzed participants harbored reservoirs dominated by expanded clones, these clones did not emerge in plasma upon treatment interruption. Strikingly, even a latent expanded clone with complete resistance to 3BNC117 could not be found among rebound viruses (Fig. 3, participant 601).
Figure 3.

Phylogenetic trees of latent and rebound env sequences. Maximum likelihood phylogenetic trees of env sequences of viruses isolated from Q2VOA outgrowth cultures and rebound SGA. Four participants with varying 3BNC117 sensitivity, clonal structure, and diversity are shown. Participants are categorized as 3BNC117 resistant or sensitive based on the presence of any resistant (IC50 > 2.0 µg/ml) viruses within the reservoir. Q2VOA-derived viruses from week −2 are represented as empty black rectangles; viruses from week 23 as full black rectangles; and rebound SGA viruses as red rectangles. Asterisks indicate nodes with significant bootstrap values (bootstrap support ≥90%). Clones are denoted by colored rectangles beside the phylogenetic tree. These colors correspond to colors in the pie charts in Fig. 1 C. Numbers represent 3BNC117 IC50 neutralization titers. For rebound viruses, neutralization values shown were determined from culture-derived viruses that were identical or highly similar to the particular SGA viruses.
3BNC117 resistance mutations in the latent reservoir
We compared the sequences of putative 3BNC117 target sites in env obtained from plasma rebound viruses to Q2VOA-derived sequences from the circulating reservoir for the presence of mutations (Caskey et al., 2015; Lynch et al., 2015; Bar et al., 2016; Scheid et al., 2016; Cheng et al., 2018). Despite the lack of overlap between the rebound and latent viruses noted above, rebound viruses demonstrated nucleotide and corresponding amino acid variants in the 3BNC117 binding site that preexisted in the latent reservoir. These variants were often present at low frequencies in the reservoir and enriched in rebound viruses (Fig. 4, red arrows). For example, all rebound sequences from participant 601 contain an isoleucine at position 459, compared with 33% of sequences within the latent reservoir. In participant 609, all rebound sequences at position 371 contain a leucine, which is present in just a small minority of latent reservoir sequences. On the other hand, there were only five cases in which amino acid variants found in the majority of rebound sequences were not detected in the latent reservoir (Fig. 4, black arrows). We conclude that while latent and rebound viruses are distinct, 3BNC117 binding site variants present in rebound viruses are frequently preexisting within the observed latent reservoir.
Figure 4.

Amino acid variants at 3BNC117 binding sites in latent and rebound viruses. Chart illustrates amino acid changes in and around known 3BNC117 contact residues in Env (amino acid positions 274–283, 364–374, and 455–471), according to HXB2 numbering. Plus symbols represent 3BNC117 contact sites confirmed by crystal structures. Q2 indicates latent viruses isolated by Q2VOA, and RB represents rebound viruses isolated by SGA. Each amino acid is represented by a color, and the frequency of each amino acid is indicated by the height of the rectangle. Red arrows represent instances in which an amino acid found at low frequency in latent viruses became a majority amino acid in rebound viruses, and black arrows represent instances in which a majority rebound virus amino acid variant was not found among latent viruses.
Relationship between rebound viruses and circulating latent viruses
Despite the fact that 3BNC117 binding site variant amino acids found in rebound sequences were already present within the latent reservoir, identical reservoir and rebound sequences were exceedingly rare. While occasional rebound viruses were very similar to latent viruses, the average Hamming distance between rebound and latent sequences among all participants was 31 nucleotides, excluding insertions and deletions.
Because Q2VOA is limited by its dependence on reactivation of latent viruses in vitro (Ho et al., 2013; Bruner et al., 2016; Hosmane et al., 2017), we also examined latent viruses by a reactivation-independent method. Near full-length HIV genome analysis (Ho et al., 2013; Bruner et al., 2016) was performed on week 23 samples for participants with Q2VOA viruses that displayed varying sensitivity, phylogenetic diversity, and clonal structure. Between 9 and 33 near full-length sequences were obtained from each of six participants, for a total of 133 sequences. For participants 603 and 616, whose reservoirs were dominated by a large clone, 85% of near full-length env genes were identical to Q2VOA-derived viruses. For the other four participants, the identity between near full-length sequences and Q2VOA-derived viruses ranged from 8.6% to 47.3% (Table S4). However, we found no instance of identical near full-length HIV sequences and rebound viruses among the five participants for whom rebound SGA sequences were available (Dataset S3). The average Hamming distance between env genes from near full-length HIV sequences and rebound viruses was 32 nucleotides, excluding insertions and deletions, which is similar to that for Q2VOA-derived sequences. We conclude that intact proviral DNA sequences obtained from circulating CD4+ T cells overlap with sequences obtained by Q2VOA but differ from sequences obtained from rebound plasma SGA.
To examine the accumulation of mutations during ATI as a potential explanation for the divergence between latent and rebound viruses, we created a mathematical model to simulate this process (Fig. S5). For each participant, we computed the frequency of mutations accumulated during the simulated rebound, where the time to rebound in simulation was within 1 wk before or after the observed time to rebound for that participant (Fig. 5 A, gray bars). Using this model and including 868 env sequences from both near full-length sequencing and Q2VOA (Fig. 5 A, blue bars), we found only seven rebound sequences that were within the number of expected mutations, and all of these were found in participant 602.
Figure 5.

Relationship between latent and rebound sequences. (A) Histograms show the percentage of env sequences (y axis) and nucleotide distance (x axis). The blue bars represent the observed Hamming distance between rebound and latent viruses. The gray bars represent the predicted distance between rebound and latent viruses based on a simulation of mutation accumulation during the ATI period for each participant. The yellow bars represent the minimal possible distance between the rebound and latent viruses including the possibility of recombination. (B) Examples of putative recombination events. Parent env sequences are represented in red or blue and child sequences in combined red and blue. LR denotes latent reservoir sequences, and RB denotes rebound sequences. The recombination breakpoints shown are the midpoints of the ranges determined by the 3SEQ algorithm (Table S8). White lines represent point mutations unique to the child sequence. Parent and child sequences shown here are marked with green and red stars, respectively, in the phylogenetic trees in Dataset S3.
To examine the possibility that rebound viruses are related to latent viruses by recombination, we analyzed latent and rebound sequences using the 3SEQ recombination algorithm (Boni, 2018). We found statistical evidence of recombination (rejection of the null hypothesis of clonal evolution) among rebound viruses for seven of the nine participants tested (Table S7). In the majority of recombination events, the two “parent” sequences derived from the latent reservoir, and the “child” sequence was a rebound sequence; however, there were instances in which the parents were comprised of either a latent and rebound sequence or two rebound sequences (Table S8). We also found evidence of recombination among latent sequences, as might be expected considering that the reservoir is established during periods of viremia (Table S9). Examples of recombinant rebound viruses are illustrated in Fig. 5 B. Of note, there was only a single instance among the 27 latent parents involved in rebound virus recombination events in which the latent virus was an expanded clone. In this case (participant 613), the rebound virus that derived from this recombination event accounted for only 1 out of the 12 rebound viruses isolated. The other 11 rebound viruses derived from a recombination event between two latent viruses that were “singles” (Dataset S3 and Tables S8 and S10). Taking into account the possibility of recombination, the observed distance between latent and rebound viruses decreases and is often close to the range predicted by the mutation simulation model described above (Fig. 5 A, yellow bars). We conclude that in addition to the accumulation of mutations during ATI, recombination may account for the considerable genetic distance between circulating latent and rebound viruses.
Discussion
We studied 15 HIV-1–infected individuals who received two doses of monoclonal antibody 3BNC117 over a 23-wk period while on suppressive ART. A third dose was administered 2 d before ART interruption, and a fourth 3 wk after ATI.
As expected, administration of 3BNC117 did not alter the size of the circulating reservoir in the setting of suppressive ART (Lynch et al., 2015). We found that the composition of the circulating latent reservoir varied significantly over the 23-wk period before ATI, and the observed fluctuations were independent of the sensitivity of the latent viruses to 3BNC117. In addition, the neutralization profile obtained from the reservoir by Q2VOA is predictive of time to rebound, and rebound virus amino acid variants are frequently preexisting within the latent reservoir. Finally, although the rebounding viruses are typically absent from the circulating latent reservoir, the sequences of rebound viruses frequently correspond to latent virus recombinants.
Antibody monotherapy in the absence of ART delays viral rebound and selects for antibody-resistant viruses (Caskey et al., 2015, 2017; Scheid et al., 2016). In a previous study, participants prescreened for 3BNC117 sensitivity by bulk culture who received infusions of 3BNC117 at time 0 and 3 wk demonstrated an average delay in rebound of 6.7 wk (Scheid et al., 2016). The same regimen was administered in the setting of the ATI in the current study, but in participants who were not prescreened for sensitivity. Retrospective analysis by Q2VOA revealed that resistant participants rebounded after 3.5 wk, which is similar to historical controls. In contrast, rebound was delayed for an average of 9.2 wk in participants whose reservoirs were found to harbor only sensitive viruses. Thus, although the outgrown viruses obtained by Q2VOA do not appear in the rebound, their neutralization profile is representative of the clinically relevant latent reservoir.
The size of the latent reservoir remains relatively constant over time, with a calculated half-life of 3.6 yr (Finzi et al., 1999; Crooks et al., 2015). Nevertheless, the reservoir is dynamic, as established by the discovery of clones of T cells bearing replication-competent integrated viruses that expand and contract over a period of years (Cohn et al., 2015; Wang et al., 2018). While bNAbs have been shown to clear infected cells (Igarashi et al., 1999; Halper-Stromberg et al., 2014; Lu et al., 2016), neither 3BNC117 nor VRC01 (Lynch et al., 2015) altered the size of the HIV reservoir when administered during suppressive ART, possibly due to the limited expression of viral env in this setting. However, there was significant fluctuation in the distribution of circulating clones of CD4+ T cells containing latent viruses over the 6-mo period before ART interruption that was not directly related to 3BNC117 sensitivity. These changes could be due to homeostatic proliferation, stimulation by cognate antigen, or cell death. For example, an influenza-specific CD4+ T cell clone that harbors a latent virus might expand after vaccination or exposure to the pathogen, and later contract. Alternatively, the observed differences could simply be due to changes in the specific T cell clones that happen to be in circulation at the two time points. Our finding that the distribution of circulating clones of latent cells can change dramatically in a relatively short period of 6 mo indicates that the circulating reservoir is far more dynamic than previously appreciated.
Viral outgrowth cultures using PBMCs are limited in that they only capture the circulating fraction of the reservoir that can be reactivated in vitro. Nevertheless, even with limited sampling, there was a 48.7% overall overlap between 133 near full-length provirus sequences amplified from DNA and 513 sequences obtained from Q2VOA in six participants (Table S4 and Dataset S3). Thus, there is good concordance between the near full-length DNA assay and Q2VOA.
Although we obtained an average of 80 latent HIV-1 sequences for each participant, we found only three instances in which the rebounding virus was identical to a latent virus. However, the neutralization sensitivity of isolated latent viruses correlated with time to rebound, and 3BNC117 binding site nucleotide and amino acid variants found in rebound sequences were frequently preexisting in the latent reservoir. The observations that latent viruses are distinct from rebound viruses, but that latent viruses are phenotypically and genotypically predictive of rebound viruses, appear to be at odds but can be reconciled at least in part if rebound viruses in fact derive from latent viruses as a result of recombination.
Recombination is a major source of HIV-1 diversity (Robertson et al., 1995; Burke, 1997). Recombination occurs when two RNA strands from different viruses coinfect a single cell, or when a virus enters a cell that is transcribing a provirus. Recombinant genomes are generated by reverse transcription template switching. HIV-1 recombination rates have been estimated at ∼1.4 × 10⁻⁵ to 1.38 × 10⁻⁴ events per base per generation (Shriner et al., 2004; Neher and Leitner, 2010; Batorsky et al., 2011). This rate is within range of that of reported HIV mutation rates (Roberts et al., 1988; Ji and Loeb, 1992; Abram et al., 2010). Recombination has been found to mediate escape from ART (Kellam and Larder, 1995; Moutouh et al., 1996), CD8+ T cells (Streeck et al., 2008; Ritchie et al., 2014), and autologous neutralizing antibodies (Chaillon et al., 2013; Moore et al., 2013; Song et al., 2018).
By incorporating the possibility of recombination and estimating the number of mutations that might have occurred during the ATI period for each participant, 63% or 137 of 217 rebounding viruses could have derived from the observed latent reservoir. This includes five of nine individuals in which all or nearly all of the rebound viruses could be accounted for by this approach. Thus, in 56% of the individuals studied, latent viruses detected by Q2VOA or near full-length genome sequencing appeared to have contributed genetic information to the viruses that emerge at the time of rebound.
Recombinants were found in 3BNC117-sensitive participants and also in the participant with complete resistance to 3BNC117 (608), and therefore these events do not appear to be dependent on bNAb administration. While expanded clones comprised 57% of all outgrowth sequences, in only a single instance did a parent recombinant sequence come from an expanded latent clone. In all other instances, the parents in the recombination events were viruses that were isolated only once across the two time points.
The dearth of expanded clones as parents in recombination events might be explained if expanded T cell clones harbor viruses with reduced fitness. Alternatively, there may be differences in reactivation requirements of latent viruses in vivo and in vitro, such that latent viruses in large clones are readily reactivated in vitro but are resistant to reactivation in vivo. The latter would be consistent with the ability of the clones to expand without undergoing apoptosis or pyroptosis, as typically happens during productive infection (Wang et al., 2018). Among other possibilities, resistance to reactivation in vivo could be related to provirus integration in a transcriptionally silent site. Differences between in vitro and in vivo reactivation may also partially explain why we did not find any correlation between IUPM values and time to rebound. Other potential explanations for this finding include the limited range of IUPM values observed, and the fact that IUPM values from outgrowth culture are not predictive of the size of the reservoir as determined by the number of intact sequences (Ho et al., 2013). Finally, the number of recombination events observed likely represents an underestimate since we only considered recombination events within env.
It has been suggested that recombination may be important for the survival of reactivated latent viruses because latent viruses are simply less fit (de Verneuil et al., 2018) or more sensitive to the host immune responses (Immonen et al., 2015). While our findings suggest that recombination does in fact confer a fitness advantage, our data do not allow us to determine when recombination occurred. If the recombinants are preexisting but not detected in circulation before the rebound, it would imply that they are extremely rare in circulation. This remains an important consideration, because although we cultured an average of 2.36 × 10⁸ CD4+ T lymphocytes per participant, the number of latent cells sampled represents only a small fraction of the total reservoir. Alternatively, rebound viruses may be emerging from a tissue-resident noncirculating cellular compartment such as those described for tissue-resident effector memory T cells in lymphoid or gut tissue (Mueller and Mackay, 2016). This might imply that such cells have a unique propensity to reactivate their latent viruses. If, on the other hand, recombination does occur at the time of rebound, it may have significant implications for understanding the emergence of viral rebound and the frequency with which latent viruses are reactivated.
In conclusion, by examining the effects of antibody therapy on the circulating latent reservoir, we document its dynamic nature and its relationship to viruses that emerge upon interruption of ART in individuals receiving 3BNC117.
Materials and methods
Study design
An open-label study was conducted in HIV-infected participants virologically suppressed on ART (clinicaltrials.gov, NCT02588586). Study participants were enrolled sequentially according to eligibility criteria. All participants provided written informed consent, and the study was conducted in accordance with International Conference on Harmonization Good Clinical Practice guidelines. The study protocol was approved by the Institutional Review Boards at the Rockefeller University and Weill Cornell Medical Center. Participants were followed for a total of 60 wk from the time of enrollment. The primary outcome measures of the study were safety and the time to virologic rebound after ART interruption.
Study participants
Study participants were recruited at The Rockefeller University Hospital and Weill Cornell Medical Center Clinical Trials Unit, both in New York. All infusions were performed at The Rockefeller University Hospital. Eligible participants were HIV-infected adults on ART aged 18–65 yr with plasma HIV-1 RNA <50 copies/ml for 12 mo before enrollment, <20 copies/ml at the time of screening, and CD4 count >500/µl. Exclusion criteria included hepatitis B or C infection, history of AIDS-defining illness within 1 yr before enrollment, CD4 nadir <200/µl, and significant medical conditions or laboratory abnormalities. Participants on an NNRTI were switched to an integrase inhibitor–based regimen 4 wk before treatment interruption to avoid monotherapy as a result of the prolonged half-life of NNRTIs. Time to viral rebound was compared with a historical cohort of 52 participants who underwent ATI without intervention in trials performed by the AIDS Clinical Trials Group, as previously described (Scheid et al., 2016).
Study procedures
The appropriate volume of 3BNC117 was calculated according to body weight, diluted in sterile normal saline to a total volume of 250 ml, and administered intravenously over 60 min. Study participants received 30 mg/kg of 3BNC117 on weeks 0, 12, 24, and 27 and remained under monitoring at The Rockefeller University Hospital for 4 h after each infusion. Participants returned for frequent follow-up visits for safety assessments, which included physical examination and measurement of clinical laboratory parameters such as hematology, chemistries, urinalysis, and pregnancy tests (for women). Leukapheresis was performed at The Rockefeller University Hospital at week −2 and week 23. ART treatment was interrupted 2 d after the third 3BNC117 infusion (week 24). ART was reinitiated after two consecutive plasma viral load measurements exceeded 200 copies/ml or CD4 counts fell below 350/µl. Plasma HIV-1 RNA levels were monitored weekly during the ATI period, and CD4 counts were measured every other week. Study investigators evaluated and graded adverse events according to the DAIDS AE Grading Table v.2.0 and determined causality. The CTCAE v.4.03 grading scale was used for reporting and grading adverse events related to infusion reactions. Blood samples were collected before and at multiple times after 3BNC117 infusion. Samples were processed within 4 h of collection, and serum and plasma samples were stored at −80°C. PBMCs were isolated by density gradient centrifugation. The absolute number of PBMCs was determined by an automated cell counter (Vi-Cell XR; Beckman Coulter), and cells were cryopreserved in FBS plus 10% DMSO.
Q2VOA
Q2VOA was performed using PBMCs isolated by leukapheresis, as previously described (Lorenzi et al., 2016). Q2VOA isolates replication-competent viruses from the latent reservoir using a limiting dilution method such that each virus likely originates from a single reactivated infectious provirus. The frequency of latently infected cells was calculated using the IUPMStats v.1.0 (Rosenbloom et al., 2015; Rosenbloom and Elliott, 2018).
Viral neutralization testing by TZM.bl neutralization assay
Supernatants from p24-positive Q2VOA wells were tested against a panel of bNAbs by the TZM.bl neutralization assay, as described (Li et al., 2005; Montefiori, 2005). Neutralization assays were conducted in a laboratory meeting Good Clinical Laboratory Practice (GCLP) Quality Assurance criteria (Michael S. Seaman, Beth Israel Deaconess Medical Center, Boston, MA).
Measurement of 3BNC117 serum levels by TZM.bl neutralization assay
Serum concentrations of 3BNC117 were measured at multiple time points postinfusion using a validated luciferase-based neutralization assay in TZM.bl cells as previously described (Sarzotti-Kelsoe et al., 2014). Briefly, serum samples were tested using a primary 1:20 dilution with fivefold titration series against HIV-1 Env pseudovirus Q769.d22, which is highly sensitive to neutralization by 3BNC117. Env pseudoviruses were produced using an ART-resistant backbone vector that reduces background inhibitory activity of antiretroviral drugs if present in the serum sample (SG3ΔEnv/K101P.Q148H.Y181C, M.S. Seaman, unpublished data). 3BNC117 clinical drug product was also tested in every assay setup using a primary concentration of 10 µg/ml with fivefold titration series. The serum concentration of 3BNC117 for each sample was calculated as follows: serum ID50 titer (dilution) × 3BNC117 IC50 titer (μg/ml) = serum concentration of 3BNC117 (μg/ml). Murine leukemia virus was used as a negative control. All assays were performed in a laboratory meeting GCLP standards. The half-life of 3BNC117 was calculated using Phoenix WinNonLin Build 8 (Certara).
Bulk cultures
We performed bulk viral outgrowth cultures using PBMCs harvested at week −2, and from rebound samples as described (Caskey et al., 2015). Sequence analysis on bulk culture viruses was performed as previously described (Lorenzi et al., 2016).
SGA of plasma rebound virus env genes
SGA and sequencing of HIV-1 env genes was performed as previously described (Salazar-Gonzalez et al., 2008; Scheid et al., 2016; Caskey et al., 2017).
Q2VOA-derived virus sequence analysis
HIV env sequences from p24-positive supernatants were obtained and analyzed as previously described (Lorenzi et al., 2016). Sequences derived from each independent Q2VOA well with double peaks (cutoff consensus identity for any residue <75%), stop codons, or shorter than the expected envelope sizes were omitted from downstream analysis. Phylogenetic analysis was performed by generating nucleotide alignments using MAFFT (Katoh and Standley, 2013) and posterior phylogenetic trees using PhyML v3.1 (Guindon et al., 2010), using the GTR model with 1,000 bootstraps.
Near full-length genome analysis
Genomic DNA was extracted from 1–10 × 106 CD4+ T cells from week 23 leukapheresis samples. DNA was subjected to limiting-dilution PCR using seminested primers in the gag gene 3GagININ 5′-GGGGCTGTTGGCTCTGGT-3′ (Ho et al., 2013; Bruner et al., 2016). PCR products were visualized and quantified using 1% 96-well E-Gels (Invitrogen). DNA dilutions in which <30% of the gag PCR wells were positive were selected for further analysis because they have a >90% of probability of containing a single copy of HIV DNA in each PCR reaction based on the Poisson distribution. Near full-length outer PCR was performed, and 1-µl aliquots were subjected to nested env PCR (Li et al., 2007; Ho et al., 2013). Samples containing ∼2,600 bp env amplicons were subjected to four-segment PCR (A, B, C, D; Ho et al., 2013). Samples containing segment A+C, A+D, B+C, or B+D were subjected to library preparation and sequencing (Lorenzi et al., 2016). Sequence adapters were removed using Cutadapt v.1.9.1, and read assembly for each virus was performed in three steps: (1) de novo assembly was performed using Spades v.3.9.0 to yield long contig files; (2) contigs longer than 255 bp were aligned to an HIV full genome reference sequence, and a consensus sequence was generated using Mira assembly v.4.0.2; and (3) reads were realigned to the consensus sequence to close gaps, and a final read consensus was generated for each sequence. Sequences with double peaks (cutoff consensus identity for any residue <75%), stop codons, or shorter than the expected near full-genome size were omitted from downstream analyses.
3BNC117 binding site analysis
All env sequences were translated to amino acids and aligned using ClustalW (Larkin et al., 2007). The HXB2 (K03455) env sequence was used as a reference for numbering the amino acids. Frequency plots were produced for each env position targeted by 3BNC117 (Zhou et al., 2013).
Clonal fluctuation calculation
Clonal composition shifts between time points in individual participants. We employed a statistical test to gauge whether such changes in composition could be explained by finite sampling alone, or whether they indicated real changes in the relative proportions of each clone in the reservoir. For this analysis, the counts for all sequences that were only observed once across time points were merged together in a group of “singles.” All other sequence counts were considered separately. We used Fisher’s exact test, implemented in R, to determine whether the counts of each clone (including the singles) observed at each time point were consistent with a single underlying distribution for both time points. IUPM were inferred for each clone based on the particular Q2VOA run from which each member of the clone was isolated, as previously described (Lorenzi et al., 2016). Bayesian Markov chain Monte Carlo was implemented in Stan, using four separate chains of 105 iterations. The first 50,000 iterations for each chain were discarded as warm-up.
Simulation of mutation accumulation during rebound
Rebounding viral sequences were rarely identical to those observed in viral outgrowth assays or by near full-length sequencing. To understand whether the differences between rebound sequences and those in the observed reservoir might be attributed to mutations accumulated during the rebound process, or whether the rebound virus was instead likely to have originated from clones that were not previously observed, we developed a stochastic mutation simulation model.
The model is based on that of Hill et al. (2014). We began with a population of 106 latently infected cells. Latent viruses can reactivate with rate A, in which case the latently infected cell becomes actively infected. The product of these two parameters (the number of latently infected cells and the reactivation rate) gives the approximate number of reactivation events per day. Actively infected cells die with rate d, without infecting other cells, or burst with rate b. In the latter case, the actively infected cell also dies, but the release of virions results in the active infection of c new cells. During each burst event, the number of new infected cells c is assumed to follow a Poisson distribution. In principle, latently infected cells could also die or homeostatically expand, but we assumed that such processes typically occur at much slower rates than the fast replication dynamics of actively infected cells. Therefore, they are not expected to contribute substantially to the rebound process, so we did not include these possibilities in our simulation.
The underlying parameters (reactivation rate, death rate of actively infected cells, etc.) are not perfectly constrained by experiment and may vary between individuals. Following the approach of Hill et al. (2014), we therefore chose the net growth rate of rebound virus, the ratio of the variance to the mean number of new infected cells during a cell bursting event, and the rate of reactivation of latently infected cells to be random within the bounds of experimental constraints (see Hill et al., 2014 for further details). In addition to these parameters, we also allowed the net death rate of actively infected cells to vary, which was not included in the analysis of Hill et al. (2014). We used the results of Markowitz et al. (2003) to constrain the death rate of infected cells, which was estimated to be ∼1 d−1 with a standard deviation of 0.3 d−1.
In addition to this simple model tracking the number of latent and actively infected cells, we also considered evolution of the virus at the sequence level. To compare with the data obtained in this study, we assumed a sequence length for Env of 2,600 bp. We are specifically interested in the accumulation of de novo mutations during the rebound process. We therefore treated the length 2,600 sequences as binary, where zeros represent nucleotides that are the same as the source sequence from the latent reservoir and ones represent a mutation. This approximation is justified because the number of mutations observed is much smaller than the length of the sequence, and thus the probability of back mutations is very small. We assumed that mutations occur during the reverse transcription process, when new infection events occur after an actively infected cell bursts. The probability of mutation per site per new infection event is 3 × 10⁻⁵ (Sanjuán et al., 2010). In addition, we allowed for the possibility of recombination between sequences, with a probability of crossover between strands of 1.4 × 10⁻⁵ per site per new infection event (Neher and Leitner, 2010). This probability also implicitly includes the probability of coinfection of a single host cell.
For simplicity, we assumed that mutations have no effect on the fitness (or replication rate) of the virus. However, it is known that nonsynonymous mutations are often strongly deleterious, including in HIV (Loeb et al., 1989; Haddox et al., 2016; Zanini et al., 2017; Louie et al., 2018). Thus, our assumption of neutrality likely overestimates the true number of mutations that would be accumulated during the rebound process.
We simulated this stochastic rebound process until either the number of actively infected cells reaches 3 × 10⁵, corresponding roughly to a threshold of detection for virus in the blood of ∼200 copies ml−1 (Hill et al., 2014), or until the total simulation time reaches 100 d. We repeated these simulations using 104 random sets of parameters as described above. Different parameter choices and stochastic effects led to a range of observed rebound times (Fig. S5). At the end of each simulation, we also recorded the distribution of the number of mutations accumulated during the rebound process. As expected, the average number of accumulated mutations in the rebound sequences increased with the rebound time, though there was substantial stochastic variation (Fig. S5).
Distance, recombination snippet
To conservatively estimate the true distance (in terms of number of mutations) between rebound sequences and those in the reservoir, we counted each observed variant in rebound sequences as a mutation only if it did not match with any of the nucleotides at that site in the observed reservoir sequences. This prevents us from computing spuriously large mutational distances simply due to recombination between diverse sequences in the reservoir during the rebound process. The estimated rate of recombination in HIV is high, comparable to the mutation rate (Neher and Leitner, 2010), and thus the possibility of recombination cannot be simply neglected. Indeed, tests for signatures of recombination (Lam et al., 2018) in the rebound sequences found multiple likely recombination events for all patients in this study except for 603 and 610.
Code availability
Code used for these simulations is available on GitHub (Barton, 2017).
Data availability
Sequence data that support the findings of this study have been deposited in GenBank with the accession codes KY113410–KY113436, MG196371–MG196394, MG196444–MG196489, MH262588–MH262721, and MH262722–MH263643.
Online supplemental material
Fig. S1 shows the participant flow diagram. Fig. S2 shows a phylogenetic tree with all env sequences from all participants. Fig. S3 shows clone frequency in repeat Q2VOA experiments. Fig. S4 shows plasma viral loads and 3BNC117 levels for individual participants. Fig. S5 shows typical time to rebound and accumulated mutations in simulations. Dataset S1 shows a phylogenetic tree of env sequences from rebound outgrowth culture and rebound SGA. Dataset S2 shows a phylogenetic tree of env sequences from Q2VOA and rebound SGA. Dataset S3 shows a phylogenetic tree of env sequences from Q2VOA, near full-length, and rebound SGA. Table S1 shows the clinical characteristics of individual participants. Table S2 shows adverse events. Table S3 shows laboratory values and 3BNC117 concentrations. Table S4 shows a summary of the number of sequences obtained. Table S5 shows IC50 titers of viruses for 3BNC117. Table S6 shows IC50 titers of viruses for other bNAbs. Table S7 shows P values from the 3SEQ recombination algorithm for rebound viruses. Table S8 shows output from the 3SEQ recombination algorithm. Table S9 shows P values from the 3SEQ recombination algorithm for latent viruses. Table S10 shows the latent parents viruses among rebound recombinants.
Supplementary Material
Acknowledgments
We thank all study participants who devoted time to our research, and members of the Nussenzweig laboratory, especially Lilian Cohn, Yotam Bar-On, Till Schoofs, and Jill Horowitz for helpful discussions. We also thank Steve Smiley, Randy Tressler, Pat Fast, and Harriet Park.
Y.Z. Cohen is supported by the National Center for Advancing Translational Sciences (grant KL2 TR001865) and the NIH Clinical and Translational Science Award program (grant UL1 TR000043). This work was supported by NIH/National Institute of Allergy and Infectious Diseases grant U01 AI118536 (to M. Caskey). This work was supported in part by the Bill and Melinda Gates Foundation Collaboration for AIDS Vaccine Discovery grants OPP1092074 and OPP1124068 and the NIH Center for HIV/AIDS Vaccine Immunology and Immunogen Discovery (grant 1UM1 AI100663; M.C. Nussenzweig); BEAT-HIV Delaney grant UM1 AI126620 (to M. Caskey); the Einstein-Rockefeller-CUNY Center for AIDS Research (grant 1P30AI124414-01A1); and the Robertson Fund. M.C. Nussenzweig is a Howard Hughes Medical Institute Investigator.
There is a patent on 3BNC117, on which M.C. Nussenzweig is an inventor. The authors declare no further conflicts of interest.
Author contributions: Y.Z. Cohen, J.C.C. Lorenzi, L. Burke, R.M. Gulick, M. Caskey, and M.C. Nussenzweig designed the research. Y.Z. Cohen, J.C.C. Lorenzi, L. Krassnig, L. Burke, C-L. Lu, P. Mendoza, K. Millard, A.L. Butler, J.P. Dizon, S.A. Balblidia, M. Witmer-Pack, I. Shimeliovich, M.S. Seaman, C. Sleckman, and M. Caskey performed the research. Y.Z. Cohen, J.C.C. Lorenzi, L. Krassnig, J.P. Barton, J. Pai, M. Caskey, T.Y. Oliveira, M. Jankovic, and M.C. Nussenzweig analyzed the data. Y.Z. Cohen, J.C.C. Lorenzi, J.P. Barton, M. Caskey, and M.C. Nussenzweig wrote the manuscript.
References
- Abram M.E., Ferris A.L., Shao W., Alvord W.G., and Hughes S.H.. 2010. Nature, position, and frequency of mutations made in a single cycle of HIV-1 replication. J. Virol. 84:9864–9878. 10.1128/JVI.00915-10 [DOI] [PMC free article] [PubMed] [Google Scholar]
- Bar K.J., Sneller M.C., Harrison L.J., Justement J.S., Overton E.T., Petrone M.E., Salantes D.B., Seamon C.A., Scheinfeld B., Kwan R.W., et al. 2016. Effect of HIV antibody VRC01 on viral rebound after treatment interruption. N. Engl. J. Med. 375:2037–2050. 10.1056/NEJMoa1608243 [DOI] [PMC free article] [PubMed] [Google Scholar]
- Barouch D.H., Whitney J.B., Moldt B., Klein F., Oliveira T.Y., Liu J., Stephenson K.E., Chang H.W., Shekhar K., Gupta S., et al. 2013. Therapeutic efficacy of potent neutralizing HIV-1-specific monoclonal antibodies in SHIV-infected rhesus monkeys. Nature. 503:224–228. 10.1038/nature12744 [DOI] [PMC free article] [PubMed] [Google Scholar]
- Barton J.P. 2017. Simple rebound simulation. Simulating viral rebound from the latent reservoir. Available at: https://github.com/bartonlab/simple-rebound-simulation. Accessed March 28, 2018.
- Batorsky R., Kearney M.F., Palmer S.E., Maldarelli F., Rouzine I.M., and Coffin J.M.. 2011. Estimate of effective recombination rate and average selection coefficient for HIV in chronic infection. Proc. Natl. Acad. Sci. USA. 108:5661–5666. 10.1073/pnas.1102036108 [DOI] [PMC free article] [PubMed] [Google Scholar]
- Boni M. 2018. 3SEQ. 3SEQ Recombination Detection Algorithm. Available at: http://mol.ax/software/3seq. Accessed February 15, 2018. [DOI] [PMC free article] [PubMed]
- Bruner K.M., Murray A.J., Pollack R.A., Soliman M.G., Laskey S.B., Capoferri A.A., Lai J., Strain M.C., Lada S.M., Hoh R., et al. 2016. Defective proviruses rapidly accumulate during acute HIV-1 infection. Nat. Med. 22:1043–1049. 10.1038/nm.4156 [DOI] [PMC free article] [PubMed] [Google Scholar]
- Bui J.K., Sobolewski M.D., Keele B.F., Spindler J., Musick A., Wiegand A., Luke B.T., Shao W., Hughes S.H., Coffin J.M., et al. 2017. Proviruses with identical sequences comprise a large fraction of the replication-competent HIV reservoir. PLoS Pathog. 13:e1006283 10.1371/journal.ppat.1006283 [DOI] [PMC free article] [PubMed] [Google Scholar]
- Burke D.S. 1997. Recombination in HIV: an important viral evolutionary strategy. Emerg. Infect. Dis. 3:253–259. 10.3201/eid0303.970301 [DOI] [PMC free article] [PubMed] [Google Scholar]
- Caskey M., Klein F., Lorenzi J.C., Seaman M.S., West A.P. Jr., Buckley N., Kremer G., Nogueira L., Braunschweig M., Scheid J.F., et al. 2015. Viraemia suppressed in HIV-1-infected humans by broadly neutralizing antibody 3BNC117. Nature. 522:487–491. 10.1038/nature14411 [DOI] [PMC free article] [PubMed] [Google Scholar]
- Caskey M., Schoofs T., Gruell H., Settler A., Karagounis T., Kreider E.F., Murrell B., Pfeifer N., Nogueira L., Oliveira T.Y., et al. 2017. Antibody 10-1074 suppresses viremia in HIV-1-infected individuals. Nat. Med. 23:185–191. 10.1038/nm.4268 [DOI] [PMC free article] [PubMed] [Google Scholar]
- Chaillon A., Wagner G.A., Hepler N.L., Little S.J., Kosakovsky Pond S.L., Caballero G., Pacold M.E., Phung P., Wrin T., Richman D.D., et al. 2013. Dynamics of viral evolution and neutralizing antibody response after HIV-1 superinfection. J. Virol. 87:12737–12744. 10.1128/JVI.02260-13 [DOI] [PMC free article] [PubMed] [Google Scholar]
- Cheng H.D., Grimm S.K., Gilman M.S., Gwom L.C., Sok D., Sundling C., Donofrio G., Karlsson Hedestam G.B., Bonsignori M., Haynes B.F., et al. 2018. Fine epitope signature of antibody neutralization breadth at the HIV-1 envelope CD4-binding site. JCI Insight. 3:97018 10.1172/jci.insight.97018 [DOI] [PMC free article] [PubMed] [Google Scholar]
- Chun T.W., Carruth L., Finzi D., Shen X., DiGiuseppe J.A., Taylor H., Hermankova M., Chadwick K., Margolick J., Quinn T.C., et al. 1997. Quantification of latent tissue reservoirs and total body viral load in HIV-1 infection. Nature. 387:183–188. 10.1038/387183a0 [DOI] [PubMed] [Google Scholar]
- Churchill M.J., Deeks S.G., Margolis D.M., Siliciano R.F., and Swanstrom R.. 2016. HIV reservoirs: what, where and how to target them. Nat. Rev. Microbiol. 14:55–60. 10.1038/nrmicro.2015.5 [DOI] [PubMed] [Google Scholar]
- Cohen Y.Z., Lorenzi J.C.C., Seaman M.S., Nogueira L., Schoofs T., Krassnig L., Butler A., Millard K., Fitzsimons T., Daniell X., et al. 2018. Neutralizing activity of broadly neutralizing anti-HIV-1 antibodies against clade B clinical isolates produced in peripheral blood mononuclear cells. J. Virol. 92:e01883-17 10.1128/JVI.01883-17 [DOI] [PMC free article] [PubMed] [Google Scholar]
- Cohn L.B., Silva I.T., Oliveira T.Y., Rosales R.A., Parrish E.H., Learn G.H., Hahn B.H., Czartoski J.L., McElrath M.J., Lehmann C., et al. 2015. HIV-1 integration landscape during latent and active infection. Cell. 160:420–432. 10.1016/j.cell.2015.01.020 [DOI] [PMC free article] [PubMed] [Google Scholar]
- Crooks A.M., Bateson R., Cope A.B., Dahl N.P., Griggs M.K., Kuruc J.D., Gay C.L., Eron J.J., Margolis D.M., Bosch R.J., and Archin N.M.. 2015. Precise quantitation of the latent HIV-1 reservoir: implications for eradication strategies. J. Infect. Dis. 212:1361–1365. 10.1093/infdis/jiv218 [DOI] [PMC free article] [PubMed] [Google Scholar]
- de Verneuil A., Migraine J., Mammano F., Molina J.M., Gallien S., Mouquet H., Hance A.J., Clavel F., and Dutrieux J.. 2018. Genetically intact but functionally impaired HIV-1 env glycoproteins in the t-cell reservoir. J. Virol. 92:01684-17. [DOI] [PMC free article] [PubMed] [Google Scholar]
- Finzi D., Hermankova M., Pierson T., Carruth L.M., Buck C., Chaisson R.E., Quinn T.C., Chadwick K., Margolick J., Brookmeyer R., et al. 1997. Identification of a reservoir for HIV-1 in patients on highly active antiretroviral therapy. Science. 278:1295–1300. 10.1126/science.278.5341.1295 [DOI] [PubMed] [Google Scholar]
- Finzi D., Blankson J., Siliciano J.D., Margolick J.B., Chadwick K., Pierson T., Smith K., Lisziewicz J., Lori F., Flexner C., et al. 1999. Latent infection of CD4+ T cells provides a mechanism for lifelong persistence of HIV-1, even in patients on effective combination therapy. Nat. Med. 5:512–517. 10.1038/8394 [DOI] [PubMed] [Google Scholar]
- Gautam R., Nishimura Y., Pegu A., Nason M.C., Klein F., Gazumyan A., Golijanin J., Buckler-White A., Sadjadpour R., Wang K., et al. 2016. A single injection of anti-HIV-1 antibodies protects against repeated SHIV challenges. Nature. 533:105–109. 10.1038/nature17677 [DOI] [PMC free article] [PubMed] [Google Scholar]
- Guindon S., Dufayard J.F., Lefort V., Anisimova M., Hordijk W., and Gascuel O.. 2010. New algorithms and methods to estimate maximum-likelihood phylogenies: assessing the performance of PhyML 3.0. Syst. Biol. 59:307–321. 10.1093/sysbio/syq010 [DOI] [PubMed] [Google Scholar]
- Haddox H.K., Dingens A.S., and Bloom J.D.. 2016. Experimental estimation of the effects of all amino-acid mutations to HIV’s envelope protein on viral replication in cell culture. PLoS Pathog. 12:e1006114 10.1371/journal.ppat.1006114 [DOI] [PMC free article] [PubMed] [Google Scholar]
- Halper-Stromberg A., and Nussenzweig M.C.. 2016. Towards HIV-1 remission: potential roles for broadly neutralizing antibodies. J. Clin. Invest. 126:415–423. 10.1172/JCI80561 [DOI] [PMC free article] [PubMed] [Google Scholar]
- Halper-Stromberg A., Lu C.L., Klein F., Horwitz J.A., Bournazos S., Nogueira L., Eisenreich T.R., Liu C., Gazumyan A., Schaefer U., et al. 2014. Broadly neutralizing antibodies and viral inducers decrease rebound from HIV-1 latent reservoirs in humanized mice. Cell. 158:989–999. 10.1016/j.cell.2014.07.043 [DOI] [PMC free article] [PubMed] [Google Scholar]
- Hill A.L., Rosenbloom D.I., Fu F., Nowak M.A., and Siliciano R.F.. 2014. Predicting the outcomes of treatment to eradicate the latent reservoir for HIV-1. Proc. Natl. Acad. Sci. USA. 111:13475–13480. 10.1073/pnas.1406663111 [DOI] [PMC free article] [PubMed] [Google Scholar]
- Ho Y.C., Shan L., Hosmane N.N., Wang J., Laskey S.B., Rosenbloom D.I., Lai J., Blankson J.N., Siliciano J.D., and Siliciano R.F.. 2013. Replication-competent noninduced proviruses in the latent reservoir increase barrier to HIV-1 cure. Cell. 155:540–551. 10.1016/j.cell.2013.09.020 [DOI] [PMC free article] [PubMed] [Google Scholar]
- Horwitz J.A., Halper-Stromberg A., Mouquet H., Gitlin A.D., Tretiakova A., Eisenreich T.R., Malbec M., Gravemann S., Billerbeck E., Dorner M., et al. 2013. HIV-1 suppression and durable control by combining single broadly neutralizing antibodies and antiretroviral drugs in humanized mice. Proc. Natl. Acad. Sci. USA. 110:16538–16543. 10.1073/pnas.1315295110 [DOI] [PMC free article] [PubMed] [Google Scholar]
- Horwitz J.A., Bar-On Y., Lu C.L., Fera D., Lockhart A.A.K., Lorenzi J.C.C., Nogueira L., Golijanin J., Scheid J.F., Seaman M.S., Gazumyan A., Zolla-Pazner S., and Nussenzweig M.C.. 2017. Non-neutralizing antibodies alter the course of HIV-1 infection in vivo. Cell. 170:637–648.e610. [DOI] [PMC free article] [PubMed] [Google Scholar]
- Hosmane N.N., Kwon K.J., Bruner K.M., Capoferri A.A., Beg S., Rosenbloom D.I., Keele B.F., Ho Y.C., Siliciano J.D., and Siliciano R.F.. 2017. Proliferation of latently infected CD4+ T cells carrying replication-competent HIV-1: potential role in latent reservoir dynamics. J. Exp. Med. 214:959–972. 10.1084/jem.20170193 [DOI] [PMC free article] [PubMed] [Google Scholar]
- Igarashi T., Brown C., Azadegan A., Haigwood N., Dimitrov D., Martin M.A., and Shibata R.. 1999. Human immunodeficiency virus type 1 neutralizing antibodies accelerate clearance of cell-free virions from blood plasma. Nat. Med. 5:211–216. 10.1038/5576 [DOI] [PubMed] [Google Scholar]
- Immonen T.T., Conway J.M., Romero-Severson E.O., Perelson A.S., and Leitner T.. 2015. Recombination enhances HIV-1 envelope diversity by facilitating the survival of latent genomic fragments in the plasma virus population. PLOS Comput. Biol. 11:e1004625 10.1371/journal.pcbi.1004625 [DOI] [PMC free article] [PubMed] [Google Scholar]
- Ji J.P., and Loeb L.A.. 1992. Fidelity of HIV-1 reverse transcriptase copying RNA in vitro. Biochemistry. 31:954–958. 10.1021/bi00119a002 [DOI] [PubMed] [Google Scholar]
- Katoh K., and Standley D.M.. 2013. MAFFT multiple sequence alignment software version 7: improvements in performance and usability. Mol. Biol. Evol. 30:772–780. 10.1093/molbev/mst010 [DOI] [PMC free article] [PubMed] [Google Scholar]
- Kellam P., and Larder B.A.. 1995. Retroviral recombination can lead to linkage of reverse transcriptase mutations that confer increased zidovudine resistance. J. Virol. 69:669–674. [DOI] [PMC free article] [PubMed] [Google Scholar]
- Klein F., Halper-Stromberg A., Horwitz J.A., Gruell H., Scheid J.F., Bournazos S., Mouquet H., Spatz L.A., Diskin R., Abadir A., et al. 2012. HIV therapy by a combination of broadly neutralizing antibodies in humanized mice. Nature. 492:118–122. 10.1038/nature11604 [DOI] [PMC free article] [PubMed] [Google Scholar]
- Lam H.M., Ratmann O., and Boni M.F.. 2018. Improved algorithmic complexity for the 3SEQ recombination detection algorithm. Mol. Biol. Evol. 35:247–251. 10.1093/molbev/msx263 [DOI] [PMC free article] [PubMed] [Google Scholar]
- Larkin M.A., Blackshields G., Brown N.P., Chenna R., McGettigan P.A., McWilliam H., Valentin F., Wallace I.M., Wilm A., Lopez R., et al. 2007. Clustal W and Clustal X version 2.0. Bioinformatics. 23:2947–2948. 10.1093/bioinformatics/btm404 [DOI] [PubMed] [Google Scholar]
- Lee G.Q., Orlova-Fink N., Einkauf K., Chowdhury F.Z., Sun X., Harrington S., Kuo H.H., Hua S., Chen H.R., Ouyang Z., et al. 2017. Clonal expansion of genome-intact HIV-1 in functionally polarized Th1 CD4+ T cells. J. Clin. Invest. 127:2689–2696. 10.1172/JCI93289 [DOI] [PMC free article] [PubMed] [Google Scholar]
- Li B., Gladden A.D., Altfeld M., Kaldor J.M., Cooper D.A., Kelleher A.D., and Allen T.M.. 2007. Rapid reversion of sequence polymorphisms dominates early human immunodeficiency virus type 1 evolution. J. Virol. 81:193–201. 10.1128/JVI.01231-06 [DOI] [PMC free article] [PubMed] [Google Scholar]
- Li M., Gao F., Mascola J.R., Stamatatos L., Polonis V.R., Koutsoukos M., Voss G., Goepfert P., Gilbert P., Greene K.M., et al. 2005. Human immunodeficiency virus type 1 env clones from acute and early subtype B infections for standardized assessments of vaccine-elicited neutralizing antibodies. J. Virol. 79:10108–10125. 10.1128/JVI.79.16.10108-10125.2005 [DOI] [PMC free article] [PubMed] [Google Scholar]
- Loeb D.D., Swanstrom R., Everitt L., Manchester M., Stamper S.E., and Hutchison C.A. III. 1989. Complete mutagenesis of the HIV-1 protease. Nature. 340:397–400. 10.1038/340397a0 [DOI] [PubMed] [Google Scholar]
- Lorenzi J.C., Cohen Y.Z., Cohn L.B., Kreider E.F., Barton J.P., Learn G.H., Oliveira T., Lavine C.L., Horwitz J.A., Settler A., et al. 2016. Paired quantitative and qualitative assessment of the replication-competent HIV-1 reservoir and comparison with integrated proviral DNA. Proc. Natl. Acad. Sci. USA. 113:E7908–E7916. 10.1073/pnas.1617789113 [DOI] [PMC free article] [PubMed] [Google Scholar]
- Louie R.H.Y., Kaczorowski K.J., Barton J.P., Chakraborty A.K., and McKay M.R.. 2018. Fitness landscape of the human immunodeficiency virus envelope protein that is targeted by antibodies. Proc. Natl. Acad. Sci. USA. 115:E564–E573. 10.1073/pnas.1717765115 [DOI] [PMC free article] [PubMed] [Google Scholar]
- Lu C.L., Murakowski D.K., Bournazos S., Schoofs T., Sarkar D., Halper-Stromberg A., Horwitz J.A., Nogueira L., Golijanin J., Gazumyan A., et al. 2016. Enhanced clearance of HIV-1-infected cells by broadly neutralizing antibodies against HIV-1 in vivo. Science. 352:1001–1004. 10.1126/science.aaf1279 [DOI] [PMC free article] [PubMed] [Google Scholar]
- Lynch R.M., Boritz E., Coates E.E., DeZure A., Madden P., Costner P., Enama M.E., Plummer S., Holman L., Hendel C.S., et al. VRC 601 Study Team . 2015. Virologic effects of broadly neutralizing antibody VRC01 administration during chronic HIV-1 infection. Sci. Transl. Med. 7:319ra206 10.1126/scitranslmed.aad5752 [DOI] [PMC free article] [PubMed] [Google Scholar]
- Markowitz M., Louie M., Hurley A., Sun E., Di Mascio M., Perelson A.S., and Ho D.D.. 2003. A novel antiviral intervention results in more accurate assessment of human immunodeficiency virus type 1 replication dynamics and T-cell decay in vivo. J. Virol. 77:5037–5038. 10.1128/JVI.77.8.5037-5038.2003 [DOI] [PMC free article] [PubMed] [Google Scholar]
- Martin A.R., and Siliciano R.F.. 2016. Progress toward HIV eradication: case reports, current efforts, and the challenges associated with cure. Annu. Rev. Med. 67:215–228. 10.1146/annurev-med-011514-023043 [DOI] [PubMed] [Google Scholar]
- Montefiori D.C. 2005. Evaluating neutralizing antibodies against HIV, SIV, and SHIV in luciferase reporter gene assays. Curr. Protoc. Immunol. Chapter 12:Unit 12 11. [DOI] [PubMed] [Google Scholar]
- Moore P.L., Sheward D., Nonyane M., Ranchobe N., Hermanus T., Gray E.S., Abdool Karim S.S., Williamson C., and Morris L.. 2013. Multiple pathways of escape from HIV broadly cross-neutralizing V2-dependent antibodies. J. Virol. 87:4882–4894. 10.1128/JVI.03424-12 [DOI] [PMC free article] [PubMed] [Google Scholar]
- Moutouh L., Corbeil J., and Richman D.D.. 1996. Recombination leads to the rapid emergence of HIV-1 dually resistant mutants under selective drug pressure. Proc. Natl. Acad. Sci. USA. 93:6106–6111. 10.1073/pnas.93.12.6106 [DOI] [PMC free article] [PubMed] [Google Scholar]
- Mueller S.N., and Mackay L.K.. 2016. Tissue-resident memory T cells: local specialists in immune defence. Nat. Rev. Immunol. 16:79–89. 10.1038/nri.2015.3 [DOI] [PubMed] [Google Scholar]
- Neher R.A., and Leitner T.. 2010. Recombination rate and selection strength in HIV intra-patient evolution. PLOS Comput. Biol. 6:e1000660 10.1371/journal.pcbi.1000660 [DOI] [PMC free article] [PubMed] [Google Scholar]
- Nishimura Y., Gautam R., Chun T.W., Sadjadpour R., Foulds K.E., Shingai M., Klein F., Gazumyan A., Golijanin J., Donaldson M., et al. 2017. Early antibody therapy can induce long-lasting immunity to SHIV. Nature. 543:559–563. 10.1038/nature21435 [DOI] [PMC free article] [PubMed] [Google Scholar]
- Ritchie A.J., Cai F., Smith N.M., Chen S., Song H., Brackenridge S., Abdool Karim S.S., Korber B.T., McMichael A.J., Gao F., and Goonetilleke N.. 2014. Recombination-mediated escape from primary CD8+ T cells in acute HIV-1 infection. Retrovirology. 11:69 10.1186/s12977-014-0069-9 [DOI] [PMC free article] [PubMed] [Google Scholar]
- Roberts J.D., Bebenek K., and Kunkel T.A.. 1988. The accuracy of reverse transcriptase from HIV-1. Science. 242:1171–1173. 10.1126/science.2460925 [DOI] [PubMed] [Google Scholar]
- Robertson D.L., Sharp P.M., McCutchan F.E., and Hahn B.H.. 1995. Recombination in HIV-1. Nature. 374:124–126. 10.1038/374124b0 [DOI] [PubMed] [Google Scholar]
- Rosenbloom D.S., and Elliott O.. 2018. IUPMStats v1.0. Infection Frequency Calculator. Available at: http://silicianolab.johnshopkins.edu/#. Accessed March 5, 2018.
- Rosenbloom D.I., Elliott O., Hill A.L., Henrich T.J., Siliciano J.M., and Siliciano R.F.. 2015. Designing and interpreting limiting dilution assays: general principles and applications to the latent reservoir for human immunodeficiency virus-1. Open Forum Infect. Dis. 2:ofv123 10.1093/ofid/ofv123 [DOI] [PMC free article] [PubMed] [Google Scholar]
- Salazar-Gonzalez J.F., Bailes E., Pham K.T., Salazar M.G., Guffey M.B., Keele B.F., Derdeyn C.A., Farmer P., Hunter E., Allen S., et al. 2008. Deciphering human immunodeficiency virus type 1 transmission and early envelope diversification by single-genome amplification and sequencing. J. Virol. 82:3952–3970. 10.1128/JVI.02660-07 [DOI] [PMC free article] [PubMed] [Google Scholar]
- Sanjuán R., Nebot M.R., Chirico N., Mansky L.M., and Belshaw R.. 2010. Viral mutation rates. J. Virol. 84:9733–9748. 10.1128/JVI.00694-10 [DOI] [PMC free article] [PubMed] [Google Scholar]
- Sarzotti-Kelsoe M., Bailer R.T., Turk E., Lin C.L., Bilska M., Greene K.M., Gao H., Todd C.A., Ozaki D.A., Seaman M.S., et al. 2014. Optimization and validation of the TZM-bl assay for standardized assessments of neutralizing antibodies against HIV-1. J. Immunol. Methods. 409:131–146. 10.1016/j.jim.2013.11.022 [DOI] [PMC free article] [PubMed] [Google Scholar]
- Scheid J.F., Mouquet H., Ueberheide B., Diskin R., Klein F., Oliveira T.Y., Pietzsch J., Fenyo D., Abadir A., Velinzon K., et al. 2011. Sequence and structural convergence of broad and potent HIV antibodies that mimic CD4 binding. Science. 333:1633–1637. 10.1126/science.1207227 [DOI] [PMC free article] [PubMed] [Google Scholar]
- Scheid J.F., Horwitz J.A., Bar-On Y., Kreider E.F., Lu C.L., Lorenzi J.C., Feldmann A., Braunschweig M., Nogueira L., Oliveira T., et al. 2016. HIV-1 antibody 3BNC117 suppresses viral rebound in humans during treatment interruption. Nature. 535:556–560. 10.1038/nature18929 [DOI] [PMC free article] [PubMed] [Google Scholar]
- Shingai M., Nishimura Y., Klein F., Mouquet H., Donau O.K., Plishka R., Buckler-White A., Seaman M., Piatak M. Jr., Lifson J.D., et al. 2013. Antibody-mediated immunotherapy of macaques chronically infected with SHIV suppresses viraemia. Nature. 503:277–280. 10.1038/nature12746 [DOI] [PMC free article] [PubMed] [Google Scholar]
- Shingai M., Donau O.K., Plishka R.J., Buckler-White A., Mascola J.R., Nabel G.J., Nason M.C., Montefiori D., Moldt B., Poignard P., et al. 2014. Passive transfer of modest titers of potent and broadly neutralizing anti-HIV monoclonal antibodies block SHIV infection in macaques. J. Exp. Med. 211:2061–2074. 10.1084/jem.20132494 [DOI] [PMC free article] [PubMed] [Google Scholar]
- Shriner D., Rodrigo A.G., Nickle D.C., and Mullins J.I.. 2004. Pervasive genomic recombination of HIV-1 in vivo. Genetics. 167:1573–1583. 10.1534/genetics.103.023382 [DOI] [PMC free article] [PubMed] [Google Scholar]
- Song H., Giorgi E.E., Ganusov V.V., Cai F., Athreya G., Yoon H., Carja O., Hora B., Hraber P., Romero-Severson E., et al. 2018. Tracking HIV-1 recombination to resolve its contribution to HIV-1 evolution in natural infection. Nat. Commun. 9:1928 10.1038/s41467-018-04217-5 [DOI] [PMC free article] [PubMed] [Google Scholar]
- Streeck H., Li B., Poon A.F., Schneidewind A., Gladden A.D., Power K.A., Daskalakis D., Bazner S., Zuniga R., Brander C., et al. 2008. Immune-driven recombination and loss of control after HIV superinfection. J. Exp. Med. 205:1789–1796. 10.1084/jem.20080281 [DOI] [PMC free article] [PubMed] [Google Scholar]
- Wang Z., Gurule E.E., Brennan T.P., Gerold J.M., Kwon K.J., Hosmane N.N., Kumar M.R., Beg S.A., Capoferri A.A., Ray S.C., et al. 2018. Expanded cellular clones carrying replication-competent HIV-1 persist, wax, and wane. Proc. Natl. Acad. Sci. USA. 115:E2575–E2584. 10.1073/pnas.1720665115 [DOI] [PMC free article] [PubMed] [Google Scholar]
- Zanini F., Puller V., Brodin J., Albert J., and Neher R.A.. 2017. In vivo mutation rates and the landscape of fitness costs of HIV-1. Virus Evol. 3:vex003 10.1093/ve/vex003 [DOI] [PMC free article] [PubMed] [Google Scholar]
- Zhou T., Zhu J., Wu X., Moquin S., Zhang B., Acharya P., Georgiev I.S., Altae-Tran H.R., Chuang G.Y., Joyce M.G., et al. NISC Comparative Sequencing Program . 2013. Multidonor analysis reveals structural elements, genetic determinants, and maturation pathway for HIV-1 neutralization by VRC01-class antibodies. Immunity. 39:245–258. 10.1016/j.immuni.2013.04.012 [DOI] [PMC free article] [PubMed] [Google Scholar]
Associated Data
This section collects any data citations, data availability statements, or supplementary materials included in this article.
Supplementary Materials
Data Availability Statement
Sequence data that support the findings of this study have been deposited in GenBank with the accession codes KY113410–KY113436, MG196371–MG196394, MG196444–MG196489, MH262588–MH262721, and MH262722–MH263643.