

Abstract
Magnetic resonance imaging is integral to the care of patients with high-grade gliomas. Anatomic detail can be acquired with conventional structural imaging, but newer approaches also add capabilities to interrogate image-derived physiologic and molecular characteristics of central nervous system neoplasms. These advanced imaging techniques are increasingly employed to generate biomarkers that better reflect tumor burden and therapy response. The following is an overview of current strategies based on advanced magnetic resonance imaging that are used in the assessment of high-grade glioma patients with an emphasis on how novel imaging biomarkers can potentially advance patient care.
Keywords: Glioma, Glioblastoma, Diffusion magnetic resonance imaging, Magnetic resonance angiography, Spectrum analysis
Approximately 78,000 new brain tumors, one third of which are malignant, are diagnosed yearly in the United States. Glial tumors constitute approximately three-fourths of primary malignant brain neoplasms and are largely responsible for poor outcomes of brain tumor patients.1
Magnetic resonance imaging (MRI) and computed tomography (CT) are widely used to assess neurologic disorders. The use of CT is commonplace in the acute clinical setting due to its rapidity of image acquisition and wide availability. However, MRI is the modality of choice for the evaluation of brain tumors based on, in comparison to CT, better anatomic detail of normal brain structures and detection of tumor-infiltrated areas. Additionally, a wide array of MR pulse sequences has been developed that can be tailored to detect a variety of intracranial aberrations. MRI has also been a critical component of brain tumor treatment trials, based upon its ability to generate surrogate endpoints that correlate with patient outcomes. The goal of this chapter is to provide an overview of MRI-based imaging strategies with the highest potential to improve management of high-grade glioma (HGG) patients.
Conventional MRI techniques
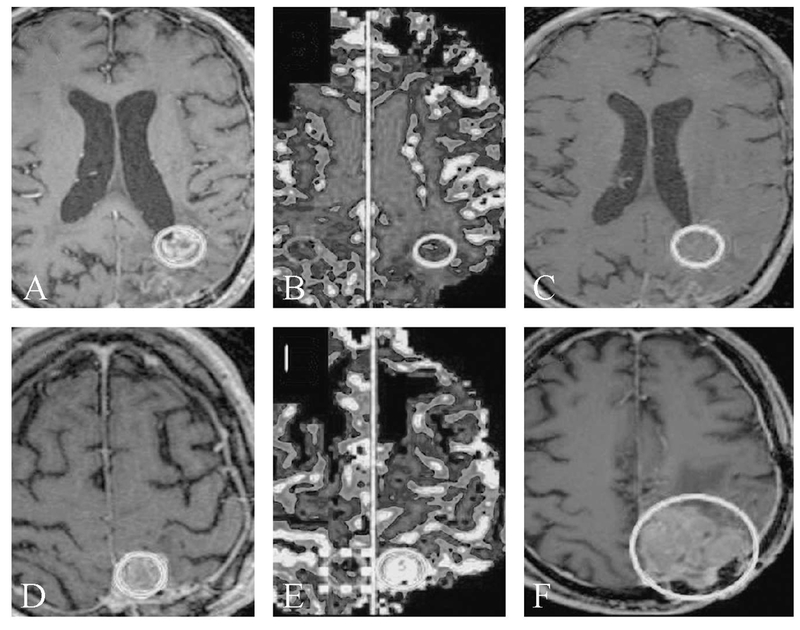
Conventional MRI sequences commonly used for evaluation of intracranial malignancy include T1-weighted (T1W), T2-weighted (T2W), fluid attenuated inversion recovery (FLAIR), T2*W gradient echo and post-contrast T1W images. These sequences provide exquisite anatomic detail, and the use of a gadolinium-based contrast agent in this protocol allows for the detection of areas where the blood-brain barrier is compromised. Yet, many important limitations of this standard brain tumor imaging remain. For instance, it can be difficult or impossible to distinguish various glioma grades and underlying histology (e.g.: grade II versus grade III tumors, or oligodendroglioma versus astrocytoma), and the appearance of treatment-related changes can overlap that of residual or recurrent tumor. Furthermore gliomas can be difficult to distinguish from other intra-cranial mass lesions such as metastasis, abscess and tumefactive multiple sclerosis (Figure 1). These limitations are important to note as they can impact patient prognosis as well as treatment approaches.
Figure 1.

—Glioblastoma and mimics. Axial post-contrast T1-weighted images of the brain in 6 patients. All patients demonstrate a ring-enhancing lesion. Histopathologic diagnoses were toxoplasmosis (A), neurocysticercosis (B), tuberculosis (C), tumefactive multiple sclerosis (D), primary CNS lymphoma in an immunocompromised patient (E) and glioblastoma (F).
In general, gliomas are hypointense on T1W images and hyperintense on T2W images. Contrast enhancement, necrosis, hemorrhage, ill-defined infiltration of surrounding brain and abundant peritumoral edema are commonly considered imaging characteristics of aggressive lesions and raise the possibility of a high-grade glial neoplasm. The association of contrast enhancement with tumor grade has been extensively studied. Although contrast enhancement is a common feature of HGG, it remains a nonspecific finding. For example, almost a third of HGG tumors do not enhance, while nearly 50% of low grade oligodendrogliomas demonstrate some enhancement.2 The presence of enhancement with central necrosis in which there is an irregular ring enhancing lesion with central T2 hyperintensity is a common feature of glioblastoma (GBM) (WHO grade IV), but a variety of other pathologies (abscess, multiple sclerosis, lymphoma in immunocompromised individuals, etc.) can generate a similar appearance. GBMs are often highly infiltrative tumors and can cross into the contralateral hemisphere via the corpus callosum. Satellite lesions and intratumoral hemorrhage are also frequently encountered imaging features of these tumors. The combination of a ring-enhancing lesion with areas of hypo- or non-enhancing tumor infiltration involving the cortex or deep nuclei is particularly suggestive of GBM.
According to the updated 2016 World Health Organization guidelines, oligodendrogliomas are genetically characterized by the presence of the isocitrate dehydrogenase (IDH) mutation and 1p/19q codeletion. Tumors with histologic features of oligodendroglioma and mutated IDH, but without 1p/q19 codeletion, are classified as astrocytomas. The previously identified oligoastrocytoma is now a discouraged terminology, with the classification of oligodendroglioma “not otherwise specified” (NOS) used for tumors with incomplete or unclear genetic testing.3 As with tumor grade, it would advantageous to non-invasively distinguish astrocytomas from oligodendrogliomas by MRimaging. Unfortunately conventional MRfeatures of astrocytoma and oligodendroglioma are highly overlapping. Oligodendrogliomas have been described as more often centered in the cortex and exhibiting coarse or abundant calcification, but these features are too rarely present and lack the needed specificity to allow for the accurate identification of oligodendrogliomas based on imaging alone. Thus, structural imaging has, to date, fallen short in the ability to definitively establish tumor grade and histologic subtype for gliomas.
Advanced MRI techniques
While conventional MRI is exceptional in providing detailed structural evaluation of both the brain and intracranial neoplasms of all kinds, advanced MR techniques offer the ability to interrogate the pathophysiologic properties of tumors that may yield important information on tumor infiltration, aggressiveness, treatment response and, in general, generate a better understanding of underlying tumor biology. Commonly used advanced MR techniques include perfusion-weighted imaging (PWI), MR spectroscopy (MRS) and diffusion-weighted imaging (DWI) and its variants such as diffusion tensor imaging (DTI),
Diffusion imaging
DWI is a technique with a multitude of applications within neuroimaging as well as in other areas of radiology. The technique employs MRI sequences sensitized to the movement of water molecules. Pulse sequences are generated so that water molecules that do not move between pulse applications are refocused, and thus are able to generate signal, whereas those that do move lose their ability to generate signal in the reconstructed image. Thus areas of restricted diffusion are bright on DWI, whereas areas of free water motion are dark. Measurements of the degree of signal change with varying gradient strengths allows for calculation of an apparent diffusion coefficient (ADC), with lower ADC values reflecting lower (more restricted) diffusion.
A number of physiologic properties of tumors may influence ADC values. Cystic and necrotic areas allow for more free diffusion of water molecular in comparison to intact tissue, resulting in high ADC values. In solid tumor tissue the main factor affecting ADC is the size and complexity of the extra-cellular space. Increased cell density will limit the extracellular space and thus ADC can, with appropriate caveats, be used as an indirect measurement of cellularity.4
Tissue microstructure can produce directional variations in ADC, known as anisotropic (as opposes to isotropic) diffusion. Diffusion data can be acquired in multiple gradient directions to allow for the diffusional coefficient to be characterized in terms of magnitude and direction. Employing greater numbers of gradient directions results in more complete estimation of the directional variations in ADC in 3-dimensional space. Since diffusion is more prevalent parallel rather than transverse to myelinated nerve fibers, this DTI technique allows the visualization of dominant white matter tracts, where the degree of diffusional anisotropy can be presented as color coded, three-dimensional directional maps of nerve fibers (tractography).5 Tractographic data can be used to demonstrate the relationship between tumors and major white matter tracts, a major concern for surgical planning (Figure 2). Another promising application of DTI imaging is the potential to detect and predict the invasive growth patterns of high-grade tumors such as GBM.6 A multitude of additional variations of diffusion imaging such as diffusion kurtosis imaging,7 high b value,8 histogram curve fitting,9 functional diffusion maps,10–12 and restriction spectrum imaging 13 are currently under investigation and may provide additional insights into complex tissue environments.
Figure 2.

—Diffusion tensor tractography for surgical planning. Axial (A) and sagittal (B) T2-weighted images of the brain with superimposed color-coded DTI-derived tractographic images. Note displacement of fiber tracts by the tumor (red arrow).
Perfusion imaging
A hallmark of tumor physiology is the delivery of nutrients and removal of waste by diffusion processes until growth renders this method insufficient to support cell division and continued growth. Once stressed by hypoxia and hypoglycemia, tumors produce factors which initiate the development of new blood vessels, a process known as neoangiogenesis.14 In tumors where growth surpasses the angiogenic process, tumor vasculature will be irregular with arteriovenous shunts, multiple blind-ending vessels and areas of hypoperfusion and even necrosis. The use of advanced MR imaging to quantify and characterize this abnormal microvascular environment is a powerful tool in understanding these variations in tumor biology. MR perfusion imaging capitalizes on the altered microvascular environment and provides information potentially relevant to tumor grade, treatment response and tumor aggressiveness. Perfusion imaging is in widespread use clinically, and it has been shown to prospectively impact the confidence of both imagers in assessing tumor status and clinicians in determining tumor treatment plans.15 Several forms of perfusion imaging have been developed to generate a variety of perfusion-based biomarkers. Dynamic susceptibility contrast (DSC) and dynamic contrast-enhanced (DCE) imaging are dependent on the intravenous injection on gadolinium-based contrast agents, whereas arterial spin labelling (ASL), which uses magnetic labeling of endogenous protons in blood to assess blood volume flow and flow rate, can be acquired without injectable contrast.
Dynamic susceptibility contrast perfusion
DSC perfusion is the most commonly used MR technique in the assessment of brain tumors. Aseries of T2*W images are acquired, using high temporal resolution, with power injection of intravenous contrast during dynamic image acquisition. The contrast bolus retains integrity as it passes through the brain producing a relatively brief decrease in signal intensity, reflecting the concentration of intravascular contrast. This signal change can be analyzed using a number of algorithmic approaches in order to calculate the relative cerebral blood volume (rCBV), among other metrics.
DSC calculations are based on the assumption that all contrast is intravascular, which does not hold in tumors with areas of blood-brain barrier breakdown. The resulting leaked contrast produces a strong and competing T1 contrast effect which leads to falsely low measurements of CBV. This T1 shine-through effect can be minimized by preloading the patient with a dose of contrast before acquisition of dynamic data and using algorithm-based leakage correction methods.16 Despite the widespread use of DSC-MRI in the clinical setting and proposals for standardized techniques, considerable heterogeneity exists across institutions which often limits the generalizability of DSC findings.17
Dynamic contrast-enhanced perfusion
DCE uses dynamic T1W acquisition to measure changes in signal intensity during contrast administration. Unlike in DSC-MRI, the signal changes from intravascular and extravascular contrast leakage are additive, allowing for direct estimation of contrast leakage and blood-brain barrier permeability. DCE-MRI also is less degraded by susceptibility artifact in comparison to the more widely utilized DSC-MRI, a feature which is of particular importance in imaging gliomas with intratumoral blood products and post-operative hardware which can degrade image quality.18 Many clinical applications of DCE use semi-quantitative analytic methods, usually attempting to quantify the rate of change or degree of change of signal intensity relative to baseline. A modified version of the Tofts pharmacokinetic model is the most commonly used analytic approach in DCE, producing three main imaging biomarkers: estimates of the vascular fraction (vp), extravascular extracellular space fraction (ve) and the transfer contrast coefficient (Ktrans).19 Despite the potential benefits, the clinical implementation of DCE-MRI to this point has been limited. The relative long acquisition times of DCE protocols are one important barrier to wider adoption of this technique. Research is ongoing to design DCE techniques which address many of the technical challenges associated with this modality in an attempt to allow wider acceptance into clinical use.20
Arterial spin labeling
ASL differs from other methods of MR perfusion imaging in that it does not depend on exogenous contrast, and instead relies on magnetic labeling of blood flowing into tissues of interest. A variety of different approaches to ASL exist, each designed to improve the relatively poor signal-to-noise ratio of the ASL sequences and the potential inaccuracies in measurement of CBF. ASL can provide relatively accurate absolute quantification of cerebral perfusion in normal brain along with a number of timing parameters reflecting the speed of inflow of blood to the tissue. Although ASL is not as widely utilized as DCE-MRI, there continue to be advances in this technique with a promising outlook for future application in glioma imaging.21
See Table I for a summary of the most commonly derived MR imaging biomarkers in glioma.
Table I. —MR imaging biomarkers commonly used in the assessment of brain tumor patients with glioma.
| Technique | Biomarker | Correlation |
|---|---|---|
| DWI | Apparent diffusion coefficient | Cellular density |
| DSC-MRI | Relative cerebral blood volume | Vascular proliferation |
| Relative cerebral blood flow | ||
| Mean transit time | ||
| DCE-MRI | V(p) Contrast transfer coefficient (Ktrans) |
Vascular proliferation Vascular permeability |
| ASL | Cerebral blood flow | Vascular proliferation |
| DTI | Fractional anisotropy of water molecules |
White matter tracts |
MR spectroscopy
Proton MRI is dependent on signal generated from free protons, which are most abundant in water. In addition to free protons, the MRI signal is also affected to a much lesser degree by protons bound to macromolecules, which are found in low relative concentrations in biologic tissues. Despite their scarcity, these bound protons have specific frequency variations, which are expressed in parts per millions (ppm) in relation to a known reference frequency. Acquiring data which allows separation of these small frequency peaks, each representing a specific macromolecular component, is known as MR spectroscopy (MRS). MRS is a sensitive technique for detecting such components at very low concentrations, if sufficient suppression of the water signal can be achieved.22
MRS can be acquired with single and multivoxel techniques. In single voxel MRS metabolite concentrations are generated by averaging data over a relatively larger ROI. In multivoxel MRS, 2Dand 3Dmaps can be generated in order to detect spatial variation in metabolite concentrations. Molecular species commonly resolved by MRS include N-acetyl aspartate (NAA), choline (Cho), creatine (Cr), lactate, myoinositol and lipid. A summary of the biochemical process related to these metabolites are reviewed in Table II.
Table II. —Commonly measurement metabolites using MR spectroscopy.
| Metabolite | Significance |
|---|---|
| NAA | Surrogate for neuronal integrity |
| Choline | Marker for turnover in membrane |
| Creatine | Marker for energy metabolism; internal control |
| Lactate | Non-oxidative glycolysis. Seen in necrosis and hypoxia |
| Lipid | Marker for cellular necrosis |
Emerging imaging techniques
Many additional advanced MRI techniques are being developed for brain tumor applications. Chemical exchange saturation transfer (CEST) MRI is one research technique with exciting potential to add value to standard imaging after eventual translation into clinical use. CEST creates imaging contrast based on sensitivity to chemical exchange of protons on functional metabolic groups rather than exogenously administered contrast.23 The CEST technique which has primarily been applied to brain tumor imaging is the exchange of amide protons of endogenous tissue proteins and peptides, known as amide proton transfer (APT). Early studies have shown a potential use of APT in the differentiation of tumor from edema and true progression versus pseudoprogression, although these techniques have yet to be widely applied clinically.24 Current research is also ongoing into other CEST techniques utilizing other metabolites such as creatine and D-glucose, as potential imaging markers of tumor physiologic processes.25, 26
Clinical applications of advanced MRI
Imaging of treatment response
The current standard for response assessment in glioma is represented by the RANO(Response Assessment in Neuro-Oncology) criteria, released in 2010. The RANO criteria represented a refinement of the prior standard, the Macdonald criteria. The Macdonald criteria, which was developed for CT and extrapolated to MRI, relied on the assessment of enhancing tumor only.27 The RANO criteria incorporates qualitative assessment of non-enhancing tumor into the response evaluation.28 Analysis of data from the phase II BRAIN trial demonstrated that identification of PFS was reduced when using RANO compared to Macdonald criteria.29 This is mostly due to the designation of FLAIR-only tumor progression for some patients using RANO; a category of progression not available for the Macdonald criteria. Table III summarizes the differences between the RANO and Macdonald criteria.
Table III. Comparison of Macdonald versus RANO assessment of disease status in high-grade glioma.
| Parameter | Macdonald | RANO |
|---|---|---|
| Complete response (CR) | Disappearance of all measurable enhancing disease | Disappearance of all measurable and non-measurable enhancing disease |
| Improved or stable non-enhancing disease | ||
| Clinically stable or improved | Clinically stable or improved | |
| No corticosteroids | No corticosteroids | |
| Partial response (PR) | ≥50% decrease in the enhancing disease | ≥50% decrease in the enhancing disease |
| No progression in the non-measurable disease | ||
| Stable or improving non-enhancing disease | ||
| Clinically stable or improved | Clinically stable or improved | |
| Stable or reduced corticosteroids use | Stable or reduced corticosteroids use | |
| Stable disease (SD) | Imaging that does not meet criteria for CR, PR or progression |
Imaging that does not meet criteria for CR, PR or progression |
| Clinically stable | Clinically stable | |
| Stable or reduced corticosteroids use | Stable or reduced corticosteroids use | |
| Disease progression | ≥25% increase in the enhancing disease | ≥25% increase in the enhancing and/or significant increase in the non-enhancing disease |
| New lesions | New lesions | |
| Clear progression in the non-measurable disease | ||
| Clinical deterioration | Clinical deterioration |
Despite response criteria revisions, there are many well recognized imaging findings that can occur during glioma treatment regimens which may lead to interpretive difficulties. For example, following temozolomide (TMZ) and radiotherapy, patients with GBM may demonstrate increasing enhancement and progressive T2 signal abnormality. Follow up scans without interval treatment often demonstrate improvement. This “pseudoprogression,” seen in approximately 20–30% of patients within 3 months from the completion of radiation therapy, is actually associated with better patient outcomes.28, 30 Radiation necrosis, which typically occurs many months after the completion of radiation treatment, and pseudoprogression can be grouped under the broader term “treatment effect” to distinguish these phenomena from tumoral enhancement.
True tumor progression versus pseudoprogression
Advanced MR imaging techniques have been employed to allow improved identification of true tumor progression, a critical determination in the care of HGG patients. For instance, diffusion imaging can be used as a surrogate of cellularity. Thus restricted diffusion in an enhancing lesion favors tumor over treatment effect. Various ADC cut off values to distinguish the two have been proposed.31, 32 Parametric response maps and high b value diffusion acquisition have also been advocated as methods to further improved identification of true progression with diffusion imaging.
It has been found that true progression tends to have higher perfusion than pseudoprogression (Figure 3). For instance in one cohort of GBM patients, rCBV increased by an average of 12% in patients with true progression, but decreased by an average of 41% in patients with pseudoprogression by 1 month after treatment initiation.33 In another study progressing lesions demonstrated a CBV greater than 2.2 mL/100 g and corresponded to regions of increased metabolism on FDG-PET, consistent with tumor recurrence. Conversely regressing lesions had CBV less than 1.7 mL/100 g and largely corresponded to regions of hypometabolism on FDG-PET, indicative of treatment effect. Lesion progression versus regression could be distinguished, based on an absolute CBV threshold of 2.0 mL/100 g, with a reported sensitivity and specificity of 100%.34 A more recent study analyzed data from 44 GBM patients using DSC to differentiate progression from treatment-related change. Maximum rCBV rather than mean rCBV appeared slightly better at differentiating true tumor progression from treatment effect with 78% sensitivity and 86% specificity when rCBVmax was set to 2.6. Interestingly neither rCBVmean nor rCBVmax was predictive of overall survival.35 It can be argued that this is a limitation of perfusion imaging methods, as OS is a fundamental endpoint for which highly accurate surrogate imaging markers are needed.
Figure 3.
—Pseudoprogression identified with perfusion imaging. Axial post-contrast T1-weighted images (A, C, D, F) and axial rCBV maps (B, E) of the brain. For patient 1 (A-C), the initial image shows an enhancing periventricular lesion (A, oval), with low rCBV (B, oval). Follow-up imaging (C) shows resolution of enhancement (oval) compatible with the lesion representing pseudoprogression on the initial images. Conversely, for patient 2 an initial enhancing lesion (D, oval), shows markedly elevated rCBV (E, oval) and the lesion progresses on follow-up imaging (F, oval), compatible with true progression.
One potential refinement of DSC imaging is to assess changes in perfusion over the course of treatment, rather than at a single time point. For instance in a study of HGG patients treated with radiation therapy, temozolomide and the radiosensitizer paclitaxel poliglumex, mean rCBV at initial enhancing lesion growth was not significantly different between true and pseudoprogressors. However, change in rCBV at first follow-up as well as the overall linear trend in rCBV was significantly different between the two groups.36
Different protocols and applications of PWI have been investigated as a means to add value to standard MRI, with somewhat variable results. However, in a large meta-analysis of data from 28 articles published since 2005, the pooled sensitivity and specificity of DSC was 90% and 88%, respectively, for detecting true tumor recurrence in the setting of possible pseudoprogression.37 Thus the totality of the evidence indicates that DSCis fairly accurate in identifying true tumor progression. Achieving even greater accuracy may require combining DSC data with other advanced imaging modalities such as DTI,38 ASL,39 and MRS.40, 41 This is not guaranteed, however; a recent meta-analysis of 9 studies found that monoparametric and multiparametric MRI performed equally in a clinical context.42 Another caveat is that true versus pseudoprogression is a false dichotomy as oftentimes there is an intermixing of viable tumor and treatment effect with variable ratios of the two components.43 This fractional tumor burden, which appears to correlate with perfusion metrics, may provide a better marker for overall survival. Similarly investigations based on a combination of DSC and DTI data have also categorized tissue into true progression, mixed response, and pseudoprogression.38 Such approaches may more accurately model post-treatment tumors.
Anti-angiogenic therapy and non-enhancing tumor
Incorporation of antiangiogenic agents into GBM treatment regimens lengthen progression free survival (PFS) but does not significantly affect overall survival (OS).44 Antiangiogenic therapy can result in rapid reduction in capillary endothelial permeability, suppressing tumor enhancement, irrespective of change in tumor size. This phenomenon may generate falsely diminished estimates of tumor burden (Figure 4), leading to the use of the term “pseudoresponse.” Pseudoresponse is one key driver of the need to develop MR protocols that can accurately assess both enhancing and non-enhancing tumor burden.
Figure 4.
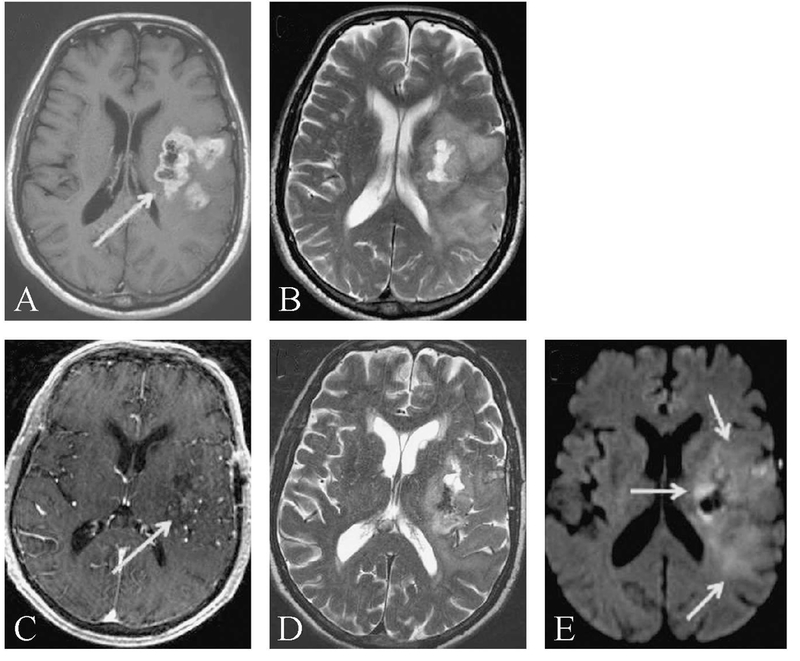
—Pseudoresponse and diffusion imaging. Axial post-contrast T1-weighted (A, C), T2-weighted (B, D), and DWI(E) images of a patient with glioblastoma. On initial presentation the patient had a left cerebral ring-enhancing mass (A, arrow) with surrounding vasogenic edema seen as T2-hyperintese areas (B). Following biopsy and 1 week of anti-angiogenic therapy with bevacizumab, tumor-related enhancement nearly resolved (C, arrow). However, diminished but still abundant T2 hyperintensity (D) corresponded to areas of DWIsignal abnormality (E, arrows) with low ADC(not shown), compatible with residual non-enhancing tumor. Such rapid resolution of contrast enhancement independent of substantial tumor shrinkage is compatible with pseudoprogression.
As with cytotoxic therapies, progressive enhancement during antiangiogenic treatment has been shown to be associated with shorter OS. However, no difference in OS was found in a study of HGG patients treated with the anti-angiogenic drug bevacizumab with improved versus stable contrast enhancement, raising the possibility that pseudoresponse was degrading the prognostic significance of tumor size measurements that are based on contrast-enhancing tissue.45 This difficulty was addressed with the use of DSC, which could stratify survival in patients with improved or stable contrast enhancement, as shown in a follow-up study.46 Although this finding has been disputed, and may depend on timing of perfusion imaging,47 it remains a possibility that the incorporation of perfusion metrics in trials of antiangiogenic therapy could be beneficial in predicting outcome.
Another issue that degrades accuracy of non-enhancing tumor detection is post-treatment changes that lead to increased abnormal, yet non-specific, T2/FLAIR signal that can be confused with viable tumor. Specifically, it can be a challenge on some scans to differentiate vasogenic edema, gliosis, post-ischemic change and other entities from non-enhancing tumor. Advanced MRI techniques have been vigorously investigated as a means to overcome this challenge.
Perfusion imaging also may add value in distinguishing non-enhancing tumor from gliosis and edema. Both DCE-MRI and DSC-MRI appear to be helpful in identifying areas of tumor infiltration, which is associated with higher perfusion parameters in comparison to vasogenic edema.48, 49 These metrics may also be useful in identifying areas of tumor infiltration that are at risk of subsequent tumor progression.50
Diffusion imaging also has been used to identify areas of tumor infiltration, particularly in the setting of anti-angiogenic therapy. This application is based on the theory that tumoral infiltration is associated with higher cellularity resulting in less diffusion,51 whereas simple vasogenic edema results in increased diffusion. For instance it has been shown that areas of T2 change which subsequently develop decreased diffusion go on to develop enhancing tumor.52, 53 Yet it is important to note that not all such diffusion restriction is indicative of viable tumor. Antiangiogenic therapy is associated with the development of new areas of persistent restricted diffusion that can be confused with non-enhancing tumor.54 These regions are typically periventricular and can have an intrinsically T1W hyperintense rim (Figure 5). An ADC cut-off value of 0.736 ×10⁻³ mm2/s has been proposed to distinguish the two, with ADC values above the cut-off indicative of viable tumor.55 Thus, careful interpretation of diffusion imaging in gliomas, particularly in those patients receiving antiangiogenic therapy, is warranted.
Figure 5.

—Persistent diffusion restriction after anti-angiogenic treatment. Axial diffusion (A, E), T2-weighted (B, F), T1-weighted (C, G) and post-contrast T1-weighted images of a patient with glioblastoma treated with bevacizumab. At the first time point show (A-D) the patient had developed a DWI and T2 bright (A and B arrow) peri-ventricular lesion with restricted diffusion that demonstrated an intrinsically T1-hyperintense rim (C, arrow) and little or no contrast enhancement (D). Follow-up imaging nearly 1 year later showed little interval change in the lesion (arrow, E-H) and no evidence of progression compatible with the lesion representing treatment effect rather than growing tumor.
Early response detection and predictive markers
Markers that predict poor response at baseline or early in a patient’s treatment course could help improve therapeutic decision-making. Thus several studies have focused on such early response and predictive markers. One such approach assessed the prognostic value of DWI by generating ADC histograms from enhancing tumor components and found that tumors with low ADC values were more likely to progress at 6 months compared to tumors with high ADCvalues.56 This association of outcomes with ADC analysis held true only for an anti-angiogenic agent, and not for cytotoxic drugs, thereby suggesting that this imaging marker is predictive of treatment response with a specific class of drugs, rather than simply being a prognostic marker (Figure 6). Recently this predictive marker of anti-angiogenic therapy has been validated by analyzing a large data set from 5 separate phase II clinical trials of multiple anti-angiogenic agents.9
Figure 6.

—ADC as predictive biomarker for high grade glioma response to anti-angiogenic therapy. Pre-contrast T1-weighted images are subtracted from post-contrast T1-weighted images to generate T1-subtraction maps which are then segmented and overlaid on the ADC Map (process illustrated in part A). Voxels from the enhancing region are used to generate an ADC histogram fitted with a 2-normal curve with a lower (ADCL) and higher (ADCH) component (part B). A larger volume of ADCL<1.24 μm2/ms is associated with shorter survival (part C, red graph) in glioblastoma patients treated with anti-angiogenic therapy (from Ellingson et al.).9
In addition to ADC analysis, perfusion imaging has also been used to stratify response to anti-angiogenic therapy either alone,57, 58 or in combination with other non-imaging markers.59, 60 In the latter case the authors developed a novel biomarker (vascular normalization index) that combined K trans from DCE with microvessel volume and circulating collagen type IV (serum biomarker). This index was predictive of OS and PFS in patients treated with anti-angiogenic therapy.61
Imaging metrics are often averaged over the entirety of the region of interest. But a newer technique termed “parametric response maps” allow for the assessment of serial changes on a voxel-by-voxel level. Thus competing or weak regional signals in a tumor overlooked due to averaging by traditional analysis, may be detectable by this method. This analysis, when applied to tumor CBV and ADC values, can be predictive of treatment response at a time point when changes in average values have yet to occur.10–12, 60
Immunotherapy response assessment
As in many other areas of clinical oncology, a variety of immunotherapies are being actively explored for potential effectiveness in the treatment of HGG. This can create a significant challenge in the imaging assessment of treatment response, as enhancement on MRI in these patients could represent an active inflammatory response indicating potentially effective therapy, or it could simply be due to tumor progression.62 The immunotherapy response assessment in neuro-oncology (iRANO) was published in 2015 as a first attempt to recognize specific challenges in interpreting the measurement of treatment-related imaging changes in the setting of immunotherapies.63 At this early point, the current recommendation is to consider the possibility of an immunotherapy pseudoprogression, and advocates for patients to receive a confirmation scan at 3 months, anytime enhancing lesion enlargement is observed within 6 months of the start of immunotherapy. Although empirically determined it should be noted that pseudoprogression can occur beyond this 6-monght cut-off.64 Markers for pseudoprogression in the setting of immunotherapy may differ from those that have been successfully employed for pseudoprogression in patients with standard therapy. But as with standard therapy, advanced MR such as perfusion imaging has been investigated as a way to identify pseudoprogressors but to date the utility and accuracy required for adoption into the clinical standard of care has not been demonstrated.65
MRI molecular characterization
The 2016 WHO classification of central nervous system tumors represented a substantial change in comparison to the 2007 predecessor for defining and categorizing intracranial malignancies. The 2016 guidelines, for the first time, specified the importance of molecular findings, in addition to histology, for the identification of tumor types. The new classifications go so far as to favor the genetic findings in cases of molecular and histologic discordance.3
As a result there is increasing interest in attempting to correlate conventional MRI tumor characteristics such as enhancement, necrosis and edema with relevant molecular and genetic features.66 Advanced MRI techniques are also actively being researched for their ability to provide genotypic correlates of gliomas. Currently the most clinically relevant molecular changes include co-deletion of 1p/19q in oligodendroglial tumors, isocitrate dehydrogenase (IDH) mutations and methylguanine methyltransferase (MGMT) promoter methylation.
Codeletion of 1p/19q
The 1p/19q co-deletion in oligodendroglioma is a prognostic factor for better chemoradiotherapy response and longer survival.67 An indistinct tumor border on T1W and T2W images and heterogeneous signal intensity on T2W images are some of the conventional MR features that have been correlated with 1p/19q co-deletion status.68 Textural analysis of T2 signal has been found to predict 1p/19q co-deletion with a sensitivity and specificity of 93% and 96% respectively.69 1p/19q co-deleted tumors also appear to have higher rCBV than their non-deleted counterparts.70 To date MR spectroscopy and other non-perfusion advanced MR metrics do not appear to add value to establish 1p/19q co-deletion status, at least in isolation, but may yet yield improvements in diagnostic accuracy when combined with PWI.71
Isocitrate dehydrogenase mutation
Mutations of the IDH gene are associated with improved survival irrespective of tumor grade. They are found in secondary but only rarely in primary GBM. There are three isoforms of the IDH gene, the most important mutations of which involve cytosolic IDH1 and the mitochondrial IDH2 forms; the majority of IDH mutants in glioma are IDH1 mutations.72
Some conventional MR features have been linked to the presence of the IDH1 mutation. Although controversial to some degree,73 several studies have suggested that IDH1 mutant gliomas have a predilection for the frontal lobe and have larger volumes of non-enhancing tumor.74–76 Low grade wildtype IDH1 glioma may be more infiltrative than IDH1 mutant tumors.77 And rCBV is higher in IDH1 wildtype GBM than in IDH1 mutants.78
IDH1 mutations cause the production of 2-hydroxyglutarate (2-HG), an oncometabolite that can be detected with MRspectroscopy79 (Figure 7). The presence of 2-HGis highly specific for IDH1 mutant tumors. In a recent study, MRS was used to measure 2-HGin patients with IDH mutant gliomas before and after radiochemotherapy. 2-HG levels declined significantly on post-treatment scans raising the possibility that measurements of 2-HGlevels could be a biomarker of drug response.80 Other groups have linked 2-HGMRS quantitative measurements to the amount of metabolically active cells in gliomas.81 It remains to be determined whether monitoring 2-HGlevels with MRS can provide a more sensitive or specific or an earlier marker of treatment response.
Figure 7.

—Magnetic resonance spectroscopy for identifying IDH1 mutant gliomas. Axial fluid-attenuated inversion recovery (FLAIR) images (A, B) of two anaplastic astrocytomas (WHO grade III) show areas of abnormal hyperintensity compatible with tumor. Comparison of representative MR spectra from the IDH1 mutant (C) versus wild-type (D) glioma. Note the extra peaks in the region of Glu/Gln/2-HG(centered at 2.25 ppm) that are increased in the IDH1 mutant tumors (from Pope et al.).79
MGMT promoter methylation
Methylation of the MGMT repair protein promoter inhibits transcription of MGMT, increases sensitivity to TMZ, and positively impacts patient prognosis.82 Tumor features derived from standard and advanced MRI have been investigated as a way of non-invasively identifying MGMT promoter methylation status. For instance, ring enhancement is associated with non-methylated MGMT promoter.83 In a study of 358 de-novo GBM, MGMT promoter methylated tumors were more commonly found in the left, compared to the right, cerebral hemisphere.84 However a similar analysis with a much smaller number of patients (N.=72) failed to show spatial preference for these tumors.83 It has also been suggested that limited edema is associated with improved prognosis in tumors with MGMT promoter methylation.74
Advanced MR imaging strategies have also been used to predict MGMT promoter methylation with varying success. For instance, an ADC histogram analysis found that MGMT promoter methylation was associated with a low median ADC of the lower curve.85 Conversely, higher average ADC values are associated with MGMT promoter methylation.86, 87 One study found higher rCBV in unmethylated versus methylated tumors,88 although another study found no significant association.86 A study of 43 GBM patients using DCE-MRIfound that MGMT methylated tumors had increased permeability (higher Ktrans) compared to unmethylated tumors.87 The same group also reported that the initial area under the time-to-signal intensity curve from DCE imaging stratifies survival in promoter unmethylated MGMT GBM, but not in methylated tumors.89 Arecent study combined both structural and physiologic MR imaging to derive an accurate marker for MGMT promoter methylation status in 92 patients with GBM. The authors found that MGMT promoter methylation was associated with increased ADC and decreased rCBF(from ASL imaging). They also found that MGMT promoter methylated tumors occurred more commonly in regions not contacting the subventricular zone and tended to be more necrotic. In a model combining tumor location, necrosis, ADC and rCBF, the authors were able to establish MGMT promoter methylation status with an impressive area under the curve (AUC) of 0.91.90
Although validation in larger cohorts in required, the studies discussed above indicate that there is a relationship between molecular features of GBM and qualitative and quantitative image-derived biomarkers. The diagnostic and prognostic molecular features of GBM are typically established by histological analysis following initial biopsy or tumor resection. But GBM may change molecular features over treatment course, for instance down regulating MGMT expression.91 Since re-biopsy in many of these patients is not clinically feasible, having a non-invasive measure of molecular status could provide valuable information on disease status potentially impacting treatment decisions.
Treatment planning
Surgical and radiotherapy treatment planning can be aided by advanced MRI applications which can improve identification of tumor extent, localization of the aggressive component of a tumor, for biopsy targeting and careful evaluation of the tumor relationship to the major white matter tracts.
Surgical planning
A single glioma may contain areas of varying tumor histologic grade. Since the overall grade of the tumor is defined by the most malignant portion, tumor biopsy (as opposed to complete resection) carries the risk of sampling less malignant portions of the tumor, leading to undergrading of the glioma. This challenge can be overcome by using standard and advance MRto target tumor “hotspots” with the highest malignant potential. For instance, DCE-MRImaps have been shown to identify high-yield targets for biopsy planning.92 Similarly relative Chol to NAAlevels can be used as an indicator of cellularity, identifying tumors areas subsequently targeted for biopsy or radiosurgery.93 Patients using MRS-selected targeted radiosurgery in GBM had longer average survival compared to historical controls,93 suggesting this technique could improve patient outcomes, but this result will need to be validated in prospective and randomized studies.
An additional benefit of advanced MRI techniques is their ability to improve delineation of the extent tumor invasion and margins, as tumoral components can extend beyond the enhancing radiologic abnormality demonstrated on conventional MRI. A number of studies have shown that PWI, DWI and MRS can all provide clinically useful information regarding tumor infiltration and are helpful in distinguishing invasion from peripheral vasogenic edema.94 A recent study by Cordova et al. evaluated the integration of preoperative MRS with intraoperative imaging navigation and stereotactic tissue extraction, and validated the ability of MRS to define invasive disease beyond the limitations of conventional MRsequences.95 The relationship between the tumor and major white matter tracts also could be evaluated using diffusion tractography, enabling assessment of the degree of tumoral infiltration or tract displacement there by guiding surgical approach and extent of resection.96
Radiotherapy planning
Advanced MRI techniques have, furthermore, been investigated for their ability to accurately delineate the target volume for radiotherapy. Using MR spectroscopy to delineate a target volume has been reported to identify a larger target volume compared to conventional MRI.97 Measurements of the isotropic and anisotropic components of the diffusion weighted signal have identified three separate tumor margin patterns: 1) diffuse pattern of marginal abnormality (isotropic exceeds anisotropic measurements in all directions) associated with diffuse increasing tumor size over time; 2) localized pattern of abnormality where tumor occurred in one specific direction; and 3) minimal abnormality pattern that was associated with no evidence of recurrence. The importance of these findings is that DTI is potentially predictive of tumor recurrence patterns and can be incorporated into RT treatment planning.98, 99 It is important to note that the impact of advanced MRI techniques on patient survival or morbidity has not been firmly established.
Conclusions
Interpretation of conventional MRI sequences used in glioma imaging are becoming more standardized across institutions, in large part due to the guidance of the initial Macdonald and subsequent RAN Oresponse assessment criteria. Reproducible technical parameters and well-established imaging markers will allow for the incorporation of these approaches into future radiographic response assessment criteria necessary for optimization of clinical trials. Towards that goal standardized protocols for implementation in glioma treatment trials100 and also for perfusion imaging17 have been proposed and are being widely adopted.
Imaging is key in tumor diagnosis and can provide valuable insights into patient prognosis. Imaging provides spatial information, relationship of tumor to eloquent brain and white matter structures crucial for surgical planning and imaging identifies areas targeted for biopsy and radiotherapy. Imaging can be combined with clinical attributes including age, sex and Karnofsky performance status to refine prognosis. There is a continuously expanding repertoire of available advanced MRI techniques to evaluate patients with HGG. Conventional and physiologic markers have been demonstrated to be a non-invasive surrogate for underlying genetic profiles that impact prognosis and treatment and are evermore central to the clinical care of glioma patients. Integrating the strengths of advanced MRI with other techniques such as PET, functional MRI and quantitative machine learning techniques (radiomics) will improve our ability to accurately assess disease burden and plan treatment. Predictive and early response markers predicated on noninvasive techniques are an area where imaging may have substantial impact on therapy strategies with potential for improving the clinical outcomes in patients with high grade gliomas.
Footnotes
Conflicts of interest.—The authors certify that there is no conflict of interest with any financial organization regarding the material discussed in the manuscript.
Contributor Information
Whitney B. POPE, Department of Radiological Sciences, David Geffen School of Medicine, University of California - Los Angeles, Los Angeles, CA, USA.
Garth BRANDAL, Department of Radiological Sciences, David Geffen School of Medicine, University of California - Los Angeles, Los Angeles, CA, USA.
References
- 1.Ostrom QT, Gittleman H, Liao P, Vecchione-Koval T, Wolinsky Y, Kruchko C, et al. CBTRUS Statistical Report: primary brain and other central nervous system tumors diagnosed in the United States in 2010–2014. Neuro-oncol 2017;19(suppl_5):v1–88 [DOI] [PMC free article] [PubMed] [Google Scholar]
- 2.Upadhyay N, Waldman AD. Conventional MRIevaluation of gliomas. Br J Radiol 2011;84:S107–11. [DOI] [PMC free article] [PubMed] [Google Scholar]
- 3.Louis DN, Perry A, Reifenberger G, von Deimling A, Figarella-Branger D, Cavenee WK, et al. The 2016 World Health Organization Classification of Tumors of the Central Nervous System: a summary. Acta Neuropathol 2016;131:803–20. [DOI] [PubMed] [Google Scholar]
- 4.Ellingson BM, Malkin MG, Rand SD, Connelly JM, Quinsey C, LaViolette PS, et al. Validation of functional diffusion maps (fDMs) as a biomarker for human glioma cellularity. J Magn Reson Imaging 2010;31:538–48. [DOI] [PMC free article] [PubMed] [Google Scholar]
- 5.Mukherjee P, Berman JI, Chung SW, Hess CP, Henry RG. Diffusion tensor MR imaging and fiber tractography: theoretic underpinnings. AJNRAm J Neuroradiol 2008;29:632–41. [DOI] [PMC free article] [PubMed] [Google Scholar]
- 6.Mohsen LA, Shi V, Jena R, Gillard JH, Price SJ. Diffusion tensor inva-sive phenotypes can predict progression-free survival in glioblastomas. Br J Neurosurg 2013;27:436–41. [DOI] [PubMed] [Google Scholar]
- 7.Hempel JM, Schittenhelm J, Bisdas S, Brendle C, Bender B, Bier G, et al. In vivo assessment of tumor heterogeneity in WHO2016 glioma grades using diffusion kurtosis imaging: diagnostic performance and improvement of feasibility in routine clinical practice. J Neuroradiol 2018;45:32–40. [DOI] [PubMed] [Google Scholar]
- 8.Zeng Q, Ling C, Shi F, Dong F, Jiang B, Zhang J. Glioma infiltration sign on high b-value diffusion-weighted imaging in gliomas and its prog-nostic value. J Magn Reson Imaging 2018. March 1 [Epub ahead of print] [DOI] [PubMed]
- 9.Ellingson BM, Gerstner ER, Smits M, Huang RY, Colen R, Abrey LE, et al. Diffusion MRI Phenotypes Predict Overall Survival Benefit from Anti-VEGFMonotherapy in Recurrent Glioblastoma: Converging Evi-dence from Phase II Trials. Clin Cancer Res 2017;23:5745–56. [DOI] [PMC free article] [PubMed] [Google Scholar]
- 10.Hamstra DA, Chenevert TL, Moffat BA, Johnson TD, Meyer CR, Mukherji SK, et al. Evaluation of the functional diffusion map as an early biomarker of time-to-progression and overall survival in high-grade glioma. Proc Natl Acad Sci USA2005;102:16759–64. [DOI] [PMC free article] [PubMed] [Google Scholar]
- 11.Hamstra DA, Galbán CJ, Meyer CR, Johnson TD, Sundgren PC, Tsien C, et al. Functional diffusion map as an early imaging biomarker for high-grade glioma: correlation with conventional radiologic response and overall survival. J Clin Oncol 2008;26:3387–94. [DOI] [PMC free article] [PubMed] [Google Scholar]
- 12.Tsien C, Galbán CJ, Chenevert TL, Johnson TD, Hamstra DA, Sundgren PC, et al. Parametric response map as an imaging biomarker to distinguish progression from pseudoprogression in high-grade glioma. J Clin Oncol 2010;28:2293–9. [DOI] [PMC free article] [PubMed] [Google Scholar]
- 13.Krishnan AP, Karunamuni R, Leyden KM, Seibert TM, Delfanti RL, Kuperman JM, et al. Restriction Spectrum Imaging Improves Risk Stratification in Patients with Glioblastoma. AJNR Am J Neuroradiol 2017;38:882–9. [DOI] [PMC free article] [PubMed] [Google Scholar]
- 14.Hanahan D, Weinberg RA. The hallmarks of cancer. Cell 2000;100:57–70. [DOI] [PubMed] [Google Scholar]
- 15.Geer CP, Simonds J, Anvery A, Chen MY, Burdette JH, Zapadka ME, et al. Does MR perfusion imaging impact management decisions for patients with brain tumors? Aprospective study. AJNRAm J Neuroradiol 2012;33:556–62. [DOI] [PMC free article] [PubMed] [Google Scholar]
- 16.Boxerman JL, Schmainda KM, Weisskoff RM. Relative cerebral blood volume maps corrected for contrast agent extravasation significantly correlate with glioma tumor grade, whereas uncorrected maps do not. AJNRAm J Neuroradiol 2006;27:859–67. [PMC free article] [PubMed] [Google Scholar]
- 17.Welker K, Boxerman J, Kalnin A, Kaufmann T, Shiroishi M, Wintermark M; American Society of Functional Neuroradiology MR Perfusion Standards and Practice Subcommittee of the ASFNR Clinical Practice Committee. ASFNR recommendations for clinical performance of MR dynamic susceptibility contrast perfusion imaging of the brain. AJNR Am J Neuroradiol 2015;36:E41–51. [DOI] [PMC free article] [PubMed] [Google Scholar]
- 18.Griffith B, Jain R. Perfusion Imaging in Neuro-Oncology: Basic Techniques and Clinical Applications. Magn Reson Imaging Clin N Am 2016;24:765–79. [DOI] [PubMed] [Google Scholar]
- 19.Jackson A Analysis of dynamic contrast enhanced MRI. Br J Radiol 2004;77:S154–66 [DOI] [PubMed] [Google Scholar]
- 20.Guo Y, Lebel RM, Zhu Y, Lingala SG, Shiroishi MS, Law M, et al. High-resolution whole-brain DCE-MRIusing constrained reconstruction: prospective clinical evaluation in brain tumor patients. Med Phys 2016;43:2013–23. [DOI] [PMC free article] [PubMed] [Google Scholar]
- 21.Ata ES, Turgut M, Eraslan C, Dayanır YÖ. Comparison between dynamic susceptibility contrast magnetic resonance imaging and arterial spin labeling techniques in distinguishing malignant from benign brain tumors. Eur J Radiol 2016;85:1545–53. [DOI] [PubMed] [Google Scholar]
- 22.Howe FA, Opstad KS. 1H MR spectroscopy of brain tumours and masses. NMR Biomed 2003;16:123–31. [DOI] [PubMed] [Google Scholar]
- 23.Hyare H, Thust S, Rees J. Advanced MRITechniques in the Monitoring of Treatment of Gliomas. Curr Treat Options Neurol 2017;19:11. [DOI] [PubMed] [Google Scholar]
- 24.Kushnirsky M, Nguyen V, Katz JS, Steinklein J, Rosen L, Warshall C, et al. Time-delayed contrast-enhanced MRI improves detection of brain metastases and apparent treatment volumes. J Neurosurg 2016;124:489–95. [DOI] [PubMed] [Google Scholar]
- 25.Cai K, Tain RW, Zhou XJ, Damen FC, Scotti AM, Hariharan H, et al. Creatine CEST MRIfor Differentiating Gliomas with Different Degrees of Aggressiveness. Mol Imaging Biol 2017;19:225–32. [DOI] [PMC free article] [PubMed] [Google Scholar]
- 26.Xu X, Yadav NN, Knutsson L, Hua J, Kalyani R, Hall E, et al. Dynamic Glucose-Enhanced (DGE) MRI: Translation to Human Scanning and First Results in Glioma Patients. Tomography 2015;1:105–14. [DOI] [PMC free article] [PubMed] [Google Scholar]
- 27.Macdonald DR, Cascino TL, Schold SC Jr, Cairncross JG. Response criteria for phase II studies of supratentorial malignant glioma. J Clin Oncol 1990;8:1277–80. [DOI] [PubMed] [Google Scholar]
- 28.Wen PY, Macdonald DR, Reardon DA, Cloughesy TF, Sorensen AG, Galanis E, et al. Updated response assessment criteria for high-grade glio-mas: response assessment in neuro-oncology working group. J Clin Oncol 2010;28:1963–72. [DOI] [PubMed] [Google Scholar]
- 29.Huang RY, Rahman R, Ballman KV, Felten SJ, Anderson SK, Ellingson BM, et al. The Impact of T2/FLAIREvaluation per RANO Criteria on Response Assessment of Recurrent Glioblastoma Patients Treated with Bevacizumab. Clin Cancer Res 2016;22:575–81. [DOI] [PubMed] [Google Scholar]
- 30.Kruser TJ, Mehta MP, Robins HI. Pseudoprogression after glioma therapy: a comprehensive review. Expert Rev Neurother 2013;13:389–403. [DOI] [PubMed] [Google Scholar]
- 31.Matsusue E, Fink JR, Rockhill JK, Ogawa T, Maravilla KR. Distinction between glioma progression and post-radiation change by combined physiologic MR imaging. Neuroradiology 2010;52:297–306. [DOI] [PubMed] [Google Scholar]
- 32.Lee WJ, Choi SH, Park CK, Yi KS, Kim TM, Lee SH, et al. Diffusion-weighted MRimaging for the differentiation of true progression from pseudoprogression following concomitant radiotherapy with temozolomide in patients with newly diagnosed high-grade gliomas. Acad Radiol 2012;19:1353–61. [DOI] [PubMed] [Google Scholar]
- 33.Mangla R, Singh G, Ziegelitz D, Milano MT, Korones DN, Zhong J, et al. Changes in relative cerebral blood volume 1 month after radiation-temozolomide therapy can help predict overall survival in patients with glioblastoma. Radiology 2010;256:575–84. [DOI] [PubMed] [Google Scholar]
- 34.Larsen VA, Simonsen HJ, Law I, Larsson HB, Hansen AE. Evaluation of dynamic contrast-enhanced T1-weighted perfusion MRI in the dif-ferentiation of tumor recurrence from radiation necrosis. Neuroradiology 2013;55:361–9. [DOI] [PubMed] [Google Scholar]
- 35.Blasel S, Zagorcic A, Jurcoane A, Bähr O, Wagner M, Harter PN, et al. Perfusion MRI in the Evaluation of Suspected Glioblastoma Recur-rence. J Neuroimaging 2016;26:116–23. [DOI] [PubMed] [Google Scholar]
- 36.Boxerman JL, Ellingson BM, Jeyapalan S, Elinzano H, Harris RJ, Rogg JM, et al. Longitudinal DSC-MRI for Distinguishing Tumor Recur-rence From Pseudoprogression in Patients With a High-grade Glioma. Am J Clin Oncol 2017;40:228–34. [DOI] [PubMed] [Google Scholar]
- 37.Patel P, Baradaran H, Delgado D, Askin G, Christos P, John Tsiouris A, et al. MR perfusion-weighted imaging in the evaluation of high-grade gliomas after treatment: a systematic review and meta-analysis. Neuro-oncol 2017;19:118–27. [DOI] [PMC free article] [PubMed] [Google Scholar]
- 38.Wang S, Martinez-Lage M, Sakai Y, Chawla S, Kim SG, Alonso-Basanta M, et al. Differentiating Tumor Progression from Pseudopro-gression in Patients with Glioblastomas Using Diffusion Tensor Imaging and Dynamic Susceptibility Contrast MRI. AJNRAm J Neuroradiol 2016;37:28–36. [DOI] [PMC free article] [PubMed] [Google Scholar]
- 39.Choi YJ, Kim HS, Jahng GH, Kim SJ, Suh DC. Pseudoprogression in patients with glioblastoma: added value of arterial spin labeling to dynamic susceptibility contrast perfusion MRimaging. Acta Radiol 2013;54:448–54. [DOI] [PubMed] [Google Scholar]
- 40.Seeger A, Braun C, Skardelly M, Paulsen F, Schittenhelm J, Ernemann U, et al. Comparison of three different MR perfusion techniques and MRspectroscopy for multiparametric assessment in distinguishing recurrent high-grade gliomas from stable disease. Acad Radiol 2013;20:1557–65. [DOI] [PubMed] [Google Scholar]
- 41.Zhang H, Ma L, Wang Q, Zheng X, Wu C, Xu BN. Role of magnetic resonance spectroscopy for the differentiation of recurrent glioma from radiation necrosis: a systematic review and meta-analysis. Eur J Radiol 2014;83:2181–9. [DOI] [PubMed] [Google Scholar]
- 42.Suh CH, Kim HS, Jung SC, Choi CG, Kim SJ. Multiparametric MRI as a potential surrogate endpoint for decision-making in early treatment response following concurrent chemoradiotherapy in patients with newly diagnosed glioblastoma: a systematic review and meta-analysis. Eur Ra-diol 2018;28:2628–38. [DOI] [PubMed] [Google Scholar]
- 43.Hu LS, Eschbacher JM, Heiserman JE, Dueck AC, Shapiro WR, Liu S, et al. Reevaluating the imaging definition of tumor progression: perfusion MRI quantifies recurrent glioblastoma tumor fraction, pseudoprogression, and radiation necrosis to predict survival. Neuro-oncol 2012;14:919–30. [DOI] [PMC free article] [PubMed] [Google Scholar]
- 44.Gilbert MR, Dignam JJ, Armstrong TS, Wefel JS, Blumenthal DT, Vogelbaum MA, et al. Arandomized trial of bevacizumab for newly diag-nosed glioblastoma. N Engl J Med 2014;370:699–708. [DOI] [PMC free article] [PubMed] [Google Scholar]
- 45.Boxerman JL, Zhang Z, Safriel Y, Larvie M, Snyder BS, Jain R, et al. Early post-bevacizumab progression on contrast-enhanced MRI as a prognostic marker for overall survival in recurrent glioblastoma: results from the ACRIN 6677/RTOG0625 Central Reader Study. Neuro-oncol 2013;15:945–54. [DOI] [PMC free article] [PubMed] [Google Scholar]
- 46.Schmainda KM, Zhang Z, Prah M, Snyder BS, Gilbert MR, Sorensen AG, et al. Dynamic susceptibility contrast MRI measures of relative cerebral blood volume as a prognostic marker for overall survival in recurrent glioblastoma: results from the ACRIN 6677/RTOG0625 multicenter trial. Neuro-oncol 2015;17:1148–56. [DOI] [PMC free article] [PubMed] [Google Scholar]
- 47.Boxerman JL, Schmainda KM, Zhang Z, Barboriak DP. Dynamic susceptibility contrast MRI measures of relative cerebral blood volume continue to show promise as an early response marker in the setting of bevacizumab treatment. Neuro-oncol 2015;17:1538–9. [DOI] [PMC free article] [PubMed] [Google Scholar]
- 48.Artzi M, Blumenthal DT, Bokstein F, Nadav G, Liberman G, Aizenstein O, et al. Classification of tumor area using combined DCE and DSC MRIin patients with glioblastoma. J Neurooncol 2015;121:349–57. [DOI] [PubMed] [Google Scholar]
- 49.Artzi M, Bokstein F, Blumenthal DT, Aizenstein O, Liberman G, Corn BW, et al. Differentiation between vasogenic-edema versus tumor-infiltrative area in patients with glioblastoma during bevacizumab thera-py: a longitudinal MRI study. Eur J Radiol 2014;83:1250–6. [DOI] [PubMed] [Google Scholar]
- 50.Akbari H, Macyszyn L, Da X, Wolf RL, Bilello M, Verma R, et al. Pattern analysis of dynamic susceptibility contrast-enhanced MR imaging demonstrates peritumoral tissue heterogeneity. Radiology 2014;273:502–10. [DOI] [PMC free article] [PubMed] [Google Scholar]
- 51.Gerstner ER, Chen PJ, Wen PY, Jain RK, Batchelor TT, Sorensen G. Infiltrative patterns of glioblastoma spread detected via diffusion MRI after treatment with cediranib. Neuro-oncol 2010;12:466–72. [DOI] [PMC free article] [PubMed] [Google Scholar]
- 52.Lutz K, Wiestler B, Graf M, Bäumer P, Floca R, Schlemmer HP, et al. Infiltrative patterns of glioblastoma: identification of tumor progress using apparent diffusion coefficient histograms. J Magn Reson Imaging 2014;39:1096–103. [DOI] [PubMed] [Google Scholar]
- 53.Gupta A, Young RJ, Karimi S, Sood S, Zhang Z, Mo Q, et al. Isolated diffusion restriction precedes the development of enhancing tumor in a subset of patients with glioblastoma. AJNRAm J Neuroradiol [DOI] [PMC free article] [PubMed]
- 54.Mong S, Ellingson BM, Nghiemphu PL, Kim HJ, Mirsadraei L, Lai A, et al. Persistent diffusion-restricted lesions in bevacizumab-treated malignant gliomas are associated with improved survival compared with matched controls. AJNRAm J Neuroradiol 2012;33:1763–70. [DOI] [PMC free article] [PubMed] [Google Scholar]
- 55.Nguyen HS, Milbach N, Hurrell SL, Cochran E, Connelly J, Bovi JA, et al. Progressing Bevacizumab-Induced Diffusion Restriction Is As-sociated with Coagulative Necrosis Surrounded by Viable Tumor and De-creased Overall Survival in Patients with Recurrent Glioblastoma. AJNRAm J Neuroradiol 2016;37:2201–8. [DOI] [PMC free article] [PubMed] [Google Scholar]
- 56.Pope WB, Kim HJ, Huo J, Alger J, Brown MS, Gjertson D, et al. Recurrent glioblastoma multiforme: ADC histogram analysis predicts re-sponse to bevacizumab treatment. Radiology 2009;252:182–9. [DOI] [PubMed] [Google Scholar]
- 57.Hirai T, Murakami R, Nakamura H, Kitajima M, Fukuoka H, Sasao A, et al. Prognostic value of perfusion MR imaging of high-grade astrocytomas: long-term follow-up study. AJNRAm J Neuroradiol 2008;29:1505–10. [DOI] [PMC free article] [PubMed] [Google Scholar]
- 58.Sawlani RN, Raizer J, Horowitz SW, Shin W, Grimm SA, Chandler JP, et al. Glioblastoma: a method for predicting response to antiangiogenic chemotherapy by using MRperfusion imaging—pilot study. Radiology 2010;255:622–8. [DOI] [PMC free article] [PubMed] [Google Scholar]
- 59.Schmainda KM, Prah M, Connelly J, Rand SD, Hoffman RG, Mueller W, et al. Dynamic-susceptibility contrast agent MRI measures of relative cerebral blood volume predict response to bevacizumab in recurrent high-grade glioma. Neuro-oncol 2014;16:880–8. [DOI] [PMC free article] [PubMed] [Google Scholar]
- 60.Kickingereder P, Radbruch A, Burth S, Wick A, Heiland S, Schlemmer HP, et al. MR Perfusion-derived Hemodynamic Parametric Response Mapping of Bevacizumab Efficacy in Recurrent Glioblastoma. Radiology 2016;279:542–52. [DOI] [PubMed] [Google Scholar]
- 61.Sorensen AG, Batchelor TT, Zhang WT, Chen PJ, Yeo P, Wang M, et al. A “vascular normalization index” as potential mechanistic biomarker to predict survival after a single dose of cediranib in recurrent glioblastoma patients. Cancer Res 2009;69:5296–300. [DOI] [PMC free article] [PubMed] [Google Scholar]
- 62.Okada H, Kohanbash G, Zhu X, Kastenhuber ER, Hoji A, Ueda R, et al. Immunotherapeutic approaches for glioma. Crit Rev Immunol 2009;29:1–42. [DOI] [PMC free article] [PubMed] [Google Scholar]
- 63.Okada H, Weller M, Huang R, Finocchiaro G, Gilbert MR, Wick W, et al. Immunotherapy response assessment in neuro-oncology: a report of the RANOworking group. Lancet Oncol 2015;16:e534–42. [DOI] [PMC free article] [PubMed] [Google Scholar]
- 64.Sampson JH, Heimberger AB, Archer GE, Aldape KD, Friedman AH, Friedman HS, et al. Immunologic escape after prolonged progression-free survival with epidermal growth factor receptor variant IIIpeptide vaccination in patients with newly diagnosed glioblastoma. J Clin Oncol 2010;28:4722–9. [DOI] [PMC free article] [PubMed] [Google Scholar]
- 65.Aquino D, Gioppo A, Finocchiaro G, Bruzzone MG, Cuccarini V. MRIin Glioma Immunotherapy: Evidence, Pitfalls, and Perspectives. J Immunol Res 2017;2017:5813951. [DOI] [PMC free article] [PubMed] [Google Scholar]
- 66.Pope WB, Chen JH, Dong J, Carlson MR, Perlina A, Cloughesy TF, et al. Relationship between gene expression and enhancement in glio-blastoma multiforme: exploratory DNAmicroarray analysis. Radiology 2008;249:268–77. [DOI] [PMC free article] [PubMed] [Google Scholar]
- 67.Wesseling P, van den Bent M, Perry A. Oligodendroglioma: pathology, molecular mechanisms and markers. Acta Neuropathol 2015;129:809–27. [DOI] [PMC free article] [PubMed] [Google Scholar]
- 68.Jenkinson MD, du Plessis DG, Smith TS, Joyce KA, Warnke PC, Walker C. Histological growth patterns and genotype in oligodendroglial tumours: correlation with MRIfeatures. Brain 2006;129:1884–91. [DOI] [PubMed] [Google Scholar]
- 69.Brown R, Zlatescu M, Sijben A, Roldan G, Easaw J, Forsyth P, et al. The use of magnetic resonance imaging to noninvasively detect genetic signatures in oligodendroglioma. Clin Cancer Res 2008;14:2357–62. [DOI] [PubMed] [Google Scholar]
- 70.Jenkinson MD, Smith TS, Joyce KA, Fildes D, Broome J, du Plessis DG, et al. Cerebral blood volume, genotype and chemosensitivity in oli-godendroglial tumours. Neuroradiology 2006;48:703–13. [DOI] [PMC free article] [PubMed] [Google Scholar]
- 71.Chawla S, Krejza J, Vossough A, Zhang Y, Kapoor GS, Wang S, et al. Differentiation between oligodendroglioma genotypes using dynamic susceptibility contrast perfusion-weighted imaging and proton MRspectroscopy. AJNRAm J Neuroradiol 2013;34:1542–9. [DOI] [PMC free article] [PubMed] [Google Scholar]
- 72.Smits M, van den Bent MJ. Imaging Correlates of Adult Glioma Genotypes. Radiology 2017;284:316–31. [DOI] [PubMed] [Google Scholar]
- 73.Lasocki A, Tsui A, Gaillard F, Tacey M, Drummond K, Stuckey S. Reliability of noncontrast-enhancing tumor as a biomarker of IDH1 muta-tion status in glioblastoma. J Clin Neurosci 2017;39:170–5. [DOI] [PubMed] [Google Scholar]
- 74.Carrillo JA, Lai A, Nghiemphu PL, Kim HJ, Phillips HS, Kharbanda S, et al. Relationship between tumor enhancement, edema, IDH1 muta-tional status, MGMT promoter methylation, and survival in glioblastoma. AJNRAm J Neuroradiol 2012;33:1349–55. [DOI] [PMC free article] [PubMed] [Google Scholar]
- 75.Altieri R, Zenga F, Ducati A, Melcarne A, Cofano F, Mammi M, et al. Tumor location and patient age predict biological signatures of high-grade gliomas. Neurosurg Rev 2018;41:599–604. [DOI] [PubMed] [Google Scholar]
- 76.Qi S, Yu L, Li H, Ou Y, Qiu X, Ding Y, et al. Isocitrate dehydrogenase mutation is associated with tumor location and magnetic resonance imaging characteristics in astrocytic neoplasms. Oncol Lett 2014;7:1895–902. [DOI] [PMC free article] [PubMed] [Google Scholar]
- 77.Metellus P, Coulibaly B, Colin C, de Paula AM, Vasiljevic A, Taieb D, et al. Absence of IDH mutation identifies a novel radiologic and mo-lecular subtype of WHOgrade II gliomas with dismal prognosis. Acta Neuropathol 2010;120:719–29. [DOI] [PubMed] [Google Scholar]
- 78.Tan W, Xiong J, Huang W, Wu J, Zhan S, Geng D. Noninvasively detecting Isocitrate dehydrogenase 1 gene status in astrocytoma by dynamic susceptibility contrast MRI. J Magn Reson Imaging 2017;45:492–9. [DOI] [PubMed] [Google Scholar]
- 79.Pope WB, Prins RM, Albert Thomas M, Nagarajan R, Yen KE, Bittinger MA, et al. Non-invasive detection of 2-hydroxyglutarate and other metabolites in IDH1 mutant glioma patients using magnetic resonance spectroscopy. J Neurooncol 2012;107:197–205. [DOI] [PMC free article] [PubMed] [Google Scholar]
- 80.Andronesi OC, Loebel F, Bogner W, Marjańska M, Vander Heiden MG, Iafrate AJ, et al. Treatment Response Assessment in IDH-Mutant Glioma Patients by Noninvasive 3DFunctional Spectroscopic Mapping of 2-Hydroxyglutarate. Clin Cancer Res 2016;22:1632–41. [DOI] [PMC free article] [PubMed] [Google Scholar]
- 81.de la Fuente MI, Young RJ, Rubel J, Rosenblum M, Tisnado J, Briggs S, et al. Integration of 2-hydroxyglutarate-proton magnetic resonance spectroscopy into clinical practice for disease monitoring in isocitrate dehydrogenase-mutant glioma. Neuro-oncol 2016;18:283–90. [DOI] [PMC free article] [PubMed] [Google Scholar]
- 82.Hegi ME, Diserens AC, Godard S, Dietrich PY, Regli L, Ostermann S, et al. Clinical trial substantiates the predictive value of O-6-methyl-guanine-DNAmethyltransferase promoter methylation in glioblastoma patients treated with temozolomide. Clin Cancer Res 2004;10:1871–4. [DOI] [PubMed] [Google Scholar]
- 83.Drabycz S, Roldán G, de Robles P, Adler D, McIntyre JB, Magliocco AM, et al. An analysis of image texture, tumor location, and MGMT pro-moter methylation in glioblastoma using magnetic resonance imaging. Neuroimage 2010;49:1398–405. [DOI] [PubMed] [Google Scholar]
- 84.Ellingson BM, Cloughesy TF, Pope WB, Zaw TM, Phillips H, Lalezari S, et al. Anatomic localization of O6-methylguanine DNA meth-yltransferase (MGMT) promoter methylated and unmethylated tumors: a radiographic study in 358 de novo human glioblastomas. Neuroimage 2012;59:908–16. [DOI] [PubMed] [Google Scholar]
- 85.Pope WB, Lai A, Mehta R, Kim HJ, Qiao J, Young JR, et al. Apparent diffusion coefficient histogram analysis stratifies progression-free survival in newly diagnosed bevacizumab-treated glioblastoma. AJNR Am J Neuroradiol 2011;32:882–9. [DOI] [PMC free article] [PubMed] [Google Scholar]
- 86.Moon WJ, Choi JW, Roh HG, Lim SD, Koh YC. Imaging parameters of high grade gliomas in relation to the MGMT promoter methylation sta-tus: the CT, diffusion tensor imaging, and perfusion MRimaging. Neuro-radiology 2012;54:555–63. [DOI] [PubMed] [Google Scholar]
- 87.Ahn SS, Shin NY, Chang JH, Kim SH, Kim EH, Kim DW, et al. Prediction of methylguanine methyltransferase promoter methylation in glioblastoma using dynamic contrast-enhanced magnetic resonance and diffusion tensor imaging. J Neurosurg 2014;121:367–73. [DOI] [PubMed] [Google Scholar]
- 88.Ryoo I, Choi SH, Kim JH, Sohn CH, Kim SC, Shin HS, et al. Cerebral blood volume calculated by dynamic susceptibility contrast-enhanced perfusion MR imaging: preliminary correlation study with glioblastoma genetic profiles. PLoS One 2013;8:e71704. [DOI] [PMC free article] [PubMed] [Google Scholar]
- 89.Choi YS, Ahn SS, Lee HJ, Chang JH, Kang SG, Kim EH, et al. The Initial Area Under the Curve Derived from Dynamic Contrast-Enhanced MRI Improves Prognosis Prediction in Glioblastoma with Unmethylated MGMT Promoter. AJNRAm J Neuroradiol 2017;38:1528–35. [DOI] [PMC free article] [PubMed] [Google Scholar]
- 90.Han Y, Yan LF, Wang XB, Sun YZ, Zhang X, Liu ZC, et al. Structural and advanced imaging in predicting MGMT promoter methylation of primary glioblastoma: a region of interest based analysis. BMCCancer 2018;18:215. [DOI] [PMC free article] [PubMed] [Google Scholar]
- 91.Gao YT, Chen XB, Liu HL. Up-regulation of miR-370–3p restores glioblastoma multiforme sensitivity to temozolomide by influencing MGMT expression. Sci Rep 2016;6:32972. [DOI] [PMC free article] [PubMed] [Google Scholar]
- 92.Keil VC, Pintea B, Gielen GH, Greschus S, Fimmers R, Gieseke J, et al. Biopsy targeting with dynamic contrast-enhanced versus standard neuronavigation MRIin glioma: a prospective double-blinded evaluation of selection benefits. J Neurooncol 2017;133:155–63. [DOI] [PubMed] [Google Scholar]
- 93.Einstein DB, Wessels B, Bangert B, Fu P, Nelson AD, Cohen M, et al. Phase II trial of radiosurgery to magnetic resonance spectroscopy-defined high-risk tumor volumes in patients with glioblastoma multiforme. Int J Radiat Oncol Biol Phys 2012;84:668–74. [DOI] [PMC free article] [PubMed] [Google Scholar]
- 94.Di Costanzo A, Scarabino T, Trojsi F, Giannatempo GM, Popolizio T, Catapano D, et al. Multiparametric 3T MR approach to the assess-ment of cerebral gliomas: tumor extent and malignancy. Neuroradiology 2006;48:622–31. [DOI] [PubMed] [Google Scholar]
- 95.Cordova JS, Shu HK, Liang Z, Gurbani SS, Cooper LA, Holder CA, et al. Whole-brain spectroscopic MRI biomarkers identify infiltrating margins in glioblastoma patients. Neuro-oncol 2016;18:1180–9. [DOI] [PMC free article] [PubMed] [Google Scholar]
- 96.Jellison BJ, Field AS, Medow J, Lazar M, Salamat MS, Alexander AL. Diffusion tensor imaging of cerebral white matter: a pictorial review of physics, fiber tract anatomy, and tumor imaging patterns. AJNR Am J Neuroradiol 2004;25:356–69. [PMC free article] [PubMed] [Google Scholar]
- 97.Chiang IC, Kuo YT, Lu CY, Yeung KW, Lin WC, Sheu FO, et al. Dis-tinction between high-grade gliomas and solitary metastases using peri-tumoral 3-T magnetic resonance spectroscopy, diffusion, and perfusion imagings. Neuroradiology 2004;46:619–27. [DOI] [PubMed] [Google Scholar]
- 98.Jena R, Price SJ, Baker C, Jefferies SJ, Pickard JD, Gillard JH, et al. Diffusion tensor imaging: possible implications for radiotherapy treatment planning of patients with high-grade glioma. Clin Oncol (RColl Radiol) 2005;17:581–90. [DOI] [PubMed] [Google Scholar]
- 99.Price SJ, Jena R, Burnet NG, Carpenter TA, Pickard JD, Gillard JH. Predicting patterns of glioma recurrence using diffusion tensor imaging. Eur Radiol 2007;17:1675–84. [DOI] [PubMed] [Google Scholar]
- 100.Ellingson BM, Bendszus M, Boxerman J, Barboriak D, Erickson BJ, Smits M, et al. ; Jumpstarting Brain Tumor Drug Development Coalition Imaging Standardization Steering Committee. Consensus recommenda-tions for a standardized Brain Tumor Imaging Protocol in clinical trials. Neuro-oncol 2015;17:1188–98. [DOI] [PMC free article] [PubMed] [Google Scholar]