

Abstract
Background:
Prophylactic anticoagulant treatment may substantially reduce the incidence of venous thromboembolism (VTE) but entails considerable risk of severe bleeding. Identification of individuals at high risk of VTE through the use of predictive biomarkers is desirable in order to achieve a favorable benefit-to-harm ratio.
Objective:
We aimed to identify predictive protein biomarker candidates of VTE.
Methods:
We performed a case-control study of 200 individuals that participated in the Tromsø Study, a population-based cohort, where blood samples were collected before the VTE events occurred. Untargeted TMT-SPS-MS3 (tandem mass tag-synchronous precursor selection-mass spectrometry)-based proteomic profiling was used to study the plasma proteomes of each individual.
Results:
Of the 501 proteins detected in a sufficient number of samples to allow multivariate analysis, 46 proteins were associated with VTE case-control status with p-values below the 0.05 significance threshold. The strongest predictive biomarker candidates, assessed by statistical significance, were transthyretin, vitamin K-dependent protein Z, and protein/nucleic acid deglycase DJ-1.
Conclusions:
Our untargeted approach of plasma proteome profiling revealed novel predictive biomarker candidates of VTE and confirmed previously reported candidates, thereby providing conceptual support to the validity of the study. A larger nested case-control study will be conducted to validate our findings.
Keywords: Biomarkers, Mass Spectrometry, Proteomics, Venous Thrombosis, Venous Thromboembolism
Introduction
Venous thromboembolism (VTE), a collective term for deep vein thrombosis and pulmonary embolism, has an annual incidence rate of 1–2 per 1000 persons [1]. The health burden caused by VTE is immense, and it is expected to grow with the aging of the population and the increasing prevalence of major risk factors for VTE such as obesity and cancer [2–5]. Prophylactic anticoagulant treatment in situations of high VTE risk provides an effective strategy for VTE prevention but entails a substantial risk of severe bleeding [6, 7]. Thromboprophylaxis with anticoagulants should therefore be targeted towards individuals with the highest VTE risk in order to achieve a favorable benefit-to-harm ratio.
VTE is a complex disease that occurs as a result of interactions between inherited and acquired factors [8]. Several genetic variants and the levels of numerous plasma proteins, mostly with roles in coagulation or fibrinolysis, have been shown to be associated with VTE [1, 9–18]. However, few prospective studies have successfully shown associations between protein biomarker levels at baseline and risk of future incident VTE [11, 13, 17, 18]. The discovery of novel biomarkers for risk prediction of incident VTE in the general population is therefore warranted. Furthermore, the identification of individuals at high risk of VTE is challenging, as it requires integration of both clinical risk factors and biomarkers. Current risk prediction models for VTE are often restricted to patient subgroups and they have shown limited predictive power, particularly in validation studies [11, 19–22].
The proteomic profile of blood plasma is influenced by both genetic and environmental factors that may affect the risk of VTE. Combined with the minimal invasiveness and cost of blood sampling, blood plasma is a clinically attractive and relevant specimen for the discovery of novel biomarkers for VTE. Recent advances in mass spectrometry technology have increased the feasibility of mass spectrometry (MS)-based biomarker discovery studies. Improved accuracy in relative protein quantification combined with the development of sample multiplexing protocols have made MS an attractive technology for plasma biomarker discovery [23–26].
This study was designed to identify novel plasma protein biomarkers for future incident VTE. We combined Tandem-Mass-Tag (TMT) 10-plexing with synchronous precursor selection (SPS)-MS (MS3) to generate untargeted proteomic profiles [26]. Our study included 100 individuals who developed VTE and 100 age and sex-matched control individuals selected from a population-based cohort where plasma samples were collected before the VTE events occurred. To our knowledge, this study is the first to employ untargeted plasma proteomic profiling with the objective to discover predictive biomarkers for incident VTE, and is the first to take advantage of the improved accuracy of MS3 in a larger plasma proteomic study. We identified a panel of 46 biomarker candidates worthy of further investigation and validation.
Materials and Methods
Data created for this study is available on request from John-Bjarne Hansen.
Source population
Participants were recruited from the fourth survey of the Tromsø Study conducted in 1994–95, where all inhabitants of Tromsø (Norway) older than 24 years of age were invited to participate in a prospective health survey [27]. The participation rate was 77% with 27,158 individuals attending the first visit. Additionally, a subset of the participants was invited for a more extensive examination, and 7,965 individuals participated in the second visit. Those who did not consent to medical research (n=300), who were not officially registered as inhabitants of the municipality of Tromsø at baseline (n=43), and those with a known pre-baseline history of VTE (n=47) were excluded from the study. The remaining participants (n=26,768) were followed from the date of enrollment until September 1, 2007. All first lifetime events of VTE occurring among the participants during follow-up were identified from the discharge diagnosis registry, the autopsy registry, and the radiology procedure registry at the University Hospital of North Norway, which is the sole hospital in the Tromsø region. Trained personnel adjudicated each VTE by extensive medical records review. A VTE was adjudicated if the presence of signs and symptoms of deep vein thrombosis or pulmonary embolism were combined with objective confirmation by radiological procedures, which resulted in treatment initiation (unless contraindications were specified) as previously described [28]. In total, 462 VTE events occurred in the follow-up period. A VTE event was classified as provoked (≥1 provoking factors) or unprovoked (no provoking factors), according to the presence of provoking factors at the time of diagnosis. Provoking factors were: Recent surgery or trauma within the previous 8 weeks, acute medical conditions (acute MI, ischemic stroke or major infectious disease), active cancer (as defined in [29]), marked immobilization (bed rest >3 days, wheelchair, or long distance travels exceeding 4 hours within the last 14 days prior to event) or other provoking factors specifically described by a physician in the medical record (e.g. intravascular catheter). We did not have valid information on use of relevant medications at the time of blood sampling.
The study population
From the source population, we established a case-control study of 100 VTE cases and 100 controls. For each VTE case, an age- and sex-matched control was randomly sampled from the source cohort. Cases were prioritized according to the shortest time from blood sampling to VTE, and the first 100 case-control pairs where both plasma samples passed quality control (as described below) were included to form our case-control study.
Ethics approval
All participants provided informed written consent to participate in accordance with the declaration of Helsinki. The study was approved by the Regional Committee of Medical and Health Research Ethics.
Plasma collection and base line characteristics
Baseline characteristics including age, sex, and anthropometrics were collected by physical examination at study enrollment. Height and weight were measured with subjects wearing light clothing and no shoes. BMI (Body mass index) was calculated as the weight in kilograms divided by the square of height in meters (kg/m2). Non-fasting blood samples were drawn from an antecubital vein into 5 mL vacutainer tubes containing EDTA (Ethylenediaminetetraacetic acid) as an anticoagulant (K3-EDTA 40 μL, 0.37 mol/L per tube). Blood samples were processed within 1 hour by centrifugation at 3000 g for 10 min at 22°C, and plasma was collected and frozen in 1 mL aliquots. Plasma samples were generated at the same unit and stored at −70°C by the Tromsø Study until shipment on dry ice to Proteomic Sciences (Cobham, United Kingdom) for analysis. Samples were shipped in two batches with case-control sample pairs in the same shipment.
Quality control
The plasma samples obtained from the Tromsø Study were inspected visually for signs of hemolysis and the protein content was determined by Bradford assay (Biorad, Hercules, CA, USA). Signs of sample protein degradation were assessed by Coomassie Blue visualization of 10 μg of protein from each sample separated by sodium dodecyl sulfate polyacrylamide gel electrophoresis on a 4–20% Criterion, gradient gel (Biorad, Hercules, CA, USA). The first 100 sample-pairs where both case- and control samples passed quality control as assessed by hemolysis, protein concentration (mean ± 2 standard deviations), and sodium dodecyl sulfate polyacrylamide gel electrophoresis band pattern were included in the study. After albumin and IgG depletion, 17 samples were picked randomly for quality control on sodium dodecyl sulfate polyacrylamide gel electrophoresis as described above and passed quality control (Figure S1).
Sample preparation and Mass Spectrometry
A description of sample preparation, labeling, multiplexing, and the generation of mass spectrometry raw data is provided in the Data S1.
Mass spectrometry data analysis
Proteome Discoverer v2.1 (Thermo Scientific) was used as a data processing interface for all raw files, which were processed together to yield an accurate false discovery rate [30]. The false discovery rate was set to 1% for both peptide and protein levels using a reverse database strategy [31].We used spectrum selector default settings and SequestHT to identify peptides mapping to the Gencode human proteins sequence database (Gencode 19) [32]. Oxidized methionine was included as a variable modification. Carbamidomethylation of cysteine, and 10-plex TMT-labels on peptide amino-termini and lysines were included as fixed modifications. Trypsin was selected as proteolytic enzyme and a maximum of three potential missed cleavages was allowed. Reporter ion signal-to-noise ratios were extracted with the reporter ions quantifier node in Proteome Discoverer were exported for relative quantification. Labeling efficiency was checked by initially searching for the TMT labels as a dynamic modification and comparing the percentage of detected lysines and peptide N-termini that are labeled vs total detected. Labeling efficiency exceeded 98%
Data processing and analysis
Peptide level filtering excluded peptides with isolation interference greater than 25% or average reporter ion signal-to-noise ratios below 10. Peptide level signal-to-noise ratios were summed to estimate protein abundances enforcing the principle of parsimony. Values from technical duplicates were averaged if both values were available. Otherwise, non-missing values were used. Data was normalized in a two-step process as previously described [33].
Post normalization data quality control
Proteins with measurements in all samples were used in unsupervised hierarchical clustering of Spearman’s correlations between individual samples, and the heatmap.2 function in R was used to visually identify batch effects from TMT-label, experimental sample number, shipment batch number, or Tromsø survey visit number.
Statistical analysis
Univariate and multivariate linear regression adjusting for age, sex, and BMI were performed to identify VTE-biomarker candidates with significantly different protein expression levels between cases and controls. To stabilize estimates in the multivariate linear regression, 10 measurements were required per explanatory variable, i.e. only proteins with valid measurements in at least 40 samples were analyzed. Regression coefficients were standardized according to the standard deviation of the control group. We used a significance threshold of p < 0.05. Principal component (PC) analysis was performed for the proteins that were identified in all samples. All analysis were performed in R (version 3.3.3) using standard packages.
Results
We established a case-control study of 100 VTE cases and 100 controls matched for age and sex with plasma samples available from the Tromsø Study that passed quality control procedures (Figure 1) (baseline characteristics in Table S1). TMT10-multiplexing and liquid chromography-MS3 was used to generate plasma proteomic profiles of each individual sample in 25 multiplexed mass spectrometry experiments. We identified and performed relative quantification of 6,117 peptides mapping to 681 proteins in 200 human plasma samples (Figure 2A). Of the 681 proteins identified, 287 proteins (42%) were measured in all samples and 431 proteins (63%) were measured in more than half of the samples (Figure 2B). Of the 681 proteins, 488 proteins (71%) were identified by more than one peptide and a median of three peptides per protein were used for identification (Figure 2C). A two-step normalization was performed to account for slight differences in pipetting and TMT-labeling efficiency, and to allow comparison of relative protein levels across all samples in the study (Figure S2A and S2B). A heatmap of Spearman’s correlations revealed two clusters of highly correlated samples. These clusters contained almost exclusively samples collected at the second visit of the Tromsø survey, and only a single sample collected at the second visit was not found in these two clusters (Figure S2C). Therefore, the 24 samples collected at the second visit were removed from the analysis. Additionally, eight samples obtained from participants with active cancer at the time of blood sampling were removed (i.e. individuals diagnosed with cancer within 5 years before to 1 year after blood sampling). Baseline characteristics of the study participants after the removal of these 32 samples are summarized in Table 1. Data normalization and clustering analysis were re-performed. Clustering analysis revealed no batch effects of shipment number, MS experiment number, or TMT-label and indicated appropriate data normalization (Figure 2D and Figure S2C). The normalized protein estimates from two technical replicates showed high correlations (range [0.80–0.98], median 0.91).
Figure 1:
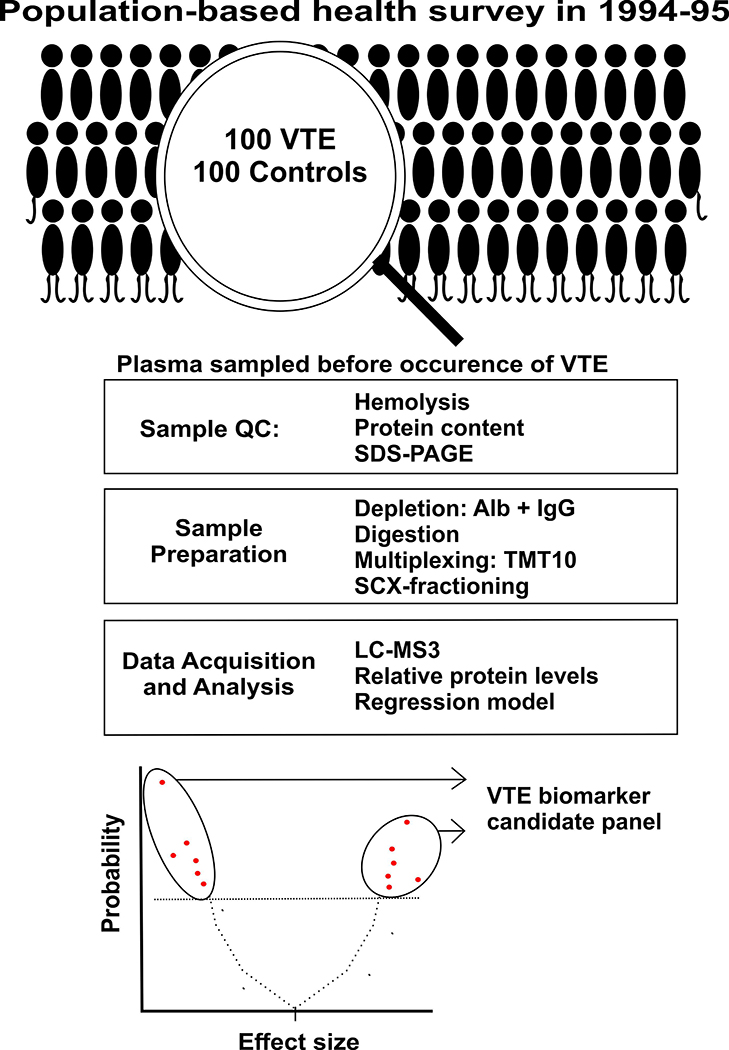
Study overview. Abbreviations: QC = quality control, Alb = albumin, IgG = immunoglobulin G, LC-MS3 = liquid chromatography-triple mass spectrometry, SCX = strong cation exchange chromatography, SDS-PAGE = sodium dodecyl sulfate-polyacrylamide gel electrophoresis, TMT10 = tandem mass tag 10plex, VTE = venous thromboembolism.
Figure 2:
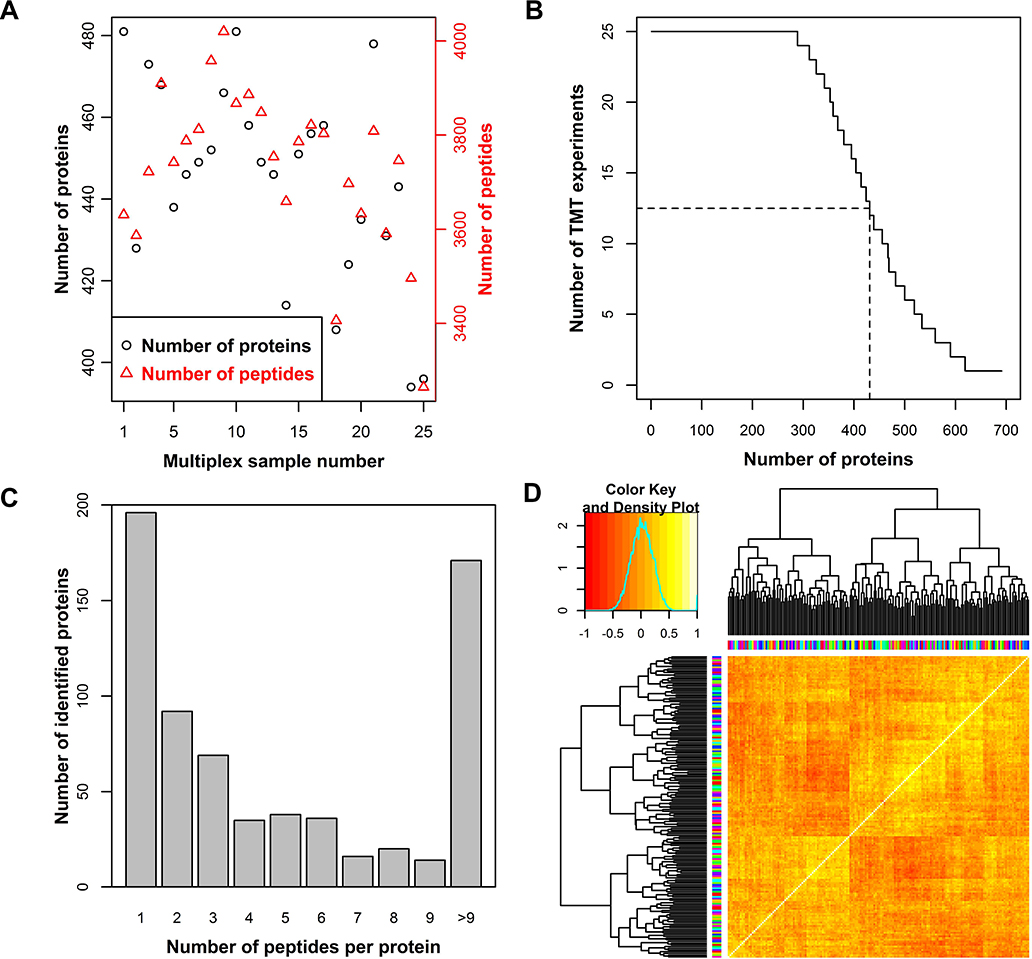
Number of peptides (red) and proteins (black) identified in each multiplex sample. The sum of identifications in two technical replicates is shown (A). The number of proteins identified in a given number of multiplexed experiments. The dashed lines indicate identification in half of the TMT reactions (B). The number of proteins identified by a given number of peptides. For each protein, the sum of peptides across the dataset is provided (C). Heatmap of Spearman’s correlation clustering for the study summarized in Table 1. Colors on axis indicate TMT label (vertical) and multiplex sample number (horizontal) (D).
Table 1:
Baseline characteristics of the study after removal of Tromsø Study second visit samples and participants with active cancer at time of blood sampling.
| Cases | Controls | |
|---|---|---|
| Participants | 80 | 88 |
| Median age [range] | 65 [28–83] | 65 [28–83] |
| Sex (male) | 32 (40%) | 39 (44%) |
| BMI (mean±SD) | 27.0±4.1 | 24.7±3.5 |
| Smoking | 17 (21.3%) | 32 (36.4%) |
| Cardiovascular disease* | 19 (23.8%) | 13 (14.8%) |
| Diabetes† | 4 (5.0%) | 3 (3.4%) |
| Years to VTE (mean & [range]) | 3.82 [0.09–6.85] | |
| DVT | 55 (69%) | |
| PE | 25 (31%) | |
| Unprovoked VTE | 34 (43%) | |
| Cancer (at event) | 17 (31%) | |
| Surgery/trauma | 20 (25.0%) | |
| Immobilization§ | 15 (18.8%) | |
| Acute medical condition | 14 (17.5%) | |
| Other provoking factor¶ | 4 (5.0%) | |
| Estrogen use** | 6 (7.5%) | |
| Pregnancy | 0 (0%) |
Self-reported history of myocardial infarction, angina or stroke
Self-reported diabetes mellitus
Immobility includes bed rest>3days, longtime travels with car, boat, train or by air >4 hours within last 14 days, or other type of immobilization.
Other provoking factor described by a physician in the medical record (e.g. intravascular catheter).
Use of estrogen containing oral contraceptives or hormone replacement therapy
The normalized relative protein levels were regressed on age, sex, BMI, and VTE status in a multivariate linear model. To yield stable estimates we required a minimum of 40 measurements for a protein to be considered. The obtained p-value for the association with VTE status was used to evaluate the biomarker potential for each protein. Out of the 501 proteins tested in the multivariate analysis, 46 proteins had p-values below the 0.05 significance threshold (Figure 3 and Table S2). For the proteins that were identified in too few samples to be considered in multivariate analysis, univariate statistics are provided in Table S2.
Figure 3:
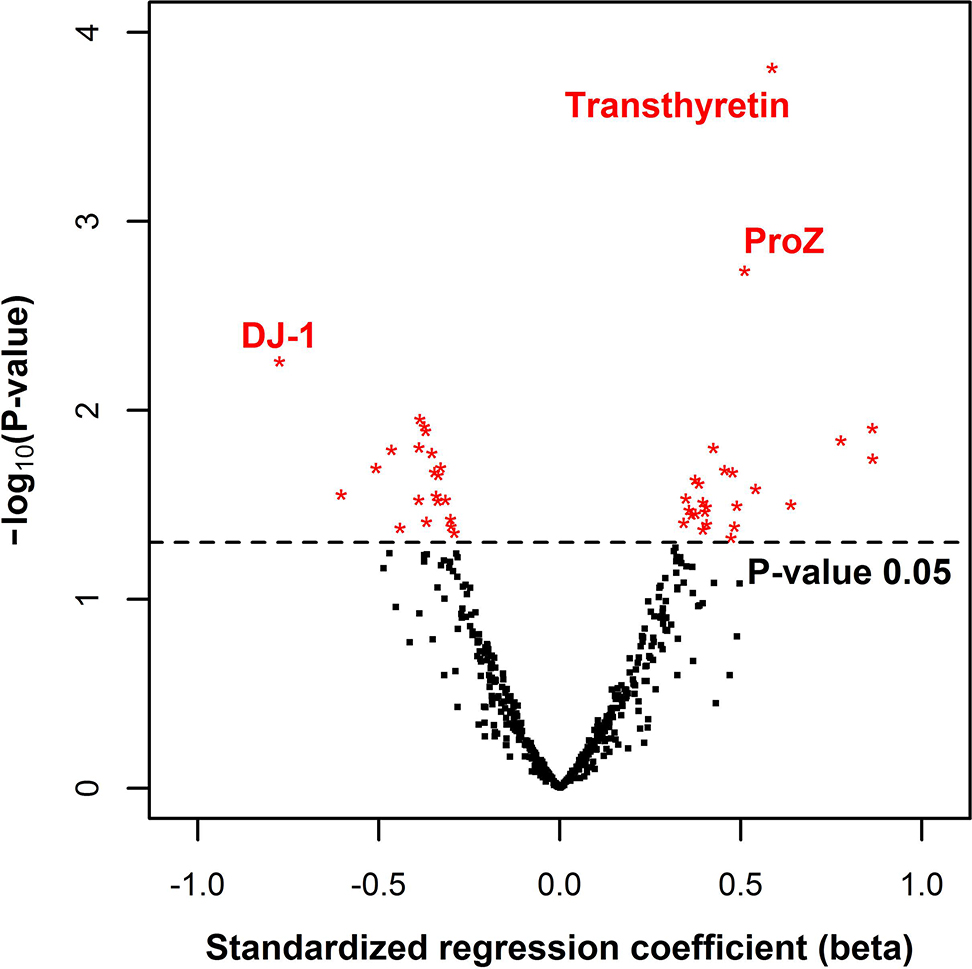
Volcano plot of plasma proteins identified in 40 or more samples. For each protein, the standardized regression coefficient for VTE status is plotted against -log10(p-value). The multivariate model included age, sex, and BMI as covariates. The black dashed line indicates a p-value of 0.05. The three candidates with the lowest p-values are indicated by their protein name. Abbreviations: ProZ = vitamin K-dependent protein Z, DJ-1= Protein/nucleic acid deglycase DJ-1.
Based on statistical probability, the strongest biomarker candidate identified in this study was transthyretin with a nominal p-value of 0.00015 (Figure 3). We also found vitamin K-dependent protein Z (ProZ) to be overexpressed in cases although with a less extreme p-value of 0.0018 (Figure 3). Interestingly, the third lowest p-value was obtained for protein/nucleic acid deglycase DJ-1 (DJ-1) (p = 0.0055), which is also the candidate with the largest effect size (Figure 3). Figure 4 shows the relative protein estimates for cases and controls for each of the three aforementioned biomarker candidates.
Figure 4:
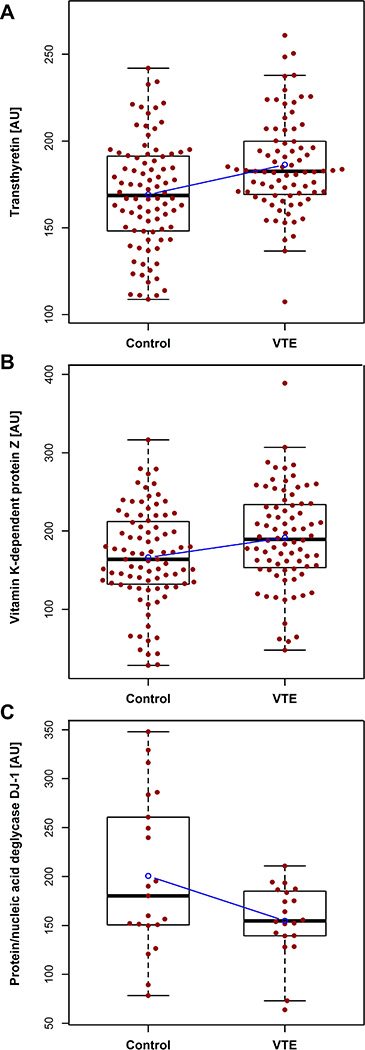
Boxplot of the relative plasma protein levels of transthyretin (A), vitamin K-dependent protein Z (B), and protein/nucleic acid deglycase DJ-1 (C) in cases and controls. The regression line for VTE status is shown in blue. Abbreviation: AU = arbitrary units.
We explored the association between biomarker candidates and VTE as a function of time between blood sampling and occurrence of VTE (Table S3).
The beta coefficients for the association between ProZ and VTE were higher when the time between blood sampling and event was short (Figure 5A), whereas the beta coefficients for the association between transthyretin and VTE were stable over time (Figure 5B).
Figure 5:
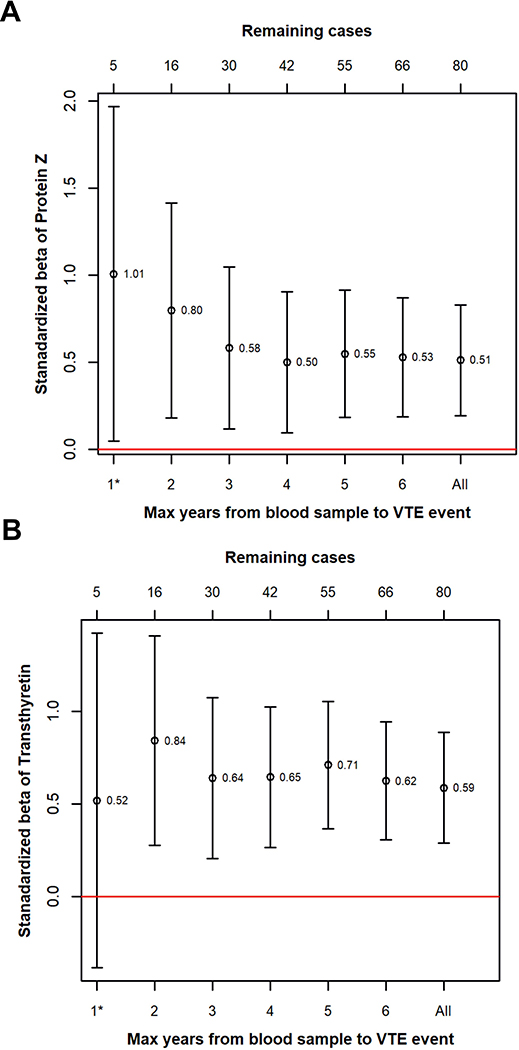
Figure 5: Standardized regression coefficients for the association between VTE and ProZ (A) and transthyretin (B) plotted as a function of time between blood sampling and VTE. Bars indicate 95% confidence intervals.
We found a significant inverse correlation (Pearson’s R = −0.41, p-value = 0.0046) between the plasma levels of transthyretin and DJ-1 (Figure 6). Sequence analysis revealed that the proposed optimal target sequence for DJ-1-mediated proteolysis is found in transthyretin, and may suggest that DJ-1-mediates cleavage of transthyretin after position V36 (Figure S4) [34].
Figure 6:
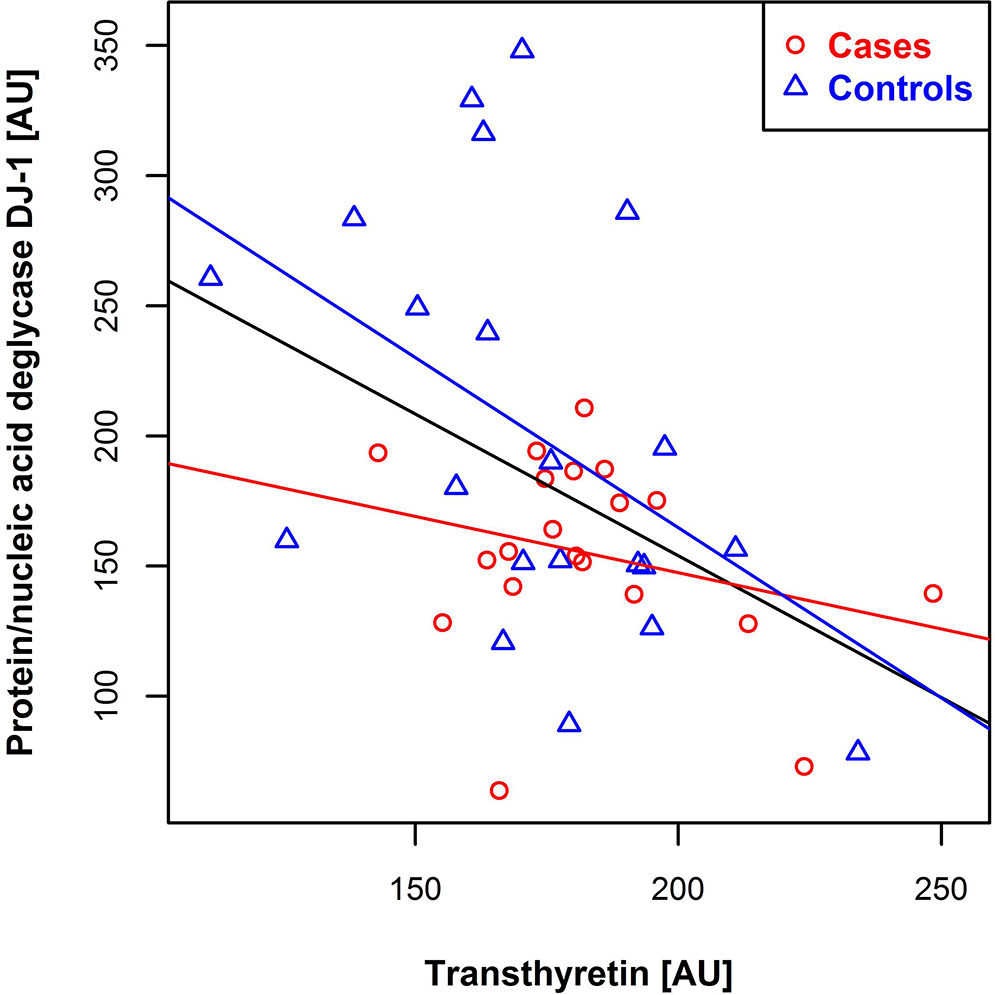
Scatter plot of relative transthyretin levels versus protein/nucleic acid deglycase DJ-1 levels. Controls are shown in blue and cases in red, with corresponding regression lines. The black regression line is created with respect to all samples. Abbreviation: AU = arbitrary units.
In our panel of predictive biomarker candidates, we found coagulation factor IX, galectin-3-binding protein, and both subunits of the heterodimeric S100A8/9 (correlation between subunits R2 = 0.993) to be differentially expressed in cases and controls (Figure S3A-C and Table S2). These biomarker candidates have previously been linked to VTE in retrospective case-control studies [35, 36] or in animal models of VTE [37, 38]. Moreover, our candidate list included proteins related to the complement system and the protein Z-dependent protease inhibitor. The previously described predictive VTE biomarker von Willebrand factor showed differences in expression levels in the expected direction (i.e. overexpressed in VTE cases) without reaching statistical significance (p-value = 0.16) [18, 39]. (Figure S3D and Table S2).
To identify the major contributors to variation in the plasma proteomes, we performed a principle component (PC) analysis. The variation explained by the first and second PCs were 16.3% and 6.3%, respectively (Fig 7A and 7B).
Figure 7:
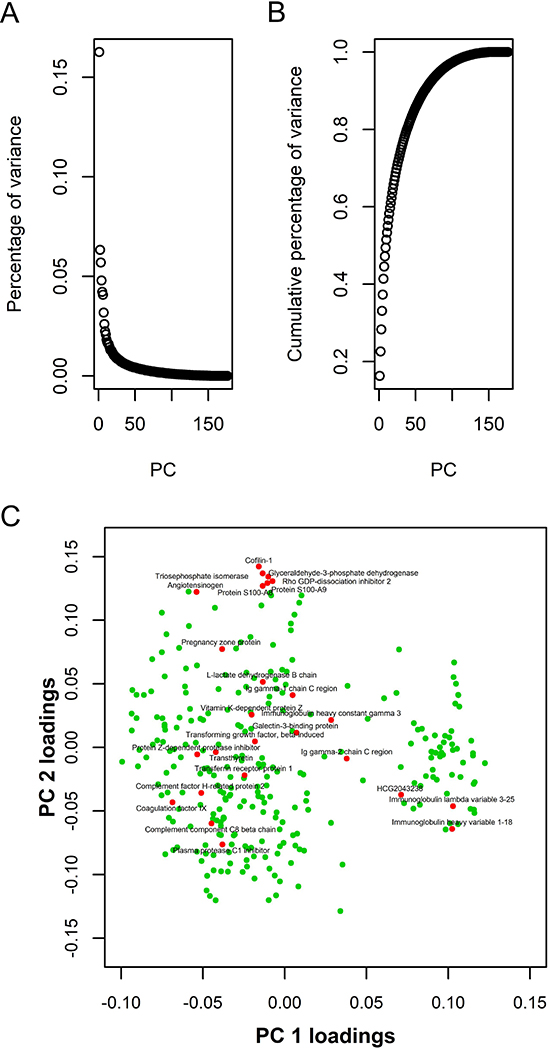
Principal component (PC) analysis. Panel A shows the percentage of variation explained by each PC. Panel B shows the cumulative percentage of variance explained by PCs. Panel C shows a scatterplot of the loadings for PC1 and PC2 of the each protein. Candidate biomarkers are shown in red. All other proteins in the PC analysis are shown in green. Abbreviation: PC = principal component.
We investigated our biomarker candidates for their contributions to the first two PCs, PC1 and PC2, by plotting the loadings of PC1 and PC2 for each protein (Figure 7C). We identified a cluster of highly correlated VTE biomarker candidates with positive loadings for PC2 (Figure 7C and Table S4). Within this cluster, the highly correlated S100A8 and S100A9 were found together with four proteins that appeared to originate from tissue leakage.
Discussion
In this study, we present a large-scale MS3-based plasma proteomic profiling with the objective to discover novel biomarker candidates with the potential to predict incident VTE in the general population. We identified a panel of 46 biomarker candidates that included transthyretin, ProZ, and DJ-1 as the most promising candidates. Moreover, we revealed a negative correlation between transthyretin and DJ-1, which indicates that these VTE biomarker candidates may interact with each other in blood plasma. Finally, we support the concept that the proteins galectin-3-binding protein and S100A8/S100A9, previously reported to be involved in VTE pathogenesis using mouse models, are predictive biomarker candidates in humans. Moreover, the identification of galectin-3-binding protein and S100A8/9 as biomarker candidates, and the expected direction of difference in von Willebrand factor expression, lend conceptual support to the validity of this study.
Of the 681 proteins identified, 501 proteins were detected in a sufficient number of samples to allow multivariate analysis. We chose to present all proteins with p-values below 0.05 as biomarker candidates. This resulted in a panel of 46 proteins. When 501 statistical tests are conducted at a 0.05 significance threshold, 25 type I errors are expected. In a discovery study, the aim is to identify as many promising candidates as possible. Therefore, we omit control of the study-wide type I error rate since limitation hereof will increases the chance of type II error. Inflation of the type II error will erode the objective of a discovery study when followed up by a validation study. Therefore, we promoted all candidates with p-values below 0.05 to our future validation study.
As we identified a high number of candidate biomarker proteins associated with VTE, it is possible that many proteins act together to increase risk. The associations of VTE with elevated thrombin potential and hypofibrinolytic capacity support this notion [14–16, 19]. Indeed, knowledge about non-linear interactions between single risk factors, such as the non-additive effects of prothrombin mutation 20210A and factor V Leiden [40], will be of pivotal importance to meet the challenge of VTE prediction and suggests a need for the development of panels of cooperating biomarkers [41].
The strongest plasma biomarker candidate that we identified, transthyretin, forms a homotetramer that has two binding sites for thyroxine [42]. Transthyretin misfolding can lead to amyloidosis, which affect as much as 25% of the elderly population, and may be linked to VTE through low-grade inflammation [43, 44]. Interestingly, the inverse correlation between transthyretin and DJ-1 identified in this study is consistent with a previously reported proteolytic role for DJ-1 towards transthyretin reported in a study that also found an association between transthyretin amyloidosis and the secretion of an inactive form of DJ-1 [45]. Alternative mechanistic explanations to DJ-1-mediated protection against VTE could be a reduction of advanced glycation end-products or protection against oxidative stress that may contribute to VTE development [46, 47].
This study showed an upregulation of ProZ in subjects who later developed VTE, which might be surprising given its regulatory role in coagulation. Deficiency in ProZ has previously been associated with increased risk of VTE in retrospective studies [48–50]. However, in these studies blood was sampled after the occurrence of VTE entailing the risk of reverse causation. We note that plasma levels of ProZ are known to be affected by warfarin treatment and oral contraceptive use, and that a more controversial inverse relationship with interleukin-6 levels has been described [48, 50, 51]. In plasma, ProZ is bound to a stoichiometric excess of protein Z-dependent protease inhibitor and promotes its inhibition of coagulation factor Xa [52]. However, ProZ also impairs antithrombin mediated inhibition of coagulation factor Xa, which in combination with the vulnerability of protein Z-dependent protease inhibitor function to lipid oxidation may result in a procoagulant effect of ProZ in microenvironments with high levels of oxidative stress [52, 53]. Our study is the first prospective study to assess the association between ProZ plasma levels and risk of future incident VTE.
The strength of our study lies in the combination of an epidemiological study design with the hypothesis free discovery approach offered by MS3-based proteomics. The source cohort is recruited form a single-centered survey of the general population with a 77% participation rate that limits selection bias. Important to the discovery of predictive biomarkers, blood samples were drawn years before the VTE events occurred, and the VTE-events were well validated without knowledge on the proteome status. Additionally, we exploited the improved quantitative accuracy of MS3 and obtained individual untargeted plasma proteomic profiles [25].
Since the current study was an untargeted discovery study, a limited number of cases and controls were included. Unfortunately, we did not have statistical power to perform further subgroup analyses of DVT and PE. Biomarkers can be differently associated with DVT and PE, as recognized by the factor V Leiden paradox, and such differences could potentially have attenuated our findings [54]. Moreover, although we excluded individuals who had cancer at the time of blood sampling, we did not exclude subjects who later developed cancer-related VTE. Unsupervised clustering analysis revealed that the plasma proteome of those with cancer-related VTE did not differ from that of the remaining participants. However, we cannot completely rule out the possibility that inclusion of cancer-provoked VTEs could have attenuated our findings.
In general, an important limitation of the data-dependent MS approach is the decreasing detectability of proteins with their decreasing abundancy. For example, we detected candidates like DJ-1, structural maintenance of chromosomes protein 5, complement component C1q receptor, and adenosine deaminase CECR1 in just enough samples to allow multivariate assessment. The statistical significance of these candidates was driven by large effect size, which may suggest these candidates to be the stronger predictive biomarkers for VTE. We offered univariate statistics for proteins that were detected in too few samples to yield stable estimates.
Finally, the immense dynamic range of abundances of the several thousand proteins found in plasma prohibits their detection by a single technique [55]. We depleted the two most abundant plasma proteins, but abstained from extensive sample depletion in order to avoid depletion of important components of the coagulation system, such as fibrinogen. This depletion strategy limited the number of plasma proteins that could be detected in this study, in particular small proteins with low abundancy.
In conclusion, we present a large-scale MS3-based plasma proteomic profiling study designed to discover biomarker candidates with the potential to predict incident VTE in the general population. In a prospective case-control design with a discovery approach, we identified a panel of 46 biomarker candidates including transthyretin, ProZ and DJ-1. The biomarker candidates will be further validated in a larger, nested case-control study.
Supplementary Material
Essentials.
Discovery of predictive biomarkers of venous thromboembolism (VTE) may aid risk stratification
A case-control study where plasma was sampled before the occurrence of VTE was established
We generated untargeted plasma proteomic profiles of 200 individuals by use of mass spectrometry
Assessment of the biomarker potential of 501 proteins yielded 46 biomarker candidates (p < 0.05)
Acknowledgments
Sources of funding
The K. G. Jebsen Thrombosis Research and Expertise Center (TREC) is supported by an independent grant from Stiftelsen Kristian Gerhard Jebsen. J.D. Lapek Jr is an IRACDA fellow supported by NIGMS/NIH (K12GM068524)
Footnotes
Addendum
S. B. Jensen analyzed the data, interpreted the results, drafted the figures, and wrote the manuscript. K. Hindberg analyzed the data, interpreted the results, prepared the figures and critically revised the manuscript. T. Solomon, E. N. Smith, and J. D. Lapek Jr. analyzed the data and interpreted the results. D. J. Gonzalez analyzed the data. N. Latysheva organized data collection, and revised the manuscript. K. A. Frazer revised the manuscript. S. K. Brækkan and J.-B. Hansen designed the study, organized data collection, and critically revised the manuscript. All coauthors reviewed and approved the final version of the manuscript.
Disclosure of Conflict of Interest
The authors state that they have no conflict of interest.
References
- 1.Heit JA. Epidemiology of venous thromboembolism. Nat Rev Cardiol. 2015; 12: 464–74. 10.1038/nrcardio.2015.83. [DOI] [PMC free article] [PubMed] [Google Scholar]
- 2.Thrombosis: a major contributor to the global disease burden. Journal of thrombosis and haemostasis : JTH. 2014; 12: 1580–90. 10.1111/jth.12698. [DOI] [PubMed] [Google Scholar]
- 3.Huang W, Goldberg RJ, Anderson FA, Kiefe CI, Spencer FA. Secular trends in occurrence of acute venous thromboembolism: the Worcester VTE study (1985–2009). Am J Med. 2014; 127: 829–39 e5. 10.1016/j.amjmed.2014.03.041. [DOI] [PMC free article] [PubMed] [Google Scholar]
- 4.Afshin A, Forouzanfar MH, Reitsma MB, Sur P, Estep K, Lee A, Marczak L, Mokdad AH, Moradi-Lakeh M, Naghavi M, Salama JS, Vos T, Abate KH, Abbafati C, Ahmed MB, Al-Aly Z, Alkerwi A, Al-Raddadi R, Amare AT, Amberbir A, et al. Health Effects of Overweight and Obesity in 195 Countries over 25 Years. N Engl J Med. 2017; 377: 13–27. 10.1056/NEJMoa1614362. [DOI] [PMC free article] [PubMed] [Google Scholar]
- 5.Ferlay J SI, Ervik M, Dikshit R, Eser S, Mathers C, Rebelo M, Parkin DM, Forman D, Bray F GLOBOCAN 2012 v1.0, Cancer Incidence and Mortality Worldwide: IARC CancerBase No. 11 Lyon, France: International Agency for Research on Cancer;2013. Available from: http://globocaniarcfr, accessed on 15/12/2017 2012. [Google Scholar]
- 6.Cohen AT, Tapson VF, Bergmann JF, Goldhaber SZ, Kakkar AK, Deslandes B, Huang W, Zayaruzny M, Emery L, Anderson FA Jr, Investigators E Venous thromboembolism risk and prophylaxis in the acute hospital care setting (ENDORSE study): a multinational cross-sectional study. Lancet. 2008; 371: 387–94. 10.1016/S0140-6736(08)60202-0. [DOI] [PubMed] [Google Scholar]
- 7.Mayer RS, Streiff MB, Hobson DB, Halpert DE, Berenholtz SM. Evidence-based venous thromboembolism prophylaxis is associated with a six-fold decrease in numbers of symptomatic venous thromboembolisms in rehabilitation inpatients. PM R. 2011; 3: 1111–5 e1 10.1016/j.pmrj.2011.07.022. [DOI] [PubMed] [Google Scholar]
- 8.Rosendaal FR. Venous thrombosis: a multicausal disease. Lancet. 1999; 353: 1167–73. [DOI] [PubMed] [Google Scholar]
- 9.Norgaard I, Nielsen SF, Nordestgaard BG. Complement C3 and High Risk of Venous Thromboembolism: 80 517 Individuals from the Copenhagen General Population Study. Clin Chem. 2016. 10.1373/clinchem.2015.251314. [DOI] [PubMed] [Google Scholar]
- 10.Germain M, Chasman DI, de Haan H, Tang W, Lindstrom S, Weng LC, de Andrade M, de Visser MC, Wiggins KL, Suchon P, Saut N, Smadja DM, Le Gal G, van Hylckama Vlieg A, Di Narzo A, Hao K, Nelson CP, Rocanin-Arjo A, Folkersen L, Monajemi R, et al. Meta-analysis of 65,734 individuals identifies TSPAN15 and SLC44A2 as two susceptibility loci for venous thromboembolism. American journal of human genetics. 2015; 96: 532–42. 10.1016/j.ajhg.2015.01.019. [DOI] [PMC free article] [PubMed] [Google Scholar]
- 11.Puurunen MK, Enserro D, Xanthakis V, Larson MG, Benjamin EJ, Tofler GH, Wollert KC, O’Donnell CJ, Vasan RS. Biomarkers for the prediction of venous thromboembolism in the community. Thrombosis Research. 2016; 145: 34–9. 10.1016/j.thromres.2016.07.006. [DOI] [PubMed] [Google Scholar]
- 12.Bruzelius M, Iglesias MJ, Hong MG, Sanchez-Rivera L, Gyorgy B, Souto JC, Franberg M, Fredolini C, Strawbridge RJ, Holmstrom M, Hamsten A, Uhlen M, Silveira A, Soria JM, Smadja DM, Butler LM, Schwenk JM, Morange PE, Tregouet DA, Odeberg J. PDGFB, a new candidate plasma biomarker for venous thromboembolism: results from the VEREMA affinity proteomics study. Blood. 2016; 128: e59–e66. . [DOI] [PubMed] [Google Scholar]
- 13.Fashanu OE, Heckbert SR, Aguilar D, Jensen PN, Ballantyne CM, Basu S, Hoogeveen RC, deFilippi C, Cushman M, Folsom AR. Galectin-3 and Venous Thromboembolism Incidence: the Atherosclerosis Risk in Communities (ARIC) Study. Research and practice in thrombosis and haemostasis. 2017; 1: 223–30. 10.1002/rth2.12038. [DOI] [PMC free article] [PubMed] [Google Scholar]
- 14.van Hylckama Vlieg A, Baglin CA, Luddington R, MacDonald S, Rosendaal FR, Baglin TP. The risk of a first and a recurrent venous thrombosis associated with an elevated D-dimer level and an elevated thrombin potential: results of the THE-VTE study. Journal of thrombosis and haemostasis : JTH. 2015; 13: 1642–52. 10.1111/jth.13043. [DOI] [PubMed] [Google Scholar]
- 15.Karasu A, Baglin TP, Luddington R, Baglin CA, van Hylckama Vlieg A. Prolonged clot lysis time increases the risk of a first but not recurrent venous thrombosis. British journal of haematology. 2016; 172: 947–53. 10.1111/bjh.13911. [DOI] [PubMed] [Google Scholar]
- 16.Meltzer ME, Lisman T, de Groot PG, Meijers JC, le Cessie S, Doggen CJ, Rosendaal FR. Venous thrombosis risk associated with plasma hypofibrinolysis is explained by elevated plasma levels of TAFI and PAI-1. Blood. 2010; 116: 113–21. . [DOI] [PubMed] [Google Scholar]
- 17.Christiansen SC, Naess IA, Cannegieter SC, Hammerstrom J, Rosendaal FR, Reitsma PH. Inflammatory cytokines as risk factors for a first venous thrombosis: a prospective population-based study. PLoS medicine. 2006; 3: e334 10.1371/journal.pmed.0030334. [DOI] [PMC free article] [PubMed] [Google Scholar]
- 18.Tsai AW, Cushman M, Rosamond WD, Heckbert SR, Tracy RP, Aleksic N, Folsom AR. Coagulation factors, inflammation markers, and venous thromboembolism: the longitudinal investigation of thromboembolism etiology (LITE). Am J Med. 2002; 113: 636–42. [DOI] [PubMed] [Google Scholar]
- 19.Park MS, Spears GM, Bailey KR, Xue A, Ferrara MJ, Headlee A, Dhillon SK, Jenkins DH, Zietlow SP, Harmsen WS, Ashrani AA, Heit JA. Thrombin generation profiles as predictors of symptomatic venous thromboembolism after trauma: A prospective cohort study. The journal of trauma and acute care surgery. 2017; 83: 381–7. 10.1097/ta.0000000000001466. [DOI] [PMC free article] [PubMed] [Google Scholar]
- 20.van Es N, Di Nisio M, Cesarman G, Kleinjan A, Otten HM, Mahe I, Wilts IT, Twint DC, Porreca E, Arrieta O, Stepanian A, Smit K, De Tursi M, Bleker SM, Bossuyt PM, Nieuwland R, Kamphuisen PW, Buller HR. Comparison of risk prediction scores for venous thromboembolism in cancer patients: a prospective cohort study. Haematologica. 2017; 102: 1494–501. 10.3324/haematol.2017.169060. [DOI] [PMC free article] [PubMed] [Google Scholar]
- 21.Greene MT, Spyropoulos AC, Chopra V, Grant PJ, Kaatz S, Bernstein SJ, Flanders SA. Validation of Risk Assessment Models of Venous Thromboembolism in Hospitalized Medical Patients. Am J Med. 2016; 129: 1001.e9–.e18. 10.1016/j.amjmed.2016.03.031. [DOI] [PubMed] [Google Scholar]
- 22.Bruzelius M, Bottai M, Sabater-Lleal M, Strawbridge RJ, Bergendal A, Silveira A, Sundstrom A, Kieler H, Hamsten A, Odeberg J. Predicting venous thrombosis in women using a combination of genetic markers and clinical risk factors. Journal of thrombosis and haemostasis : JTH. 2015; 13: 219–27. 10.1111/jth.12808. [DOI] [PubMed] [Google Scholar]
- 23.Dayon L, Nunez Galindo A, Corthesy J, Cominetti O, Kussmann M. Comprehensive and Scalable Highly Automated MS-Based Proteomic Workflow for Clinical Biomarker Discovery in Human Plasma. J Proteome Res. 2014. 10.1021/pr500635f. [DOI] [PubMed] [Google Scholar]
- 24.Cominetti O, Nunez Galindo A, Corthesy J, Oller Moreno S, Irincheeva I, Valsesia A, Astrup A, Saris WH, Hager J, Kussmann M, Dayon L. Proteomic Biomarker Discovery in 1000 Human Plasma Samples with Mass Spectrometry. J Proteome Res. 2016; 15: 389–99. 10.1021/acs.jproteome.5b00901. [DOI] [PubMed] [Google Scholar]
- 25.Ting L, Rad R, Gygi SP, Haas W. MS3 eliminates ratio distortion in isobaric multiplexed quantitative proteomics. Nat Methods. 2011; 8: 937–40. 10.1038/nmeth.1714. [DOI] [PMC free article] [PubMed] [Google Scholar]
- 26.McAlister GC, Nusinow DP, Jedrychowski MP, Wuhr M, Huttlin EL, Erickson BK, Rad R, Haas W, Gygi SP. MultiNotch MS3 enables accurate, sensitive, and multiplexed detection of differential expression across cancer cell line proteomes. Analytical chemistry. 2014; 86: 7150–8. 10.1021/ac502040v. [DOI] [PMC free article] [PubMed] [Google Scholar]
- 27.Jacobsen BK, Eggen AE, Mathiesen EB, Wilsgaard T, Njolstad I. Cohort profile: the Tromso Study. Int J Epidemiol. 2012; 41: 961–7. 10.1093/ije/dyr049. [DOI] [PMC free article] [PubMed] [Google Scholar]
- 28.Braekkan SK, Mathiesen EB, Njolstad I, Wilsgaard T, Stormer J, Hansen JB. Mean platelet volume is a risk factor for venous thromboembolism: the Tromso Study, Tromso, Norway. J Thromb Haemost. 2010; 8: 157–62. . [DOI] [PubMed] [Google Scholar]
- 29.Gran OV, Smith EN, Brækkan SK, Jensvoll H, Solomon T, Hindberg K, Wilsgaard T, Rosendaal FR, Frazer KA, Hansen J-B. Joint effects of cancer and variants in the factor 5 gene on the risk of venous thromboembolism. Haematologica. 2016; 101: 1046–53. 10.3324/haematol.2016.147405. [DOI] [PMC free article] [PubMed] [Google Scholar]
- 30.Savitski MM, Wilhelm M, Hahne H, Kuster B, Bantscheff M. A Scalable Approach for Protein False Discovery Rate Estimation in Large Proteomic Data Sets. Mol Cell Proteomics. 2015; 14: 2394–404. 10.1074/mcp.M114.046995. [DOI] [PMC free article] [PubMed] [Google Scholar]
- 31.Elias JE, Gygi SP. Target-decoy search strategy for increased confidence in large-scale protein identifications by mass spectrometry. Nat Methods. 2007; 4: 207–14. 10.1038/nmeth1019. [DOI] [PubMed] [Google Scholar]
- 32.Eng JK, McCormack AL, Yates JR. An approach to correlate tandem mass spectral data of peptides with amino acid sequences in a protein database. J Am Soc Mass Spectrom. 1994; 5: 976–89. 10.1016/1044-0305(94)80016-2. [DOI] [PubMed] [Google Scholar]
- 33.Lapek JD Jr., Lewinski MK, Wozniak JM, Guatelli J, Gonzalez DJ Quantitative Temporal Viromics of an Inducible HIV-1 Model Yields Insight to Global Host Targets and Phospho-Dynamics Associated with Protein Vpr. Mol Cell Proteomics. 2017; 16: 1447–61. 10.1074/mcp.M116.066019. [DOI] [PMC free article] [PubMed] [Google Scholar]
- 34.Mitsugi H, Niki T, Takahashi-Niki K, Tanimura K, Yoshizawa-Kumagaye K, Tsunemi M, Iguchi-Ariga SM, Ariga H. Identification of the recognition sequence and target proteins for DJ-1 protease. FEBS Lett. 2013; 587: 2493–9. 10.1016/j.febslet.2013.06.032. [DOI] [PubMed] [Google Scholar]
- 35.Heikal NM, Murphy KK, Crist RA, Wilson AR, Rodgers GM, Smock KJ. Elevated factor IX activity is associated with an increased odds ratio for both arterial and venous thrombotic events. American journal of clinical pathology. 2013; 140: 680–5. 10.1309/ajcpagor4q2iikug. [DOI] [PubMed] [Google Scholar]
- 36.van Hylckama Vlieg A, van der Linden IK, Bertina RM, Rosendaal FR. High levels of factor IX increase the risk of venous thrombosis. Blood. 2000; 95: 3678–82. [PubMed] [Google Scholar]
- 37.DeRoo EP, Wrobleski SK, Shea EM, Al-Khalil RK, Hawley AE, Henke PK, Myers DD Jr., Wakefield TW, Diaz JA The role of galectin-3 and galectin-3-binding protein in venous thrombosis. Blood. 2015; 125: 1813–21. . [DOI] [PMC free article] [PubMed] [Google Scholar]
- 38.Wang Y, Gao H, Kessinger CW, Schmaier A, Jaffer FA, Simon DI. Myeloid-related protein-14 regulates deep vein thrombosis. JCI insight. 2017; 2 10.1172/jci.insight.91356. [DOI] [PMC free article] [PubMed] [Google Scholar]
- 39.Smith NL, Chen MH, Dehghan A, Strachan DP, Basu S, Soranzo N, Hayward C, Rudan I, Sabater-Lleal M, Bis JC, de Maat MP, Rumley A, Kong X, Yang Q, Williams FM, Vitart V, Campbell H, Malarstig A, Wiggins KL, Van Duijn CM, et al. Novel associations of multiple genetic loci with plasma levels of factor VII, factor VIII, and von Willebrand factor: The CHARGE (Cohorts for Heart and Aging Research in Genome Epidemiology) Consortium. Circulation. 2010; 121: 1382–92. 10.1161/CIRCULATIONAHA.109.869156. [DOI] [PMC free article] [PubMed] [Google Scholar]
- 40.Simone B, De Stefano V, Leoncini E, Zacho J, Martinelli I, Emmerich J, Rossi E, Folsom AR, Almawi WY, Scarabin PY, den Heijer M, Cushman M, Penco S, Vaya A, Angchaisuksiri P, Okumus G, Gemmati D, Cima S, Akar N, Oguzulgen KI, et al. Risk of venous thromboembolism associated with single and combined effects of Factor V Leiden, Prothrombin 20210A and Methylenetethraydrofolate reductase C677T: a meta-analysis involving over 11,000 cases and 21,000 controls. European journal of epidemiology. 2013; 28: 621–47. . [DOI] [PMC free article] [PubMed] [Google Scholar]
- 41.Demler OV, Pencina MJ, D’Agostino RB Sr. Impact of correlation on predictive ability of biomarkers. Stat Med. 2013; 32: 4196–210. 10.1002/sim.5824. [DOI] [PMC free article] [PubMed] [Google Scholar]
- 42.Pettersson T, Carlstrom A, Jornvall H. Different types of microheterogeneity of human thyroxine-binding prealbumin. Biochemistry. 1987; 26: 4572–83. [DOI] [PubMed] [Google Scholar]
- 43.Tanskanen M, Peuralinna T, Polvikoski T, Notkola IL, Sulkava R, Hardy J, Singleton A, Kiuru-Enari S, Paetau A, Tienari PJ, Myllykangas L. Senile systemic amyloidosis affects 25% of the very aged and associates with genetic variation in alpha2-macroglobulin and tau: a population-based autopsy study. Annals of medicine. 2008; 40: 232–9. 10.1080/07853890701842988. [DOI] [PubMed] [Google Scholar]
- 44.Saghazadeh A, Rezaei N. Inflammation as a cause of venous thromboembolism. Critical reviews in oncology/hematology. 2016; 99: 272–85. 10.1016/j.critrevonc.2016.01.007. [DOI] [PubMed] [Google Scholar]
- 45.Koide-Yoshida S, Niki T, Ueda M, Himeno S, Taira T, Iguchi-Ariga SM, Ando Y, Ariga H. DJ-1 degrades transthyretin and an inactive form of DJ-1 is secreted in familial amyloidotic polyneuropathy. Int J Mol Med. 2007; 19: 885–93. [PubMed] [Google Scholar]
- 46.Richarme G, Mihoub M, Dairou J, Bui LC, Leger T, Lamouri A. Parkinsonism-associated protein DJ-1/Park7 is a major protein deglycase that repairs methylglyoxal- and glyoxal-glycated cysteine, arginine, and lysine residues. The Journal of biological chemistry. 2015; 290: 1885–97. 10.1074/jbc.M114.597815. [DOI] [PMC free article] [PubMed] [Google Scholar]
- 47.Wautier JL, Wautier MP. Molecular basis of erythrocyte adhesion to endothelial cells in diseases. Clinical hemorheology and microcirculation. 2013; 53: 11–21. . [DOI] [PubMed] [Google Scholar]
- 48.Bafunno V, Santacroce R, Margaglione M. The risk of occurrence of venous thrombosis: focus on protein Z. Thromb Res. 2011; 128: 508–15. 10.1016/j.thromres.2011.08.007. [DOI] [PubMed] [Google Scholar]
- 49.Sofi F, Cesari F, Abbate R, Gensini GF, Broze G Jr., , Fedi S. A meta-analysis of potential risks of low levels of protein Z for diseases related to vascular thrombosis. Thromb Haemost. 2010; 103: 749–56. . [DOI] [PMC free article] [PubMed] [Google Scholar]
- 50.Al-Shanqeeti A, van Hylckama Vlieg A, Berntorp E, Rosendaal FR, Broze GJ Jr Protein Z and protein Z-dependent protease inhibitor. Determinants of levels and risk of venous thrombosis. Thromb Haemost. 2005; 93: 411–3. . [DOI] [PubMed] [Google Scholar]
- 51.Miletich JP, Broze GJ Jr. Human plasma protein Z antigen: range in normal subjects and effect of warfarin therapy. Blood. 1987; 69: 1580–6. [PubMed] [Google Scholar]
- 52.Han X, Fiehler R, Broze GJ Jr. Isolation of a protein Z-dependent plasma protease inhibitor. Proceedings of the National Academy of Sciences of the United States of America. 1998; 95: 9250–5. [DOI] [PMC free article] [PubMed] [Google Scholar]
- 53.Huang X, Liu B, Wei Y, Beyea R, Yan H, Olson ST. Lipid oxidation inactivates the anticoagulant function of protein Z-dependent protease inhibitor (ZPI). The Journal of biological chemistry. 2017; 292: 14625–35. 10.1074/jbc.M117.793901. [DOI] [PMC free article] [PubMed] [Google Scholar]
- 54.van Langevelde K, Flinterman LE, van Hylckama Vlieg A, Rosendaal FR, Cannegieter SC. Broadening the factor V Leiden paradox: pulmonary embolism and deep-vein thrombosis as 2 sides of the spectrum. Blood. 2012; 120: 933–46. . [DOI] [PubMed] [Google Scholar]
- 55.Schwenk JM, Omenn GS, Sun Z, Campbell DS, Baker MS, Overall CM, Aebersold R, Moritz RL, Deutsch EW. The Human Plasma Proteome Draft of 2017: Building on the Human Plasma PeptideAtlas from Mass Spectrometry and Complementary Assays. J Proteome Res. 2017; 16: 4299–310. 10.1021/acs.jproteome.7b00467. [DOI] [PMC free article] [PubMed] [Google Scholar]
Associated Data
This section collects any data citations, data availability statements, or supplementary materials included in this article.