

Abstract
The domain of medical imaging is anatomy. Therefore, anatomic knowledge should be a rational basis for organizing and analyzing images. The goals of the Digital Anatomist Program at the University of Washington include the development of an anatomically based software framework for organizing, analyzing, visualizing and utilizing biomedical information. The framework is based on representations for both spatial and symbolic anatomic knowledge, and is being implemented in a distributed architecture in which multiple client programs on the Internet are used to update and access an expanding set of anatomical information resources. The development of this framework is driven by several practical applications, including symbolic anatomic reasoning, knowledge based image segmentation, anatomy information retrieval, and functional brain mapping. Since each of these areas involves many difficult image processing issues, our research strategy is an evolutionary one, in which applications are developed somewhat independently, and partial solutions are integrated in a piecemeal fashion, using the network as the substrate. This approach assumes that networks of interacting components can synergistically work together to solve problems larger than either could solve on its own. Each of the individual projects is described, along with evaluations that show that the individual components are solving the problems they were designed for, and are beginning to interact with each other in a synergistic manner. We argue that this synergy will increase, not only within our own group, but also among groups as the Internet matures, and that an anatomic knowledge base will be a useful means for fostering these interactions.
In the past few decades, developments in medical imaging technology have led to major advances in diagnosis and treatment. The very success of these technologies has resulted in the proliferation of both the number and variety of medical images. It is now becoming difficult, if not impossible, to manage and analyze the images by manual methods. The current issue of the Journal reflects this situation and documents the need for an informatics of medical imaging, which we regard as part of structural informatics. We have previously defined structural informatics as a sub-discipline of medical informatics concerned with the representation and management of information related to the physical organization of the body.1
In this paper we argue that a knowledge-based approach has considerable promise for processing and managing medical images. Knowledge-based approaches to problem solving use prior knowledge of the problem domain to organize the information, in order to reduce the search for solutions, and to fill in gaps in the data.2 Since the primary problem domain of medical imaging is anatomy, we argue that a knowledge base of anatomy should be useful for solving problems related to medical imaging. This assertion should have intuitive appeal to medical practitioners, who interpret medical images using their own knowledge of anatomy.
The goals of the Digital Anatomist Program at the University of Washington are to build a knowledge base of anatomy and to develop applications that use this knowledge for solving problems in patient care, biomedical research and education. Because anatomy is fundamental to all health professions, we argue that an anatomy knowledge base should be widely reusable for organizing and managing biomedical information. Therefore, our goals also include providing on-line access to the knowledge representations and applications we develop.
Since medical images are one of the primary means for communicating anatomical information, the development of the knowledge base requires a large amount of image management and analysis. On the other hand, as the knowledge base evolves, it will facilitate the organization and analysis of images. Therefore, the representations and applications we develop and use are directly relevant to the problems addressed in this issue of the Journal.
In building an anatomy knowledge base, we have adopted a research strategy in which the development of the representations of anatomic data and knowledge is driven by defined problem domains, much like early work in expert systems.3 Our approach is somewhat unusual in that we need to address several image processing problems in parallel, while also integrating solutions so that they work together. The more common research approach is to focus on a single area (for example, databases or image segmentation), because each of these areas has complex problems that demand deep exploration. Thus, the disadvantage to our approach is that we can only make limited advances in each of the fields we are addressing. However, we believe that the task of getting different systems and solutions to work together is, in itself, a research problem worthy of interest. As this paper shows, solutions to this problem result in practical applications that would not materialize if only a single issue were addressed.
The remainder of this paper describes our conceptual framework for organizing and accessing anatomic knowledge, the current applications that drive the development of the representations, and examples that show how the network is used to integrate solutions to each of these applications.
Conceptual Framework
Figure 1 provides a conceptual overview of the distributed architecture we are developing for representing and utilizing anatomic knowledge.4 Although our work is in the area of gross anatomy, our hypothesis is that the same organizational principles apply at all levels of the structural hierarchy.1 Therefore, we describe the conceptual framework in terms of structural information. However, in its strictest definition, the word anatomy applies to all levels of the hierarchy.5
Figure 1.

Conceptual architecture of the Digital Anatomist distributed framework. End user and authoring programs access a set of reusable structural information resources by means of one or more structural information servers. The resources are classified as data or knowledge, and as spatial or symbolic. Many of the research problems in structural informatics involve the development of representations for these resources.
In our conceptual framework, four kinds of representations are implemented in the structural information resources shown at the bottom of Figure 1. Structural information servers (including Web servers) provide access to these resources over the Internet. Two types of application programs access the resources: authoring programs, which enter information into the resources, and end user programs, which access them.
Structural Information Resources
Representing information about the physical organization of the body is a difficult research problem in structural informatics. To subdivide this problem into its components, we have classified structural information along two different dimensions: spatial versus symbolic, and data versus knowledge.4 This classification has since been adopted by others, and it has also influenced the evolution of the National Library of Medicine's Visible Human Project.6
Along the first dimension, we think of spatial information as information that has dimensionality, such as a molecular sequence or a medical image. We think of symbolic information as all the other kinds of structural information; for example, the names and semantic relationships of anatomic entities. In general, spatial information is conveyed by the illustrations in an anatomy textbook, whereas symbolic information is conveyed by text. These distinctions are not precise, however, because spatial relationships, such as “anterior-to,” can be expressed qualitatively. Nevertheless the distinction is useful because quantitative spatial information, especially that of higher dimensionality, requires a large number of bits to represent, thus posing challenges not present in other kinds of information.
Along the second dimension, we think of structural data as information about a single individual: a set of CT images through the abdomen of a given patient, or a 3-D reconstruction of that patient's kidney. Structural knowledge, on the other hand, is usually expressed by models that capture information about classes of individuals: the class of all normal kidneys, including the range of variation, or the names and semantic relationships of anatomic objects in the body. This distinction is useful because each kind of information is studied by a different field: artificial intelligence and computer vision for structural knowledge, and multimedia databases for structural data.
The four structural information resources shown at the bottom of Figure 1 are a result of these categorizations:
A spatial database, consisting of quantitative structural information having one to four dimensions. For example, a molecular sequence is an example of 1-D spatial data; a plane image, a region, or a contour are examples of 2-D spatial data; an MRI volume dataset, a 3-D region of labeled voxels, or a polygonal surface are examples of 3-D spatial data; and a set of time-varying 3-D CT images, such as those obtained by the Mayo Clinic Dynamic Spatial Reconstructor,7 are examples of 4-D spatial datasets.
A symbolic database, consisting of non-spatial data about individuals. For visual databases or image repositories,8,9 these data are often meta-data about corresponding spatial data. For example, meta-data about medical images include the image filename, modality, acquisition date, image size, etc. The combination of spatial and symbolic data into multimedia databases, including image databases, is an active area of development.10
A spatial knowledge base, consisting of quantitative spatial models about classes of anatomic objects, as well as the relationship between those objects. Such models can provide high-level guidance to low-level image analysis functions.11 Examples include a 3-D model of all normal kidneys that also includes the range of variation, a set of geometric constraints that describe how the kidney relates spatially to the liver, or a probabilistic atlas of brain structures in a standard stereotactic coordinate system.12 Since it is difficult to obtain ranges of variation for all structures, quantitative spatial knowledge is more often represented by one or more canonical models of anatomy, based only on one or two individuals. For example, the Visible Human male and female6 are likely to fill the role of canonical models of spatial anatomic knowledge once they have been fully segmented and labeled.
A symbolic knowledge base, consisting of symbolic representations of the physical and conceptual entities that comprise anatomy. In their simplest form, these entities are represented by terms in structured vocabularies such as the Unified Medical Language System.13 The knowledge base, however, should be structured in ways that emulate the physical organization of the body and that are intuitive to humans. A requirement is the explicit definition of anatomic concepts and their characteristics (anatomic attributes), on the basis of which the concepts can be grouped together into classes and members of different classes can be distinguished from one another. Formalisms, such as semantic networks, conceptual graphs, ontologies and other frame-based systems2 lend themselves to represent different aspects of symbolic anatomic knowledge. Provided there is comprehensive concept representation and terminology associated with the concepts, such a knowledge base should serve as a valuable resource for indexing and managing the spatial data arising as a result of advances in imaging and other technologies.
Application-driven Development
Given the difficult problems in representation, our research approach is an evolutionary one: practical applications are chosen to drive the development of the representations, and current representations are made available to network-based clients by means of one or more structural information servers.
Our long-term goal is to provide an integrated set of structural information resources that can be re-used in multiple applications. To approach that goal we implement somewhat different instantiations of the conceptual framework for each application, then integrate them incrementally, using the network as the integration medium. The rationale for this approach is our hypothesis that (1) relatively independent software components, when organized around a common structural framework and interconnected via the network, will synergistically interact to solve problems larger than any could solve on its own; and (2) an integrated structural information framework will emerge as a result of these piecewise interactions.
In the next four sections we describe our current applications. Each application is developed somewhat independently of the others, but always with an eye toward integration over the network. For each application we describe the problem, the current implementation, an evaluation of the implementation, and work in progress. We also describe examples of, and opportunities for, integration with components developed in other applications. These examples support our hypothesis that synergistic interactions among components will increasingly occur.
The first two applications directly drive the research in symbolic and spatial knowledge representation, whereas the second two are primarily concerned with integrating and delivering anatomic information to end users.
Symbolic Knowledge Base
Our work on symbolic representation of anatomic knowledge is currently driven by the need to develop a comprehensive set of terminology, as an anatomic enhancement of UMLS's Semantic Network and Metathesaurus.5,13 This terminology is necessary for indexing normal anatomic structures found on medical images, such as those provided by the Visible Human Project.
To date, we have established an ontology that classifies physical anatomic entities in an Aristotelian hierarchy based on the ISA relationship and have instantiated the ontology for all static, macroscopic, anatomic entities that make up the thorax. We associate a unique term, the preferred name, as well as all its synonyms, with each concept and use this term for human-readable representations of the ontology. Ontologies that conceptualize defined domains of information and also model the structure of the knowledge have been advocated recently as knowledge representation formalisms that can be most readily reused and combined to meet the needs of diverse problem-targeted applications in medicine.14,15,16,17 We argue that knowledge-based medical applications must access relevant anatomic information in a form that can be mapped to each application's semantics and syntax. Our purpose with the Digital Anatomist Symbolic Knowledge Base is to make available such a generalizable resource that can be reused, not only for medical imaging but also for other problems in clinical medicine, biomedical education, and research.
Our current anatomic ontology consists of the three top level classes of anatomic entities shown in Figure 2. Each of these classes has multiple subclasses along the ISA hierarchy. We have also implemented PART-OF, BRANCH-OF AND TRIBUTARY-OF links, and we have used them to represent anatomic relationships of very high granularity (see, for instance, Figs. 4 and 8). Although this representation has been fully instantiated as yet only for the thorax, we contend that each macroscopically identifiable physical entity in the body can be assigned to the subclasses we have defined.
Figure 2.

Screen capture showing the three top level classes, and some of the subclasses, in our anatomical ontology. The » symbol indicates that the class has at least one subclass that is not shown. For example, “Organ” has 19 first-generation subclasses. The leaves of the tree are instances, as for example the “Right upper limb,” which belongs to the class “Upper limb.” Not all classes are yet instantiated (for example, “Molecule”).
Figure 4.

Knowledge Manager. A NeXTStep program for entering new terminology and relationships in the Symbolic Knowledge Base. The left window shows the BRANCH-OF hierarchy for the Ascending Aorta. The conus branch of the right coronary artery is highlighted, and the corresponding concept and terms are shown in the upper right-hand windows. This concept is not in UMLS but is in SNOMED, and the preferred term has at least three synonyms.
Figure 8.
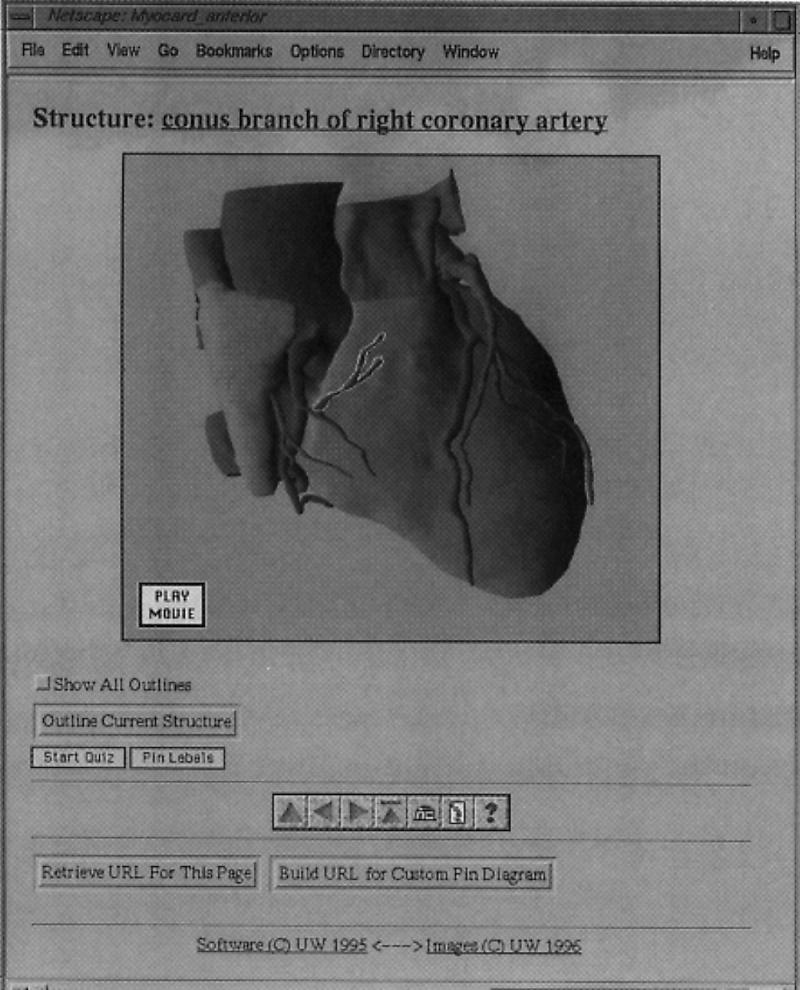
Browse mode for the Web atlas client, showing an annotated 3-D image from our Thoracic Viscera atlas. The user has clicked in the outlined region, which caused the Web server to re-send the image with the name of the structure shown along the top. The user then clicked “Outline Current Structure,” causing the server to redraw the image with the current structure outlined. Other buttons include “Start Quiz,” which initiates Quiz mode (Fig. 9), and “Pin Labels,” which labels all the structures on the image. The row of buttons below the “Start Quiz” and “Pin Labels” buttons are for navigation, help and a table of contents. The bottom buttons generate URLs that can be pasted into on-line tutorials or syllabi. In the locally available version shown here, the user may click on the structure name to initiate a query to the Symbolic Knowledge Server. All processing is done by the server DA-CGI package.
The full potential of the ontology will be realized when it is combined with general problem solving and nonanatomic domain ontologies (e.g., physiology, medical imaging, spatial reasoning). However, the ontology already clarifies the manner in which complex and detailed anatomic information can be represented in human readable form (Figure 4), and provides semantically-meaningful terminology for annotated images (see Fig. 8).
Representation and Implementation
Figure 3 shows the software components that support the current ontology, as an instance of the conceptual framework shown in Figure 1. In this case the symbolic knowledge base is represented by two tables in a relational database and by associated text files containing definitions and other textual attributes that provide the basis for later formalization. The terms table contains the names and synonyms for all anatomic concepts. Each concept is assigned a unique ID, and, as in the Metathesaurus, all synonyms refer to the same concept ID. The terms table also records the associated SNOMED and UMLS ID if the concept exists in these sources.
Figure 3.

Symbolic knowledge base management. The Symbolic Knowledge Base is a semantic network that is stored in the Terms and Links tables of a relational database. Attributes of the classes represented by the Terms are currently represented in associated text files. The database is accessed by a standard relational database server that is called directly by the Knowledge Manager knowledge acquisition program, Figure 4. The Knowledge Base can also be accessed by the Symbolic Knowledge Server, a hybrid Lisp-C application that provides a high level query language to the Knowledge Base.
Terms are related by means of the links table, which records binary semantic relationships such as ISA and PART-OF. The relational database is accessed by the Sybase commercial relational database server (http://www.sybase.com), which is in turn accessed by the Symbolic Knowledge Server, a hybrid Lisp-C program that provides a high-level Lisp-based query language for symbolic knowledge retrieval.18
Knowledge acquisition is aided by means of the Knowledge Manager program, a tool we built for entering new knowledge in the knowledge base. Figure 4 is a screen dump from the Knowledge Manager Program, which is written in NeXTStep for the NeXT computer (http://www.next.com).
Evaluation and Further Work
To date we have entered a total of 11,944 terms, 7,159 concepts, and 13,210 relationships, representing all distinct structures visible in the thorax to 1 mm resolution.5 Each distinct structure has been classified as an instance of one or more anatomic semantic types, where the anatomic semantic types are specializations of types defined in the UMLS semantic network. The correctness of the terms and relationships are currently being validated within our local group and at the National Library of Medicine (NLM), after which they will be integrated with the UMLS.
The ontologies we are developing form the basis of a symbolic knowledge base, but the current representations capture only certain aspects of anatomic knowledge. Our future work will port these representations to an established frame-based system or to one we develop that is interfaced to an object-oriented database, since our knowledge base is, or will become, larger than many memory-based systems can handle.
Spatial Knowledge Base
Our work in spatial anatomic knowledge representation is driven by the need to segment medical images, in order to extract patient-specific anatomic structures. Segmentation is a necessary prerequisite for almost any kind of medical image processing, yet most clinical segmentation is still performed manually. For our purpose, a spatial knowledge base will consist of a complete 3-D model of all normal anatomic structures, incorporating both the normal range of variation and the spatial relationships of these structures. Given such a model and the associated knowledge-based imaging functions, it should be possible to create an instance of the model that conforms to a particular patient's anatomy, thereby segmenting the associated image set in the process.
There are many current attempts to develop deformable models, in which a single canonical model is deformed to fit a set of image data. For instance, image segmentation of the brain is currently approached predominantly in this way.19,20,21 Deformable models generally minimize a cost function that includes curvature terms as well as image gradient terms. Local minima are often avoided by simulated annealing or backtracking procedures.
Methods that use deformable models can be called adjustment procedures, since a single canonical model is adjusted to fit the data.22,23 An advantage of these procedures is that they are computationally feasible; however, a disadvantage is that much of the “knowledge” is procedurally contained within the cost function rather than in the model itself. An alternate approach, which we are developing for both image segmentation and protein structure determination,23,24,25,26,27 can be called an exclusion procedure. Ideally, in this approach, an initial model contains within it all possible instances of the model, as learned from a training set. Then, as data are examined, the range of instances is reduced to the point where only a single instance remains.
The advantages of the exclusion approach are: (1) as long as the correct structure is not prematurely eliminated, it will eventually be found by deleting instances that are not compatible with the data; (2) at any time the remaining instances can be used to constrain the search for new data; and (3) the initial model provides a basis for shape classification based on range of variation. The disadvantage of the exclusion approach is that it is very difficult to design a model that is both computationally feasible and capable of representing all possible instances.
Representation and Implementation
For both our image segmentation and protein structure work we have developed a representation, called geometric constraint networks (GCNs),24,28 that attempts to model 3-D shape and range of variation by a set of interacting local shape constraints. The hypothesis behind this representation is that a collection of local constraints can interact to generate an “emergent” representation for the overall shape of the object.
For image segmentation we implemented and tested a 2-D version of GCNs called a radial contour model (RCM),25,26 shown superimposed on a cross-section of the kidney in Figure 5A. The model consists of a set of fixed radials emanating from a local contour coordinate system, where a 2-D contour of an organ on an image is defined by the position along each radial to the organ border. Shape knowledge is represented by a set of local constraints between neighboring radials, where each constraint essentially specifies the range of allowable slopes for the line between neighboring radials.
Figure 5.
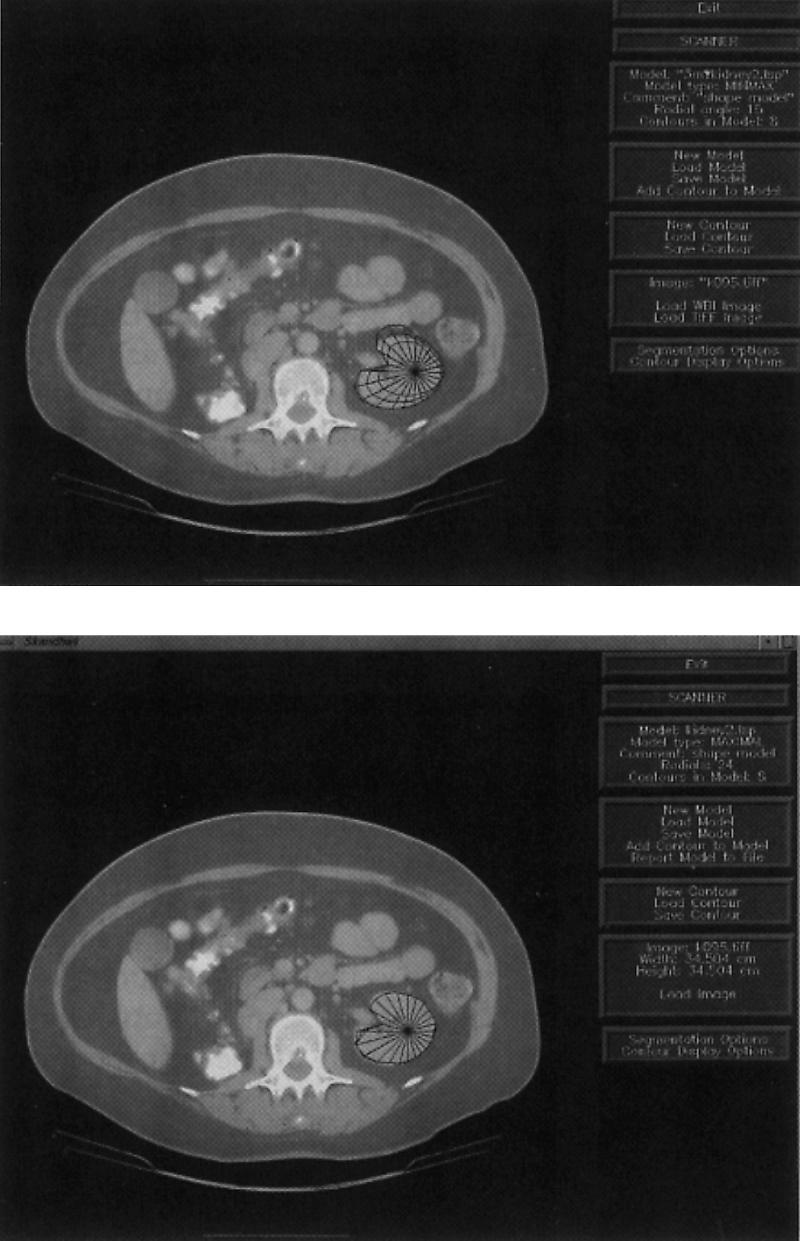
F-2-D, shape-based image segmentation in the Scanner program. A: Initial 2-D radial contour model after user has indicated two endpoints, and constraints have propagated to generate an initial uncertainty region delineated by the inner and outer contours, and a bestguess contour as the midpoints along the radials in the uncertainty region. B: Final stage, after all edges have been found.
The RCM was implemented within a semiautomatic knowledge-based image segmentation system called Scanner.25,26Figure 5 is a screen capture from Scanner, in which a set of eight similarly shaped contours from the hilar region of the kidney were used as a training set for an RCM describing the shape and range of variation for a cross-section of the normal kidney. To segment a new contour, the user indicates two end-points of a long axis on the kidney cross-section. These points establish the location of the kidney model in the image, while also defining the distance along two radials in the model. These distances are propagated throughout the network of constraints to generate the model shown in Figure 5A, which shows an outer and inner boundary defining an uncertainty region, as well as a current “bestguess” boundary defined by the midpoint of each radial uncertainty interval. This model was generated solely from the two axis endpoints and the constraints learned from the training set.
The uncertainty region defines the range of instances that remain compatible with both the model and with the data that have been examined so far. In Scanner the uncertainty region is used to limit the search for the distance along each of the remaining radials to the edge of the kidney contour. For each radial, an edge finder looks for the edge only along the interval defined by the inner and outer uncertainty contours. Once an edge is found, it is propagated throughout the network, resulting in a smaller uncertainty region, which is then used to constrain the search for more radials. The procedure terminates when (1) all the radials have been examined or (2) the uncertainty area is small enough. The bestguess contour is then taken as the result. Figure 5B shows the final stage in this process. Once the procedure terminates, the user can correct any radials whose edges were incorrectly found.
Evaluation and Further Work
The radial contour model was evaluated on 15 cross-sectional shapes from CT images of 16 patients. The goal was to decrease segmentation time for radiation treatment planning, since the current method is mostly manual.25,26 The evaluation showed that the RCM has the potential to decrease segmentation time by about a factor of three over a purely manual technique for many of the “critical” structures that must be avoided during radiation treatment for cancer.
The advantage of this procedure over a pure-edge-following or region-based approach is that the model can “hallucinate” edges where none are present in the image, a frequent occurrence with soft tissues or with noisy imaging modalities such as ultrasound. Our approach also recognizes that no current segmentation technique is error free, so it necessary to include the user as an integral part of the process. These advantages, and the successful evaluation on 2-D data, have led to an implementation of a 3-D radial model (Fig. 6), which is now being evaluated for brain segmentation.27
Figure 6.
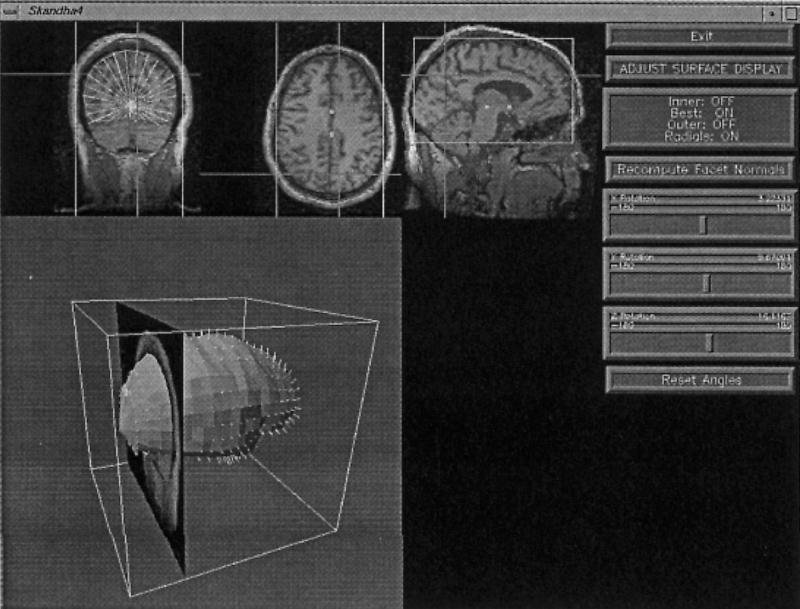
F-3-D, shape-based image segmentation in the Scanner program. A 3-D radial model is represented by a series of parallel slices, each of which is a 2-D radial model. Constraints relate not only radials on the same slice, but also neighboring slices, thereby allowing edges on one slice to constrain the search for edges on nearby slices. The top three panels are orthogonal views through a volume MR dataset of the brain. The bottom panel shows an instantiated model of the cerebral cortex after all radials have been found. The location of the current slice is shown in relation to the model.
However, the radial model cannot represent the detailed anatomy of such structures as the sulcal patterns on the brain surface in Figure 10. The current search engine also has no way to restore an instance of the model that is eliminated by incorrect choice of an edge along a radial. On the other hand, the currently popular deformable models require a good starting structure in order not to become lost in a local minimum. Thus, we are exploring using the radial model as a starting point for other techniques, such as deformable models, edge- or surface-following, or region growing. The constraints can also be incorporated directly into the cost function of a deformable model to provide additional shape knowledge to the adjustment procedure.
Figure 10.
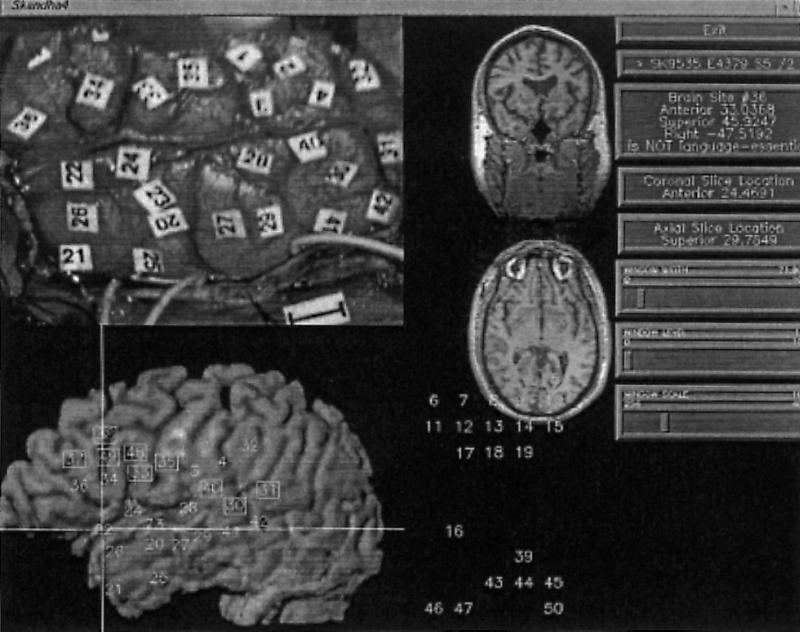
Brain Mapper. Top left: intraoperative photo showing numbered stimulation sites. Bottom left: volume-rendered left temporal surface with mapped stimulation sites; square boxes are essential for language. Top middle: coronal and transverse slices through MR volume corresponding to intersection of lines shown on reconstruction. Bottom middle: palette of numbers that are dragged over the reconstruction to perform the mapping. Right: menu of operations.
Once such shape models are developed for individual organs (e.g., kidney, liver), the models can be related to each other, so the position of one structure constrains the search for the other. However, representation of variation in the transform relating one 3-D coordinate system to another can be computationally intractable.23 For this reason, we have explored the possibility of probabilistic measures of variation.29 For the 2-D models there was no significant improvement over the minmax approach.26 However, in the 3-D case, it is likely that the computational savings will make this approach the preferred method.
Anatomy Information System
The previous two sections described work that is primarily concerned with development and implementation of the spatial and symbolic knowledge base. The next two sections describe work that utilizes the evolving knowledge base for educational and research applications. These applications necessarily require the integration of several image-processing components, so the focus is on delivery and integration.
The long-term goal of the work described in this section is an anatomy information system that is available from any desktop computer on the network. The development of this system is driven by the needs of students learning anatomy, but the system has now evolved so much that it is used by clinicians as well. A user of the information system should be able to query the knowledge base for specific anatomic questions, to retrieve dynamically generated 3-D scenes illustrating answers to the query, and to use the retrieved information as the basis for queries of related databases and image repositories available on the network. Such an information system requires many modules, including visual databases, 3-D modeling, real-time rendering, virtual reality, and others. As in all our applications, our approach to meeting these requirements is an incremental one.
The current version of our anatomy information system (Fig. 7) has evolved from several previous versions.30,31 Although this version does not satisfy all the long-term requirements of an anatomy information system, it contains many components of that system, all within the conceptual framework shown in Figure 1.
Figure 7.

Anatomy information system, as an instance of the conceptual framework shown in Figure 1. In this case the Spatial Database contains a series of anatomy atlases showing specific body regions, each consisting of 3-D animations and annotated images. The atlas contents are generated by the Morpho, Skandha, and Frame Builder authoring programs, and accessed via the Atlas Web client. All Web operations are controlled by the C-based DA-CGI Package, which also connects to the Symbolic Knowledge Server.
In the current system, the spatial database consists of sets of annotated images and animations packaged into interactive atlases representing different body regions. Most of the images and animations are renderings of 3-D models created by our in-house authoring programs, although any annotated 2-D images may be utilized. The atlases may be offloaded to CD-ROM, where they are accessible by custom Mac and Windows clients. They also may be accessed directly by an atlas Web client implemented by a set of common gateway interface (CGI) programs called the DA-CGI package.32 The DA-CGI package also provides links to the symbolic knowledge server.
Atlas Authoring
The construction of the animations and annotated images involves several image-processing steps implemented by the authoring programs shown in Figure 7. Ideally, these steps should all be automatic once a 3-D anatomic model can be deformed to fit the data. However, since we have not solved this problem, we use a more traditional approach but with an eye toward integrating advances in knowledge-based segmentation from our own laboratory and those of others.
The 3-D models are generated by a process of 3-D reconstruction from serial sections. The input is an image volume consisting of a set of serial sections. Two well-known examples of this kind of input are the Visible Human male and female,6 but clinical image volumes can also be used. The cross-section of each structure on each of these images is segmented, using a manual segmentation tool called Morpho. The resulting stack of contours is input to the Skandha program.18,33 Skandha is then used to reconstruct the contours into a 3-D surface, to combine surfaces into 3-D models, and to render the models, either as static 2-D images or as Quicktime animations. In our production system, most of these tasks are done manually (without the aid of shape knowledge), which is not a major burden since only one or two canonical models are being developed.
The 2-D images are annotated by a Java-based34 software tool we call Frame Builder, which allows the author to delineate regions on the images, and to label them either with the structure names or with commands to open other images. The annotations are saved in a separate file we call a frame. The combined animations and image-frame pairs are saved in a separate directory, one for each atlas.
Atlas Retrieval
The atlases are accessed over the network by means of the Atlas Web client, which is implemented by a set of C programs that constitute the DA-CGI package. For a given atlas the user navigates through the set of images by clicking on small image icons that retrieve the full image, or by searching for images that depict a structure. Once an annotated image is retrieved, it can be examined in either browse mode or quiz mode.
Figure 8 shows browse mode for an annotated rendering of a 3-D model in our atlas of Thoracic Viscera. Figure 9 shows quiz mode for an image from our brain atlas. In both these modes, state information is maintained by hidden form fields that are passed among the different DA-CGI programs.
Figure 9.
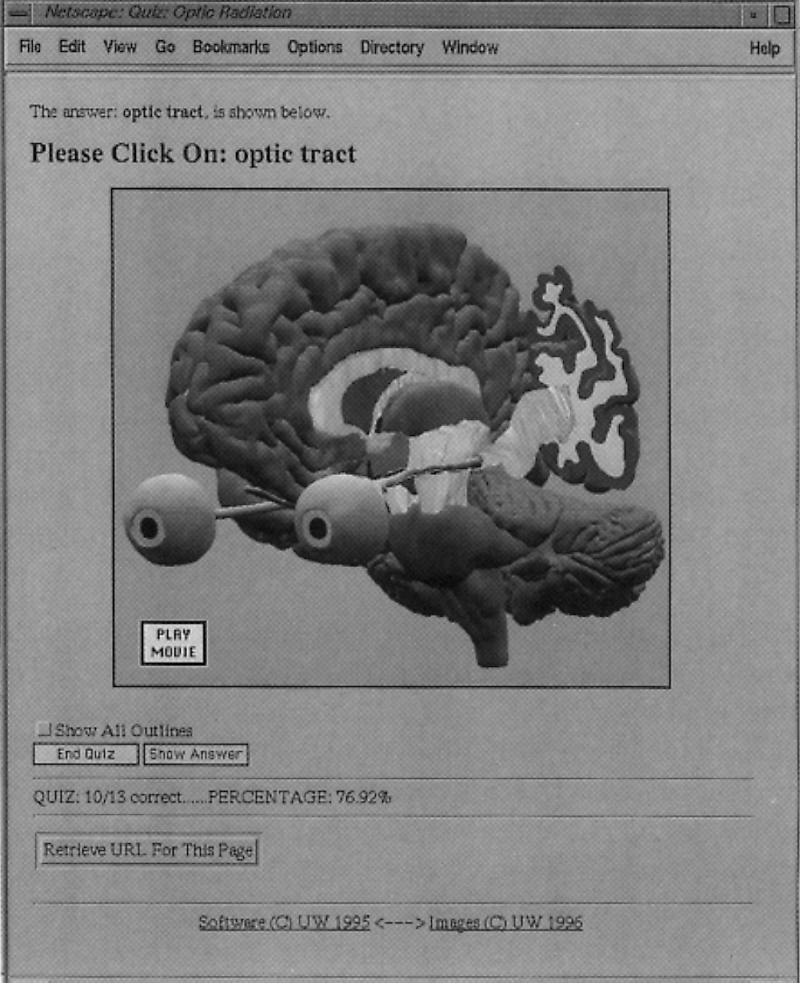
Quiz mode for the Web atlas client, showing an annotated 3-D image from our brain atlas. The DA-CGI programs systematically request the user to point to each annotated structure, keeping track of the number of correct answers. In this case the user has clicked “Show Answer,” which causes the server to redraw the image with the currently-request structure, optic tract, outlined. Hidden form items record the score and the list of structures already asked.
Additional atlas client modes are described more fully elsewhere.32,35 These include a Pin Label mode, reachable from the button shown in Figure 8, in which the names of all structures are arranged in the margin, and lines are drawn to the centers of the regions depicting the structures. Other modes include a table of contents mode, which allows the user to see the navigation hierarchy implicit in the frames, a knowledge base browse mode, which displays the knowledge base hierarchy similar to that shown in Figure 4, and a search mode. Search mode is entered either by typing a term name or by clicking on a term in a knowledge base hierarchy. In either case, the search engine consults a separate relational database that contains the URLs for all images that contain the term. The user can then select from this list to retrieve the desired image. The search database is constructed by an “atlas crawler” program, similar to such Web search engines as the Web Crawler (http:/webcrawler.com), that searches all atlases on the Web that are known to it.
Evaluation
Various versions of the anatomy information system have been in use since 1992, and evaluations have been in the context of gross anatomy and neuroanatomy education. However, we envision that this kind of information will be of use in many areas of clinical medicine, research, and education. Evaluations have primarily addressed the following questions: (1) How useful and general is the software framework for entering and delivering image-based anatomic content, and (2) how is the atlas used? We have also looked at the effect of network response time on the usefulness of the atlas.36,37,38
The utility of the distributed framework for entering and delivering image-based anatomic content is evidenced by (1) the number of different interactive atlases that have been created by different authors and (2) our ability to deliver the same information via CD-ROM as well as via net-based client programs.
The software framework has to date been used by our group to create atlases of the brain from a cadaver and from MRI of a living volunteer,39,40 an atlas of the thoracic viscera,41,42 an atlas of the knee,43 and smaller atlases of the brainstem and chest radiology. The same material is available on videodisc,39,42 CD-ROM,40,41,43 and the Internet.31,32
The success and generality of the software framework has prompted the IAIMS program at the University of Washington to propose the Digial Anatomist anatomy information system as a tool that will be provided to faculty throughout the Health Sciences Center, and to universities in the four-state area of the University of Washington's WAMI (Washington, Alaska, Montana, Idaho) regional medical education program. We expect that the authoring tools will soon be used by many authors to develop image-based atlases that can be linked over the Web. In fact, nothing requires the content to be medically-related, so it is likely that the tools will be of use in areas outside of medicine.
The usage of the various atlases has been assessed by our local experience, and by examination of on-line log files and comments.
Various versions of the atlas client have been in use for neuroanatomy and gross anatomy classes at the University of Washington since 1992, and by other institutions over the network since 1994. The Web version was introduced in June 1995 and has since received six Web awards by outside rating organizations. Since winter 1994 we have only used net-based access for our local courses because of the convenience to the authors in updating content.
During a one-year period from June 1995 through June 1996, the total number of sites accessing the Web atlas was over 13,000 from 81 countries. Usage peaked during midterm and final exams and was very low during breaks. The average Web daily requests was 4,073, with a peak of about 25,000 requests on one day. On-line comments have been very favorable; the major requests are for more material, for other ways to navigate through the information, and for links to other parts of the anatomy curriculum.
Integration and Further Work
The anatomy information system provides our most complete current example of an integrated system. For instance, as shown in Figure 7, the symbolic knowledge base is accessible via both the Knowledge Manager program (Fig. 4) and the symbolic knowledge base server, which is in turn accessed by the atlas client. This means that as soon as the authors enter new information into the knowledge base, the information becomes available to the Web-based term inspector and the knowledge browser in the atlas.
Similarly, as soon as authors create new annotated images, using Skandha and Frame Builder, the new annotated images become available throughout the world. This is one of the reasons why many remote users prefer the on-line atlas over the static CD-ROMS. (Another reason might be that the on-line atlases are currently free.)
In addition to basic issues of 3-D modeling, much of the effort required to extend the anatomy information system will also involve integration, particularly between spatial and symbolic information. For example, once a complete set of anatomic terminology has been entered with the Knowledge Manager for all parts of the body, it will be necessary to ensure that all frames created by Frame Builder are labeled with terms from the Knowledge Base. For existing frames this can be done by an off-line interactive lexical matching process. For newly created frames, however, the Java-based Frame builder will directly access the Symbolic Knowledge Server to display lists of terms that can be selected for annotating the images.
Once all the frames have been indexed by terms in the knowledge base, the atlas search engine can be made more intelligent, since it can use the semantic hierarchies in its searches (i.e., “Find all frames that show any BRANCH-OF the ascending aorta”). The atlas client can also use the knowledge hierarchies to dynamically change the level of annotation detail: high levels, such as “left ventricle” or “aorta,” for K-12 students, and lower levels, such as “conus branch of right coronary artery,” for interventional radiologists and cardiac surgeons.
A second major integration step will enable the Web atlas client to call the Skandha program as a server, so that it can dynamically generate 3-D scenes that are annotated with structure names. The scenes can either be rendered on the server as static annotated images, or they can be sent to a VRML client for 3-D interactive viewing. Skandha can already be called as a server; however, the 3-D models need to be indexed by terms in the knowledge base, and the models need to be saved in a more accessible database. The repository manager being developed for the brain mapping project (see next section) should serve as a very useful management system for atlas models as well.
In the longer term, knowledge-based segmentation programs like Scanner will utilize combined 3-D spatial and symbolic knowledge to automatically instantiate patient-specific 3-D models from clinical image volumes, without the need for manual segmentation, reconstruction or image annotation. The models will then be accessed, by more advanced versions of the DA-CGI package, to generate on-line, realtime 3-D atlases, not just from canonical data like the Visible Human, but from any patient dataset.
Brain Map Information System
The second major application is an information system for managing data about the human brain.44 This application is funded by the Human Brain Project,45 a national multiagency effort to develop informatics tools for managing the exploding amount of information that is accumulating about the human brain, much of which is due to advances in medical imaging technology.
The objective of our Human Brain Project effort is to organize functional information about the brain around the structural framework that is conceptually illustrated in Figure 1. This application therefore extends the utility of the anatomy information system, described in the previous section, by using it to organize nonstructural information.
The particular neuroscience problem we are addressing is the management, visualization, and analysis of cortical language mapping data. In recent years, advances in imaging technology such as PET46 and functional MRI47 have allowed researchers to observe areas of the cortex that are activated when the subject performs language tasks. These advances have greatly increased the amount of data available about human language, and they have also emphasized the need to organize and integrate the sometimes contradictory sources of data in order to develop theories about language organization. Our hypothesis (and that of most Brain Project researchers) is that neuroanatomy is the common substrate on which the diverse kinds of data can be integrated.
In our initial prototype we are concentrating on electrical stimulation mapping data, obtained at the time of neurosurgery for intractable epilepsy. Once the neurosurgical data have been mapped to a patient-specific 3-D anatomical model of the brain, it will be possible to relate them to other kinds of data obtained from the same patient, such as functional MRI or PET. It will also be possible to develop methods for relating multiple patients, by mapping each patient-specific model (spatial data) to a generalized brain model that encapsulates ranges of cortical surface variation (spatial knowledge).
Patients enrolled in our initial study have epileptic foci in the cerebral cortex, requiring surgical excision of a part of the cortex that may control language function. Previous electrical stimulation studies have shown that cortical language areas seem to be distributed as discrete, approximately 1cm2 regions on the surface of the left temporal cortex in right-handed individuals, and that the distribution of these sites varies from one person to the next.48,49 It is necessary to map the location of these sites in each individual before the surgical excision in order to spare the language areas as much as possible.
For the patients included in our prototype information system, the language sites are determined by an object-naming task performed by the awake patient following temporal craniotomy. Numbered tags are placed on the cortical surface (Fig. 10, top left). The patient is shown a series of slides of common objects, while the surgeon stimulates each numbered site with a small electrical current. A site is called an essential language site if the patient is unable to name the object while the current is applied to that site. The sites are called essential because previous studies have shown that surgical disruption of these sites causes postsurgical aphasia, whereas avoidance of the sites results in no language difficulties.
The language sites mapped in this way also provide a rich source of data for testing hypotheses about language organization in the brain. In one study Ojemann et al.48 looked at 117 patients and found that the distribution of language sites varies with both sex and verbal IQ, suggesting that there may be a relationship between anatomic location and language ability. It is therefore tempting to postulate that variations in cortical surface anatomy may relate to variations in language ability, since cortical surface anatomy is also highly variable from one individual to the next. By mapping the language sites to a patient-specific 3-D anatomical model, and by combining each patient in a generalized model of the cortex, it will be possible to test these sorts of hypotheses.
Figure 11 shows our current brain map information system, as yet another instantiation of the conceptual framework shown in Figure 1. As in the anatomy information system, the brain map information system includes a spatial database, a set of authoring programs, and an end-user program. An important addition in this case is the repository manager, which implements a Web-based multimedia database system that, when completed, will manage both brain-map authoring and brain-map retrieval via Web clients. Such an approach will be very useful for the anatomy information system as well.
Figure 11.

Brain map information system, as another instance of the conceptual framework shown in Figure 1. In this case images and other spatial data are saved in a protected “File Storage Area” of the Spatial Database, which is indexed by relational tables in the Symbolic Database. The combined data repository is managed by a Web based Repository Manager CGI package. The brain maps are created by a series of programs that are controlled by the Brain Map Creation Web client. One of these programs is Mapper, shown in Figure 10. The maps are retrieved by the Brain Map Retrieval Web client, one of whose screens is shown in Figure 12.
Brain Map Authoring
The first requirement for brain mapping is to relate the surgical sites to a patient-specific 3-D anatomic model. Our current approach is to create a 3-D surface model of the brain from MR scans taken prior to surgery, to render the surface and associated vessels, and to visually match the numbered tags seen on the photograph with the rendered image. The rendering shows cortical arteries and veins, as well as the surface anatomy, since vessels are important landmarks for the surgeon.
Given this approach, the basic problem is the same as described earlier: segmentation of anatomic structures from a volume dataset. Unlike the anatomy information system, it is not feasible to manually segment the brain for each patient, since we expect hundreds of patients to be included in the study. We also cannot use the shape-based Scanner program, since it is not ready for use. Therefore, our segmentation approach in this case is more traditional: adaptive 3-D region growing, 3-D mathematical morphology, and volume or surface rendering.50
The process is implemented in the four authoring programs shown in the second row of Figure 11. Prior to surgery, three sets of MR image volumes are acquired within an interval that is short enough for the patient to remain motionless. One set is optimized to show cortical anatomy, one to show veins, and one to show arteries. The three image sets are retrieved over the network from the radiology MR machine by Fetch. Align is then used to register and resample the three datasets within the MR machine coordinate system so that all voxels correspond and are the same size. The assumption in this case is that the patient does not move during the three sets of image acquisitions.
The cortical dataset is segmented using an interactive 3-D region growing method51 implemented in the commercial package AVS (http://www.avs.com). The 3-D region is used as a mask for volume rendering of all three datasets or, more recently, as a mask for a standard marching cubes algorithm that extracts the cortex and surface vessels as polygonal meshes.
The resulting renderings are the input to the Mapper program, a screen capture from which is shown in Figure 10. The intra-operative photo is shown in the top left, a volume rendered image in the bottom left, and corresponding MR slices in the middle. The surgeon or technician visually matches the two images, then drags numbers from a palette to locations on the rendering that correspond to the photo. Essential sites are indicated by a double click, causing a box to be drawn around the number. The resulting map is saved in the spatial database as a set of 3-D coordinates with respect to the MR machine coordinate system.
Brain Map Retrieval
The brain map authoring tools are designed to be used by only one or two people. The retrieval tool, like the anatomy atlas client, is designed so that anyone with proper authorization can access the language maps, and can relate them to other brain map databases available on the net.52
The brain map retrieval tool is an HTML form generated by a Web based repository manager (Fig. 11).9 Repository systems are becoming a popular approach to managing multimedia data,8 in which data files are saved in a protected area that is indexed by meta-data about the files. Using the terminology defined above, the protected data are stored in the spatial database, whereas the metadata are stored in the symbolic database.
For this application the symbolic database is implemented in a free (for noncommercial use) relational database called msql (http://Hughes.com.au/product/msql/) and is accessed by an msql relational database server. The relational server, as well as the files in the spatial database, are accessed and controlled by a set of perl CGI routines which together implement the repository manager. The repository manager is in turn accessed and controlled by the user via forms-based HTML documents sent to the Web client.
The repository manager is currently only partially implemented, but all the components shown in Figure 11 exist in one form or another. User interface Web forms have been developed that allow an author to enter a new patient, to transfer images and maps to the repository, and to browse the repository to retrieve relevant information. Figure 12 is one screen from the brain map retrieval Web page, showing a rendering of the extracted polygonal meshes for the cortical surface and the veins from a different patient than the one in Figure 10.
Figure 12.
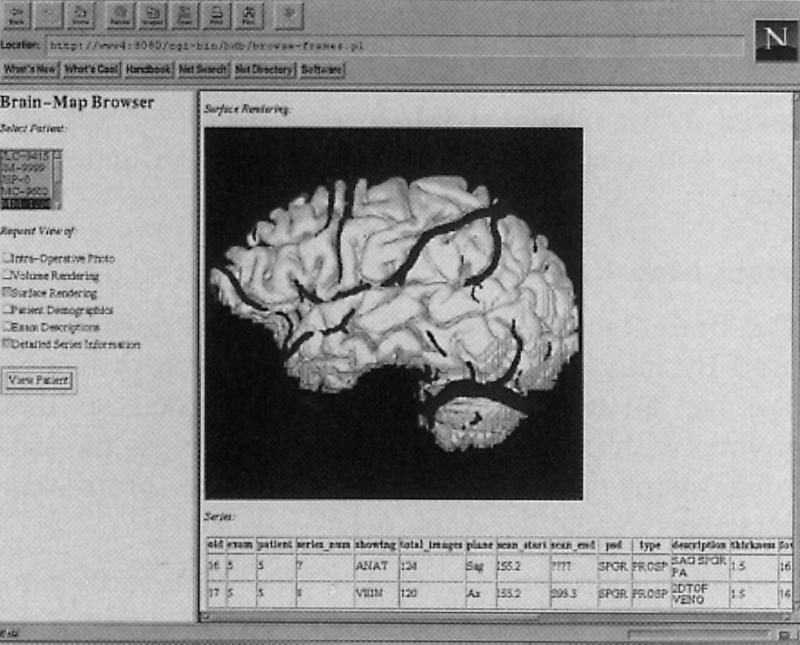
Brain Map Retrieval Web client. A Frames-based Web interface is used to display a list of patients in the left-hand frame. The user clicks to choose the patient and the list of items to be retrieved. When the “View Patient” button is pressed the repository manager formulates a query to the Msql database to retrieve the requested information, including the identifiers of image files in the spatial database. The results are packaged in the frame shown on the right, which in this case consists of a surface reconstruction with veins, and metadata about the MR image series.
The repository manager is also designed to control other programs. When these tools are complete, a separate Brain map creation Web page (top left box of Fig. 11) will allow the author to control the operation of the brain map authoring programs, calling them with the names of files retrieved from the repository, and submitting the results back to the repository. The Brain map creation Web page only controls the Fetch program.
Evaluation
A total of 12 patients have been entered into the repository to date. All were mapped by our neurosurgeon collaborator (Ojemann) and by three nonexperts in our group. Each observer had no knowledge of the results from the other observers. Repeatability analysis showed that all mapped sites (3-D location in MR machine coordinates) were located within 8 mm (2 SD) of the mean for the four observers. The surgical sites are only localized to within about 1cm2 because of the size of the stimulating electrodes. Therefore, in the absence of any other gold standard, the repeatability results show that the visual matching technique is a viable method for relating surgically-obtained language sites to a 3-D patient-specific model of the brain.
Integration and Further Work
The ability to visually map the language sites to a 3-D model is a prerequisite for other studies using the brain map information system. We are now in a position to integrate other forms of functional image data from the same patient, and to relate multiple patients. Accomplishment of these objectives will be facilitated by integrating components from other Digital Anatomist projects.
As in many areas of image processing, a major bottleneck to all our applications remains segmentation. Although the 3-D region grower works, it is not robust enough to be run by a technician. Therefore, a potential integration step is to utilize the 3-D shape-based segmentation techniques (Fig. 6) to generate the mask that is used for isosurfacing or volume rendering in Figure 10. The local coordinate system used in 3-D Scanner for brain segmentation is the Talairach system,53 which will allow us not only to initialize the 3-D radial model but also to relate 3-D language maps from one patient to another and to other language data on the network.52
Symbolic indexing of the language data will be possible once the symbolic knowledge base has been augmented by brain terminology. This terminology will be based on Neuronames, a set of terms that were developed at the UW and are now part of the UMLS.54 Since the symbolic knowledge server (Fig. 3) is already on our local Intranet, the Mapper program will be able to call on the knowledge server, in order to display cortical surface terminology and use it for labeling. Terminology, such as that described by Ono for sulcal variation,55 can also be used to symbolically classify the variations in cortical anatomy for each patient, thereby allowing correlations to be established between language site variation and variation in cortical topology.
From an information management point of view, the common integration point for the brain project is the repository manager. Although the repository manager currently is only implemented for image access by the brain map retrieval Web interface, it will evolve to handle all the spatial data generated in the process of brain map creation, and in fact the data generated for the anatomy information system as well.
As in the anatomy information system, long term progress in knowledge-based image segmentation, by ourselves or others, will allow a 3-D labeled model of the brain to be instantiated for a specific patient, thereby automatically relating patient-specific surgical language data to more general models of language function. The distributed nature of our information framework will allow these advances to be integrated as they become available.
Summary and Conclusions
In this paper we have argued that a knowledge base of anatomy is a useful means for both managing and processing medical images. We classified anatomic knowledge as both spatial and symbolic, and we described a conceptual framework for organizing and developing anatomy-based medical image processing systems.
Recognizing that both image processing and knowledge representation are difficult, we have devised an evolutionary research strategy that utilizes the network as a substrate on which to implement and integrate solutions to image processing subproblems that are driven by practical applications. The hypothesis behind this strategy is that networks of distributed software components can interact to create solutions to larger problems than each could handle on its own, and that a synergistic effect will occur as more individual components are connected.
The four individual projects we have described are all motivated by practical applications, and each has been shown to be at least partially useful in solving the problem for which it was designed. Examples of integration among project components show that a synergistic effect is emerging among the different projects. In fact we believe that all the projects are now advanced enough that we will begin to see a rapid increase in the capabilities of each one of them as additional interconnections become established.
This “biological” approach to software management and integration is possible because of the rise of the Internet and the World Wide Web. The same kinds of interconnection that we describe in this paper are occurring within most research groups and companies as they develop their own Intranets. As these Intranets become established, we can expect that groups will become more tightly connected over the Internet, not just for information retrieval as they are now, but for more actual information processing. For example, if a group develops a good 3-D image segmentation method, then the group might make that available as an image segmentation server that can be accessed by other programs at remote sites, thereby reducing the need for redundant program development, and creating a potential source of commercial revenue.
In order for such interconnections to be established, it will still be necessary to organize the resources and to develop well-defined application program interfaces. Since anatomy is the foundation of understanding in biomedicine, we believe that an anatomic knowledge base can provide the organizing framework for the distributed systems that are now possible because of the network.
Acknowledgments
This paper reviews work done by members of the Digital Anatomist Program since 1988. Other than the authors, the following individuals contributed to the work reported here, all of whom were at the University of Washington unless otherwise specified: John Sundsten, neuroanatomist, brain atlases; David Conley, gross anatomist, thoracic viscera atlas; Peter Ratiu, surgeon, knee atlas; Jeff Prothero, programmer, Skandha programs for 3-D reconstruction, Slisp, many other programs; Kraig Eno, programmer, original Mac atlas client and servers, Knowledge Manager; Roger Williams, programmer, Windows atlas client; Bill Barker, systems administrator, computer systems; Teresa Lassek, Computer Science (CS) MS student, manual image segmentation; Tanya Deriugin, programmer, neuroanatomic terminology; Michael Geist, medical student, neuroanatomic terminology and relationships; Loyd Myers, fellow, 3-D region growing and brain volume visualization; Greg Heil, fellow, brain project software tools; Scott W. Bradley, CS undergraduate, Web-based atlas and Java authoring tool; Bharath Modayur, fellow, brain segmentation and visualization; Kevin Hinshaw, CS PhD student, Scanner program for 2-D and 3-D image segmentation; Rex Jakobovits, CS PhD student, repository manager for brain project. We also thank the following collaborators: Linda Shapiro and Steve Tanimoto, CS, image segmentation and databases; Ira Kalet, Radiation Oncology, image segmentation for radiation treatment planning; David Haynor, Radiology, image segmentation; Ken Maravilla and Jay Tsuruda, Radiology, MR imaging for brain project; George Ojemann and Etorre Lettich, Neurosurgery, language mapping; Richard Martin and Douglas Bowden, Primate Center, neuroanatomic terminology; Alan Evans, Peter Neelin and David MacDnald, McGill University, brain project tools; Russ Altman, Stanford University, probabilistic and constraint-based image segmentation.
Many of our programs are implemented in a hybrid Lisp-C programming environment we call Slisp, which combines rapid prototyping with efficient execution.18 Programs implemented in Slisp include the Symbolic Knowledge Server (Fig. 3), Scanner (Figs. 5 and 6), Morpho (Fig. 7), Skandha version 4 (Fig. 7), Mapper (Fig. 10), and Align (Fig. 11).
Many of these programs are available over the Web or from our ftp site. The Web address is http://www1.biostr.washington.edu/DigitalAnatomist.html. This site contains links to our Brain Project home page, the Web-based atlases, and descriptions of our program. The anonymous ftp site is ftp://ftp.biostr.washington.edu/pub/DA. The directory DA/slisp contains Slisp programs, and DA/browser contains the Mac atlas client. The CD-ROM and videodisc versions of the atlases (which contain many more 3D animations than the on-line versions) are available from the University of Washington Health Sciences Center for Educational Resources at http://cer.hs.washington.edu/hscer/products/anatlst.htm.
This work was supported by National Library of Medicine awards R01LM04926, F37LM00017, N01LM13506, N01LM43546, National Cancer Institute award R29CA59070, Human Brain Project award R01DC/LM02310, jointly sponsored by National Library of Medicine and National Institute on Deafness and Other Communication Disorders, National Science Foundation award IRI9116809, Achievement Awards for College Scientists, the University of Washington School of Medicine IAIMS program, and equipment grants from IBM and the Murdock Foundation.
References
- 1.Brinkley JF. Structural informatics and its applications in medicine and biology. Academic Medicine, 66: 589-91, 1991. [DOI] [PubMed] [Google Scholar]
- 2.Rich E, Knight K. Artificial Intelligence. New York: McGraw-Hill, 2nd edition, 1991.
- 3.Buchanan BG. Artificial intelligence as an experimental science. In: Aspects of Artificial Intelligence, Kluwer Academic Publishers, Dordrecht, Netherlands, 1988, pp. 209-50.
- 4.Brinkley JF, Prothero JS, Prothero JW, Rosse C. A framework for the design of knowledge-based systems in structural biology. In 15th Annual Symposium on Computer Applications in Medical Care. New York: McGraw-Hill, 1989, pp. 61-5.
- 5.Rosse C, Ben Said M, Eno KR, Brinkley JF. Enhancements of anatomical information in UMLS knowledge sources. In Gardner RM (ed.): 19th Annual Symposium on Computer Applications in Medical Care. Philadelphia, Hanley & Belfus, 1996, 873-7. [PMC free article] [PubMed]
- 6.Ackerman MJ. The Visible Human Project. Journal of Bio-communication. 18: 14, 1991. [PubMed] [Google Scholar]
- 7.Gilbert BK, Robb RA, Krueger LM. Ultra high-speed reconstruction processors for x-ray computed tomography of the heart and circulation. In M. Onoe, K. Preston, and A. Rosenfeld, editors: Real-time Medical Image Processing, New York, Plenum Press, 1980, pp. 23-40.
- 8.Bernstein PA, Dayal U. An overview of repository technology. In Proceedings of the 20th VLDB Conference, Santiago, Chile, 1994.
- 9.Jakobovits RM, Modayur B, Brinkley JF. A web-based repository manager for brain mapping data. In Proceedings, AMIA Fall Symposium. Philadelphia, Hanley & Belfus, 1996, pp. 309-13. [PMC free article] [PubMed]
- 10.Zink S, Jaffe CC. Medical imaging databases: a National Institutes of Health workshop. Investigative Radiology, 28: 366-72, 1993. [DOI] [PubMed] [Google Scholar]
- 11.Gong L, Kulikowski CA. Composition of image analysis processes through object-centered hierarchical planning. IEEE Trans. on Pattern Analysis and Machine Intelligence, 17(10): 997-1009, 1995. [Google Scholar]
- 12.Mazziotta JC, Toga AW, Evans AC, Fox PT, Lancaster JL. Digital brain atlases. Trends in Neurosciences, 18: 210-1, 1995. [DOI] [PubMed] [Google Scholar]
- 13.Lindberg DAB, Humphreys BL, McCray AT. The Unified Medical Language System. Methods of Information in Medicine, 32: 281-91, 1993. [DOI] [PMC free article] [PubMed] [Google Scholar]
- 14.Musen MA. Overcoming the limitations of role-limiting methods. Knowledge Acquisition, 4: 163-8, 1992. [Google Scholar]
- 15.Gruber TR. A translation approach to portable ontology specifications. Knowledge Acquisition, 5: 199-220, 1993. [Google Scholar]
- 16.Heijst G, Falasconi S, Abu-Hanna A, Schreiber G, Stefanelli M. A case study in ontology library construction. Artificial Intelligence in Medicine, 7: 227-55, 1995. [DOI] [PubMed] [Google Scholar]
- 17.Tu SW, Eriksson H, Gennari JH, Shahar Y, Musen MA. Ontology-based configuration of problem-solving methods and generation of knowledge-acquisition tools: application of Protege-II to protocol-based decision support. Artificial Intelligence in Medicine, 7: 257-89, 1995. [DOI] [PubMed] [Google Scholar]
- 18.Brinkley JF, Prothero JS. Slisp: A flexible software toolkit for hybrid, embedded and distributed applications. Software—Practice and Experience, 27: 33-48, 1977. [Google Scholar]
- 19.Evans AC, Collins DL, Neelin P, Marrett S. Warping of a computerized 3-D atlas to match brain image volumes for quantitative neuroanatomical and functional analysis. In SPIE Vol. 1445 Image Processing. San Jose, California, Feb 27-March 1, 1991. SPIE, pp. 236-46.
- 20.Christensen GE, Rabbitt RD, Miller MI. 3-D brain mapping using a deformable neuroanatomy. Physics in Medicine and Biology, 39: 609-18, 1994. [DOI] [PubMed] [Google Scholar]
- 21.Gee JC, Reivich M, Bajcsy R. Elastically deforming 3-D atlas to match anatomical brain images. J Computer Assisted Tomography, 17: 225-36, 1993. [DOI] [PubMed] [Google Scholar]
- 22.Altman RB. Exclusion methods for the determination of protein structure from experimental data. PhD thesis, Stanford University Departments of Computer Science and Medicine, 1990. Technical Report STAN-CS-90-1306.
- 23.Brinkley JF, Altman RB, Duncan BS, Buchanan BG, Jardetzky O. Heuristic refinement method for the derivation of protein solution structures: validation on cytochrome b562. J Chem Inf Comput Sci. 28: 194-210, 1988. [DOI] [PubMed] [Google Scholar]
- 24.Brinkley JF. Hierarchical geometric constraint networks as a representation for spatial structural knowledge. In 16th Annual Symposium on Computer Applications in Medical Care, pp. 140-4. SCAMC, November 8-12, 1992. [PMC free article] [PubMed]
- 25.Brinkley JF. A flexible, generic model for anatomic shape: application to interactive two-dimensional medical image segmentation and matching. Computers and Biomedical Research, 26: 121-42, 1993. [DOI] [PubMed] [Google Scholar]
- 26.Hinshaw KP, Altman RB, Brinkley JF. Shape-based models for interactive segmentation of medical images. In SPIE Medical Imaging 1995: Image Processing, pp. 771-80, San Diego, Feb 26-March 2, 1995.
- 27.Hinshaw KP, Brinkley JF. Shape-based interactive three-dimensional medical image segmentation. In SPIE Medical Imaging: Image Processing, Newport Beach, CA, February 1997, in press.
- 28.Brinkley JF. Knowledge-driven ultrasonic three-dimensional organ modelling. PAMI, PAMI-7:431-41, 1985. Also available as Stanford Technical Report KSL-85-33. [DOI] [PubMed]
- 29.Altman RB, Brinkley JF. Probabilistic constraint satisfaction with structural models: application to organ modelling by radial contours. In 17th Symposium on Computer Applications in Medical Care, pp. 492-7, Washington, DC, Oct 31-Nov 3, 1993, AMIA. [PMC free article] [PubMed]
- 30.Eno K, Sundsten JW, Brinkley JF. A multimedia anatomy browser incorporating a knowledge base and 3-D images. In Symposium on Computer Applications in Medical Care, pp. 727-31, 1991. [PMC free article] [PubMed]
- 31.Brinkley JF, Eno K, Sundsten JW. Knowledge-based client-server approach to structural information retrieval: the digital anatomist browser. Computer Methods and Programs in Biomedicine, 40: 131-45, 1993. [DOI] [PubMed] [Google Scholar]
- 32.Bradley SW, Rosse C, Brinkley JF. Web-based access to an online atlas of anatomy: the Digital Anatomist common gateway interface. In 19th Symposium on Computer Applications in Medical Care, pp. 512-6, New Orleans, Oct. 30-Nov. 1, 1995. [PMC free article] [PubMed]
- 33.Prothero JS, Prothero JW. A software package in C for interactive 3d reconstruction and display of anatomical objects from serial section data. In NCGA Proceedings, pp. 187-92, 1989.
- 34.Carlson B. A jolt of Java could shake up the computing community. IEEE Computer, 28: 81-2, 1995. [Google Scholar]
- 35.Brinkley JF, Eno KR, Bradley SW, Sundsten JW, Rosse C. On-line information systems in anatomy: the Digital Anatomist interactive atlases, submitted 1997.
- 36.Dailey DJ, Eno KE, Zick GL, Brinkley JF. A network model for wide area access to structural information. In 17th Symposium on Computer Applications in Medical Care, pp. 497-501. SCAMC, 1993. [PMC free article] [PubMed]
- 37.Dailey DJ, Eno K, Brinkley JF. Performance evaluation of a distance learning program. In Proceedings, 18th Annual Symposium on Computer Applications in Medical Care, pp. 76-80, Washington, DC, 1994. [PMC free article] [PubMed]
- 38.Dailey DJ, Brinkley JF. A metric for quantifying response time in a browser application. IEE Trans. Systems, Man and Cybernetics, Part A (Systems and Humans), 26: 271-5, 1996. [Google Scholar]
- 39.Sundsten JW, Kastella KG. Human brain animations. Available from University of Washington Health Sciences Center for Educational Resources, 1992. Videodisc.
- 40.Sundsten JW. Interactive atlas of the brain. Available from University of Washington Health Sciences Center for Educational Resources, 1994. CD-ROM.
- 41.Conley D, Rosse C. Interactive atlas of thoracic viscera. Available from University of Washington Health Services Center for Educational Resources, 1994. CD-ROM.
- 42.Conley D, Rosse C. Animations of thoracic viscera. Available from University of Washington Health Sciences Center for Educational Resources, 1994. Videodisc.
- 43.Ratiu P, Rosse C. Animations of knee anatomy. Available from University of Washington Health Sciences Center for Educational Resources, 1994. CD-ROM.
- 44.Brinkley JF, Myers LM, Prothero JS, et al. A structural information framework for brain mapping. Progress in Neuroinformatics. Koslow SH and Huerta MF, eds., Lawrence Erlbaum, in press, 1997.
- 45.Huerta MF, Koslow SH, Leshner AI. The Human Brain Project: An international resource. Trends in Neurosciences, 16: 436-8, 1993. [DOI] [PubMed] [Google Scholar]
- 46.Demonet JF, Wise R, Frackowiak RSJ. Language functions explored in normal subjects by positron emission topography: A critical review. Human Brain Mapping, 1: 39-47, 1993. [Google Scholar]
- 47.Desmond JE, Sum JM, Wagner AD et al. Functional MRI measurement of language lateralization in Wada-tested patients. Brain, 118: 1411-9, 1995. [DOI] [PubMed] [Google Scholar]
- 48.Ojemann G, Ojemann J, Lettich E, Berger M. Cortical language localization in left, dominant hemisphere. J Neurosurgery, 71: 316-26, 1989. [DOI] [PubMed] [Google Scholar]
- 49.Haglund MM, Berger MS, Shamseldin M, Lettich E, Ojemann GA. Cortical localization of temporal lobe language sites in patients with gliomas. Neurosurgery, 34: 567-76, 1993. [DOI] [PubMed] [Google Scholar]
- 50.Modayur BR, Prothero J, Rosse C, Jakobovits R, Brinkley JF. Visualization and mapping of neurosurgical functional data onto a 3-D MR-based model of the brain surface. In Proceedings, 1996 AMIA Fall Symposium, pp. 304-8, Washington, DC, Oct 28-30, 1996. American Medical Informatics Symposium. [PMC free article] [PubMed]
- 51.Myers LM, Brinkley JF. Visualization of brain surface features using registered partially segmented MRI scans. In SPIE Medical Imaging: Image Display, pp. 43-52, San Diego, CA, Feb 26-28, 1995. SPIE.
- 52.Fox PT, Mikiten S, Davis G, Lancaster JL. Brainmap: a database of human functional brain mapping. In Functional Neuroimaging, chapter 9, pp. 95-105. San Diego, Academic Press, 1994.
- 53.Talairach J, Tournoux P. Co-planar stereotaxic atlas of the human brain. New York, Thieme Medical Publishers, 1988.
- 54.Martin RF, Dubach J, Bowden D. Neuronames: Human/macaque neuroanatomical nomenclature. In Proceedings, 14th Annual Symposium on Computer Applications in Medical Care, pp. 1018-9. American Medical Informatics Association, 1990.
- 55.Ono MS, Kubik S, Abernathy CD. Atlas of the Cerebral Sulci. New York, Thieme Medical Publishers, 1990.