Abstract
Hemodynamic shear force has been implicated as modulating Notch signaling–mediated cardiac trabeculation. Whether the spatiotemporal variations in wall shear stress (WSS) coordinate the initiation of trabeculation to influence ventricular contractile function remains unknown. Using light-sheet fluorescent microscopy, we reconstructed the 4D moving domain and applied computational fluid dynamics to quantify 4D WSS along the trabecular ridges and in the groves. In WT zebrafish, pulsatile shear stress developed along the trabecular ridges, with prominent endocardial Notch activity at 3 days after fertilization (dpf), and oscillatory shear stress developed in the trabecular grooves, with epicardial Notch activity at 4 dpf. Genetic manipulations were performed to reduce hematopoiesis and inhibit atrial contraction to lower WSS in synchrony with attenuation of oscillatory shear index (OSI) during ventricular development. γ-Secretase inhibitor of Notch intracellular domain (NICD) abrogated endocardial and epicardial Notch activity. Rescue with NICD mRNA restored Notch activity sequentially from the endocardium to trabecular grooves, which was corroborated by observed Notch-mediated cardiomyocyte proliferations on WT zebrafish trabeculae. We also demonstrated in vitro that a high OSI value correlated with upregulated endothelial Notch-related mRNA expression. In silico computation of energy dissipation further supports the role of trabeculation to preserve ventricular structure and contractile function. Thus, spatiotemporal variations in WSS coordinate trabecular organization for ventricular contractile function.
Keywords: Cardiology, Development
Keywords: Embryonic development, Heart failure
4D light-sheet fluorescence microscopy coupled with moving domain computational fluid dynamics was used to quantify spatiotemporal variations in wall sheer stress underlying trabeculation.
Introduction
Biomechanical forces intimately influence cardiac morphogenesis (1). During development, the myocardium differentiates into two layers, an outer compact zone and an inner trabeculated zone. In response to hemodynamic shear stress (2), the Notch receptor–ligand interaction is implicated in the initiation and organization of trabeculation (3, 4). Both trabeculation and compaction are essential for normal contractile function during cardiac development (5–8). A significant reduction in trabeculation is associated with ventricular compact zone deficiencies (hypoplastic wall), whereas hypertrabeculation is associated with left ventricular noncompaction cardiomyopathy (LVNCC) (9, 10). The former condition predisposes patients to heart failure with depressed ejection fraction, and the latter predisposes patients to heart failure with preserved ejection fraction and arrhythmia (11, 12). LVNCC is the third most common cardiomyopathy after dilated and hypertrophic cardiomyopathy in the pediatric population (13). Its prevalence was estimated at 4.5–26 per 10,000 adult patients referred for echocardiographic diagnosis (13, 14). During cardiac morphogenesis, the initial site of endocardial protrusion into the cavity occurs at the site of flow impingement directly opposite the atrioventricular (AV) valve, leading to elevated wall shear stress (WSS) and thus providing a mechanotransductional basis to link shear stress with trabeculation (5). Ventricular trabeculation produces a complex network of muscular ridges and grooves. Although Notch signaling activated by blood flow and cardiac contraction have been reported previously, the detailed mechanisms by which spatial and temporal variations in WSS coordinate this process are not yet known (7, 15).
Several molecular pathways for trabeculation have been found to regulate cardiomyocyte proliferation and differentiation (16–18). Mutations in Notch signaling pathways result in congenital heart defects in humans and other vertebrates (19). Using RBPJ-k and Notch1 mutants, Grego-Bessa et al. and others demonstrated that the Notch/EphrinB2/Nrg1/ErbB2 pathway initiates differentiation of trabeculation (5, 16, 17). We further demonstrated that hemodynamic shear forces mediate endocardial Notch/Nrg1/ErbB2 signaling, which promotes contractile function (7, 20).
To spatially and temporally characterize endocardial WSS during cardiac morphogenesis in this study, we integrated advanced light-sheet imaging with 4D computational fluid dynamics (CFD) to elucidate the mechanotransduction underlying the formation of trabecular ridges and grooves. We hypothesized that spatial (∂τ/∂x) and temporal variations (∂τ/∂t) in WSS modulate endocardial Notch signaling to drive formation of trabecular ridges and grooves for optimal ventricular contractile function during development. Using light-sheet fluorescence microscopy (LSFM) for rapid image acquisition and high-axial resolution, together with moving-domain CFD, we determined the hemodynamic forces across the AV valve and at the site of impingement on the opposing wall where the endocardial trabecular ridges first form in live zebrafish embryos. Results quantify the biomechanical forces underlying the initiation of trabeculation (5). 4D CFD simulations revealed pulsatile shear stress (PSS) along the trabecular ridges and oscillatory shear stress (OSS) in the grooves during trabeculation. Accompanying gain- and loss-of-function experimental analyses corroborated sequential upregulation of Notch activity from the endocardium to the trabecular grooves, resulting in cardiomyocyte proliferation. The oscillatory shear index (OSI), defined as the extent of oscillation of the direction of the WSS vector at any point on the ventricular wall during the cardiac cycle, was elevated in the trabecular grooves in association with prominent Notch activity.
Genetic manipulations to reduce endocardial WSS attenuated trabeculation and Notch activity (5, 7, 21, 22). Furthermore, our in silico simulation predicted that ventricular trabeculation promotes kinetic energy (KE) dissipation, whereas the nontrabeculated ventricle lacks KE dissipation, resulting in ventricular remodeling and contractile dysfunction. Thus, the integration of advanced light-sheet imaging with 4D computation and zebrafish genetics demonstrates that spatiotemporal variations in WSS modulate Notch activity to coordinate the initiation of trabecular ridges and grooves, with physiological implications in optimizing cardiac structure and function during cardiac development.
Results
ErbB2 signaling mediates trabeculation.
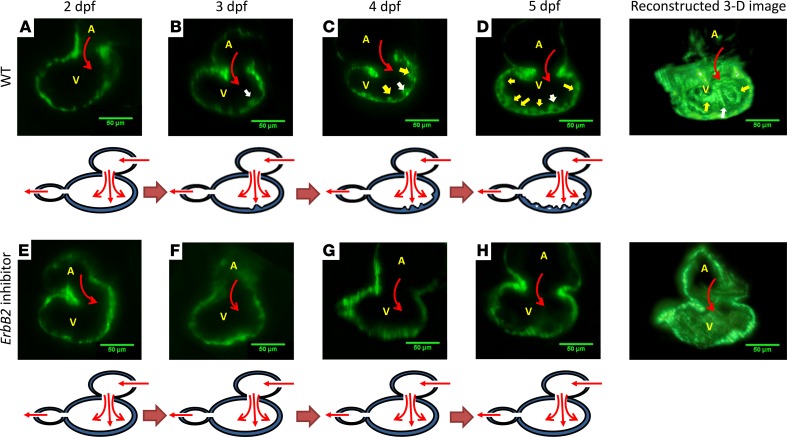
A transgenic zebrafish line, Tg(cmlc2:gfp), with the reporter transgene expressing GFP in cardiomyocytes, was used to demonstrate initiation of trabeculation. After cardiac looping from a peristaltic heart tube (23), endocardial trabeculation was initially absent (Figure 1A). At 3 days after fertilization (dpf), trabecular ridges (Figure 1B, white arrow) developed across the AV canal, where atrial contraction generated pulsatile flow that effected the site of initial trabeculation (Figure 1B, white arrow) (4). At 4 dpf, these ridges were prominent throughout the endocardium (Figure 1C) (24). At 5 dpf, they organized into an interconnected network (Figure 1D) (5). As a corollary, inhibiting ErbB2, downstream of Notch, with AG1478 inhibited the initiation of trabecular ridges from 2 dpf to 5 dpf (Figure 1, E–H). These findings indicate that myocardial ErbB2 inhibition abrogates trabeculation.
Figure 1. ErbB2-dependent trabeculation during cardiac morphogenesis.
(A) In WT zebrafish embryos, trabecular ridges were absent at 2 dpf. (B) A prominent trabecular ridge developed across the atrioventricular (AV) canal at 3 dpf. Atrial blood flow (red arrows) through the AV canal directly affected the endocardium. White arrows indicate the initial trabecular ridge. Yellow arrows indicate other trabecular ridges. (C) Additional trabecular ridges (yellow arrows) developed on both sides of the initial trabecular ridge at 4 dpf. (D) Trabeculation organized to form an interwoven network at 5 dpf. (E–H) In response to ErbB2 inhibitor (AG1478), trabeculation remained absent in the ventricular wall throughout the cardiac developmental stages. The ventricular wall thickness in response to ErbB2 inhibitor was reduced as compared with that in WT zebrafish embryos. A, atrium; V, ventricle. Scale bar: 50 μm.
Genetic manipulations alter the interplay between 4D (3D + time) WSS and Notch-mediated trabeculation.
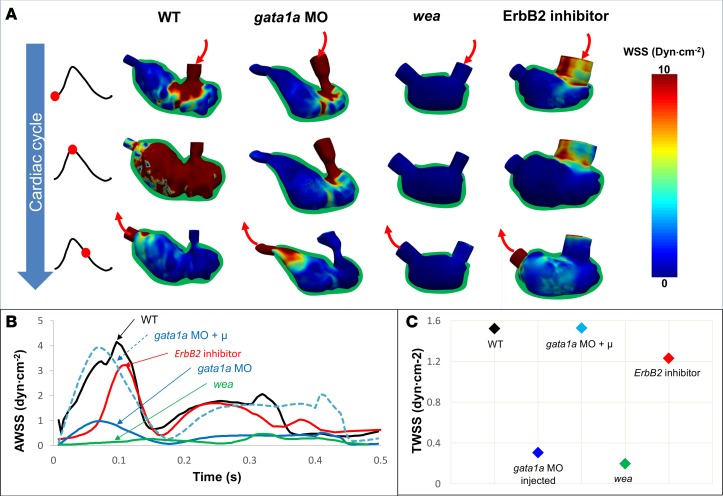
LSFM image data acquired from the transgenic Tg(cmlc2:gfp) embryos was used to perform 4D CFD simulations to quantify WSS. We reconstructed spatial and temporal variations in WSS by solving the Navier-Stokes equations governing the incompressible blood flow with an imposed moving-wall boundary condition (ventricular wall motion) implemented in an arbitrary Lagrangian-Eulerian framework (7) with linear tetrahedral elements. We applied our in-house, stabilized, second-order, finite element method–based flow solver to simulate blood flow using large-scale, multicore, high-performance computing clusters (25). We first determined the 4D WSS over the entire ventricular cavity, which we segmented from light-sheet scanning of the zebrafish ventricle (Figure 2 and Supplemental Videos 1–3; supplemental material available online with this article; https://doi.org/10.1172/jci.insight.96672DS1). 4D CFD simulations revealed that gata1a morpholino (MO) injection, which lowered blood viscosity, resulted in reduction of area-averaged WSS (AWSS) and subsequent trabeculation (n = 3 vs. WT; Figure 2A) (7, 21, 26). Using the same approach, we resimulated for gata1a MO–injected zebrafish using the viscosity of the WT zebrafish blood and compared results (27). The simulation revealed normalization to WT AWSS (Figure 2B). These simulation results support the notion that viscosity (hemodynamics) is an important contributor to initiate trabeculation (7). Furthermore, wea mutation, which inhibits atrial contraction, reduced blood flow across the AV valve, resulting in a substantial reduction in AWSS and, subsequently, a nontrabeculated ventricle (7). However, ErbB2 inhibitor treatment only slightly reduced AWSS as compared with gata1a MO and wea mutants (Figure 2B). Nonetheless, there was still a lack of trabeculae due to inhibition of ErbB2, downstream of Notch, despite conserved hemodynamic forces (5, 16) (Figure 2, A and B). Coinjection of gata1a MO with NICD mRNA rescue restored ventricular trabeculation; however, AWSS remained substantially lower (Figure 2, A and B). Quantifying WSS over one cardiac cycle, we observed that time-averaged WSS (TWSS) in gata1a MO, gata1a MO combined with NICD mRNA, and wea mutants was substantially lower compared with WT and ErbB2 inhibitor (n = 5 vs. WT and ErbB2 inhibitor) (Figure 2C). Thus, CFD simulations using 4D images of genetically modified embryos support that AWSS and TWSS were higher in trabeculated ventricles compared with nontrabeculated ventricles.
Figure 2. Time-dependent 3D computational fluid dynamics simulation of the endocardial wall shear stress.
(A) Computational fluid dynamics (CFD) simulation (3D + time) was constructed from light-sheet imaging of zebrafish embryos in response to 4 genetic manipulations: gata1a morpholino (MO), wea mutants, ErbB2 inhibitor, and coinjection of gata1a MO with NICD mRNA. The CFD simulation revealed spatial and temporal variations in ventricular wall shear stress (WSS) in synchrony with the changes in ventricular morphology during a cardiac cycle. (B) Over the entire WT embryo ventricle, averaged WSS (AWSS) was higher than that in nontrabeculated ventricles from the 3 other groups. Despite ErbB2 inhibitor treatment, AWSS was still higher in WT embryos than in those injected with gata1a MO and wea mutants. When the ventricular cavity of the gata1a MO–injected model was demarcated to simulate WSS with WT blood viscosity, the AWSS value was restored to that of WT. (C) Time-averaged WSS (TWSS) in the WT embryos was higher than that in those injected with gata1a MO (lower blood viscosity) and wea mutants (lower cardiac contractility), whereas the ErbB2-inhibited embryos developed a similar TWSS, as compared with the WT zebrafish embryos. In silico simulation to restore to the WT blood viscosity in the gata1a MO–injected embryos normalized the TWSS to that of the WT zebrafish embryos.
Spatiotemporal variations in WSS develop in trabecular ridges and grooves.
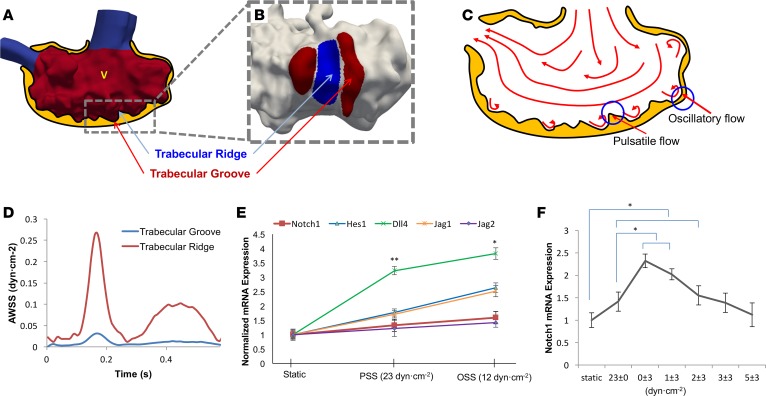
Moving domain 4D CFD simulations further demonstrated that trabecular ridges and grooves influenced the characteristics of shear stress during development (n = 3) (Figure 3, A and B). Findings from previous 4D WSS simulations (Figure 2A) indicated that myocardial contraction promoted PSS acting on the trabecular ridges, whereas flow recirculation in the trabecular grooves generated OSS at 4 dpf in WT zebrafish (Figure 3C). Time-dependent AWSS was 8.5-fold higher along the trabecular ridges than in the grooves during systole (Figure 3D).
Figure 3. Spatiotemporal variations in wall shear stress in trabecular ridges and grooves modulate Notch-related gene expression.
(A) Time-dependent 3D computational fluid dynamics (CFD) simulation revealed distinct spatial variations in ventricular wall shear stress (WSS), as highlighted in red. (B) Distinct shear stress profiles developed in the trabecular ridges versus grooves. (C) Trabecular ridges were exposed to pulsatile shear stress (PSS), while trabecular grooves were exposed to oscillatory shear stress (OSS). An elevated oscillatory shear index (OSI) developed as a result of flow trapped between the two trabecular ridges. (D) Trabecular ridges were exposed to substantially higher AWSS than trabecular grooves. This observation prompted the investigation into the initiation of trabecular ridges in response to high WSS. (E) Using a previously reported dynamic flow system (56), we demonstrated that OSS induced Notch-related mRNA expression to a greater extent than did PSS. (F) Notch1 receptor expression was highest under oscillatory shear stress (0 ± 3 dyn∙cm–2 with 0 net flow). Notch1 expression was attenuated in response to a gradual increase in net forward flow (1 ± 3, 2 ± 3, 3 ± 3, and 5 ± 3 dyn/cm2) (t test, *P < 0.05, n = 3).
With respect to WSS-coordinated trabeculation, we demonstrated that OSS upregulated endothelial Notch signaling–related mRNA expression to a greater extent than PSS in human aortic endothelial cells (Figure 3E). In addition, Notch1 mRNA expression was significantly elevated in response to OSS (0 ± 3 dyn/cm2) without a net forward flow) (Figure 3F), whereas the levels of Notch1 mRNA expression were gradually reduced in response to the incremental forward flow components (0 ± 3, 1 ± 3, 2 ± 3, 3 ± 3, and 5 ± 3 dyn/cm2). Thus, spatial (∂τ/∂x) and temporal variations (∂τ/∂t) in WSS are implicated in modulation of Notch activity in the trabecular ridges and grooves; OSS without net forward flow significantly induced Notch-related genes.
WSS mediates sequential Notch activity from endocardium to trabecular grooves.
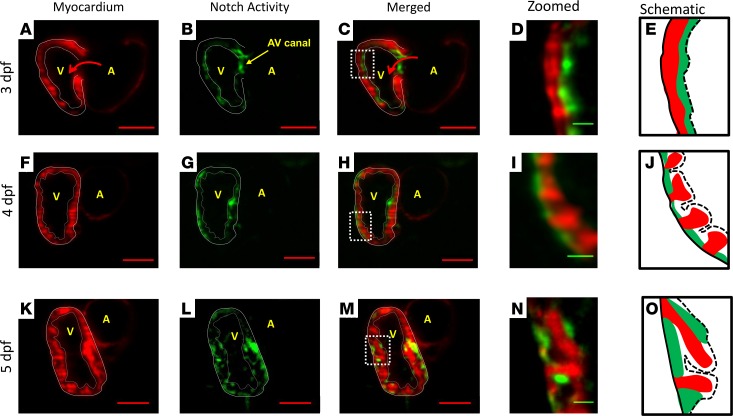
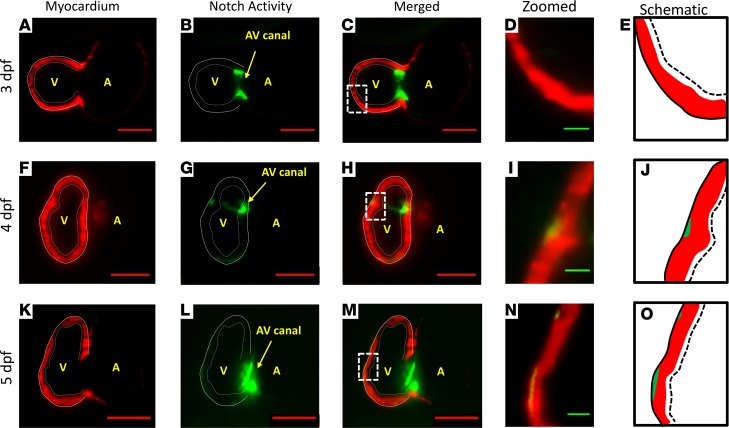
Using our rapid LSFM imaging with high-axial resolution, we captured sequential Notch activity (GFP) from endocardium to trabecular grooves in the transgenic Tg(tp-1:gfp;cmlc:mCherry) line. At 3 dpf, Notch activity was prominent in the endocardial layer and AV canal (Figure 4, A–E, and Supplemental Figure 1, E and F). At 4 dpf, Notch activity in the grooves was interspersed with the trabecular ridges (Figure 4, F–J, and Supplemental Figure 1, G–I). As trabeculae organized to form a network, Notch activity was prominent in both the epicardium and trabecular grooves (Figure 4, K–O). Prominent Notch activity remained present in the AV canal for valve formation at 5 dpf (28). In reference to Figure 3F, OSS-mediated upregulation in Notch1-related mRNA expression is consistent with the prominent Tp-1 signal in the trabecular grooves (Figure 4, I and J). Thus, these findings suggest that flow-mediated Notch activity progressed from endocardium at 3 dpf to trabecular grooves at 4 dpf.
Figure 4. Sequential Notch activity from endocardium to trabecular grooves in the WT zebrafish embryo.
Our 4D LSFM imaging captured sequential Notch1b activation (green) from endocardium to epicardium in the transgenic Tg(Tp-1:GFP;cmlc:mcherry) line. (A–E) At 3 dpf, Notch1b activity localized to the endocardial layer and AV canal. (F–J) At 4 dpf, Notch activity located primarily in the epicardium versus in the endocardium. Epicardial Notch1b activity and trabecular ridges organized into an alternating pattern. (K–O) At 5 dpf, trabeculae developed into a network structure. Notch activity was prominent in both the endocardium and trabecular grooves. Red scale bar: 50 μm. Green scale bar: 10 μm. Dotted lines in E, J, and O indicate endocardium. Solid lines in E, J, and O indicate epicardium. n = 3.
In response to the γ-secretase inhibitor, DAPT, which was used to inhibit proteolytic release of Notch intracellular domain (NICD), endocardial TP-1 signal for Notch activity was absent at 3 dpf (Figure 5, A–E). Notch activity remained absent at 4 dpf (Figure 5, F–J). Notch activity slightly appeared at 5 dpf, while the ventricle remained nontrabeculated (Figure 5, K–O). Notch activity at the AV canal also remained prominent at 5 dpf, reminiscent of activity in WT zebrafish AV canals. These observations support endocardial Notch signaling initiation of trabeculation and subsequent Notch activity in the trabecular grooves.
Figure 5. Inhibition of Notch activity and trabeculation in response to γ-secretase inhibition.
(A–E) At 3 dpf, DAPT treatment reduced Notch activity in the endocardium, except for in the AV canal region, in the transgenic Tg(Tp-1:GFP;cmlc:mcherry) line. (F–J) At 4 dpf, Notch activity remained absent in the endocardium. A small area of Notch activity appeared in the epicardium (green arrow). (K–O) At 5 dpf, additional small areas of Notch activation appeared in the epicardium, while trabeculation remained absent. Red scale bar: 50 μm. Green scale bar: 10 μm. Dotted lines in E, J, and O indicate endocardium. Solid lines in E, J, and O indicate epicardium. n = 3.
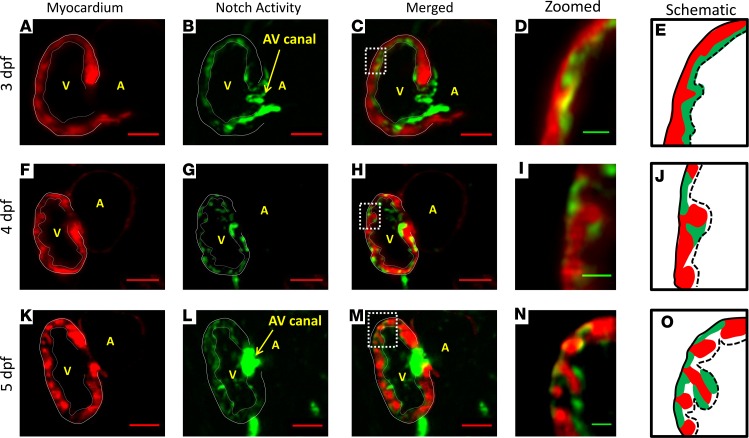
In response to NICD mRNA injection to rescue Notch activation and trabeculation in the DAPT-treated transgenic Tg(tp-1:gfp;cmlc:mcherry) embryos, TP-1 signal for Notch activity was restored in the endocardium at 3 dpf (Figure 6, A–E). Similar to that in WT zebrafish embryos, Notch activity was also restored in the trabecular grooves at 4 dpf (Figure 6, F–J). Notch activity became pronounced in the trabecular grooves and epicardium at 5 dpf (Figure 6, K–O). In addition, the TP-1 signal in the trabecular grooves (Figure 6, I and N) was reminiscent of the oscillatory flow-medicated Notch activation shown for WT zebrafish embryos in Figure 3, A–C. These findings further support spatiotemporal variations in shear stress underlying sequential upregulation of Notch activity to coordinate trabecular organization.
Figure 6. NICD mRNA injection rescued Notch activation and trabeculation in the DAPT-treated embryos.
(A–E) At 3 dpf, NICD injection rescued Notch activation in the endocardium of DAPT-treated transgenic Tg(Tp-1:GFP;cmlc:mcherry) embryos. (F–J) At 4 dpf, Notch activity appeared to be more prominent in the trabecular grooves than in the endocardium, reminiscent of that in WT embryos. (K–O) At 5 dpf, Notch activity was present in both endocardium and trabecular grooves but not in myocardium. Red scale bar: 50 μm. Green scale bar: 10 μm. Dotted lines in E, J, and O indicate endocardium. Solid lines in E, J, and O indicate epicardium. n = 5.
As a corollary, injection with NICD mRNA at the 1- to 4-cell stage in the WT zebrafish embryos induced overexpression of Tp-1 signal in the endocardium at 3 dpf, with a notably larger ventricular wall thickness compared with WT (Supplemental Figure 2A). Notch activity became prominent in both the endocardium and epicardium, with pronounced trabeculation at 4 dpf (Supplemental Figure 2B). Prominent Notch activity developed, with an accentuated trabecular network at 5 dpf, as is notable from the interconnecting bridges between the endocardium and epicardium (Supplemental Figure 2C, white arrows). Therefore, NICD mRNA injection in the WT zebrafish embryos further corroborated the role of Notch activation in promoting trabecular network formation.
FUCCI system localizes WSS-mediated cardiomyocyte proliferation in the trabecular ridges.
To localize WSS-mediated proliferating cardiomyocytes, we used the fluorescent ubiquitylation-based cell cycle indicator (FUCCI) system (29). The two transgenic lines used in the FUCCI system employed two fusion proteins, Tg(cmlc2:mCherry) and Tg(cmlc2:Venus-hGeminin)pd58, which were expressed in the myocardium and cyclically in the S/G2/M phase, respectively (29). The Venus-hGeminin signal indicated proliferating cardiomyocytes (Figure 7, green nuclei). At 4 and 5 dpf in WT zebrafish embryos, the number of proliferating cardiomyocytes was significantly higher than that in the gata1a MO–treated group (Figure 7, A–D and G, and Supplemental Videos 4 and 5). Coinjecting NICD mRNA with gata1a MO partially restored the number of proliferating cardiomyocytes at 4 dpf and 5 dpf (Figure 7, E–G, and Supplemental Video 6). Thus, the FUCCI system localized WSS-mediated cardiomyocyte proliferation in the trabecular ridges.
Figure 7. FUCCI system localized wall shear stress–mediated proliferating cardiomyocytes in the trabecular ridges.
(A and B) FUCCI system was used to visualize myocardial proliferation via a double-transgenic zebrafish line that was generated by crossing Tg(cmlc2:mCherry) fish and Tg(cmlc2:Venus-hGeminin)pd58 fish. Proliferating cardiomyocytes (green nuclei) were present at the trabecular ridges. (C and D) In response to gata1a MO, the number of proliferating cardiomyocytes was attenuated. (E and F) Coinjection of gata1a MO with NICD mRNA partially restored cardiomyocyte proliferation. (G) The graph statistically quantified the numbers of proliferating cardiomyocytes in response to gata1a MO and to NICD mRNA rescue (n = 4, t test, *P < 0.05).
Elevated OSI developed in the trabecular grooves.
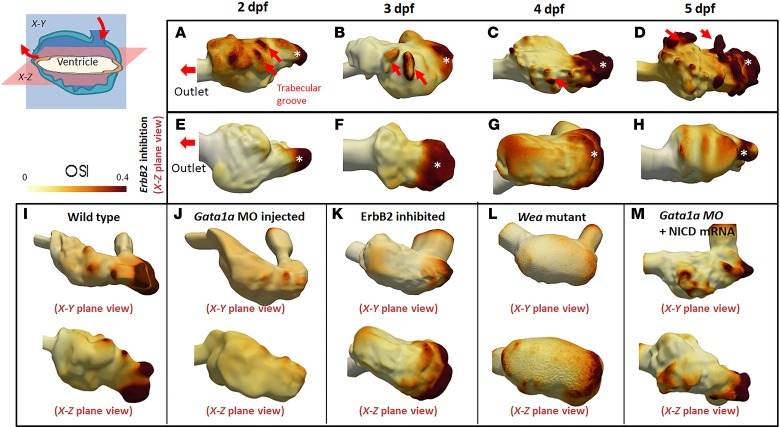
We further quantified the extent of OSS in terms of direction of the shear vector over a period of time at any point on the ventricular wall and refer to this value as OSI, which ranges from 0 to 0.5 (30). An OSI of 0 indicates a unidirectional net forward flow, whereas 0.5 reflects a 180-degree change in direction of the shear vector during the cardiac cycle. An OSI value equal to 0.5 indicates net forward flow. In Figure 3, E and F, OSS without a net forward flow (0 ± 3 dyn/cm2) significantly upregulated endothelial Notch signaling–related genes. In the trabecular grooves in the x–z plane (ventricular bottom view), CFD simulation showed high OSI values for each hemodynamic condition (n = 3) (Figure 8). At 2 and 3 dpf, prominent trabecular ridges and grooves resulted in increased OSI. At 4 and 5 dpf, formation of the complete trabecular network further elevated OSI. In response to ErbB2 inhibition, the nontrabeculated ventricle attenuated OSI, except for the regions posterior to the inlet from the atrium (n = 3) (Figure 8C, white asterisks). In both the WT and ErbB2 inhibition groups, high OSI developed in the low pressure region opposite the outflow tract and posterior to the AV canal to induce backflow (31). As a corollary, the OSI profiles were also reduced in response to both gata1a MO and wea mutation (Figure 8, J and L). Rescue with NICD mRNA injection along with gata1a MO treatment restored OSI in the trabecular grooves (Figure 8M). Therefore, we recapitulated endocardial flow recirculation in terms of changes in OSI values, and high OSI colocalized in trabecular groove where epicardial Notch was expressed during development. In accordance with our in vitro cell study (Figure 3, E and F), this supports our hypothesis that OSS activates epicardial Notch to develop trabecular grooves.
Figure 8. Elevated OSI values developed in trabecular ridges and are dependent on ventricular surface roughness; OSI revealed distinct differences in the WT versus ErbB2 inhibitor treatment and roughness of ventricular surface.
(A and B) At 2 and 3 dpf, elevated OSI values were interspersed between trabecular ridges and grooves in the WT embryos. (C and D) At 4 and 5 dpf, high OSI values associated with formation of the trabecular network. (E–G) However, ErbB2 inhibition to attenuate trabeculation abrogated the interspersed OSI at 2, 3, and 4 dpf. (H) Despite a distinct OSI in the WT embryos at 5 dpf, slight interspersion of OSI values appeared in the ErbB2-inhibited group, with consistent absence of the trabecular network. (I) High OSI values were generated in trabecular ridges at 4 dpf. (J) OSI values were substantially reduced after lowering of blood viscosity. (K) ErbB2-inhibited zebrafish showed an attenuated trabecular wall, which stymied oscillatory flow at ventricular walls. (L) Due to a lack of atrial contraction, blood flow acting on the ventricle was low. This generated minimal OSI values. (M) After coinjection of NICD mRNA and gata1a MO, OSI values were reminiscent of those of WT zebrafish due to restored trabeculation.
Trabeculation contributed to KE dissipation.
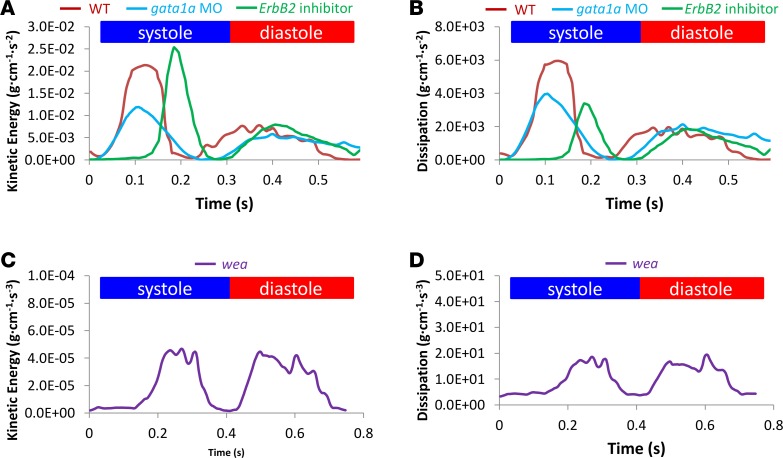
4D CFD simulations revealed that trabeculation introduces distinct AWSS profiles (Figure 3D). Next, we assessed the role of trabeculation in KE dissipation using our genetic models. In the aorta, it is well recognized that the KE of blood flow is converted into potential energy in the artery wall in the form of elastic recoil (32). In the developing ventricle, our 4D CFD simulations showed that pulsatile flow across the AV valve produces high KE, affecting the endocardium (Figure 9A and Supplemental Video 2), followed by increased KE dissipation (Figure 9B). Both inhibition of atrial contraction in the wea mutants and reduction in viscosity in the gata1a MO group reduced the KE intensity (Figure 9, A and C) and subsequently reduced KE dissipation throughout the cardiac cycle (Figure 9, B and D). Notably, the wea mutation resulted in the most profound reduction in both KE and energy dissipation (Figure 9, C and D). We previously demonstrated that the shear stress–mediated Notch/Nrg1/ErbB2 pathway contributes to the initiation of trabeculation and subsequent contractile function (7). Here, our in silico analysis further revealed the key role of trabeculation for ventricular energy dissipation.
Figure 9. Effects of trabeculation on kinetic energy and energy dissipation in the ventricle at 4 dpf.
(A) Gata1a MO injection reduced viscosity and WSS, resulting in a lower kinetic energy (KE) profile than in WT embryos during a cardiac cycle. However, the ErbB2 inhibition model, which reduces trabeculation, resulted in similarly high KE. (B) Both gata1a MO injection and ErbB2 inhibition reduced energy dissipation in the ventricle, compared with that in WT embryos. (C) Wea mutants, which lack the atrial contraction needed for initiation of trabeculation, had a profound reduction in KE. (D) Wea mutants also had a profound reduction in energy dissipation, associated with ventricular remodeling (Figure 2A).
Trabeculation influenced ventricular remodeling and cardiac strain.
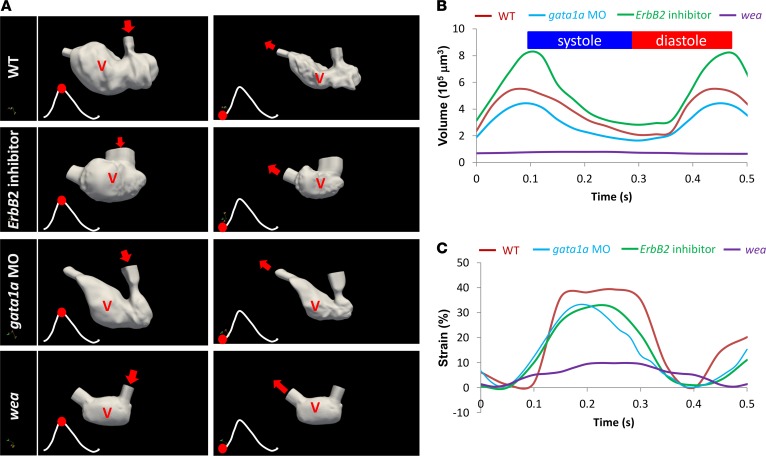
By integrating light-sheet imaging with the synchronization algorithm for the cardiac cycles (7), followed by segmentation to extract the changes in 3D ventricular morphology, we recapitulated the time-dependent changes in geometrical fluid domains in response to ErbB2 inhibition, gata1a MO, and wea mutation (7, 33–35). Registration was performed on the 4D image data using B-spline–based deformable registration methods (36), and the computed deformation field was used to morph the segmented ventricular surface to extract the period of ventricular contraction (22). We quantified the dynamic changes in ventricular volume in response to (a) AG1478 treatment to inhibit ErbB2 (n = 3), (b) gata1a MO injection to reduce viscosity (n = 3) (7, 21), and (c) the wea mutants to arrest atria contraction (n = 3) (Figure 10A) (5, 7). We compared changes in mean end-diastolic volumes (WT = 5.5 × 105 μm3; AG1478 = 8.0 × 105 μm3; gata1a MO = 4.4 × 105 μm3) and mean end-systolic volumes (WT = 2.3 × 105 μm3; AG1478 = 2.9 × 105 μm3, gata1a MO = 1.6 × 105 μm3) (Figure 10B) in relation to cardiac strain (Figure 10C). In response to the wea mutation, both systolic (0.8 × 105 μm3) and diastolic ventricular volume (0.7 × 105 μm3) remained relatively unchanged as a result of the noncontractile ventricle. Analysis of ventricular axial strain also showed reduction in contractile function in the nontrabeculated ventricle (Figure 10C). Altogether, changes in hemodynamic forces in the nontrabeculated ventricle were associated with increased end-systolic and end-diastolic volumes and reduced ventricular axial strain. These findings suggest a dual role for trabeculation to provide both enhanced contractile force and KE dissipation.
Figure 10. Genetic manipulations of trabeculation influenced ventricular remodeling and strain rates.
(A) Changes in 3D fluid domain at end diastole and systole were recaptured by light-sheet imaging and were subsequently reconstructed. The 3D ventricular contours reflect the trabeculated endocardium in the WT embryos and the nontrabeculated endocardium in the genetic models. The red dots indicate the instantaneous moment at which ventricular volume was reconstructed during the cardiac cycle. (B) Time-dependent changes in ventricular volume were compared in response to genetic manipulations. ErbB2 inhibitor–mediated attenuation in trabeculation resulted in an increase in ventricular volume, as compared with that in the WT zebrafish embryos. Gata1a MO–mediated reduction in shear stress reduced ventricular volume. Wea mutation resulted in a ventricular volume of nearly 0. (C) Genetic manipulations to inhibit trabeculation also resulted in a reduction in ventricular strain rates (P < 0.01, n = 3).
Discussion
In this study, we demonstrate the quantification of hemodynamic forces inducing trabeculation via Notch signaling during cardiac development. Using a combination of light-sheet imaging and 4D CFD, we recapitulated the initiation of trabeculation opposite to the AV valve where hemodynamic forces drive endocardial protrusion into the cardiac lumen via Notch/Nrg1/ErbB2 signaling (5, 7). Our genetically altered zebrafish models showed the role of 4D WSS in trabeculation formation. While both PSS and OSS activated endothelial Notch signaling, OSS, even without net forward flow (0 ± 3 dyn∙cm–2), induced the greatest upregulation of Notch-related genes. Using transgenic Tg(tp-1:gfp;cmlc:mcherry) embryos, our accompanying gain- and loss-of-function experiments showed sequential Notch activation from the endocardium to trabecular grooves in an alternating pattern (Figure 3C). The use of a FUCCI system further localized WSS-mediated proliferating cardiomyocytes in the trabecular ridges. Our moving domain CFD simulations further demonstrated high OSI values and increased KE dissipation in the trabeculated ventricles and low OSI values and reduced KE dissipation in the nontrabeculated ventricles; additionally, we found that the ventricle underwent remodeling and reduced contractile function (16).
We assessed whether hemodynamic forces modulate trabecular ridges and grooves as well as cardiomyocyte proliferation. We used 3 genetic manipulations: (a) microinjection of gata1a MO at the 1- to 4-cell stage to reduce hematopoiesis and subsequent viscosity by 90% (21, 26), (b) wea mutation to arrest atrial contraction, and (c) ErbB2 inhibition. These manipulations reduced both AWSS and TWSS and attenuated trabeculation at 5 dpf, leading to ventricular remodeling and reduced contraction. As demonstrated in 4D CFD simulations, our in silico input of normal blood viscosity from WT zebrafish into ventricular wall boundaries from gata1a MO–injected zebrafish returned the WSS nearly to the level of that of WT zebrafish, supporting the notion that WSS initiates trabeculation. When Notch signaling was inhibited with the γ-secretase, DAPT, the ventricular wall remained nontrabeculated, despite the presence of endocardial WSS, further supporting the role of endocardial Notch signaling in activating myocardial ErbB2 and its initiation of trabeculation.
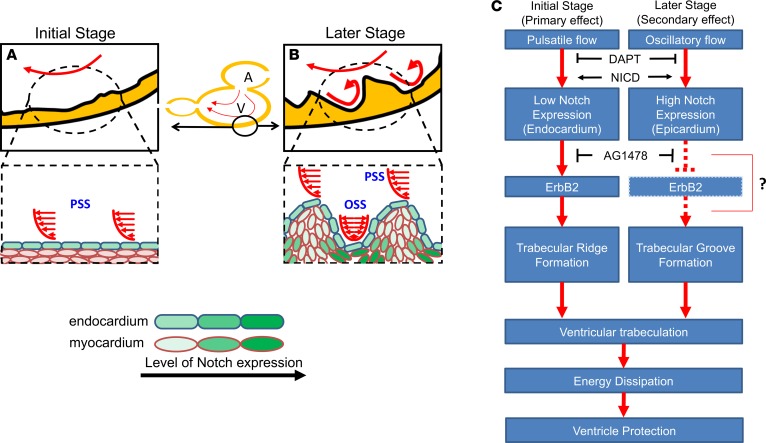
4D CFD simulations also predicted spatiotemporal variations in WSS that may coordinate formation of trabecular ridges and grooves. While PSS induces endocardial Notch to initiate trabecular ridge formation, OSS develops in the grooves to activate Notch (Figure 11, A and B). Of note, the Notch pathway is subject to many levels of regulation with both positive and negative feedback (37, 38). The precise outcome of Notch activation is often sensitive to the combination of lateral inhibition and induction, and the tissue-specific ligand (Dll1 and Dll4, Jag1, and Jag2) and receptor interactions may influence the alternating pattern of trabecular ridges and grooves during cardiac development (39, 40). For instance, Han et al. reported that the Notch ligand Jag2b inhibits neighboring ErbB2 signaling to prevent cardiomyocyte sprouting and trabeculation in the zebrafish embryos (6). We previously showed that hemodynamic shear stress induces endocardial Notch/Nrg1/ErbB2 signaling to initiate trabeculation (7). Our gain- and loss-of-function analyses further corroborated the sequential Notch activity from endocardium to trabecular grooves. These findings provide a biomechanical basis to further investigate whether PSS activates Δ-Notch “lateral induction” to initiate the ridge-like trabecular endocardium, whereas OSS induces Jag2b-Notch lateral inhibition on the neighboring ErbB2 signaling, resulting in the groove-like endocardium (Figure 11C).
Figure 11. Schematic of spatial and temporal determinants of shear stress and endocardial trabeculation.
(A) WSS activates endocardial Notch signaling. (B) The development of trabecular ridges promotes flow recirculation, yielding OSS, which, in turn, induces Notch activity in the trabecular grooves. (C) Coordination of PSS-induced endocardial Notch and OSS-mediated Notch in the grooves may organize ventricular trabeculation. While endocardial Notch activates myocardial Erbb2 expression to initiate trabecular ridge formation, Notch activity in the grooves may cause lateral inhibition of Erbb2 expression and resultant trabeculation (6). DAPT treatment inhibits NICD release, whereas NICD expression rescues Notch signaling and trabeculation. Trabeculae may serve to dissipate kinetic energy, thus preventing ventricular remodeling and dysfunction.
Our findings also support a role of trabeculation in dissipating KE of flow from atrial contraction during the early stages of cardiac development. Trabeculation is known to facilitate oxygenation and nutrient transport and to enhance cardiac contractile function (23). Lack of dissipation in nontrabeculated hearts was associated with adverse ventricular remodeling and contractile dysfunction. The concept of KE dissipation is commonly applied to hydrodynamics of dam spillway protection, where steps are designed into dam spillways to prevent structural damage from fluid forces (41, 42). Similar concepts are used to protect the lungs in mechanical respiratory systems (43). During early cardiac morphogenesis, the thin ventricular wall may not withstand the KE transfer of atrial inflow, and thus trabeculation may be desirable for ensuring enough dissipation to minimize momentum transfer to the ventricle walls. KE dissipation was reduced by almost half in nontrabeculated hearts, which are predisposed to heart failure and fetal demise (44). The KE of atrial inflow is particularly important in zebrafish, where atrial contraction (A-wave) dominates over the early passive filling of the ventricle (E-wave), as evidenced by pulsed-wave Doppler velocity measurements (Supplemental Figure 3) (45). Ultimately, the series of events, including recirculatory flow in the grooves, may confer protection from ventricular remodeling and dysfunction (Figure 11C) (6).
Nontrabeculated ventricles had reduced axial strain and ventricular remodeling (Figure 10). Axial strain and ejection fraction were also reduced by ErbB2 inhibition, whereas Nrg1 mRNA rescue restored ventricular strain and ejection fraction (7). Although ErbB2 inhibition had little effect on KE, the nontrabeculated endocardium resulted in less KE dissipation, supporting the role of trabeculation in cushioning the forces of atrial inflow.
We previously used particle image velocimetry (PIV) to validate 4D CFD code for spatiotemporally varying WSS and pressure gradients, ΔP, across the AV canal (4). Inlet boundary velocities were acquired from the Tg(gata1:dsred) transgenic zebrafish in which the movement of red blood cells (RBCs) was tracked (Mathworks). While PIV is commonly used to validate CFD, it is entirely dependent on particle movement that may be inaccurate near the wall surface (46). Furthermore, the small embryonic zebrafish poses an optical challenge. Mickoleit et al. and our laboratory have developed a rigorous method for reconstruction of zebrafish RBC movement in 3D with a high spatiotemporal system (35); however, modeling the circulating RBCs remains unresolved. Further optimization of the 4D light-sheet imaging methods may allow improved 4D volume-mapping techniques in future work (47).
In summary, by integrating advanced light-sheet imaging with in silico simulation and zebrafish genetics, we obtained insights into the role of hemodynamic forces in Notch-mediated trabeculation and demonstrated the importance of trabeculation in contractile function, KE dissipation, and cardiac morphogenesis, with relevance to human LVNCC.
Methods
Zebrafish embryos.
Zebrafish were bred and maintained at the UCLA Zebrafish Core Facility, and experiments were performed in compliance with UCLA IACUC protocols (48). Transgenic Tg(cmlc2:gfp) and Tg(;tp1:gfp;cmlc2:mCherry) zebrafish lines were used under the following conditions: (a) control (WT), (b) gata1a MO–, and (c) AG1478-treated groups (29). Gata1a MO reduced hematopoiesis and blood viscosity by 90% as previously reported (21, 26). Wea (courtesy of Deborah Yelon, UCSD, La Jolla, California, USA) were used to inhibit the development of AV gradients. FUCCI zebrafish (courtesy of Ken Poss, Duke University, Durham, North Carolina, USA) was used to visualize the number of cardiomyocyte proliferation for each condition. The two transgenic lines used in the FUCCI system were Tg(cmlc2:mCherry) and Tg(cmlc2:Venus-hGeminin)pd58. To maintain transparency of zebrafish embryos, we added 0.003% phenylthiourea in E3 medium to suppress pigment formation at 10 hours after fertilization (hpf).
4D cardiac SPIM imaging with synchronization algorithm.
We integrated our in-house 4D LSFM imaging system with postprocessing synchronization to visualize dynamic ventricular motion in the embryos (7, 35, 49, 50). By LSFM, we scanned in vivo zebrafish hearts from the rostral to the caudal end. Each section was captured with 500 xy planes (frames) with 10-ms exposure time (100 frames per second) via a sCMOS camera (Hamamatsu Photonics). The thickness of the light sheet was tuned to 5 μm to provide a high axial (z-axis) resolution for adequate reconstruction of the 4D cardiac image, and the Z-step was set to 2 μm for lossless digital sampling according to the Nyquist sampling principle (34). To synchronize with the cardiac cycle, we determined the cardiac periodicity on a frame-to-frame basis by comparing the pixel intensity from the smallest ventricular volume during peak systole to the largest volume during end diastole (33, 35). The reconstructed 4D images were processed using Amira software.
Computational modeling.
The reconstructed 4D zebrafish images were processed to extract the wall motion of a beating zebrafish ventricle. A detailed account of the computational modeling framework from zebrafish images to blood flow simulation and WSS computation was presented by Vedula et al. (22). Briefly, 3D images at mid diastole were segmented using 3D level set segmentation in SimVascular (http://www.simvascular.org) to create a triangulated surface of the ventricle. Next, to extract ventricular motion, we used an efficient nonrigid deformable B-spline–based image registration (36) with a source image (e.g., at mid-diastolic phase) registered to a target image (e.g., at end diastole) by minimizing a similarity function. A cubic B-spline transformation was used to deform the control points on the source image during registration. A Laplacian-based smoothing operator weighted by a regularization coefficient was added to the similarity function to ensure that the deformations were smooth and nonintersecting. These deformations were used to morph the initial segmented surface to extract the motion of the ventricle. A tetrahedral volume mesh was then created using TetGen (http://wias-berlin.de/software/tetgen/), an open-source meshing library that is integrated into SimVascular.
Moving domain CFD modeling.
A detailed description of the methodology used to perform moving domain CFD modeling in zebrafish embryos is provided in Lee et al. (4) and Vedula et al. (22). Briefly, the individual developmental stages were captured using the SPIM technique, and the video frames were processed using ImageJ (NIH) (4, 22). We performed image segmentation using 3D level set methods in the SimVascular open-source software at one selected cardiac phase to extract the ventricular morphology (51). The endocardial surface in direct contact with the blood was subsequently extracted as a triangulated surface. The extracted surface was further processed for segmentation-related artifacts, such as hole filling, smoothing, extrusion, and surface remeshing in MeshMixer (Autodesk Research Inc.). We then employed a nonrigid deformable image registration technique to extract the motion of the endocardial boundary (22, 52). In this approach, a source image (e.g., at end-systolic phase) was registered to a target image (e.g., at end diastole) by minimizing a similarity function. A cubic B-spline transformation was used to deform the control points on the source image during registration. A Laplacian-based smoothing operator weighted by a regularization coefficient was added to the similarity function to ensure that the deformations are smooth and nonintersecting. These computed deformations were then used to morph the initial segmented endocardium boundary, and the process was repeated sequentially on all the images spanning the cardiac cycle. Based on the wall motion determined by image registration over the cardiac cycle, the triangulated mesh was then deformed accordingly during the CFD simulation as described below.
We modeled blood flow on moving domains as incompressible Newtonian fluid governed by Navier-Stokes equations, written in arbitrary Lagrangian-Eulerian formulation as follows:
(Equation 1)
where  and p are the fluid velocity and pressure, respectively;
  is the endocardial wall velocity; and ρ and μ are the fluid density and viscosity, respectively. We solved the above equations using an in-house parallelized finite element solver that employs stabilized linear finite elements for spatial discretization (25), the stable and second-order accurate generalized-α method for time integration, and a modified Newton-Raphson method for linearization of the governing equations (25). The solver has been thoroughly validated (4, 53) and was previously employed to simulate cardiac hemodynamics in zebrafish embryos (4) and in studies of congenital heart disease in humans (22, 54, 55). The computed velocity field was then postprocessed to extract WSS and the OSI, defined as follows:
(Equation 2)
and
(Equation 3)
where (Equation 4)
is the stress vector. We also extract the volume averaged 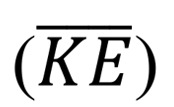 and rate of energy dissipation (
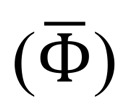 ) defined as follows:
(Equation 5)
and
(Equation 6)
where Vd is the ventricular volume and Tc is the duration of the cardiac cycle. While OSI quantifies the change in the direction of the shear vector during the cardiac cycle normalized between 0 and 0.5, the energy dissipation (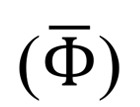 ) quantifies the rate at which the KE is being dissipated to heat due to viscosity (22).
AG1478 and DAPT treatment.
The ErbB signaling inhibitor, AG1478 (5 μM; MilliporeSigma), in 1% DMSO was diluted in E3 medium at 30 hpf. DAPT (100 μM; MilliporeSigma), a γ-secretase inhibitor, was also administered at 30 hpf.
NICD mRNA and MO injection.
Gata1a MO were resuspended in nuclease-free water and injected at 8 ng/nl at 1- to 4-cell stages. NICD mRNA at 10 ng was injected at 1- to 4-cell stages to rescue Notch signaling and to restore the trabeculation.
Preparation of NICD mRNA.
Rat NICD cDNA was amplified from donor plasmids and cloned into the plasmid pCS2+ at the BamH I/EcoR I site. Clones with the insert of interest were selected by PCR screening and validated with sequencing. mRNA was prepared using the mMessage SP6 kit (Invitrogen) following the manufacturer’s instructions. The in vitro–transcribed mRNA was purified using a total RNA isolation kit (Bio-Rad) for in vivo rescue experiments.
Confocal imaging.
The transgenic Tg(cmlc2:mCherry) and Tg(cmlc2:Venus-hGeminin)pd58 zebrafish lines were crossbred to visualize proliferating cardiomyocytes during cardiac morphogenesis. Embryonic zebrafish were randomly picked and immobilized in neutralized 0.02% tricaine solution (MilliporeSigma). After movements of the pectoral fin stopped, embryos were anesthetized and mounted in 1%–2% low-melting agarose (MilliporeSigma) on a glass coverslip to perform imaging with dual channel confocal microscopy (Leica TCS-SP8-SMD). Images of newly proliferating cardiomyocytes and the variations of the cardiac morphology were taken with 3-μm intervals in the Z-direction.
Statistics.
For statistical comparisons between two experimental conditions, unpaired 2-tailed t test was used. P values of less than 0.05 were considered significant. Comparisons of multiple mean values were performed by 1-way ANOVA, and statistical significance among multiple groups was determined using Tukey’s method.
Study approval.
Zebrafish were maintained in accordance with UCLA IACUC protocols under a project license approved by the UCLA IACUC (ARC no. 2015-055).
Author contributions
JL, JC, YD, CCC, and PF set up the light-sheet system and imaging. JL, VV, KIB, RRSP, and TKH wrote the manuscript. JL and JJH performed postimaging processing. VV and ALM performed CFD simulation. JL, KIB, YC, and RRSP performed 4D beating zebrafish heart imaging and analysis. AS assisted with linking developmental cardiac mechanics with congenital heart disease. HK and RL prepared DNA clones and in vitro–transcribed RNA. JL, HK, and KIB performed gene expression studies. JL, KIB, and HK performed in vitro experiments. JL, KIB, JC, and HK performed microinjections. CC, RL, ALM, LD, AS, and TKH designed, supervised, revised, and supported the study.
Supplementary Material
Acknowledgments
The authors would like to express gratitude to David Traver from UCSD for providing Tg(tp-1:gfp) and to Deborah Yelon from UCSD for providing the wea mutants. This study was supported by the NIH (HL118650 to TKH; HL083015 to TKH, HL111437 to TKH; and HL129727 to TKH and ALM), an American Heart Association Scientist Development Grant (16SDG30910007 to RRSP), and an American Heart Association PreDoctoral Fellowship (15PRE21400019 to JL).
Version 1. 07/12/2018
Electronic publication
Footnotes
Conflict of interest: The authors have declared that no conflict of interest exists.
Reference information: JCI Insight. 2018;3(12): e96672. https://doi.org/10.1172/jci.insight.96672.
Contributor Information
Juhyun Lee, Email: juhyunlee@ucla.edu.
Vijay Vedula, Email: vvedula@stanford.edu.
Kyung In Baek, Email: qorruddls122@g.ucla.edu.
Junjie Chen, Email: roy.chen0404@gmail.com.
Yichen Ding, Email: ycding@ucla.edu.
Chih-Chiang Chang, Email: Changc4@ucla.edu.
Hanul Kang, Email: hanullkang@gmail.com.
Peng Fei, Email: feipeng@hust.edu.cn.
Cheng-ming Chuong, Email: cmchuong@med.usc.edu.
Rongsong Li, Email: rsli65@yahoo.com.
References
- 1.Hove JR, Köster RW, Forouhar AS, Acevedo-Bolton G, Fraser SE, Gharib M. Intracardiac fluid forces are an essential epigenetic factor for embryonic cardiogenesis. Nature. 2003;421(6919):172–177. doi: 10.1038/nature01282. [DOI] [PubMed] [Google Scholar]
- 2.Wang X, Ha T. Defining single molecular forces required to activate integrin and notch signaling. Science. 2013;340(6135):991–994. doi: 10.1126/science.1231041. [DOI] [PMC free article] [PubMed] [Google Scholar]
- 3.Gordon WR, et al. Mechanical allostery: evidence for a force requirement in the proteolytic activation of Notch. Dev Cell. 2015;33(6):729–736. doi: 10.1016/j.devcel.2015.05.004. [DOI] [PMC free article] [PubMed] [Google Scholar]
- 4.Lee J, et al. Moving domain computational fluid dynamics to interface with an embryonic model of cardiac morphogenesis. PLoS ONE. 2013;8(8):e72924. doi: 10.1371/journal.pone.0072924. [DOI] [PMC free article] [PubMed] [Google Scholar]
- 5.Peshkovsky C, Totong R, Yelon D. Dependence of cardiac trabeculation on neuregulin signaling and blood flow in zebrafish. Dev Dyn. 2011;240(2):446–456. doi: 10.1002/dvdy.22526. [DOI] [PubMed] [Google Scholar]
- 6.Han P, et al. Coordinating cardiomyocyte interactions to direct ventricular chamber morphogenesis. Nature. 2016;534(7609):700–704. doi: 10.1038/nature18310. [DOI] [PMC free article] [PubMed] [Google Scholar]
- 7.Lee J, et al. 4-Dimensional light-sheet microscopy to elucidate shear stress modulation of cardiac trabeculation. J Clin Invest. 2016;126(5):1679–1690. doi: 10.1172/JCI83496. [DOI] [PMC free article] [PubMed] [Google Scholar]
- 8.Rasouli SJ, Stainier DYR. Regulation of cardiomyocyte behavior in zebrafish trabeculation by Neuregulin 2a signaling. Nat Commun. 2017;8:15281. doi: 10.1038/ncomms15281. [DOI] [PMC free article] [PubMed] [Google Scholar]
- 9.Zhang W, Chen H, Qu X, Chang CP, Shou W. Molecular mechanism of ventricular trabeculation/compaction and the pathogenesis of the left ventricular noncompaction cardiomyopathy (LVNC) Am J Med Genet C Semin Med Genet. 2013;163C(3):144–156. doi: 10.1002/ajmg.c.31369. [DOI] [PMC free article] [PubMed] [Google Scholar]
- 10.Finsterer J, Stöllberger C, Towbin JA. Left ventricular noncompaction cardiomyopathy: cardiac, neuromuscular, and genetic factors. Nat Rev Cardiol. 2017;14(4):224–237. doi: 10.1038/nrcardio.2016.207. [DOI] [PubMed] [Google Scholar]
- 11.Pignatelli RH, et al. Clinical characterization of left ventricular noncompaction in children: a relatively common form of cardiomyopathy. Circulation. 2003;108(21):2672–2678. doi: 10.1161/01.CIR.0000100664.10777.B8. [DOI] [PubMed] [Google Scholar]
- 12.Brescia ST, et al. Mortality and sudden death in pediatric left ventricular noncompaction in a tertiary referral center. Circulation. 2013;127(22):2202–2208. doi: 10.1161/CIRCULATIONAHA.113.002511. [DOI] [PubMed] [Google Scholar]
- 13.Nugent AW, et al. The epidemiology of childhood cardiomyopathy in Australia. N Engl J Med. 2003;348(17):1639–1646. doi: 10.1056/NEJMoa021737. [DOI] [PubMed] [Google Scholar]
- 14.Hoedemaekers YM, et al. The importance of genetic counseling, DNA diagnostics, and cardiologic family screening in left ventricular noncompaction cardiomyopathy. Circ Cardiovasc Genet. 2010;3(3):232–239. doi: 10.1161/CIRCGENETICS.109.903898. [DOI] [PubMed] [Google Scholar]
- 15.Samsa LA, Givens C, Tzima E, Stainier DY, Qian L, Liu J. Cardiac contraction activates endocardial Notch signaling to modulate chamber maturation in zebrafish. Development. 2015;142(23):4080–4091. doi: 10.1242/dev.125724. [DOI] [PMC free article] [PubMed] [Google Scholar]
- 16.Liu J, et al. A dual role for ErbB2 signaling in cardiac trabeculation. Development. 2010;137(22):3867–3875. doi: 10.1242/dev.053736. [DOI] [PMC free article] [PubMed] [Google Scholar]
- 17.Grego-Bessa J, et al. Notch signaling is essential for ventricular chamber development. Dev Cell. 2007;12(3):415–429. doi: 10.1016/j.devcel.2006.12.011. [DOI] [PMC free article] [PubMed] [Google Scholar]
- 18.Chen H, et al. BMP10 is essential for maintaining cardiac growth during murine cardiogenesis. Development. 2004;131(9):2219–2231. doi: 10.1242/dev.01094. [DOI] [PMC free article] [PubMed] [Google Scholar]
- 19.High FA, Epstein JA. The multifaceted role of Notch in cardiac development and disease. Nat Rev Genet. 2008;9(1):49–61. doi: 10.1038/nrg2279. [DOI] [PubMed] [Google Scholar]
- 20.Masumura T, Yamamoto K, Shimizu N, Obi S, Ando J. Shear stress increases expression of the arterial endothelial marker ephrinB2 in murine ES cells via the VEGF-Notch signaling pathways. Arterioscler Thromb Vasc Biol. 2009;29(12):2125–2131. doi: 10.1161/ATVBAHA.109.193185. [DOI] [PubMed] [Google Scholar]
- 21.Vermot J, et al. Reversing blood flows act through klf2a to ensure normal valvulogenesis in the developing heart. PLoS Biol. 2009;7(11):e1000246. doi: 10.1371/journal.pbio.1000246. [DOI] [PMC free article] [PubMed] [Google Scholar]
- 22.Vedula V, Lee J, Xu H, Kuo CJ, Hsiai TK, Marsden AL. A method to quantify mechanobiologic forces during zebrafish cardiac development using 4-D light sheet imaging and computational modeling. PLoS Comput Biol. 2017;13(10):e1005828. doi: 10.1371/journal.pcbi.1005828. [DOI] [PMC free article] [PubMed] [Google Scholar]
- 23.Hu N, Sedmera D, Yost HJ, Clark EB. Structure and function of the developing zebrafish heart. Anat Rec. 2000;260(2):148–157. doi: 10.1002/1097-0185(20001001)260:2<148::AID-AR50>3.0.CO;2-X. [DOI] [PubMed] [Google Scholar]
- 24.Liu E, et al. [Hyperconjugation, characteristic infrared absorption of methylsulfones and crystal structures of selected aromaticsulfones] Guang Pu Xue Yu Guang Pu Fen Xi. 2000;20(1):31–39. [PubMed] [Google Scholar]
- 25.Esmaily-Moghadam M, Bazilevs Y, Marsden AL. A bi-partitioned iterative algorithm for solving linear systems arising from incompressible flow problems. Comput Methods Appl Mech Eng. 2015;286:40–62. doi: 10.1016/j.cma.2014.11.033. [DOI] [Google Scholar]
- 26.Galloway JL, Wingert RA, Thisse C, Thisse B, Zon LI. Loss of gata1 but not gata2 converts erythropoiesis to myelopoiesis in zebrafish embryos. Dev Cell. 2005;8(1):109–116. doi: 10.1016/j.devcel.2004.12.001. [DOI] [PubMed] [Google Scholar]
- 27.Lee J, et al. A rapid capillary-pressure driven micro-channel to demonstrate newtonian fluid behavior of zebrafish blood at high shear rates. Sci Rep. 2017;7(1):1980. doi: 10.1038/s41598-017-02253-7. [DOI] [PMC free article] [PubMed] [Google Scholar]
- 28.D’Amato G, et al. Sequential Notch activation regulates ventricular chamber development. Nat Cell Biol. 2016;18(1):7–20. doi: 10.1038/ncb3280. [DOI] [PMC free article] [PubMed] [Google Scholar]
- 29.Choi WY, et al. In vivo monitoring of cardiomyocyte proliferation to identify chemical modifiers of heart regeneration. Development. 2013;140(3):660–666. doi: 10.1242/dev.088526. [DOI] [PMC free article] [PubMed] [Google Scholar]
- 30. Gabriel S, Ding Y, Feng Y. Extending the Oscillatory Index to Discern Oscillatory Flow Modes. Research Gate. https://www.researchgate.net/publication/313029843_Extending_the_Oscillatory_Index_to_discern_oscillatory_flow_modes Accessed May 21, 2018.
- 31. Kambe T. Elementary fluid mechanics. Singapore: World Scientific; 2007. [Google Scholar]
- 32. Hall JE. 2015. Guyton and Hall Textbook of Medical Physiology. Philadelphia, PA; Elsevier Health Sciences: 2007. [Google Scholar]
- 33.Liebling M, Forouhar AS, Gharib M, Fraser SE, Dickinson ME. Four-dimensional cardiac imaging in living embryos via postacquisition synchronization of nongated slice sequences. J Biomed Opt. 2005;10(5):054001. doi: 10.1117/1.2061567. [DOI] [PubMed] [Google Scholar]
- 34.Fei P, et al. Cardiac light-sheet fluorescent microscopy for multi-scale and rapid imaging of architecture and function. Sci Rep. 2016;6:22489. doi: 10.1038/srep22489. [DOI] [PMC free article] [PubMed] [Google Scholar]
- 35.Mickoleit M, et al. High-resolution reconstruction of the beating zebrafish heart. Nat Methods. 2014;11(9):919–922. doi: 10.1038/nmeth.3037. [DOI] [PubMed] [Google Scholar]
- 36.Myronenko A, Song X. Intensity-based image registration by minimizing residual complexity. IEEE Trans Med Imaging. 2010;29(11):1882–1891. doi: 10.1109/TMI.2010.2053043. [DOI] [PubMed] [Google Scholar]
- 37.Bray SJ. Notch signalling: a simple pathway becomes complex. Nat Rev Mol Cell Biol. 2006;7(9):678–689. doi: 10.1038/nrm2009. [DOI] [PubMed] [Google Scholar]
- 38.Kadesch T. Notch signaling: the demise of elegant simplicity. Curr Opin Genet Dev. 2004;14(5):506–512. doi: 10.1016/j.gde.2004.07.007. [DOI] [PubMed] [Google Scholar]
- 39.Petrovic J, et al. Ligand-dependent Notch signaling strength orchestrates lateral induction and lateral inhibition in the developing inner ear. Development. 2014;141(11):2313–2324. doi: 10.1242/dev.108100. [DOI] [PubMed] [Google Scholar]
- 40.Boareto M, Jolly MK, Lu M, Onuchic JN, Clementi C, Ben-Jacob E. Jagged-Delta asymmetry in Notch signaling can give rise to a Sender/Receiver hybrid phenotype. Proc Natl Acad Sci USA. 2015;112(5):E402–E409. doi: 10.1073/pnas.1416287112. [DOI] [PMC free article] [PubMed] [Google Scholar]
- 41.Gonzalez CA, Chanson H. Hydraulic design of stepped spillways and downstream energy dissipators for embankment dams. Dam Engineering. 2007;17:223–244. [Google Scholar]
- 42. Meireles I, Cabrita J, Matos J. Non-aerated skimming flow properties on stepped chutes over embankment dams. In Proceedings of the International Junior Researcher and Engineer Workshop on Hydraulic Structures (IJREWHS’06): Report CH61/06, Division of Civil Engineering, The University of Queensland, Brisbane, Australia, December 91–99. 2006. https://espace.library.uq.edu.au/data/UQ_3982/UQ3982_fulltext.pdf?Expires=1527709440&Signature=cPrNgV5HhkakHGssgpDdiStFuBiqAm2odkBzm27xjuwfcHNBzseVgoyM-CffEhlm5IbgySyIvYLHuUFusrNVyOmR96gL1aF5fIapwMbHmT3eq7kc8wE2Xog0szDGxwGa7HlvOE4t0bvPcMP2JPhe3AlWeA2bVQUnN858ZQobskQBhqbf~WZAOsth5PE~PRTOiyPjRRJsb6-ShKKAedYKnGB1i1LJ0XowiBLH6OlxhMHhOuW5Rk1ET39YUAZim89yWmGQGpxTumYoc1~oO3cdPjOXGnDoPp6YDgrFaaHA7m7tzsf4pyteuwG5nltGQnh6Rk0Tvm2Y6HBisC7Swy1RZQ__&Key-Pair-Id=APKAJKNBJ4MJBJNC6NLQ#page=111 Accessed May 29, 2018.
- 43. Serpa Neto A, Amato MB, Schultz MJ: Dissipated Energy is a Key Mediator of VILI: Rationale for Using Low Driving Pressures.In: Vincent J, ed. Annual Update in Intensive Care and Emergency Medicine 2016. Cham: Springer International Publishing;2016;311–321. [Google Scholar]
- 44.Parker SE, et al. Updated National Birth Prevalence estimates for selected birth defects in the United States, 2004-2006. Birth Defects Res Part A Clin Mol Teratol. 2010;88(12):1008–1016. doi: 10.1002/bdra.20735. [DOI] [PubMed] [Google Scholar]
- 45.Lee J, et al. Hemodynamics and ventricular function in a zebrafish model of injury and repair. Zebrafish. 2014;11(5):447–454. doi: 10.1089/zeb.2014.1016. [DOI] [PMC free article] [PubMed] [Google Scholar]
- 46.Sugii Y, Nishio S, Okamoto K, Niu L, Qian M, Wan K. Wall shear stress measurement method based on parallel flow model near vascular wall in echography. Jpn J Appl Phys. 2017;56(7S1) [Google Scholar]
- 47.Lei Y-C, et al. A vision-based hybrid particle tracking velocimetry (PTV) technique using a modified cascade correlation peak-finding method. Experiments in Fluids. 2012;53:1251–1268. doi: 10.1007/s00348-012-1357-6. [DOI] [Google Scholar]
- 48. Westerfield, M. The zebrafish book: a guide for the laboratory use of zebrafish (Danio rerio). Eugene, OR;University of Oregon Press:2000. [Google Scholar]
- 49.Liebling M, et al. Rapid three-dimensional imaging and analysis of the beating embryonic heart reveals functional changes during development. Dev Dyn. 2006;235(11):2940–2948. doi: 10.1002/dvdy.20926. [DOI] [PubMed] [Google Scholar]
- 50.Taylor JM, Girkin JM, Love GD. High-resolution 3D optical microscopy inside the beating zebrafish heart using prospective optical gating. Biomed Opt Express. 2012;3(12):3043–3053. doi: 10.1364/BOE.3.003043. [DOI] [PMC free article] [PubMed] [Google Scholar]
- 51.Updegrove A, Wilson NM, Merkow J, Lan H, Marsden AL, Shadden SC. SimVascular: an open source pipeline for cardiovascular simulation. Ann Biomed Eng. 2017;45(3):525–541. doi: 10.1007/s10439-016-1762-8. [DOI] [PMC free article] [PubMed] [Google Scholar]
- 52. Myronenko, A. Non-rigid image registration regularization, algorithms and applications. OHSU Digital Commons. https://digitalcommons.ohsu.edu/etd/370 Accessed May 21, 2018.
- 53.Arbia G, et al. Numerical blood flow simulation in surgical corrections: what do we need for an accurate analysis? J Surg Res. 2014;186(1):44–55. doi: 10.1016/j.jss.2013.07.037. [DOI] [PubMed] [Google Scholar]
- 54.Marsden AL, Esmaily-Moghadam M. Multiscale modeling of cardiovascular flows for clinical decision support. Applied Mechanics Reviews. 2015;67:030804. doi: 10.1115/1.4029909. [DOI] [Google Scholar]
- 55.Marsden AL. Simulation based planning of surgical interventions in pediatric cardiology. Phys Fluids (1994) 2013;25(10):101303. doi: 10.1063/1.4825031. [DOI] [PMC free article] [PubMed] [Google Scholar]
- 56.Hwang J, et al. Pulsatile versus oscillatory shear stress regulates NADPH oxidase subunit expression: implication for native LDL oxidation. Circ Res. 2003;93(12):1225–1232. doi: 10.1161/01.RES.0000104087.29395.66. [DOI] [PMC free article] [PubMed] [Google Scholar]
Associated Data
This section collects any data citations, data availability statements, or supplementary materials included in this article.


