

Abstract
The authors provide a survey of how images are used in radiation therapy to improve the precision of radiation therapy plans, and delivery of radiation treatment. In contrast to diagnostic radiology, where the focus is on interpretation of the images to decide if disease is present, radiation therapy quantifies the extent of the region to be treated, and relates it to the proposed treatment using a quantitative modeling system called a radiation treatment planning (RTP) system. This necessitates several requirements of image display and manipulation in radiation therapy that are not usually important in diagnosis. The images must have uniform spatial fidelity: i.e., the pixel size must be known and consistent throughout individual images, and between spatially related sets. The exact spatial relation of images in a set must be known. Radiation oncologists draw on images to define target volumes; dosimetrists use RTP systems to superimpose quantitative models of radiation beams and radiation dose distributions on the images and on the sets of organ and target contours derived from them. While this mainly uses transverse cross-sectional images, projected images are also important, both those produced by the radiation treatment simulator and the treatment machines, and so-called “digital reconstructed radiographs,” computed from spatially related sets of cross-sectional images. These requirements are not typically met by software produced for radiologists but are addressed by RTP systems. This review briefly summarizes ongoing work on software development in this area at the University of Washington Department of Radiation Oncology.
Radiation therapy is the application of ionizing radiation to the treatment of cancer and other neoplastic diseases. The basic principle is that a sufficient amount of radiation-absorbed dose will destroy all the tumor cells in the irradiated region. The arrangement of radiation beams that delivers this tumoricidal dose should be designed to do minimal damage to the surrounding normal tissue. Modern radiation treatment machines provide a lot of flexibility to tailor the arrangement to accomplish these objectives. Figure 1 shows a typical setup of a patient on the treatment table, positioned in the radiation beam by a radiation therapist. A complete (daily) treatment consists of irradiation for a brief time (1 or 2 minutes) from each of several beam directions, with possibly varying beam shapes. While the beam is on, the patient is alone in the treatment room.
Figure 1.
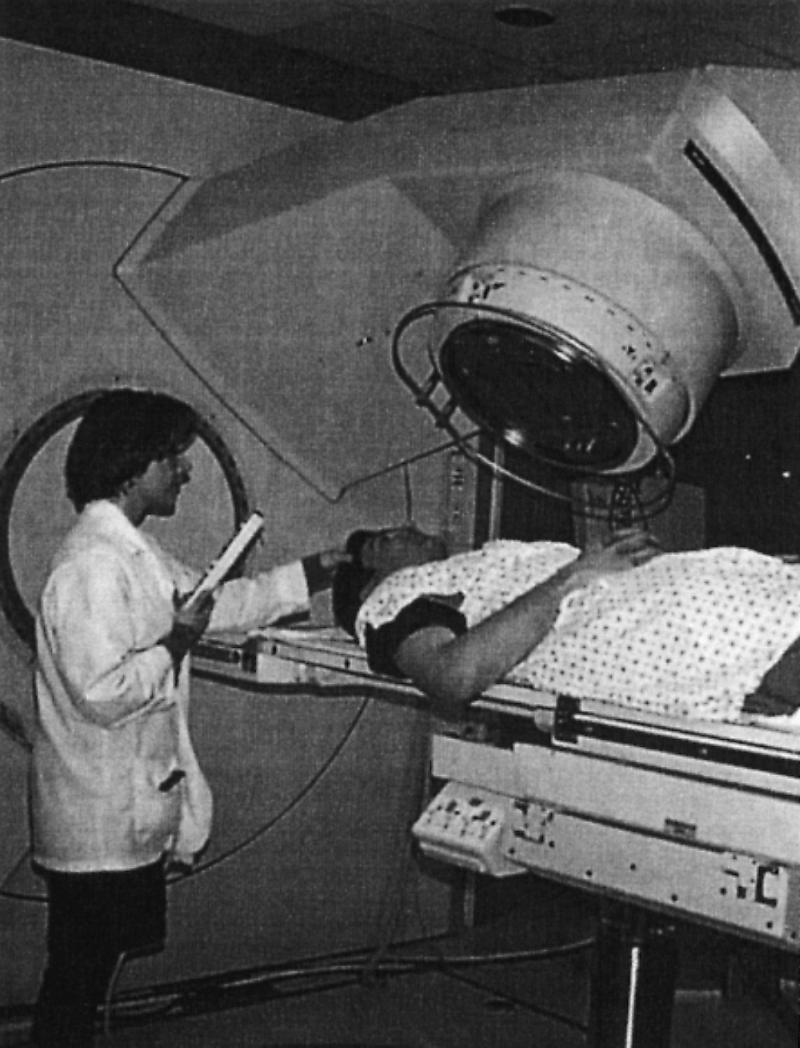
A radiation treatment machine, patient, and therapist. Once the patient and treatment machine are properly positioned, the therapist leaves the treatment room, then turns on the radiation beam, while monitoring the patient via closed-circuit television.
Radiographic images have played a vital role in planning radiation treatment since the first therapeutic use of x-rays almost 100 years ago. The most elegant aspect of radiation therapy as compared with other forms of cancer treatment is that we can precisely aim the radiation beams to maximize the radiation dose deposited in the target, relative to the dose received by other parts of the body. Imaging the tumor location is essential to being able to aim the radiation beam properly. Therefore, improvements in medical imaging have at every turn contributed significantly to improvements in radiation treatment planning and treatment technique. In this article we review radiation treatment planning and delivery, the use of images, and some specific research contributions from the University of Washington.
Although radiation therapy is a very different process from diagnosis, the same image quality is required. Two kinds of accuracy requirements guide the use of images in radiation therapy: spatial accuracy and dose accuracy. They are related because the accurate computation of dose depends on accurate spatial information about the patient's tissues, as well as their density and composition. The International Commission on Radiation Units (ICRU) has recommended1 that the dose in the volumes of interest should be known to an accuracy of 5%. More recent publications2,3 confirm this estimate. Even a small unintended omission of a part of the target volume in the treatment can lead to local treatment failure. On the other hand, overdosing a small portion of the spinal cord, for example, can cause paralysis. The dose at the edge of a radiation beam varies from 10% to 90% of the central dose, within a space of some 5 to 10 mm. It is necessary to be able to visualize the boundaries of critical organs to much better than this resolution in order to evaluate a proposed plan. In addition, the spatial location of the contours derived from the images affects the dose calculation.
The implications for images used in radiation therapy are not only that spatial resolution is important in visualizing different tissues but that the pixel size must be uniform throughout the image, and the relations between images in a set that forms a three-dimensional volume must be precise as well. High contrast is important to identify boundaries between organs (image segmentation) and to visualize the results of radiation dose calculations superimposed on the images. At the same time, flexibility in display (control of “window” and “level” parameters) using standard adjustable gray scale mapping is also important. Computer systems for radiation therapy planning expect digital image data exactly as it is available from the originating system. For CT images, this means images are 512 × 512 pixels, with 12 or more bits per pixel dynamic range. For other images similar considerations apply.
Figure 2 shows the planning process, indicating the kinds of images generated or used in each of the steps. Once the decision is made to use radiation treatment, the planning target volume (PTV) and critical organs must be defined and delineated, and the required dose determined. The PTV is the volume to be irradiated to the required dose. It is defined in a recent ICRU report4 to include either the tumor volume or the clinical target volume, together with an allowance for movement and setup variation. The next step in the radiation treatment planning process is to determine the directions from which to irradiate the target volume that will best avoid damage to the critical organs. For each direction, or radiation beam, a portal must then be defined. The portal is the cross-sectional shape of the radiation beam, which may be rectangular or irregular. Then the combined dose from all radiation beams to the entire volume of concern in the patient is computed and evaluated. The evaluation involves visualization of the dose distribution together with the anatomy as seen in images and the contour models generated in the organ and target delineation. Finally, when a satisfactory treatment plan is found, the treatment specified in the plan must be actually performed on the patient; this is usually a sequence of some 30 daily treatments, each lasting only a few minutes but requiring precise reproducible setup from day to day.
Figure 2.

The radiation treatment planning process, indicating which kinds of images are used and generated in each part of the process.
The storage space requirements, for images and other data, both long term and short term, are large, as for diagnostic image databases. Bosch and Purdy5 estimate that an archive that includes CT images, contours, and other information defining anatomy (with tumor and target volumes), treatment plans, dose distribution data, dose-volume histograms, simulator images, reprojected images from the CT data and portal images, will require about 87 megabytes (MB) per patient. A medium-sized facility will treat about 1,000 new patients per year, so this means 87 gigabytes (GB) per year. However, most of the data do not need to be retained for longer than 3 months, which brings the storage requirements within the range of ordinary inexpensive arrays of disk drives available today.
The next two sections discuss radiation treatment planning and radiation treatment delivery, respectively, in more detail, showing how images are used or computed in the various steps. It will be apparent that image data and radiation treatment plan data are generated and used in several different and independent computer systems, including embedded control systems for treatment machines. Therefore, we provide some discussion of how computer systems and software can be designed and coordinated to prevent serious mistakes and to make the treatment process more efficient. Transfer of image data among computer systems is vital, and we include a brief discussion of DICOM-3, but interested readers should refer to the already extensive literature on this subject for more detail. We conclude with some comments on the main research topics that are to be addressed in the near future.
Radiation Treatment Planning
The principal uses of images in radiation therapy planning are to precisely define the target of the radiation treatment (PTV), to define the radiation beam portals for each direction of radiation, and to evaluate a treatment plan under consideration. All of these tasks are performed with a computer simulation system known as a radiation treatment planning system, or RTP system.
The use of images in the early days of such computer systems was limited to digitizing data from radiographic films, using a sonic digitizer or other digitizing pad. This technique is still practiced today for obtaining data from images that are not yet available in digital form. When computed tomography (CT) became available, designers of RTP systems quickly added to their programs the ability to read magnetic tapes and other media containing the digital CT images, and they also added capabilities for display of the CT images on the graphic display of the RTP computer, together with other graphic information in the treatment model. At present, RTP may incorporate not only CT but magnetic resonance images (MRI), ultrasound (US), positron emission tomography (PET), and other modalities.
The basic requirements of an RTP system are as follows:
It can model the patient's body, including the soft tissue volume (enclosed by skin), internal organs relevant to the region being irradiated, the target (tumor plus allowance for other factor).
It can model the geometry and dosimetric properties of the various radiation beams in use in radiation therapy, high-energy x-rays, high-energy electron beams (and in our case at the University of Washington, fast neutron beams as well).
It can display the anatomic and radiation beam information in cross-sectional views or projected views (called “beam's eye views”), and in the cross-sectional views also display a contour map or other rendition of the levels of radiation dose throughout the area.
Many such systems have been built as research projects, and others are available as commercial products. A more detailed review of the requirements for RTP systems is given in a report from the National Cancer Institute Photon Treatment Planning Collaborative Working Group,6 and examples of some displays are given in another report of the same group.7 Figure 3 shows a typical screen display from the University of Washington RTP system, Prism.8
Figure 3.
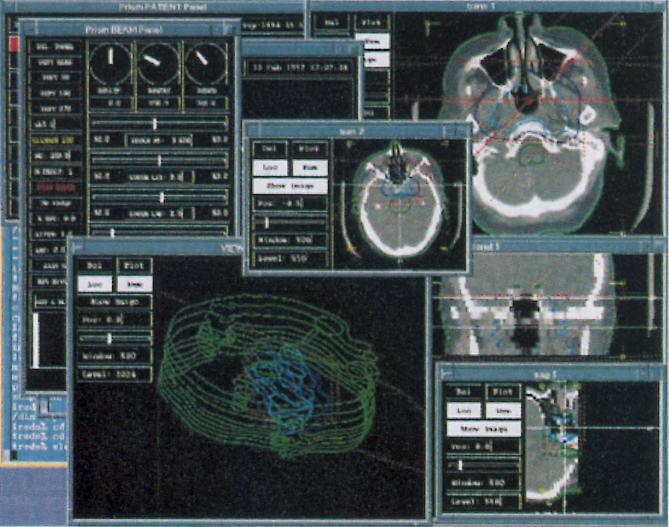
A screen display from the Prism RTP system, showing the use of transverse CT images, reformatted coronal and sagittal images, and other objects derived from them, as well as graphic representations of radiation beams.
In complex cases, the visualization and planning process is begun on the computer system using the RTP software. This does not require the patient to be present, and the RTP system can show the combined effect of multiple beams, allowing the planner to construct a more complex but possibly more effective treatment plan. When the plan geometry is relatively simple, a simulator (a diagnostic x-ray tube mounted on a gantry with the same geometry as the radiation treatment machine) is used first. Then the RTP system is used to adjust the relative contributions of each beam, select beam intensity modulation devices such as wedge filters and blocks, and optimize any other adjustable beam parameters.
Patient and Treatment Machine Coordinate Systems
In radiation therapy, all the images and modeling data must be related by common coordinate systems or by known transformations between the various coordinate systems. Each image, whether a two- or three-dimensional image, alone or as part of an image set or series, has a coordinate system associated with it. Various schemes have been proposed for specifying this coordinate system. One is the idea of providing a homogeneous transformation matrix relating the pixel coordinates to a standard coordinate system, the “patient coordinate system.”9 Another is to specify the coordinates of the image pixel origin in the patient coordinate system and then to specify two vectors whose components in the patient coordinate system define the orientation of the image by specifying the image x axis and the image y axis, respectively.10
The patient coordinate system in turn must be related to the treatment machine coordinate systems. In order to draw the radiation beams in the display, one needs to transform the outline or contour defining the beam portal to the plane of the image display. Efficient techniques exist for this11 that specialize standard definitions and transformations.12
Although it would seem that the transformations are standard and straightforward, implementing them with real image data and real patients and treatment machines requires some conventions in order to tie the data together consistently. One must choose some point in the patient's body as the patient coordinate system origin, and all the data and transformations must refer to that point.
We at the University of Washington have adopted conventions for performing CT scans and positioning patients in the treatment room to solve the problem. Our convention is based on two facts: the CT scanner is equipped with positioning lights that define the center of the scan reconstruction region (i.e., the center of the image produced by the scanner), and similarly the treatment room is equipped with laser positioning lights that define a known reference point with respect to the treatment machine, called the isocenter. The isocenter is the point about which the treatment machine gantry rotates; the couch also rotates, as does the collimator system of the treatment machine. Our convention for performing CT scans and setting up treatments ties these two coordinate systems together.
When the patient is scanned, the first image in the set is taken through the approximate location of the tumor, and the patient's skin is marked at the points—left, right, top and bottom—where the scanner lights indicate. This point, the center of the scan reconstruction circle in the first image of the set, is defined by our RTP software to be the patient coordinate system origin. When the patient is brought to the treatment room, he or she is positioned on the couch so that the treatment room lasers line up with these same four points, with no couch rotation. Then the transformation between the patient coordinate system and the machine coordinate systems is known. When the patient is positioned as specified here, the patient coordinate system origin will coincide with the isocenter of the machine. The patient can then be moved a known amount in any direction to reposition the isocenter to the required location (e.g., the center of the tumor).
Other conventions are possible and can incorporate more complex reference schemes and more flexibility in conducting the image studies, but we have found this convention sufficient for very complex treatment planning and delivery for the most difficult cases.
Organ and Target Definition
For visualization and evaluation of a treatment plan, images are used directly in a display together with the radiation beam geometry and the computed radiation dose distribution. However, it is useful to be able to render specific organs as contoured volumes or solid objects defined by surfaces. In addition to the visualization, having the solid volume defined allows us to compute dose statistics for these volumes, called dose-volume histograms (DVH).13 A DVH can summarize the probable effect of a planned treatment on a given organ if the acceptable dose limit for that organ is known. By comparing DVH plots from different treatment plans it may be possible to quantitatively determine that one is better than another, even though visually they look similar.
It is important to be able to derive from the image data sharp boundaries defining organs. This process is called image segmentation. The contoured volume models are also useful in the calculation of radiation dose from each beam, since it is easy to determine the path taken through such objects, by a radiation beam and thus compute the effect of density differences in the tissue. The main application of this is to correct for the radically lower density of lung and other (mainly) air spaces inside the body.
In radiotherapy, as in diagnosis, images are used as inputs to compute new images, other derived objects, or data. This puts requirements on the kind of information needed about images and image sets, as well as requirements on an image database system to handle many different kinds of spatially related images.
The concept of an image series, also sometimes called a position related set, is vital to radiation therapy planning. A CT study involving a series of transverse images must be done in such a way that the resulting images have a well-defined spatial relationship. In the case of most RTP systems, the image sets that are input to them may be subject to certain constraints. For example, all the images must be produced with the CT machine gantry vertically aligned (i.e., no oblique images). Also, the images must all have the same lateral and vertical couch positions or have a known translation in each of these directions. The couch translation from a known starting point also needs to be known for each image.
These requirements are all aimed at being able to derive three-dimensional object data from the image set. For example, a body contour drawn on one image should have a known relationship to the other contours so that collectively the contours can form a “contoured volume” model of the patient's body. These constraints are also necessary to facilitate the computation of coronal and sagittal (orthogonal) images from the transverse set. It is important in an RTP system to be able to visualize the body and the treatment plan in these orthogonal planes. To get reasonably smooth representations both in the reconstructed images and the contoured volume models, usually some 50 to 100 images at a few millimeters spacing (or less) is necessary. Greater spacing can produce severe artifacts in the dose calculation as well as difficulty in visualization.
Positioning is a consideration that is more critical for therapy than for diagnosis. The patient must be scanned in a position on the scanner table that comes as close as possible to the expected treatment position because the quantitative spatial data from the images will be used to position the patient in the treatment room. CT scans are commonly done with a curved padded couch, but radiation treatment is done with a flat couch. So a CT scanner that will be used for radiation therapy planning CT studies needs to be equipped with a hard, flat, couch insert that can be used when a scan is done on a radiation therapy patient. This minimizes the shifting of internal anatomy between the images used for planning and the actual patient treatment setup.
Radiation therapy extends over a period of some 30 treatments, each lasting a few minutes. During treatment there may be some organ and tumor motion. From one treatment to the next, considerable effort is made to accurately position the patient consistent with the plan, but some variation is unavoidable. Thus, to obtain images in the thoracic region for radiation therapy planning, the patient may be told to breathe quietly, rather than told to take a breath and hold it. Other positioning considerations may also be applied.
A variety of methods for image segmentation are known. The most common procedure is to provide the user with a manual interactive drawing tool as part of the RTP system software. Automated and semi-automated segmentation algorithms have also been demonstrated.14,15,16 The result may be a contour model, a volume defined by a set of pixels, or some other data structure. It may then be rendered in a variety of ways for display.
The Digital Anatomist segmentation project17 uses geometric constraint networks to model organs as generic shapes. The image data are used to refine the approximate standard model to fit the actual data. This semi-automated segmentation method has been demonstrated to work well in two dimensions, and an extension to three dimensions is in progress.
In treatment planning there is another volume delineation problem. The definition of the gross tumor volume (GTV) and planning target volumes does not lend itself easily to automated methods. The GTV is defined in ICRU Report 50 as the palpable or visible extent of the malignant tumor. This is not always easy to see on CT images, and the boundary may not correspond to a sharp contrast boundary in the images. The clinical target volume (CTV) includes the GTV and a local margin for subclinical disease. This can only be defined from knowledge of how tumor cells spread and from knowledge of the anatomy of potentially involved lymph nodes. The planning target volume (PTV) is defined either from the GTV or CTV, and it adds a margin for movements of internal tissues, variations in patient positioning, and other geometric motions or variations.
Since these definitions incorporate factors that are in no way related to the image data, automated and semi-automated segmentation methods mentioned above cannot be used. The tumor volume is usually drawn manually by a radiation oncologist on an image display, plane by plane.
In some cases, it is possible to automate the generation of the PTV if a tumor volume is already drawn. The amount of expansion from GTV or CTV to the PTV depends on clinical findings, including the tumor anatomic site or tissue of origin, pathology, planned treatment technique (e.g. use of an immobilization device like a head mask). We have developed and deployed in the routine clinical environment a software tool,18,19,20 the Planning Target Volume Tool (PTVT), which implements a model of the PTV definition cited above.4
Experience has shown that immobilization of the patient during treatment is essential in some tumor sites. Immobilization ensures setup reproducibility throughout the series of treatments and minimizes motion during treatment. As an example, in treatment of head and neck tumors, use of a mask can achieve reproducibility to within ±3 mm, while motion during treatment can be as small as ±0.5 mm. The variability of physician-drawn target volumes is described in another report.21 Use of a computer algorithm, of course, eliminates this variability and may be particularly significant in standardizing target volumes for clinical trials in radiation therapy.
In some body locations, tumors show up more clearly on magnetic resonance (MR) images than on CT images. It is desirable to be able to create the contoured volume model of the tumor on a set of MR images and to use CT images for the body and other organ contours. This requires that two sets of images be correlated so that locations in one set can be mapped to the corresponding locations in the second set. There may be a scale difference between the two studies. This is known from the image generation process. But the studies in general also may differ in orientation. To determine the orientation change from one image set to another is a challenging problem. It can be solved by using relatively rigid surfaces, such as the skull, to get a best match between the same surface defined on each of the two sets of images.22,23
Other imaging modalities are becoming important in radiotherapy: notably, positron emission tomography (PET), single photon emission computed tomography (SPECT), and ultrasound (US). They are potentially very powerful in the delineation of tumor and target volumes.24
Choice of Beam Direction
The radiotherapy simulator is a diagnostic x-ray tube mounted on a gantry whose geometry is identical to the treatment machine. These machines were in use for many years before RTP computer systems were able to provide projected views of patient anatomy. For a number of practical reasons, the simulator is still a routine part of treatment planning, along with the RTP system. The physician will use the fluoroscopic capability of the simulator to look at the overlap between target and surrounding tissue and, by trying various directions, will determine the best directions in which to aim a series of radiation beams.
Figure 4 shows a simulator film image for a patient with a cancer of the base of the tongue. This patient's treatment will be simple enough to use lateral beam directions—i.e., irradiation with two beams, one from each side of the patient. The simulator image is of diagnostic quality, also necessary here to distinguish the various structures that may overlap with the disease region for a particular beam direction. The machine collimator will be set to match the white lines, while the dark curved lines indicate areas to shield with specially made metal blocks, to protect the spinal cord on the left and the maxillary sinuses on the upper right.
Figure 4.
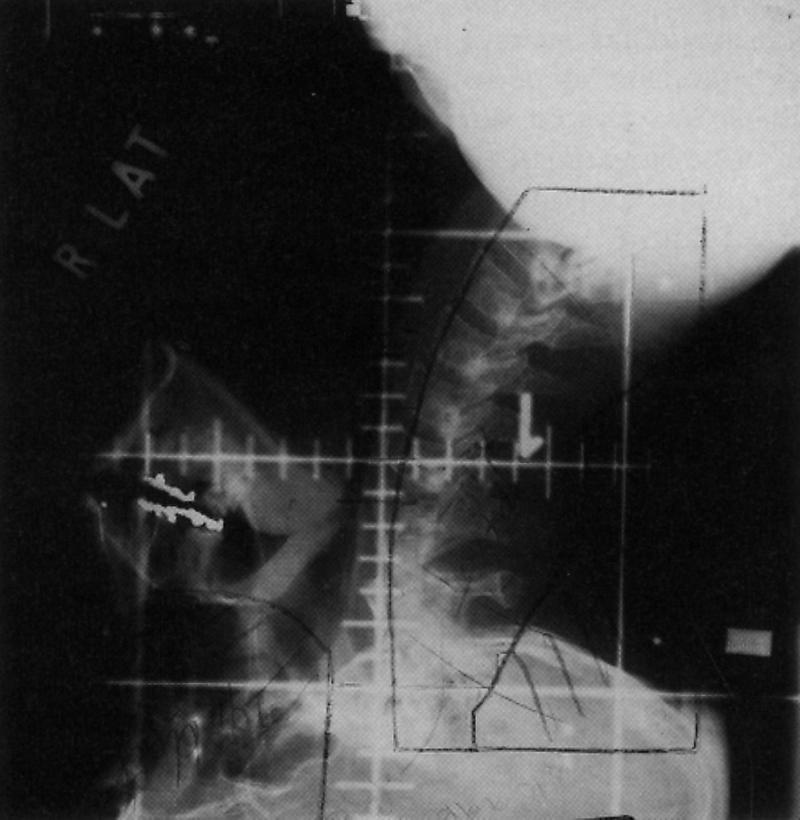
A film image taken from the simulator, a diagnostic x-ray tube mounted on a frame with the same beam geometry as a radiation treatment machine. The image shows the patient as seen by the treatment beam for the chosen position of the simulator gantry.
In more complex cases, we use a “beam's eye view,” a projected rendition of the contoured volume model of the patient's anatomy and the target volume to define each beam portal. If the target and critical organs have already been carefully delineated from the CT, this method can be accurate, fast, and convenient. Figure 5 shows a beam's eye view display for postoperative treatment of a pancreatic cancer patient. The beam portal formed by the collimator system is rectangular (in red), and there is also a shielding block (also in red) to reduce the amount of radiation that would otherwise reach the liver (dark blue). This beam direction shows a good separation between the vertebrae (light blue) and the target (yellow). The particular case shown here is atypical in that its contours are widely spaced. A more usual case will have more closely spaced contours and therefore more detail in the target model.
Figure 5.
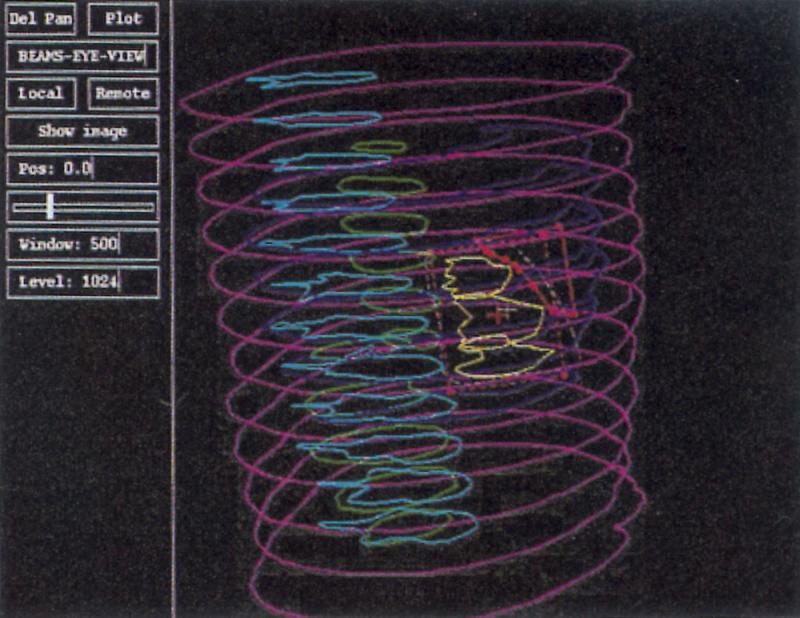
A beam's eye view of a patient, showing the beam portal and the contour model of anatomy and target. This case is atypical in that its contours are widely spaced.
Portal Definition
Once the beam directions are known, the simulator can produce images (films) of sufficient accuracy and known magnification to quantitatively delineate the beam portals for simple treatments. From Figure 4, styrofoam shapes are cut, to create a mold for making the required shielding blocks from a low melting point metal alloy. The film is also used to define the block contours in the RTP system, so that we may calculate the dose distribution from this beam.
Fluoroscopic images from the simulator imager cannot be used for these purposes because of severe pincushion and other forms of distortion in the images. The small field of view provided by these frame grabbers or digital spot imagers further contributes to making them unuseable in a radiotherapy planning system.25
Instead, we use a sonic digitizer to derive portal contours from the simulator film. It is also possible to use a film scanner to digitize the simulator film, but this is more time consuming than using the sonic digitizer and the simulator film directly.
The beam's eye view, described above, can be used to define the portal for a beam, once the direction has been determined. This is fast and simple, as it uses the same display as the determination of beam direction and the same kind of drawing tool as for drawing contours to define the organs and target.
Another method, although a very time-consuming one, is to compute an image analogous to the simulator film by ray tracing through the set of CT images. This ray tracing computation is very demanding of computer resources and is not yet in routine use. These “digitally reconstructed radiographs,” or DRRs, can be computed in a second or two on the fastest workstation computers available, but they take considerably longer on workstations more commonly used in the clinic.
Dose Computation and Evaluation
Visual evaluation of the geometry and dose distribution of a proposed radiation treatment is very important in searching for a satisfactory treatment plan. The RTP system can calculate the dose throughout the patient for any arbitrary treatment. The dosimetrist sets the directions, portals, and amounts of radiation for each of the radiation beams in a plan and then uses the display capabilities of the RTP system to evaluate that treatment plan. In the Prism system at the University of Washington it is possible to have several plans displayed simultaneously for comparative evaluation, as well as inspecting each for adequate dose levels in the target.
The most useful and widely implemented display technique for images is display of the original transverse CT or MR image data from a study, as individual images, each with adjustable grey scale (window and level). In addition, (orthogonal) reformatting of the transverse image data into sagittal and coronal images is very useful. On all the cross-sectional images, the dose distribution is shown by a contour map of isodose contours in the plane of the view. In the Prism system, as can be seen in Figure 3, all these images can be displayed simultaneously—as many or few as needed, in different sizes as needed, and positioned on the screen by the user in whatever way is convenient.
Surface rendering can also be useful, and has been demonstrated in several RTP systems.26,27 This display technique is, however, not adequate to visualize organ and tumor volumes together with three-dimensional radiation dose distributions and the radiation beam portals. We investigated a variety of ways to combine these kinds of information. The most successful is shown in Figure 6, an experimental rendering of a treatment plan for prostate cancer.27 The target volume and critical organs are shown as triangulated mesh models, and an isodose surface is shown rendered as a shaded surface. The beams are not shown. A cut plane has been defined so that only the data behind the plane are shown. This makes the data inside the isodose surface visible. We did not consider this sufficiently effective to implement it for routine clinical use. Users had difficulty identifying the objects appearing in the display. Combination of anatomic information and radiation dose information in a single three-dimensional display is still an unsolved problem.
Figure 6.
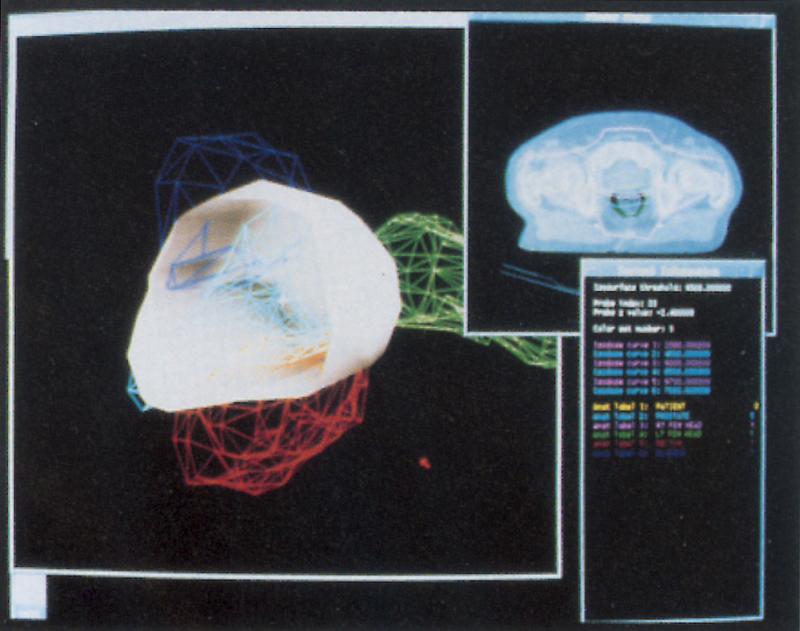
An experimental rendering of a treatment plan for prostate cancer. The target volume and critical organs are shown as triangulated mesh models, and an isodose surface is shown rendered as a shaded surface. The beams are not shown. A cut plane has been defined, so that only the data behind the plane are shown. This makes the data inside the isodose surface visible.
While some centers have demonstrated fast volume rendering, this technique does not provide the visualization needed to compare dose distributions with organs and target volumes.
Although most of the discussion has focused on external beam radiation therapy, image data are becoming important in the use of radioactive sources implanted in tissue or in body cavities. For example, prostate cancer can be treated effectively with the use of small seeds of radioactive material,28 usually iodine or palladium, surgically inserted into the tumor volume under real time ultrasound guidance. The availability of digital ultrasound images will help make this process more accurate and will help determine whether the patient is eligible for such treatments. Series of transverse ultrasound images can be used in a way similar to CT to model the target volume, compute the radiation dose from a proposed radioactive seed treatment, and display this information just as for the external beam plans.
Some radioactive seed implants are done so that the seeds form planar arrays, but the planes are not oriented in the usual orthogonal directions. In these cases it is useful to be able to display planar cross-sections through volume image data in the oblique plane formed by the array of radioactive seeds. Similarly, we use rigid applicators that position radioactive sources in oblique geometries, where it is useful to visualize the patient tissues and the dose distribution in planes corresponding to the applicator orientation. This provides an important check on whether the implant adequately covers the intended volume.
While it is possible to imagine and even efficiently implement other capabilities, such as curvilinear cuts through a volume image data set or image warping, in general these advanced image processing techniques have not yet found clinical application in radiation therapy.
An On-line Anatomy Atlas
The Digital Anatomist brain atlas project29 provides a large collection of digital images representing brain anatomy. It was originally intended to provide a teaching tool for medical students. This reference tool also includes a semantic network of anatomy knowledge and terms. The system consists of an image database, knowledge base, and server all running on one computer, and a user interface client program running on another computer, both using standard network protocols to communicate. The original client program is a Macintosh computer application designed for teaching, and it includes tutorial and testing modes.30 An updated report31 describes the evolution of the user interface to Web-based tools.
We investigated the potential use of the image data-base and knowledge base as a clinical reference tool by creating a new client user interface program to access the same information but with the presentation organized for clinical reference.32 This client program is written in Common Lisp and runs on our Unix workstation cluster, so it can be used along with the RTP system on the same screen. Figure 7 shows a sample display associated with the experimental clinical user interface. This work is continuing and is not yet a routine clinical tool.
Figure 7.
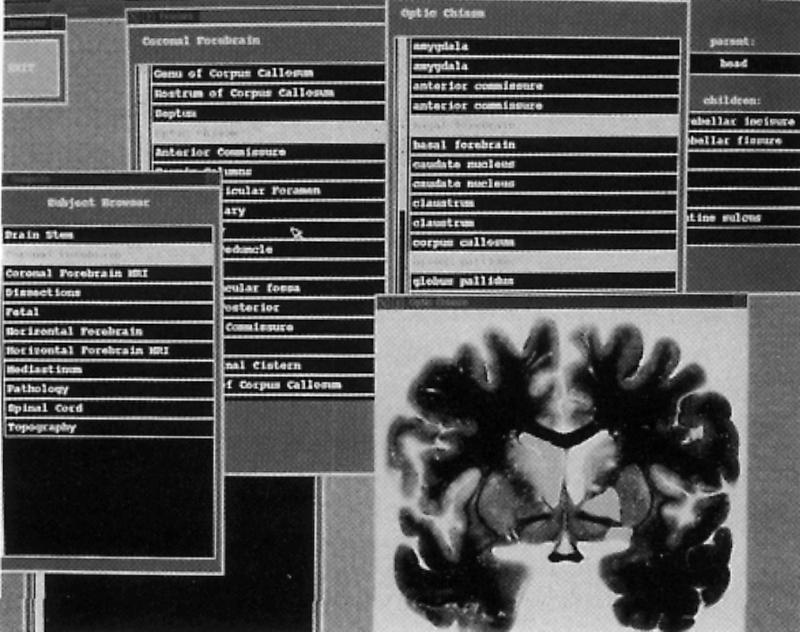
A screen display from the clinical reference client program of the Digital Anatomist system.
If the anatomy atlas can be extended to include other sites throughout the body, it will be a significant aid in estimating the clinical target volume (CTV). This involves knowing the locations of lymph nodes, which may be difficult to locate in images. The RTP system has information about the tumor site. It can determine the involved nodes by name and query the anatomy atlas to display images showing that site and the nodes highlighted. The radiation oncologist can then visually relate the atlas image to the actual patient or, if we were able to solve the mapping problem from standard anatomy to the patient anatomy, it could be automated.
Radiation Treatment Delivery
The treatment delivery process involves transfer of the setup parameters to the treatment machine, sometimes done by computer network connection33 in the case of a computer controlled treatment machine. The patient must be accurately positioned on the treatment couch. This can be verified by producing a projection image, called a port film, through the patient using the radiotherapy machine itself with the patient set up for treatment. This film is compared with the simulator film and with the hard copy graphic output of the RTP system to verify that the patient is correctly positioned for treatment. The graphic hard copy from the RTP system is a color plot on a desktop pen plotter showing the projected contours of the patient, the beam portals, and other information, all scaled to match the portal film. These can all be placed on an ordinary light box and overlaid to perform this check.
Portal images can now be obtained in digital form, but such portal imaging systems are expensive and the image quality is not sufficient to justify their routine use. The portal films have much lower contrast than the simulator films because the radiation beam energy is much higher.
The simulator films are used together with the output of the RTP system and with portal films for quantitatively verifying accurate delivery of the planned radiation treatment. Figure 8 shows a portal film image that corresponds to the simulator image shown in Figure 4.
Figure 8.
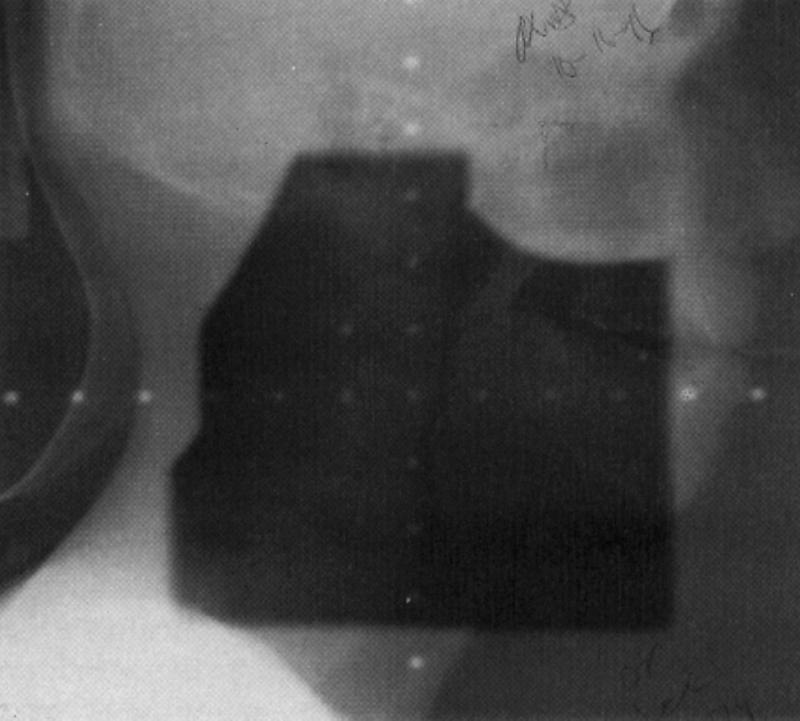
A film image taken from the radiation treatment machine itself, with the patient in the position for actual treatment. The image is low contrast because the energy of the photon beam is much higher than a diagnostic x-ray beam, thus interacting mostly by Compton effect, which does not depend on tissue composition. The image should nevertheless show the same anatomic structures and beam portal as the simulator film and the beam's eye view, so they can be superimposed to verify correct treatment setup.
In some cases, the orientation of the patient in the scanner can be closely controlled, and simple planar (two dimensional) correlation is sufficiently useful. An application of this technique has been demonstrated in the Electronic View Box.34 In the Electronic View Box, digitized images from the simulator film and the portal film may be overlaid and compared on the computer display rather than using hard copy film and plots as described above. The digitally reconstructed radiograph (DRR), a computed image “simulating” the simulator image, mentioned above, can be computed from a properly aligned set of transverse CT images. If the relation between the coordinate system of this image and the coordinate systems of the simulator and portal films is known, the DRR can also be used to analyze the accuracy of patient positioning.
Radiotherapy Software Design
Software systems for radiotherapy planning must be extendable to accommodate new features, new image modalities, new approaches to visualization, and new radiation treatment techniques. How do we build extendable systems? It is an important area of computer science research; building radiation therapy systems with their image handling components can provide a very effective testing ground for new software design ideas.35 In turn, utilizing powerful developments in computer science, rather than continuing to work with limited languages and tools, can speed development and make it possible to build more powerful systems.
Open Systems
One of the most useful design strategies for radiation therapy software is the idea of building open systems. An open system supports adding component programs or subprograms that can retrieve and manipulate data produced by other programs or program components. Similarly, in an open system, functions can be added to the system without modifying or knowing about the implementation details of the system. It should be possible to easily transfer data between systems. This contrasts with self-contained systems that provide rich user functions but whose internal workings are difficult or impossible to modify or augment. The philosophy of open systems is that the developer who builds a system will not provide everything the user ever will or could ask for. Instead, the basic system is built, and other groups may build additional components not anticipated at all by the basic system designer. This software integration problem is not unique to medical imaging but is a ubiquitous problem in the software industry, applying to documents, databases, spreadsheets, and many other kinds of data.
In order to do this, systems must be designed with interfaces that have been well thought out. These interfaces allow the components to exchange data and perhaps even invoke well defined functions. The Foundation Library idea, developed as part of the Radiotherapy Treatment Planning Tools (RTPT) project9,36 is an example of a specification for building RTP systems that conform to this idea. We created an abstract object-oriented model of radiotherapy planning and defined programming language bindings for a few basic interface functions that conform to and implement the model. An RTP system that provides these functions and language bindings can be considered an open RTP system. Such a system provides a way for programmers to add components to the system—without modifying it—by following the specification of the interface.
The Digital Anatomist segmentation project mentioned above not only addresses an interesting theoretical problem but also has potential use in the clinic. Typically, software for a project like this is built as a self-contained entity, with its own inputs and outputs, data representations, and abstract model. When the time comes to address its utility in a clinical setting, it is impossible or very difficult. The task is a subtask of a larger context, and the software must be integrated into the workflow even if only for testing and evaluation. Its performance as a standalone activity is meaningless. As an engineering experiment, we took the segmentation program and modified it to conform to the RTPT standards referred to above. The effort involved was small, and the result from the RTP system user's point of view was that the segmentation program became just another function integrated into the RTP system.
The Digital Anatomist brain atlas mentioned above is another example of an open system with a well-defined access protocol. The database is accessible through a network server program. The client program we wrote makes a telnet-like connection to the server, sends commands, and receives back images and anatomy information. The commands and data streams are defined by a protocol that is independent of the operating system, programming languages, and computer equipment. That design made it possible to do our experiments with alternate user interface clients, without making any alterations in the database or the software that supports it.
More general examples of open system design are database systems that support writing separate programs using standard libraries for the programs to query the databases and manipulate data in them. Open system design does not depend on use of a particular programming language and is not related to new or popular fads like Java.
Networks and Distributed Image Computing
In modern radiation therapy departments, it is not unusual to have many computers and many applications of those computers, along with the need to transfer data between them. All of the types of machines mentioned, including the radiation therapy simulator and the treatment machines; are now available with computer control systems. At the University of Washington, we have over 11 years' experience with network transfer of data between RTP systems and computer controlled therapy machines.33
It is now routine to have image data sources, such as CT scanners, connected to a local (or wide area) network along with the RTP computer. Image data are transferred from the CT system to the RTP system over the network. One way to do this is to use specialized hardware and software. This imposes a huge amount of unnecessary work on the developers and users of the systems. This was the initial approach of the ACR/NEMA committee on digital image interchange. A better, more rational, way is to utilize existing network standards, such as TCP/IP,37 and to transfer image files, for example, by using the ubiquitous FTP program. This still requires that the RTP system include some unpacking or reformatting program that can translate the CT manufacturer's proprietary file format into the RTP system image file format. It is still a significant amount of work, to be repeated for every different type of imaging source or sink and for each manufacturer. The ACR/NEMA committee continued its work and eventually developed a high-level model and protocol for transferring images and data about images between systems. This protocol is now known as DICOM-3.38 This standard is now widely supported and has opened up the possibility of a great range of sophisticated image processing and display applications as accessory products.
The success of DICOM has prompted the development of an extension to include radiation treatment data. A purpose of this extension is to provide a means for transferring radiation treatment machine setup data and treatment record data between RTP systems and computer controlled treatment machines. A draft is in progress, currently known as DICOMRT. As with the image components of DICOM, and the RTPT standard mentioned above, it is necessary first to create and agree on an abstract model. Once the model is specified, a network protocol can be designed that is based on the model. The development of a model is a prerequisite to designing a protocol; overlooking this step usually leads to unworkable designs.
The transition from the earlier ACR/NEMA protocols to DICOM-3 is significant in that DICOM-3 allows reliance on standard network, transport, and physical layer protocols instead of reinventing the computer network. One can now simply implement the DICOM-3 application layer. It is not only less work, but it also means that software can transparently move to higher performance environments by simply upgrading the hardware and operating system.
Discussion and Conclusions
Our experience with images in radiation therapy provides two kinds of insights: one applies to software system building, and the other to future research.
In designing image detabases that will support radiation therapy applications, one must consider that image data will be used in a modeling context in which the images must have a well-defined spatial relationship. This is in addition to the more well-known properties of image databases for use in radiology. There have been some efforts to build radiation therapy “picture archiving and communications systems” (RTPACS), as if they are conceptually different from PACS for radiology. In fact, it is our position that the same databases and network environments can be used for both if they are designed to include the additional information we discuss, and if they are designed as open systems using standard network protocols instead of specialized wiring, computer hardware, and proprietary software.
Research that is important to pursue includes the evaluation of the utility of the Digital Anatomist online atlas, with attention to the possibility of matching algorithms between standard anatomy images and actual individual patient images. The problem of combining different kinds of three-dimensional information in a single display (e.g., anatomy and dose levels) requires further investigation. The planning target volume (PTV) project also presents a challenging problem—to combine image data and qualitative knowledge about tumor biology and to automate the definition of the clinical target volume (CTV).
Acknowledgments
It is a pleasure to acknowledge useful feedback from and continuing collaboration with Dr. Jonathan Jacky. Thanks go to Sharon Hummel and Angus Templeton, who assisted with and posed for Figure 1.
This work was supported in part by grant number R01 LM04174 from the National Library of Medicine. Its contents are solely the responsibility of the authors and do not necessarily represent the official views of the sponsoring agencies.
References
- 1.International Commission on Radiation Units and Measurements. Determination of Absorbed Dose in a Patient Irradiated by Beams of X or Gamma Rays in Radiotherapy Procedures. Bethesda, MD: International Commission on Radiation Units and Measurements, 1976. Report 24.
- 2.Mijnheer BJ, Battermann JJ, Wambersie A. What degree of accuracy is required and can be achieved in photon and neutron therapy? Radiother Oncol. 1987;8: 237-52. [DOI] [PubMed] [Google Scholar]
- 3.Boyer AL, Schultheiss T. Effects of dosimetric and clinical uncertainty on complication-free local tumor control. Radiother Oncol. 1988;11: 65-71. [DOI] [PubMed] [Google Scholar]
- 4.International Commission on Radiation Units and Measurements. Prescribing, Recording and Reporting Photon Beam Therapy. Bethesda, MD: International Commission on Radiation Units and Measurements, 1993. Report 50.
- 5.Bosch WR, Purdy JA. Integrating the management of patient three-dimensional treatment planning and image data. Sem Radiation Oncol. 1997;7: 31-8. [DOI] [PubMed] [Google Scholar]
- 6.Photon Treatment Planning Collaborative Working Group. State-of-the-art of external photon beam radiation treatment planning. International Journal of Radiation Oncology, Biology and Physics. 1991;21: 9-23. [DOI] [PubMed] [Google Scholar]
- 7.Photon Treatment Planning Collaborative Working Group. Three-dimensional display in planning radiation therapy: a clinical perspective. International Journal of Radiation Oncology, Biology and Physics. 1991;21: 79-89. [DOI] [PubMed] [Google Scholar]
- 8.Kalet IJ, Jacky JP, Austin-Seymour MM, Hummel SM, Sullivan KJ, Unger JM. Prism: a new approach to radiotherapy planning software. International Journal of Radiation Oncology, Biology and Physics. 1996;36: 451-61. [DOI] [PubMed] [Google Scholar]
- 9.Jacky J, Weinhous M, Coggins J, et al. Foundation library specification and virtual machine platform (VMP) specification. Technical Report 91-1, National Cancer Institute, Radiation Research Program, 6120 Executive Boulevard, Executive Plaza North, Rockville MD 20852, 1991. Report of the Radiotherapy Treatment Planning Tools Specification Task Group.
- 10.Kalet IJ, Unger J, Jacky J. Prism system implementation, version 1.2. Technical Report 97-mm-nn, Radiation Oncology Department, University of Washington, Seattle, Washington, 1997.
- 11.Jacky JP, Kalet IJ. How to draw irregular radiation beams in 3D treatment plans. Computerized Medical Imaging and Graphics 1990;14: 97-105. [DOI] [PubMed] [Google Scholar]
- 12.Siddon RL. Solution to treatment planning problems using coordinate transformations. Medical Physics. 1981;8: 766-74. [DOI] [PubMed] [Google Scholar]
- 13.Drzymala RE, Mohan R, Brewster L, et al. Dose-volume histograms. International Journal of Radiation Oncology Biology and Physics. 1991;21: 71-8. [DOI] [PubMed] [Google Scholar]
- 14.Goitein M, Abrams M. Multi-dimensional treatment planning: I. Delineation of anatomy. International Journal of Radiation Oncology Biology and Physics. 1983;9: 777-87. [DOI] [PubMed] [Google Scholar]
- 15.Cline HE, Lorensen WE, Ludke S, Crawford CR, Teeter BC. Two algorithms for the three-dimensional reconstruction of tomograms. Medical Physics. 1988;15: 320-27. [DOI] [PubMed] [Google Scholar]
- 16.Tracton G, Chaney E, Rosenman J, Pizer S. MASK: combining 2D and 3D segmentation methods to enhance functionality in Mathematical Methods in Medical Imaging III: Proceedings of 1994 International Symposium on Optics, Imaging, and Instrumentation. SPIE. 1994.
- 17.Brinkley JF. A flexible, generic model for anatomic shape: application to interactive two-dimensional medical image segmentation and matching. Computers and Biomedical Research. 1993;26: 121-42. [DOI] [PubMed] [Google Scholar]
- 18.Kromhout-Schiro S. Development and Evaluation of a Model of Radiotherapy Planning Target Volumes. PhD thesis, University of Washington, 1993.
- 19.Austin-Seymour M, Kalet I, McDonald J, et al. Three-dimensional planning target volumes: a model and a software tool. International Journal of Radiation Oncology Biology Physics. 1995;33: 1073-80. [DOI] [PubMed] [Google Scholar]
- 20.Ketting CH, Austin-Seymour MM, Kalet IJ, et al. Evaluation of an expert system producing geometric solids as output. In: Gardner RM (ed). Proceedings of the Nineteenth Annual Symposium on Computer Applications in Medical Care. Philadelphia, PA: Hanley and Belfus, Inc. 1995: 683-87. [PMC free article] [PubMed]
- 21.Ketting CH, Austin-Seymour MM, Kalet IJ, Unger JM, Hummel SM, Jacky JP. Consistency of three-dimensional planning target volumes across physicians and institutions. International Journal of Radiation Oncology, Biology and Physics. 1997;37: 445-53. [DOI] [PubMed] [Google Scholar]
- 22.Kessler ML, Pitluck S, Petti P, Castro JR. Integration of multimodality imaging data for radiotherapy treatment planning. International Journal of Radiation Oncology, Biology and Physics. 1991;21: 1653-67. [DOI] [PubMed] [Google Scholar]
- 23.Pelizzari CA, Chen GTY. Registration of multiple diagnostic imaging scans using surface fitting. In: Bruinvis IAD, van der Giessen PH, van Kleffens HJ, F. W. Wittkämper (eds). Proceedings of the Ninth International Conference on the Use of Computers in Radiation Therapy. Amsterdam: North-Holland. 1987: 437-40.
- 24.Austin-Seymour M, Chen GTY, Rosenman J, Michalski J, Lindsley K, Goitein M. Tumor and target delineation: current research and future challenges. International Journal of Radiation Oncology Biology Physics. 1995;33: 1041-52. [DOI] [PubMed] [Google Scholar]
- 25.Starkschall G. Design specifications of a radiation oncology picture archival and communication system. Seminars in Radiation Oncology. 1997;7: 21-30. [DOI] [PubMed] [Google Scholar]
- 26.Rosenman J, Sherouse GW, Fuchs H, et al: Three-dimensional display techniques in radiation therapy treatment planning. International Journal of Radiation Oncology, Biology and Physics. 1989;16: 263-9. [DOI] [PubMed] [Google Scholar]
- 27.Unger J. Visualizing dose distributions and anatomy in three-dimensional radiation treatment planning. Master's thesis. University of Washington, Seattle, Washington, 1992.
- 28.Blasko JC, Ragde H, Luse RW, Sylvester JE, Cavanagh W, Grimm PD. Should brachytherapy be considered a therapeutic option in localized prostate cancer? Urologic Clin North Am. 1996;23: 633-50. [DOI] [PubMed] [Google Scholar]
- 29.Brinkley JF, Eno K, Sundsten JW. Knowledge-based clientserver approach to structural information retrieval: the digital anatomist browser. Computer Methods and Programs in Biomedicine. 40: 131-145, 1993;40:131-45. [DOI] [PubMed] [Google Scholar]
- 30.Eno K, Sundsten JW, Brinkley JF. A multimedia anatomy browser incorporating a knowedge base and 3-D images. In Proceedings of the Fifteenth Annual Symposium on Computer Applications in Medical Care, 1991. [PMC free article] [PubMed]
- 31.Brinkley JF, Rosse C. The digital anatomist distributed framework and its applications to knowledge-based medical imaging. J Am Med Inform Assoc. 1997;4: 165-83. [DOI] [PMC free article] [PubMed] [Google Scholar]
- 32.Weber E. An online anatomy reference system for radiation treatment planning. Master's thesis. University of Washington, Seattle, Washington, 1992. Computer Science.
- 33.Kalet IJ, Jacky JP, Risler R, Rohlin S, Wootton P. Integration of radiotherapy planning systems and radiotherapy treatment equipment: 11 years experience. International Journal of Radiation Oncology, Biology and Physics. 38, 1997. In press. [DOI] [PubMed]
- 34.Bosch WR, Low DA, Gerber RL, et al. The electronic view box: a software tool for radiation therapy treatment verification. International Journal of Radiation Oncology Biology and Physics. 1995;31: 135-42. [DOI] [PubMed] [Google Scholar]
- 35.Sullivan KJ, Kalet IJ, Notkin D. Evaluating the mediator method: Prism as a case study. IEEE Transactions on Software Engineering. 1996;22: 503-79. [Google Scholar]
- 36.Jacky J, Kalet I, Chen J, et al. Portable software tools for 3-D radiation therapy planning. International Journal of Radiation Oncology, Biology and Physics. 1994;30: 921-8. [DOI] [PubMed] [Google Scholar]
- 37.Comer DE. Internetworking with TCP/IP: Principles, Protocols and Architecture, 2nd ed. Volume I. Englewood Cliffs, NJ: Prentice-Hall, 1991.
- 38.American College of Radiology, National Electrical Manufacturers Association. Digital imaging and communications in medicine (DICOM): version 3.0. Technical report, National Electrical Manufacturers Association, 2101 L Street, N.W. Suite 300, Washington, D.C. 20037, 1993. Draft Standard, ACR-NEMA Committee, Working Group VI.