Abstract
Ibrutinib, a covalent inhibitor of Bruton Tyrosine Kinase (BTK), is approved for treatment of patients with relapsed/refractory or treatment-naïve CLL. Besides directly inhibiting BTK, ibrutinib possesses immunomodulatory properties through targeting multiple signaling pathways. Understanding how this ancillary property of ibrutinib modifies the CLL microenvironment is crucial for further exploration of immune responses in this disease and devising future combination therapies. Here, we investigated the mechanisms underlying the immunomodulatory properties of ibrutinib. In peripheral blood samples collected prospectively from CLL patients treated with ibrutinib monotherapy, we observed selective and durable downregulation of PD-L1 on CLL cells by 3-months post-treatment. Further analysis showed that this effect was mediated through inhibition of the constitutively active signal transducer and activator of transcription 3 (STAT3) in CLL cells. Similar downregulation of PD-1 was observed in CD4+ and CD8+ T-cells. We also demonstrated reduced IL-10 production by CLL cells in patients receiving ibrutinib, which was also linked to suppression of STAT3 phosphorylation. Taken together, these findings provide a mechanistic basis for immunomodulation by ibrutinib through inhibition of the STAT3 pathway, critical in inducing and sustaining tumor immune tolerance. The data also merit testing of combination treatments combining ibrutinib with agents capable of augmenting its immunomodulatory effects.
INTRODUCTION
Chronic lymphocytic leukemia (CLL) is characterized by profound immunosuppression that involves multiple T-cell defects. These include an exhausted T-cell phenotype marked by profound impairment in proliferation and function,[1, 2] disruption of immune synapse formation,[3] an increase in CD4+CD25hi regulatory T cells[4, 5] and upregulation of checkpoint molecules such as programmed death-1 (PD-1).[6, 7] CLL cells can directly interfere with normal T-cell function through several different mechanisms, including secretion of the immunosuppressive cytokine IL-10, a feature shared with the recently described regulatory B10 cells,[8–11] as well as aberrant expression of several inhibitory receptors, notably, programmed death ligand-1 (PD-L1).[12] Even untreated, early stage CLL or its precursor condition, monoclonal B-cell lymphocytosis, are associated with significant infection risk,[13, 14] a leading cause of morbidity and mortality in this disease.
BTK, a member of the TEC tyrosine kinase family, is a key enzyme in the B-cell receptor signaling pathway and plays an important role in the activation and survival of B cells. As such, it is a unique therapeutic target in B-cell malignancies.[15–20] BTK also controls multiple downstream signaling pathways,[21] including the signal transducer and activator of transcription 3 (STAT3), a transcription factor involved not only in the pathogenesis and persistence of CLL,[22, 23] but also in inducing and sustaining tumor immune tolerance.[24, 25] Ibrutinib is a potent covalent inhibitor of BTK[26] and is highly effective therapy for CLL. In this study, we present evidence that in addition to its direct antitumor effect via targeting of BTK, ibrutinib modulates the immunosuppressive CLL microenvironment through inhibition of the STAT3 pathway. By suppressing STAT3, the drug inhibits CLL B10 function and induces downregulation of PD-1/PD-L1 expression, potentially enhancing antitumor immune responses.
Materials and methods
Patients
Clinical samples from 17 consecutive patients with relapsed or refractory CLL, enrolled in an investigator-initiated trial of ibrutinib alone (420 mg once daily until disease progression or the development of unacceptable toxicity; NCT02007044) and from control patients treated with chlorambucil monotherapy (NCT01722487 and Chronic Lymphocytic Leukemia Research Consortium, University of California, San Diego) were studied with approval of the local institutional review board and in accordance with the Declaration of Helsinki. Patient characteristics are summarized in Table 1. The median age was 68 years (range 55–79 years). Most (71%) had advanced stage disease (Rai stage III or IV); 47% had bulky lymph nodes (≥5 cm) and the median number of prior treatment regimens received was 1.5 (range, 0–6). Peripheral blood was collected before (Pre-dose), and at 3 and 6 months after the initiation of ibrutinib therapy. Peripheral blood mononuclear cells (PBMCs) were isolated by density-gradient-separation (Lymphoprep), cryopreserved in 90% FBS/10% DMSO, and stored in liquid nitrogen. In addition, lymphocytes from 11 normal donors were analyzed.
Table 1.
Patient characteristics
| Age | Sex | # prior Rx |
FISH | Baseline B2M |
IGHV MS |
Largest lymph node pre- treatment (cm) |
Rai stage |
Infection | Response | Progression | CD4+PD1+ T cells [%] |
CD8+PD1+ T cells [%] |
CD19+ CD5+PD1+ [%] |
CD19+ CD5+PDL1+ [%] |
CD19+CD5+ p-S727-STAT3 [MFI] |
IgG | ||||||||||
|---|---|---|---|---|---|---|---|---|---|---|---|---|---|---|---|---|---|---|---|---|---|---|---|---|---|---|
| pre | 3mo | 6mo | pre | 3mo | 6mo | pre | 3mo | 6mo | pre | 3mo | 6mo | pre | 3mo | 6mo | pre | |||||||||||
| 55 | F | 1 | Del(17p) | 2.5 | NR | 2.9 | 4 | PR | 38.0 | 27.5 | NA | 26.4 | 13.9 | NA | 64.6 | 11.9 | NA | 22 | 25.8 | NA | 992 | 358 | 381 | 566 | ||
| 57 | M | 1 | Del(11q) | 3.5 | NR | 6.3 | 3 | PR | 45.9 | 44.1 | NA | 13.9 | 9.7 | NA | 31.7 | 42.5 | NA | 34.1 | 15.7 | NA | NA | NA | NA | 692 | ||
| 59 | F | 3 | Del(17p) | 3.8 | UM | 5.5 | 4 | CR | 27.2 | 14.5 | NA | 21.3 | 10.1 | NA | 39.2 | 3.3 | NA | 12.4 | 5 | NA | 375 | NA | 180 | 383 | ||
| 60 | M | 1 | Del(11q) | 2.6 | UM | 3.6 | 1 | PR | 31.2 | NA | 24.1 | 30.3 | NA | 21.8 | 54.1 | NA | 1 | 8.5 | NA | 19.3 | NA | NA | NA | 521 | ||
| 63 | M | 2 | Del(17p) | 4.4 | MUT | 7.9 | 1 | PR | 40.7 | 43.6 | NA | 28.3 | 30.9 | 15.5 | 1.2 | NA | 6.6 | 6.8 | NA | 256 | 214 | NA | 417 | |||
| 64 | M | 0 | Del(17p) | 14.0 | UM | 9.1 | 3 | URI Grade 2 | PR | 42.0 | 40.6 | 40.9 | 19.8 | 20.5 | 15.8 | 8.4 | 0.7 | 0.6 | 18 | 9.7 | 8.1 | NA | NA | NA | 2380* | |
| 64 | F | 6 | Del(11q) | 9.3 | MUT | 2.8 | 4 | PR | 78.5 | 54.7 | 49.6 | 35.8 | 6.2 | 6.5 | 3.9 | 2.8 | 1.5 | 5.8 | 11.5 | 5.5 | 528 | 217 | 199 | 60 | ||
| 68 | M | 2 | Del(17p) | 6.3 | UM | 5.4 | 4 | PR | 17.6 | 15.8 | 15.8 | 15.0 | 9.9 | 12.7 | 6.9 | 1.5 | 3.3 | 9.8 | 6.2 | 8.2 | 322 | 119 | 172 | 444 | ||
| 68 | M | 1 | Del(17p) | 4.9 | UM | 5.4 | 2 | PR | 11m | 19.1 | 13.2 | NA | 17.1 | 9.4 | NA | 10.6 | 0.3 | NA | 51.3 | 54.4 | NA | NA | NA | NA | 369 | |
| 70 | M | 2 | Neg | 4.5 | UM | 3.4 | 1 | PR | 25.4 | 20.9 | NA | 19.8 | 7.3 | NA | 24.2 | 4.1 | NA | 16.5 | 14.6 | NA | NA | NA | NA | 567 | ||
| 71 | F | 3 | Trisomy 12 | 5.1 | UM | 3.0 | 4 | Cryptococcal meningitis Grade 4 | PR | 54.4 | 40.5 | 36.5 | 8.6 | 6.4 | 6 | 1.05 | 0.2 | 0.4 | 22.2 | 21.8 | NA | 587 | 338 | NA | 1828 | |
| 71 | M | 0 | Del(13q) | 3.7 | UM | 11.3 | 1 | PR | 14.1 | 7.5 | NA | 26.3 | 19.7 | NA | 9.18 | 0.2 | NA | 13.2 | 0 | NA | 348 | 200 | 191 | 795 | ||
| 72 | F | 0 | Del(13q) | 2.8 | MUT | 2.0 | 3 | CR | 12.6 | 15.6 | NA | 35.4 | 36.2 | NA | 4.7 | 1.2 | NA | 23 | 14.7 | NA | 191 | 170 | 156 | 387 | ||
| 73 | F | 1 | Del(17p) | 9.1 | MUT | 3.8 | 3 | Pneumonia Grade 3 | PR | 20m | 7.2 | 9.43 | NA | 19.8 | 19.0 | NA | 14.4 | 4.3 | NA | 5.9 | 2.6 | 6.4 | NA | NA | NA | 97 |
| 74 | M | 1 | Del(17p) | 4.5 | MUT | 3.8 | 4 | PR | 31m | 40.2 | 41.8 | NA | 28.4 | 19.7 | NA | 5.5 | 0.6 | NA | 38.8 | 22.9 | NA | NA | NA | NA | 849 | |
| 79 | F | 5 | Del(13q) | 4.5 | MUT | 5.6 | 4 | URI Grade 2 | PR | 43.4 | 41.2 | 41.5 | 23.8 | 25.8 | 23.4 | 88.1 | 40.2 | 40.5 | 15.1 | 5.1 | 8 | 389 | 200 | 235 | 1194 | |
| 79 | M | 3 | Neg | 3.5 | MUT | 4.4 | 3 | PR | 26.3 | NA | 29.8 | 14.9 | NA | 15 | 5.6 | NA | 19 | 12.2 | 7 | NA | NA | NA | NA | 1100 | ||
Abbreviations: B2M: β2-microglobulin; FISH, fluorescence in situ hybridization; IGHV MS, immunoglobulin heavy chain variable mutation status; 3m, after 3 months of treatment; # prior Rx, number of prior therapies; PR, partial remission; CR, complete remission; NA, not available.
Reagents
Ibrutinib (PCI-32765) was purchased from Selleckchem (Houston, TX) and added to the assay medium to a final concentration of 1μM. Details of monoclonal antibodies are included in the supplementary material.
Immunofluorescence staining and flow cytometric analysis
For surface staining, PBMCs were washed with staining buffer (PBS containing 2% FCS), incubated with directly conjugated mAbs and Live/Dead Aqua for 405 nm excitation (Life Technology) for 20 minutes at room temperature in the dark and then washed and resuspended in 4% paraformaldehyde/PBS solution. Flow cytometry was performed on a BD Fortessa flow cytometer followed by analysis with FlowJo Version 10.0.8 software (TreeStar), after gating on live singlet cells. The gating strategy for flow analysis is presented in Supplementary Figure 1.
Phosflow assay
Cells were stained with Live/Dead Aqua (Life Technology), CD19-V450 (BD) and CD5-FITC (BioLegend) Abs for 20 minutes, washed, fixed/permeabilized (PerFix EXPOSE, Beckman Coulter) and stained with the p-S727-STAT3-PE mAb (BD Biosciences) for 30 minutes at room temperature.
BCR and CD40 ligation
Cells were stimulated with either goat anti-human IgM+IgG (20μg/ml, Jackson ImmunoResearch) or with soluble CD40L (100 ng/ml; Adipogen) for 20 minutes at 37°C. Cells were then fixed, permeabilized and stained with the p-S727-STAT3-PE antibody as described above.
Coculture experiments with STAT3 inhibitor or ibrutinib
PBMCs from CLL patients were cultured for 24 or 48 hours at 37°C in SCGM medium (Cell Genix) in the presence or absence of the STAT3 inhibitor cucurbitacin (0.05 μM) or ibrutinib (1μM; Selleck chemicals). Cells were stained for 30 minutes with mAbs against PD-L1, CD3, CD4, CD8, CD19, CD5 and Live/Dead Aqua (Invitrogen) to check viability. Cells were also stained for p-S727-STAT3 by phosflow as described above.
Intracellular cytokine staining to detect IL-10 production by CLL cells
Cryopreserved PBMCs from CLL patients collected before, and 3 and 6 months after ibrutinib therapy were thawed and stimulated with CpG (4μg/ml; Hycult biotech) plus CD40L (100 ng/mL) for 10 hours. In another experiment, PBMCs from untreated CLL patients were cultured with ibrutinib (1μM) or the STAT3 inhibitor cucurbitacin overnight (0.05 μM) and stimulated with CpG and CD40L for 10 hours. Phorbol-myristate acetate (PMA) (50 ng/mL; Sigma-Aldrich), ionomycin (250 ng/mL; Sigma-Aldrich), and brefeldin-A (10 μg/mL) were added for the last 6 hours of the culture. Cells were then washed and incubated for 20 minutes with anti-CD19-PE-cy7, CD5-FITC (BioLegend) and Live/Dead Aqua (Life technology). Cells were then washed and fixed/permeabilized for 1 hour at 4°C using a Foxp3 staining buffer set (eBioscience). Cells were incubated for 30 minutes at room temperature with APC-conjugated IL-10 or IgG2aK isotype antibodies (BD). All data were acquired with BD-Fortessa (BD Biosciences) and analyzed with FlowJo software.
Generation of green fluorescence protein (GFP)-lentiviral STAT3-shRNA for transfection of primary CLL cells
293T cells were co-transfected with GFP-lentivirus STAT3 short hairpin RNA (shRNA) or GFP-lentivirus empty vector and the packaging vectors pCMVdeltaR8.2 and pMDG, using the Superfect transfection reagent (Qiagen, Inc.). 293T cell culture medium was changed after 16 hours and collected after 48 hours. The culture medium was filtered through a 45 μM syringe filter to remove floating cells. The lentivirus was then concentrated by filtration through an Amicon ultracentrifugal filter device (Millipore, Billerica, MA), and the concentrated supernatant was used to infect CLL cells. CLL cells from 3 different patients (5 × 10⁶/mL) were incubated in DMEM supplemented with 10% fetal calf serum and transfected with viral supernatant as described.[27]
BTK knockout cell lines
The CRISPR-CAS9 system was used to knockout BTK in the RCH-ACV B cell leukemia cell line as previously described.[28] Briefly, px458-based constructs or the empty px458 vector (control) were introduced into RCH-ACV cells by electroporation with the NEON transfection system. Viable GFP+ cells were sort-purified 72 hours later on the FACSAria Fusion Sorter (BD Biosciences) and used for further experiments. Single GFP+ cells were sorted into 96-well plates to obtain single cell clones. BTK knockout was confirmed by Western blot analysis.[28]
Western blotting
PBMCs collected from CLL patient pre, and at 3 and 6 months post ibrutinib therapy were lysed using 1×Pierce IP Lysis Buffer together with 1×Halt Protease and Phosphatase Inhibitor Cocktail (Thermo-Fisher-Scientific). Proteins (20μg) were loaded on NuPAGE 4–12% Bis-Tris Protein gel and separated using NuPAGE MOPS SDS running buffer (Thermo-Fisher-Scientific). Proteins were transferred to a nitrocellulose membrane in NuPAGE Transfer Buffer plus 10% methanol. We used mouse anti-human monoclonal antibodies against STAT3 and β-actin, monoclonal anti-human extracellular PD-L1 and polyclonal rabbit anti-human p-S727-STAT3 (Cell Signaling). IRDye 680RD goat anti-mouse and 800CW goat anti-rabbit antibodies (Li-Cor) were used as secondary antibodies. Blots were visualized using Odyssey Imaging System. Densitometry values were normalized using the values of the loading control (untreated CLL actin levels were used as reference). The numerical value for the signal of p-S727-STAT3 from each sample was divided by the numerical value of the signal from the corresponding total STAT3.
Statistical analysis
All values in statistical comparisons are means and standard errors of the mean (SEM). Statistical significance was assessed with Prism 6 (GraphPad Software, Inc.) and SPSS version 23 (IBM Corp.) using a paired two-tailed t test for normally distributed variables, the Mann-Whitney U test for non-normally distributed variables and ANOVA for comparison of multiple variables. P values of ≤ 0.05 were considered significant. In analyses with missing data, only measurements representing paired samples from individual patients were included.
RESULTS
Ibrutinib selectively modulates PD-L1 and PD-1 expression
The PD-1/PD-L1 axis is an important contributor to the dysfunctional interactions between leukemic CLL cells and host T lymphocytes.[6, 7] Thus, we measured expression levels of PD-1 and other checkpoint molecules on T-cells before and during ibrutinib therapy. Consistent with previous reports,[6, 7] expression of inhibitory immune checkpoint molecules was significantly higher on T-cells from CLL patients, compared to healthy controls (Supplementary Fig. 2). We found no significant correlation between expression levels of PD-1 on CD4+ or CD8+ T-cells prior to therapy and the following parameters: number of prior therapies, previous fludarabine therapy, maximum lymph node size ≥5.0cm, β2-microglobulin ≥mg/L, presence of del(17p), IGHV somatic hypermutation status, ZAP70 expression or advanced Rai stage (data not shown).
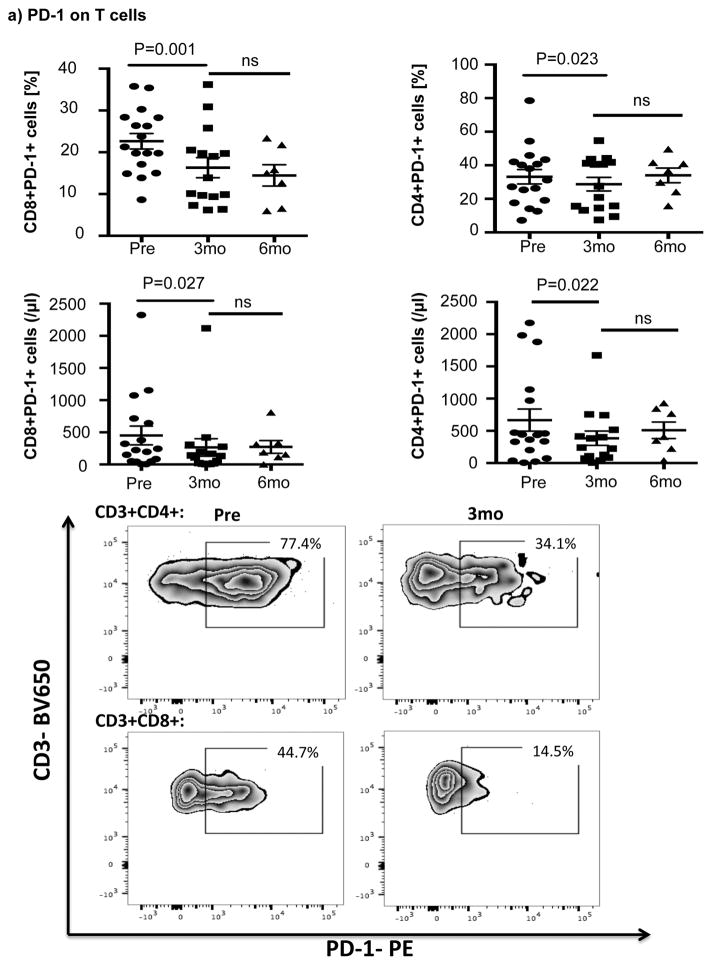
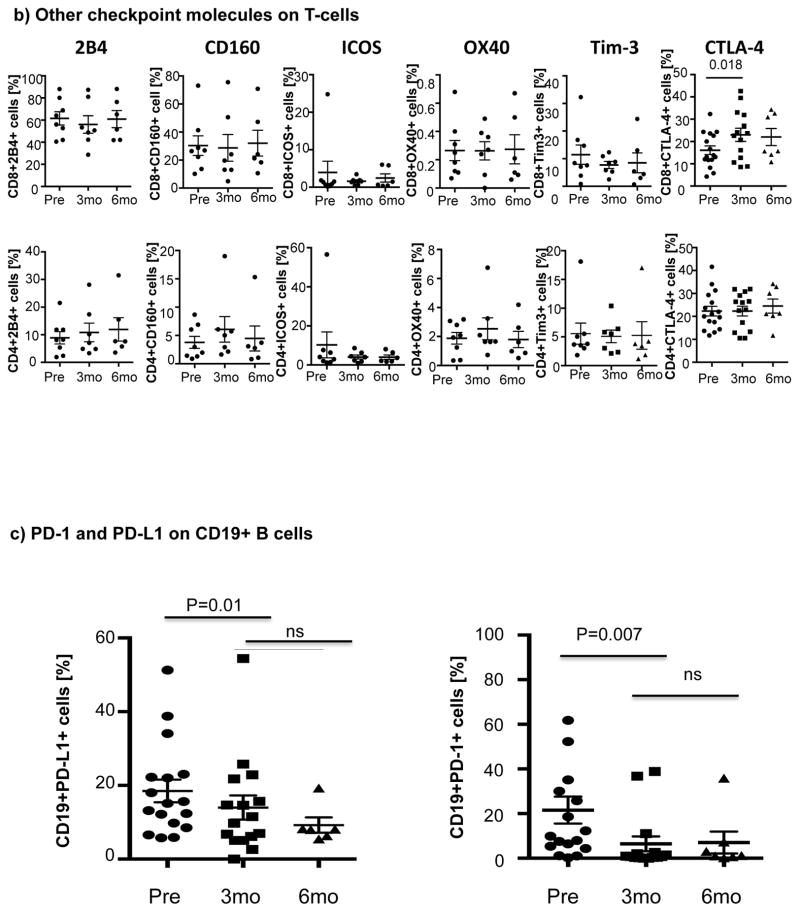
Ibrutinib therapy resulted in a significant reduction in the frequency and absolute number of PD-1-expressing T-cells by 3 months after treatment that was largely sustained at 6 months. Notably, the reduction in PD-1-expression at 3 months was significant for both CD8+ T-cells (22.6% ± 1.9% pre-dose vs. 16.3% ± 2.4% at 3 months, P=0.001) and CD4+ T-cells (33.2% ± 4.3% pre-dose vs. 28.7 ± 4.0% at 3 months, p=0.023) (Fig 1a). We next asked if ibrutinib could modulate the expression of other checkpoint molecules on T-cells. As shown in Fig. 1b there was no evidence to support downregulation of 2B4, CD160, ICOS, OX40, Tim-3 and CTLA-4 on CD8+ or CD4+ T-cells post ibrutinib therapy.
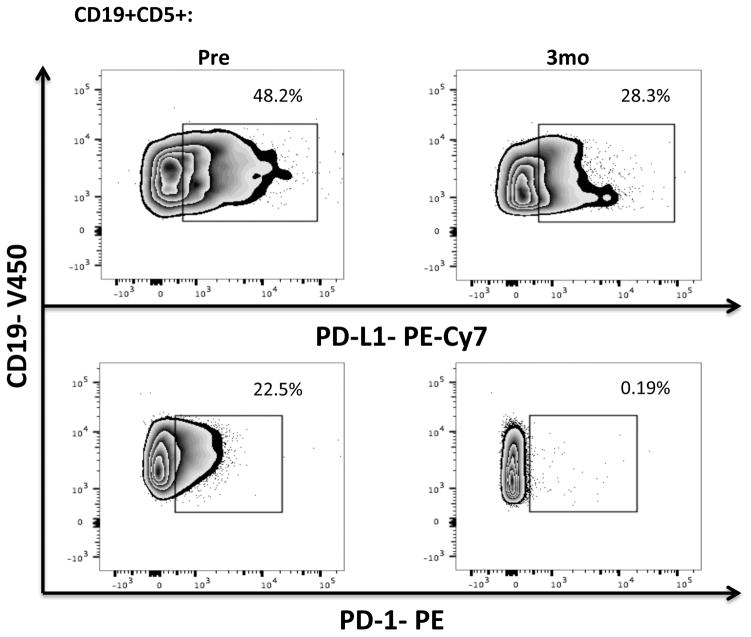
Figure 1. Expression of immune checkpoint molecules during ibrutinib therapy.
PBMCs were stained for CD19, CD5, CD3, CD4, CD8, PD-1 and PD-L1 expression. (a) Frequencies and absolute numbers of PD-1-expressing CD8+ and CD4+ T-cells, including representative FACS plots are shown. (b) PBMCs from 8 patients were stained for 2B4, CD160, ICOS, OX40 and Tim-3 (n=8) while those for 17 patients were stained for CTLA-4 (n=17). The p value is *0.0183 in CTLA-4 on CD8+ T-cells. (c) Frequencies of PD-L1 and PD-1-expressing CLL cells and representative FACS plots are shown (n=16).
We also measured PD-L1 expression on CLL cells. Within 3 months of therapy, there was a significant downregulation of PD-L1 (mean 18.5% ± 3.06% vs. 13.99% ± 3.28%, P= 0.011) by CD19+ CLL cells, which remained stable at 6 months (Fig. 1c, Supplementary Fig. 3). Based on emerging data indicating that in cancer cells PD-1 can promote tumor growth,[29] we also measured PD-1 levels in CD19+ CLL cells. PD-1 was expressed at high levels on CLL cells, with significant downregulation after 3 months of ibrutinib therapy that persisted through 6 months (Fig. 1c). These effects were not observed in patients treated with chlorambucil monotherapy (Supplementary Fig. 4a).
Hence, we suggest that ibrutinib selectively downregulates the expression of PD-L1 and PD-1 in the CLL microenvironment, potentially resulting in beneficial anti-pathogen and anti-tumor immunity. The relevance of the effect on PD-1 levels in CLL cells is unclear, but may reflect a function that is independent of adaptive immunity.
STAT3 plays an important role in the regulation of PD-L1 expression
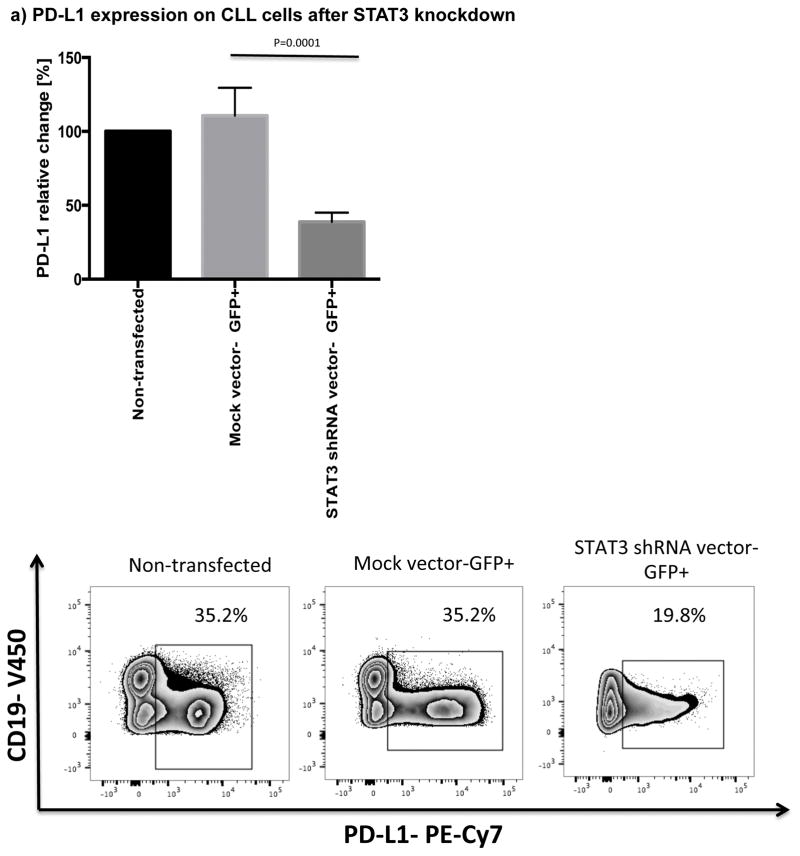
The STAT3 signaling pathway has been shown to regulate expression of PD-L1 in antigen presenting cells as well as in a number of tumor cells, including lung cancer and T cell lymphoma.[30–32] STAT3 is constitutively active in CLL,[23] however, it is not known if STAT3 also plays a role in the regulation of PD-L1 expression in this disease. In order to establish a direct effect of STAT3 on the expression levels of PD-L1 in CLL cells, we used a GFP lentiviral-STAT3-shRNA vector to knockdown STAT3 expression (n=3). A mock lentiviral vector with GFP alone was used as control (n=3). The efficiency of STAT3 knockdown in CLL cells, as measured by GFP expression, was 21% (18.5%–21.5%). To study the impact of STAT3 knockdown on expression of PD-L1 in the gated GFP+ subsets, cells were stained with Dead/Live Aqua, CD3, CD19, CD5 and PD-L1 monoclonal antibodies 48 hours after treatment with GFP lentiviral-STAT3-shRNA vector or a mock GFP lentiviral vector. As displayed in Fig. 2a, STAT3-shRNA knockdown resulted in significant downregulation of PD-L1 in GFP+CD19+CD5+ CLL cells compared to their mock-transfected counterpart (P=0.0001).
Figure 2. STAT3 modulates PD-L1 surface expression on CLL cells.
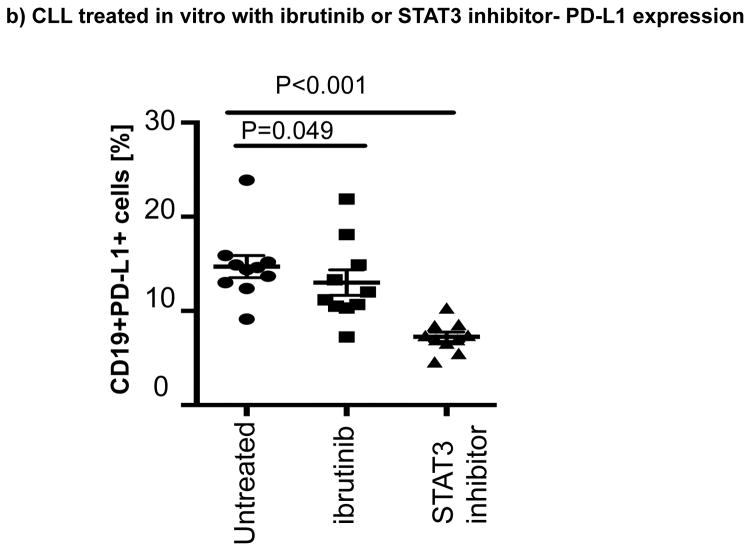
(a) CLL cells were treated with a GFP lentiviral hSTAT3 sh-RNA vector or a mock GFP lentiviral vector. After 48 hours of coculture with the viral supernatant, the cells were stained for viability, CD5, CD19 and PD-L1. Representative FACS plots are presented. The percent change in PD-L1 expression in GFP+CD19+CD5+ cells was measured and the percent change in expression was calculated using the following formula: (PD-L1+CD19+CD5+ cells [%] in transfected CLL samples(GFP+)) / (PD-L1+CD19+CD5+ cells [%] in non-transfected matching controls) x100 (n=3). (b) PBMCs from untreated CLL patients were cultured with ibrutinib (1 μM) or a STAT3 inhibitor (cucurbitacin, 0.05 μM) for 2 days, and then stained for viability, CD19, CD5 and PD-L1 expression (n=6).
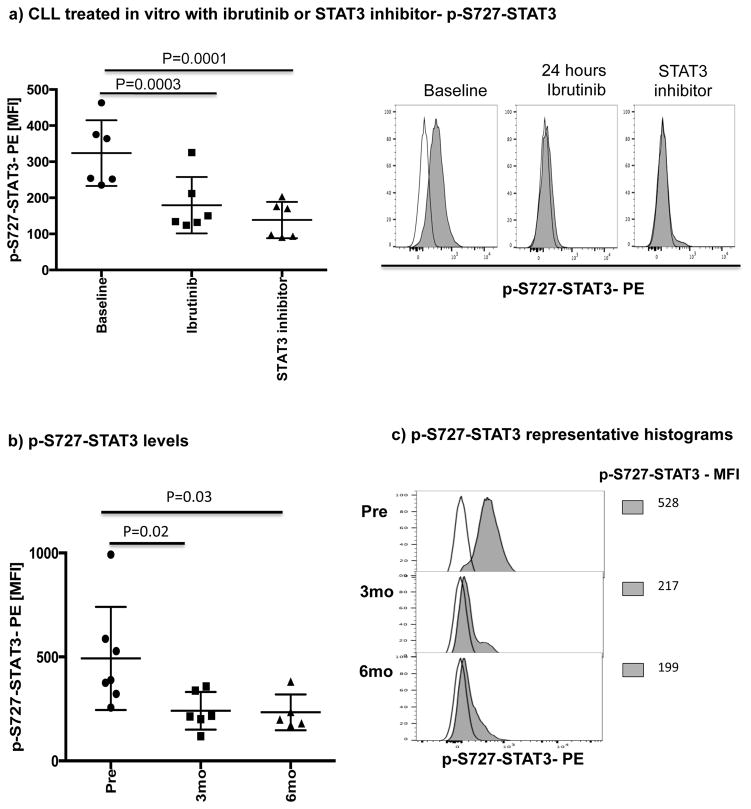
Ibrutinib has been reported to inhibit STAT3 activation in a number of cancer cells including gastric cancer, diffuse large B cell lymphoma and ovarian cancer.[33–35] Thus, we asked if treatment with ibrutinib can also suppress STAT3 phosphorylation in CLL cells and downregulate PD-L1 expression. We cocultured CLL cells from treatment-naïve patients (n=6), with ibrutinib or a STAT3 inhibitor with activity against the S727 residue (cucurbitacin)[36] and measured levels of S727-STAT3 phosphorylation and PD-L1 expression in CLL cells. Cucurbitacin is a highly selective inhibitor of STAT3 signaling, with no significant effect on other pro-survival pathways within malignant cells, such as Ras-raf-MEK-ERK and PI3k/Akt.[37] As shown in Fig. 2b and Fig. 3a, treatment with either agent led to decreased expression PD-L1 and p-S727-STAT3 in CLL cells compared to findings in untreated CLL cells. To confirm these in vitro data, we also measured the constitutive levels of S727-STAT3 phosphorylation in PBMC samples collected from patients pre-dose (n=7) and after 3 (n=6) and 6 months (n=5) of ibrutinib therapy. As previously reported,[7, 27] S727-STAT3 was constitutively phosphorylated in all patients studied before ibrutinib treatment. Subsequently, there was a significant reduction in p-S727-STAT3 levels at 3 and 6 months compared to baseline (mean fluorescence intensity [MFI] 493 ± 248 pre-dose vs. 241 ± 91 at 3 months [P=0.02] and 233 ± 86 at 6 months [P=0.03]) (Fig 3b, Supplementary Fig. 3). A representative Phosflow plot depicting reduction in p-STAT3 level during ibrutinib therapy is presented in Fig. 3c. Taken together, these data support an inhibitory effect of ibrutinib on the STAT3 pathway.
Figure 3. Ibrutinib inhibits STAT3 phosphorylation both in vitro and in vivo.
PBMCs were stained for viability using Live/Dead aqua, CD19 and CD5 and then for the phosphorylated serine STAT3 (p-S727-STAT3) using the Perfix Expose kit. The level of p-STAT3 in CD19+ CLL cells was measured by mean fluorescence intensity (MFI). (a) PBMCs from treatment-naïve CLL patients were treated with ibrutinib (1 μM) or a STAT3 inhibitor (0.05 μM) for 2 days and then stained for viability, CD19, CD5 and p-S727-STAT3 (n=6). Representative flow plots are also presented. The white histogram represents the isotype control while the gray histogram shows p-S727-STAT3 expression in CLL cells at baseline and after 48 hours of treatment with ibrutinib or a STAT3 inhibitor. (b) The level of p-S727-STAT3 in CD19+ CLL cells in samples collected pre, and at 3 and 6 months post ibrutinib therapy. (c) Representative FACS plot showing p-S727-STAT3 reduction during ibrutinib therapy are presented. The white histogram represents the isotype control while the gray histogram shows p-S727-STAT3 expression in CLL cells pre, at 3 and 6 months post ibrutinib therapy.
Ibrutinib suppresses CLL B10 function by inhibiting STAT3 activation
A subset of regulatory B cells, known as B10 cells, suppress effector T-cell function through STAT3-mediated production of IL-10.[8, 10, 38] B cells from CLL patients were recently reported to have the ability to secrete IL-10 and to perform regulatory functions comparable to those of normal B10 cells.[10, 11] This led us to investigate whether ibrutinib could also modify B10 function in CLL through suppression of STAT3.
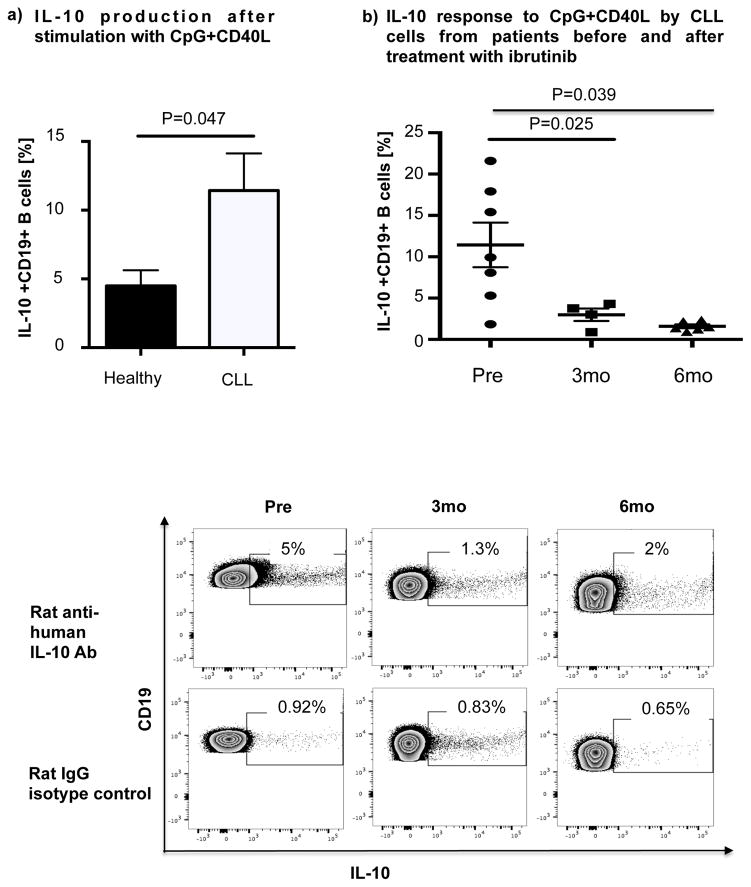
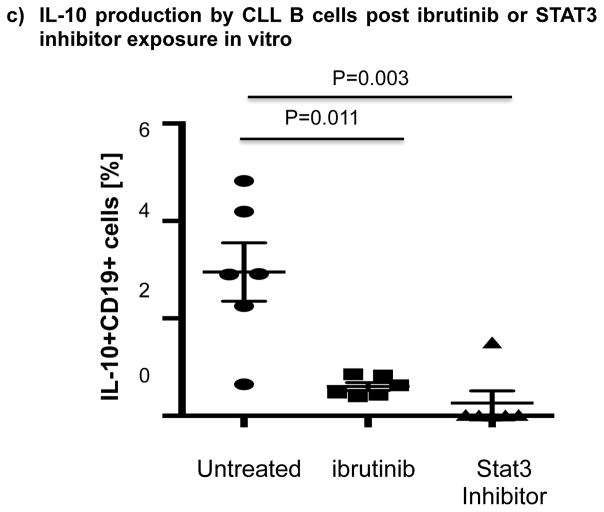
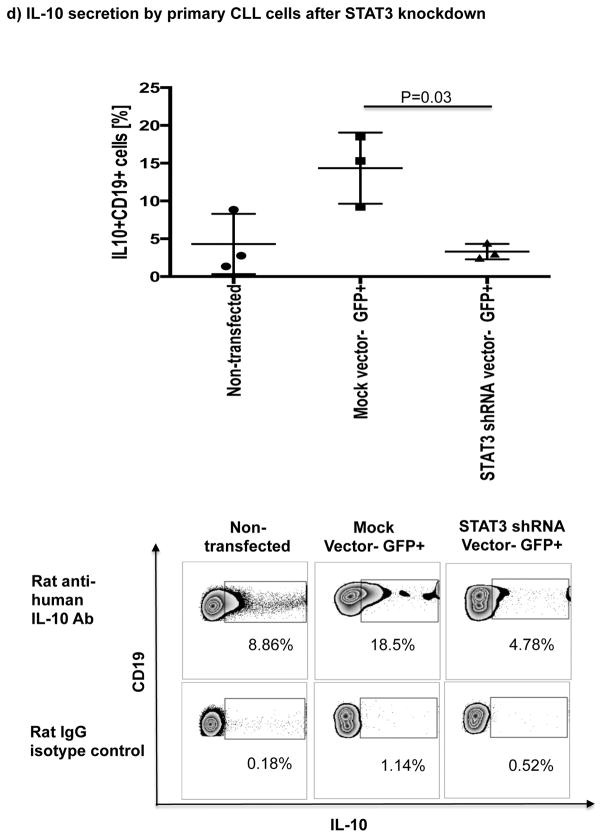
Thus, we cultured B cells from 6 ibrutinib-naïve CLL patients in the presence or absence of ibrutinib (1 μM) for 24 hours and stimulated them with CpG (4 μg/mL) plus CD40L (100 ng/mL) to assess their ability to produce IL-10. Consistent with previous reports,[10] B cells from CLL patients produced significantly more IL-10 than B cells from healthy donors, as measured by intracellular IL-10 staining (mean 11.4%± 2.7% vs 4.5%± 1.1%, P=0.047) (Fig. 4a). To address the central issue of whether ibrutinib modulates B10 function in CLL, we measured IL-10 production directly ex vivo in PBMC samples collected longitudinally from 6 patients before and at 3 and 6 months of ibrutinib therapy. The frequencies of CD19+IL-10+ B cells were significantly lower in the peripheral blood of CLL patients at 3 and 6 months of ibrutinib therapy, compared to pre-dose (mean 11.4% ± 2.7 at pre-dose vs. 3.0% ± 0.8 at 3 months vs. 1.6% ± 0.2 at 6 months, P=0.025 and P=0.039, respectively; Fig. 4b and supplementary Fig. 5 for IL-10 secretion by ELISA). This outcome was associated with a significant reduction in constitutive levels of phosphorylated S727-STAT3 after ibrutinib therapy compared to baseline (Fig 3b–c). In contrast, chlorambucil therapy had no impact on levels of S727-STAT3 phosphorylation in CLL cells or their B10 function (Supplementary Fig. 4b–c). In keeping with our ex vivo data, in vitro culture of B cells from ibrutinib-naïve CLL patients with 1μM ibrutinib overnight resulted in a significant reduction in their capacity to produce IL-10 in response to CpG and CD40L stimulation compared to untreated cells (3.0% ± 0.6% vs. 0.6% ± 0.1%, P=0.011; Fig 4c). To determine if ibrutinib suppresses IL-10 production by inhibiting STAT3 phosphorylation, we cultured primary CLL cells from ibrutinib-naïve patients in the presence or absence of the STAT3 inhibitor cucurbitacin (0.05 μM) overnight and measured their capacity to produce IL-10 and in response to stimulation with CpG and CD40L. Whereas CD40 ligand can induce S727-STAT3 phosphorylation, CLL cells cultured with cucurbitacin (0.05 μM) showed near-complete abrogation of IL-10 response (Fig. 4c). Of note, incubation with ibrutinib or cucurbitacin did not significantly impact CLL cell viability (Supplementary Fig. 6). To further confirm the relationship between STAT3 and IL-10 production by CLL cells, we performed STAT3-knockdown with shRNA and measured the ability of CD19+CD5+ CLL cells to respond to stimulation with CpG and CD40L. As shown in Fig. 4d, STAT3-shRNA–transfected GFP+ CLL cells produced significantly less IL-10 in response to CpG and CD40L compared to mock-transfected GFP+ CLL cells (P=0.03). Importantly, treatment of CLL cells with STAT3-shRNA did not significantly affect their viability (Supplementary Fig. 6). Considered together, our data suggest that ibrutinib modifies the ability of CLL cells to produce IL-10 and modulates the immune response by inhibiting STAT3 phosphorylation.
Figure 4. IL-10 production in CLL cells is reduced after ibrutinib therapy.
(a) PBMCs from CLL vs. healthy donors were stimulated with CpG (4 μg/ml) plus CD40L (100 ng/ml) for 12 hours followed by PMA, ionomycin and brefeldin A for the last 6 hours of culture and then stained for CD19 and intracellular IL-10 production. Frequencies of IL-10+CD19+ B cells are greater in CLL patients compared to healthy donors (n=6 each) are shown. (b) PBMCs from patients given ibrutinib therapy were stimulated with CpG plus CD40L, followed by analysis of IL-10 secretion as described above (n=7). Representative FACS plots are shown. (c) PBMCs from treatment-naïve CLL patients were cultured with ibrutinib (1 μM) or cucurbitacin (0.05 μM) overnight, and their IL-10 response to stimulation with CpG and CD40L was measured by intracellular cytokine staining (n=6). (d) CLL cells from treatment-naïve patients were treated with a GFP lentiviral hSTAT3 sh-RNA vector or a mock GFP lentiviral vector as described in methods. Cells were then stimulated with 4 μM CpG and CD40L (100 ng/ml), followed by analysis for IL-10 production. IL-10 production was compared in gated CD19+GFP+ cells in transfected vs. mock-transfected CLL cells (n=3). Representative FACS plots are presented.
BTK is an upstream activator of p-S727-STAT3
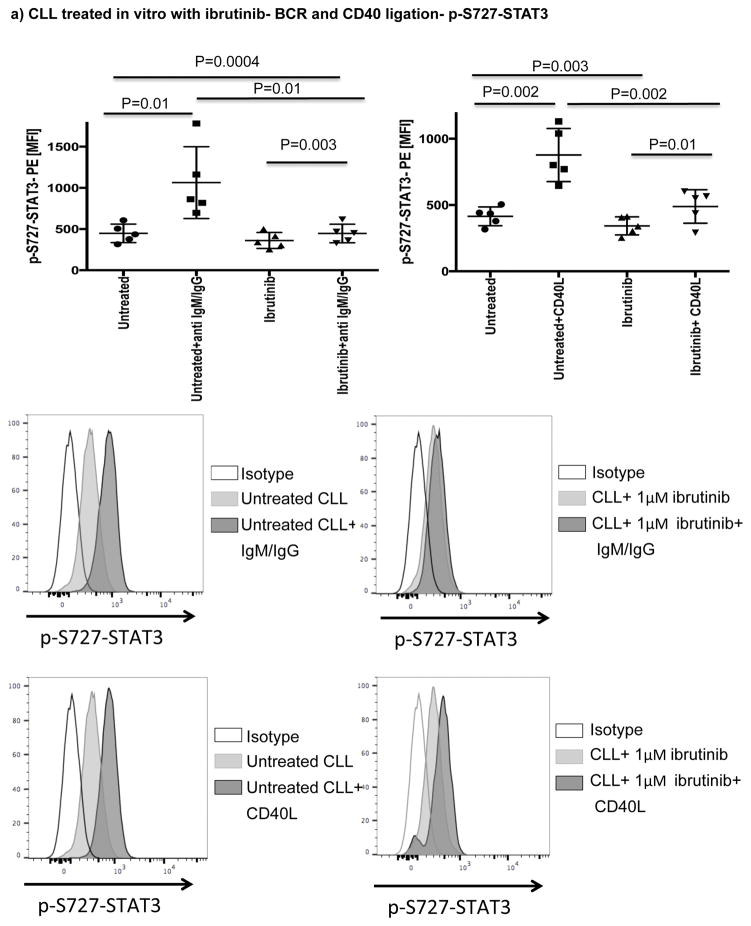
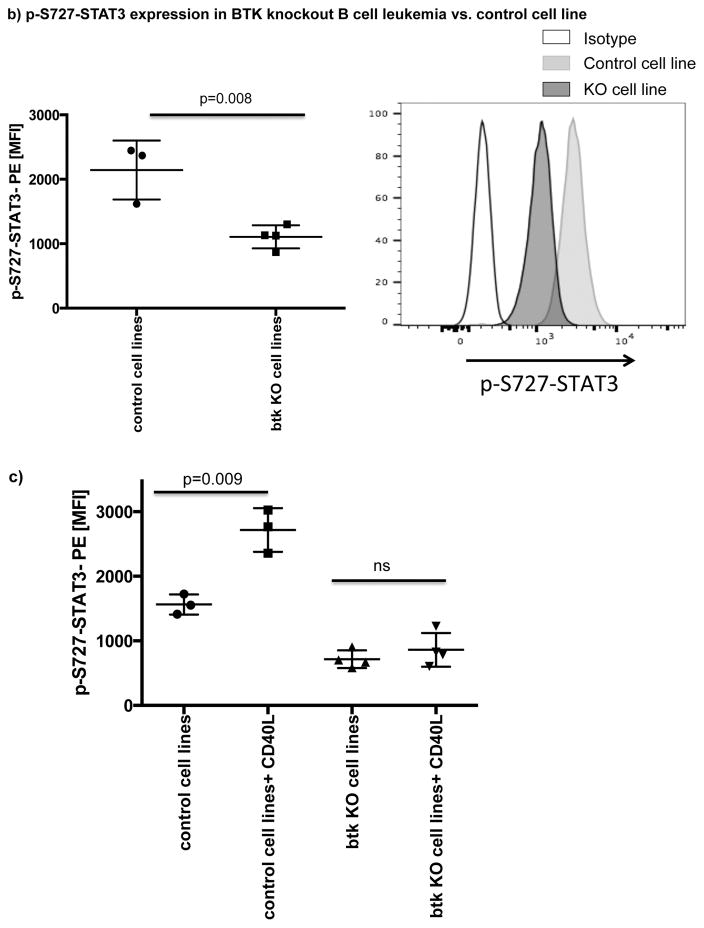
A number of studies have shown that BCR or CD40 signaling can effectively activate BTK.[20, 39] Here, we showed that both pathways can also efficiently activate STAT3 (Fig. 5a). To determine if ibrutinib can modulate BCR- or CD40L-induced p-S727-STAT3 levels, we cultured CLL cells from ibrutinib-naïve patients in the presence or absence of ibrutinib (1μM) for 24 hours and measured p-S727-STAT3 levels in response to 20 minutes of stimulation with anti-human IgM/IgG to activate BCR or CD40L to activate the CD40/CD40L axis (Fig. 5a). The addition of ibrutinib to the culture significantly reduced anti-IgM/IgG or CD40L-induced STAT3 phosphorylation. Of note, culture of CLL cells with ibrutinib for 24 hrs did not have a significant impact on their viability (Supplementary Fig. 6). To establish a direct relationship between BTK and p-S727-STAT3, we examined the levels of p-S727-STAT3 in a BTK knockout B cell leukemia line in comparison to the control cell line transfected with an empty vector (BTK knockout efficiency is presented in Supplementary Fig. 7). BTK knockout significantly decreased the constitutive levels of p-S727-STAT3 (2144 ± 264 vs. 1107 ± 89, p=0.008) (Fig. 5b). We next stimulated the BTK knockout and control cell lines with CD40L. BTK knockout significantly reduced the phosphorylation of STAT3 in response to CD40L (Fig. 5c). We thus conclude that BTK signaling is upstream of STAT3 and can modulate phosphorylation of the S727 residue.
Figure 5. BTK signaling can modulate phosphorylation of the 727 serine residue of STAT3.
(a) PBMCs from treatment-naïve CLL patients were cultured either alone or with ibrutinib (1 μM) for 24 hours and then stimulated with either CD40L (100 ng/ml) (left panel) or goat anti-human IgM+IgG (20μg/ml) (right panel) for 20 minutes. The cells were then fixed/permeabilized and stained for p-S727-STAT3 as described in the materials and methods section (n=5). Representative Phosflow histograms depicting p-S727-STAT3 expression on gated CD19+CD5+ CLL cells are shown. (b) Constitutive levels of p-S727-STAT3 in a BTK knockout RCH-ACV cells in comparison to RCH-ACV cells transfected with an empty vector. Cells were stained for viability using Live/Dead aqua, then fixed/permeabilized and stained for p-S727-STAT3 (n=4 BTK knockout, n=3 controls). Representative FACS plots showing p-S727-STAT3 reduction after BTK knockout are presented. The white histogram represents the isotype control while the light gray histogram shows p-S727-STAT3 expression in control RCH-ACV cells and the dark grey histogram shows p-S727-STAT3 downregulation in BTK knockout RCH-ACV cells. (c) BTK knockout and mock vector transfected RCH-ACV cells were stimulated with CD40L (100ng/ml) for 20 minutes and then stained for p-S727-STAT3 (n=4 BTK knockout, n=3 controls).
In vivo infection data and correlation with immunologic parameters
At a median follow-up of 17.6 months (range 8–31), 4/17 patients (24%) experienced grade ≥2 infection: grade 4 cryptococcal meningitis in 1, grade 3 pneumonia in 1 and grade 2 upper respiratory tract infections in 2 patients (Table 1). Pre-treatment IgG levels (p=0.002) and pre-treatment PD-1 expression on CD4+ T-cells (p=0.045) were both significantly associated with increased incidence of infection (Table 1). Number of events was too small to perform multivariable analysis. There was no correlation between pre-treatment IgG levels and PD-1 expression on CD4+ T-cells. Notably, there was no association between absolute levels of CD4+ or CD8+ T-cells and infection risk, nor was there an association between IgA or IgM levels and infection risk. There was no association between PD-1 expression on CD8+ T-cells and infection. The patient who developed cryptococcal meningitis had markedly increased T-cell numbers pre-treatment (CD4 count 3454/ μL, CD8 count 12442/μL); PD-1 expression on CD4+ cells was 54.4% (the second highest level observed in this cohort), while PD-1 expression on CD8+ cells was 8.6% (in the lower quartile). Similar to previous reports,[40] we saw an increase in IgA at 12 months (median 35%, p=0.015), but no change in IgG (median −8%, p=0.2) or IgM (median 5%, p=0.33). There was a trend (p=0.09) toward increased incidence of infection in patients who failed to increase IgA levels by >50%. There was no difference in infection in patients according to changes in PD-1 expression with time on CD4+ or CD8+ T-cells (data not shown). Of note, 47% of our patient population had 17p deletion. We did not find any differences in PD-1 expression levels on CD4+ and CD8+ T cells in patients with or without this mutation (p=0.6, p=0.7 respectively), or in PD-L1 expression on CLL cells in these two groups (p=0.9).
Discussion
Besides its direct inhibitory effect on BTK signaling, ibrutinib inhibits other tyrosine kinases,[26] including ITK, an essential enzyme in Th2 cells,[41] and thus can shift the balance of T-cell responses toward the more therapeutically favorable Th1 response. This property is reflected by the reduced infection-related morbidity in animal models[41] and in patients treated with ibrutinib as shown here and by others.[17, 40] Here we report on the novel observation that ibrutinib exerts additional immunomodulatory effects in CLL through inhibition of B10 function in CLL and by downregulating the expression of two immune checkpoint molecules, PD-1 and its ligand PD-L1.
PD-L1 expression by CLL cells enables them to deliver an inhibitory signal to PD-1-positive T-cells that actively suppresses T-cell function.[42–44] In this analysis, treatment with ibrutinib induced significant and selective downregulation of the PD-1/PD-L1 immunosuppressive axis both in vitro and in vivo, with no apparent effect on other recognized inhibitory molecules, including ICOS, 2B4, CD160, OX40, TIM3 and CTLA-4. In contrast, chlorambucil therapy in patients with CLL had no apparent effect on the expression levels of PD-L1, suggesting that this phenomenon is due to a specific effect of ibrutinib, rather than simply due to non-specific disease debulking. To account for this specific effect on PD-1/PD-L1 signaling, we postulated a STAT3-mediated mechanism. STAT3 is constitutively phosphorylated on serine-727 residues in CLL cells and represents a key pathway involved in the growth and survival of these cells,[23, 27, 45] In addition to its direct role in promoting tumorigenesis, STAT3 plays a significant role in subversion of host immune responses and is responsible for the accumulation and the activation of immunosuppressive cells, such as regulatory T cells, regulatory B cells (Bregs) [8, 9] Th17 cells, and myeloid-derived suppressor cells.[46, 47] In this study, we observed a significant reduction in the levels of p-S727-STAT3 in patient-derived CLL cells after treatment with ibrutinib both in vivo and in vitro. These findings, together with reports of STAT3 control of PD-L1 expression in T-cell lymphoma and acute myeloid leukemia[30, 47] as well as in tolerogenic antigen-presenting cells,[25, 31] led us to conclude that inhibition of p-STAT3 by ibrutinib allows this agent to block the PD-1/PD-L1 pathway, enhancing the T-cell response in CLL. Indeed, STAT3-shRNA knockdown resulted in significant downregulation of PD-L1 in GFP+CD19+CD5+ CLL cells. Additionally, we demonstrated that BTK knockout can downregulate the constitutive levels of p-S727-STAT3, and abrogate CD40L-induced S727-STAT3 phosphorylation, indicating that BTK inactivation by ibrutinib can mediate a reduction in p-S727-STAT3. Since BTK possesses tyrosine kinase activity, it is unlikely that it can directly phosphorylate the 727-serine residue on STAT3. Instead, it is likely to exert this effect indirectly, possibly through activation of serine kinases such as PKC, AKT/mTOR or p38MAPK.[20, 48, 49] Additional studies are required to determine the exact kinases involved in the phosphorylation of S727-STAT3 in CLL.
We also noted a high expression of PD-1 on the surface of T cells and CLL cells, which was significantly reduced after treatment with ibrutinib. This effect was previously reported with ibrutinib[50] and lenalidomide therapy.[12] We did not find an influence of STAT3 knockdown on PD-1 expression in T-cells (Supplementary Figure 8), suggesting involvement of other mechanisms in this process. Although ibrutinib therapy consistently reduced mean absolute numbers and proportion of PD-1+ T-cells, it did not completely abrogate PD-1 expression on T-cells. Using a system that allows PD-1 expression to be modulated in otherwise identical cells, Wei et al.[51] showed a direct inverse correlation between the level of PD-1 expression and the ability of T-cells to flux Ca2+, a pivotal signaling event that controls effector T-cell functions. Thus, we suggest that even partial reductions in PD-1 expression, as seen with ibrutinib therapy, may be adequate to reverse T-cell dysfunction, although this interpretation might be tempered by the likely contributions of other negative regulatory molecules, such as CTLA-4 or TIM-3, that are not suppressed by ibrutinib. PD-1 was also expressed at high levels on CLL cells. PD-1 expression on CLL has been reported by others;[7] however, the significance of this observation remains unknown. A recent study reported an important role for PD-1 in promoting melanoma cell growth.[29] It is therefore possible that PD-1 overexpression on CLL cells may also contribute to their survival.
Recent studies in the TCL1-transgenic mouse model of CLL[52–54] and patients with CLL[8–10, 55, 56] report increased frequencies of IL-10-competent B cells with immunosuppressive properties. These cells share several phenotypic markers and functional characteristics with the recently described regulatory B10 cells.[8–10, 55, 56] Thus, the capacity of CLL cells to produce IL-10 in response to external stimuli may contribute to the immunosuppression observed in patients. We provide support for this hypothesis by demonstrating reduced IL-10 production during ibrutinib treatment of CLL cells, both in vitro and in vivo, that was linked to suppression of STAT3 phosphorylation. We conclude that, in addition to its inhibition of a survival pathway required by BTK-expressing lymphoid cancers, ibrutinib exerts its potentiating effect on immune responses through inhibition of the B10 function of CLL cells and suppression of the PD-1/PD-L1 pathway, both mediated by p-STAT3. Larger patient populations and longitudinal studies are needed to determine whether the specific immunomodulatory effects of ibrutinib will correlate with treatment response and infection risk. Ongoing studies of ibrutinib in combination with checkpoint inhibitors, especially those targeting checkpoint molecules not modulated by ibrutinib such as CTLA-4, will also be of interest.
Supplementary Material
Acknowledgments
This work was funded in part by CLL Moonshot, the CLL Global Foundation and by a research grant from Pharmacyclics. This work was supported in part by the National Institutes of Health (PO1-CA81534) of the CLL Research Consortium. The flow studies were performed in the Flow Cytometry & Cellular Imaging Facility, which is supported in part by the National Institutes of Health through M. D. Anderson’s Cancer Center Support Grant CA016672.
Footnotes
Authorship: KK and HS performed experiments, designed, interpreted, analyzed and wrote the manuscript. DH and EK assisted with experiments and commented on the manuscript. PAT analyzed data and wrote the manuscript. JAB, ZE, MK, MM, NI, AA, WW, NJ, EL, EJS provided advice on experiments and commented on the manuscript. KR designed and directed the study and wrote the manuscript.
Conflict of Interest Disclosures:
JAB, KR, NJ and WW have received research support from Pharmacyclics. WW and PAT have served on an advisory board and received honoraria from Pharmacyclics.
References
- 1.Prieto A, et al. Diminished DNA synthesis in T cells from B chronic lymphocytic leukemia after phytohemagglutinin, anti-CD3, and phorbol myristate acetate mitogenic signals. Exp Hematol. 1993;21(12):1563–9. [PubMed] [Google Scholar]
- 2.Chiorazzi N, et al. T cell helper defect in patients with chronic lymphocytic leukemia. J Immunol. 1979;122(3):1087–90. [PubMed] [Google Scholar]
- 3.Ramsay AG, et al. Chronic lymphocytic leukemia T cells show impaired immunological synapse formation that can be reversed with an immunomodulating drug. J Clin Invest. 2008;118(7):2427–37. doi: 10.1172/JCI35017. [DOI] [PMC free article] [PubMed] [Google Scholar]
- 4.D’Arena G, et al. A shorter time to the first treatment may be predicted by the absolute number of regulatory T-cells in patients with Rai stage 0 chronic lymphocytic leukemia. Am J Hematol. 2012;87(6):628–31. doi: 10.1002/ajh.23170. [DOI] [PubMed] [Google Scholar]
- 5.Weiss L, et al. Regulatory T cells predict the time to initial treatment in early stage chronic lymphocytic leukemia. Cancer. 2011;117(10):2163–9. doi: 10.1002/cncr.25752. [DOI] [PubMed] [Google Scholar]
- 6.Riches JC, et al. T cells from CLL patients exhibit features of T-cell exhaustion but retain capacity for cytokine production. Blood. 2013;121(9):1612–21. doi: 10.1182/blood-2012-09-457531. [DOI] [PMC free article] [PubMed] [Google Scholar]
- 7.Brusa D, et al. The PD-1/PD-L1 axis contributes to T-cell dysfunction in chronic lymphocytic leukemia. Haematologica. 2013;98(6):953–63. doi: 10.3324/haematol.2012.077537. [DOI] [PMC free article] [PubMed] [Google Scholar]
- 8.Blair PA, et al. CD19(+)CD24(hi)CD38(hi) B cells exhibit regulatory capacity in healthy individuals but are functionally impaired in systemic Lupus Erythematosus patients. Immunity. 2010;32(1):129–40. doi: 10.1016/j.immuni.2009.11.009. [DOI] [PubMed] [Google Scholar]
- 9.Khoder A, et al. Regulatory B cells are enriched within the IgM memory and transitional subsets in healthy donors but are deficient in chronic GVHD. Blood. 2014;124(13):2034–45. doi: 10.1182/blood-2014-04-571125. [DOI] [PMC free article] [PubMed] [Google Scholar]
- 10.DiLillo DJ, et al. Chronic lymphocytic leukemia and regulatory B cells share IL-10 competence and immunosuppressive function. Leukemia. 2013;27(1):170–82. doi: 10.1038/leu.2012.165. [DOI] [PMC free article] [PubMed] [Google Scholar]
- 11.Saulep-Easton D, et al. The BAFF receptor TACI controls IL-10 production by regulatory B cells and CLL B cells. Leukemia. 2016;30(1):163–72. doi: 10.1038/leu.2015.174. [DOI] [PMC free article] [PubMed] [Google Scholar]
- 12.Ramsay AG, et al. Multiple inhibitory ligands induce impaired T-cell immunologic synapse function in chronic lymphocytic leukemia that can be blocked with lenalidomide: establishing a reversible immune evasion mechanism in human cancer. Blood. 2012;120(7):1412–21. doi: 10.1182/blood-2012-02-411678. [DOI] [PMC free article] [PubMed] [Google Scholar]
- 13.Strati P, Shanafelt TD. Monoclonal B-cell lymphocytosis and early-stage chronic lymphocytic leukemia: diagnosis, natural history, and risk stratification. Blood. 2015;126(4):454–62. doi: 10.1182/blood-2015-02-585059. [DOI] [PMC free article] [PubMed] [Google Scholar]
- 14.Moreira J, et al. Infectious complications among individuals with clinical monoclonal B-cell lymphocytosis (MBL): a cohort study of newly diagnosed cases compared to controls. Leukemia. 2013;27(1):136–41. doi: 10.1038/leu.2012.187. [DOI] [PubMed] [Google Scholar]
- 15.Burger JA, et al. Ibrutinib as Initial Therapy for Patients with Chronic Lymphocytic Leukemia. N Engl J Med. 2015;373(25):2425–37. doi: 10.1056/NEJMoa1509388. [DOI] [PMC free article] [PubMed] [Google Scholar]
- 16.Byrd JC, et al. Ibrutinib versus Ofatumumab in Previously Treated Chronic Lymphoid Leukemia. New England Journal of Medicine. 2014;371(3):213–223. doi: 10.1056/NEJMoa1400376. [DOI] [PMC free article] [PubMed] [Google Scholar]
- 17.Byrd JC, et al. Three-year follow-up of treatment-naive and previously treated patients with CLL and SLL receiving single-agent ibrutinib. Blood. 2015;125(16):2497–506. doi: 10.1182/blood-2014-10-606038. [DOI] [PMC free article] [PubMed] [Google Scholar]
- 18.Byrd JC, et al. Targeting BTK with ibrutinib in relapsed chronic lymphocytic leukemia. N Engl J Med. 2013;369(1):32–42. doi: 10.1056/NEJMoa1215637. [DOI] [PMC free article] [PubMed] [Google Scholar]
- 19.O’Brien S, et al. Ibrutinib as initial therapy for elderly patients with chronic lymphocytic leukaemia or small lymphocytic lymphoma: an open-label, multicentre, phase 1b/2 trial. The Lancet Oncology. 2014;15(1):48–58. doi: 10.1016/S1470-2045(13)70513-8. [DOI] [PMC free article] [PubMed] [Google Scholar]
- 20.Woyach JA, Johnson AJ, Byrd JC. The B-cell receptor signaling pathway as a therapeutic target in CLL. Blood. 2012;120(6):1175–84. doi: 10.1182/blood-2012-02-362624. [DOI] [PMC free article] [PubMed] [Google Scholar]
- 21.Qiu Y, Kung HJ. Signaling network of the Btk family kinases. Oncogene. 2000;19(49):5651–61. doi: 10.1038/sj.onc.1203958. [DOI] [PubMed] [Google Scholar]
- 22.Lin TS, Mahajan S, Frank DA. STAT signaling in the pathogenesis and treatment of leukemias. Oncogene. 2000;19(21):2496–504. doi: 10.1038/sj.onc.1203486. [DOI] [PubMed] [Google Scholar]
- 23.Hazan-Halevy I, et al. STAT3 is constitutively phosphorylated on serine 727 residues, binds DNA, and activates transcription in CLL cells. Blood. 2010;115(14):2852–63. doi: 10.1182/blood-2009-10-230060. [DOI] [PMC free article] [PubMed] [Google Scholar]
- 24.Yu H, Pardoll D, Jove R. STATs in cancer inflammation and immunity: a leading role for STAT3. Nat Rev Cancer. 2009;9(11):798–809. doi: 10.1038/nrc2734. [DOI] [PMC free article] [PubMed] [Google Scholar]
- 25.Cheng F, et al. A critical role for Stat3 signaling in immune tolerance. Immunity. 2003;19(3):425–36. doi: 10.1016/s1074-7613(03)00232-2. [DOI] [PubMed] [Google Scholar]
- 26.Honigberg LA, et al. The Bruton tyrosine kinase inhibitor PCI-32765 blocks B-cell activation and is efficacious in models of autoimmune disease and B-cell malignancy. Proc Natl Acad Sci U S A. 2010;107(29):13075–80. doi: 10.1073/pnas.1004594107. [DOI] [PMC free article] [PubMed] [Google Scholar]
- 27.Rozovski U, et al. Stimulation of the B-cell receptor activates the JAK2/STAT3 signaling pathway in chronic lymphocytic leukemia cells. Blood. 2014;123(24):3797–802. doi: 10.1182/blood-2013-10-534073. [DOI] [PMC free article] [PubMed] [Google Scholar]
- 28.Kim E, et al. Ibrutinib inhibits pre-BCR+ B-cell acute lymphoblastic leukemia progression by targeting BTK and BLK. Blood. 2016 doi: 10.1182/blood-2016-06-722900. [DOI] [PMC free article] [PubMed] [Google Scholar]
- 29.Kleffel S, et al. Melanoma Cell-Intrinsic PD-1 Receptor Functions Promote Tumor Growth. Cell. 2015;162(6):1242–56. doi: 10.1016/j.cell.2015.08.052. [DOI] [PMC free article] [PubMed] [Google Scholar]
- 30.Marzec M, et al. Oncogenic kinase NPM/ALK induces through STAT3 expression of immunosuppressive protein CD274 (PD-L1, B7-H1) Proc Natl Acad Sci U S A. 2008;105(52):20852–7. doi: 10.1073/pnas.0810958105. [DOI] [PMC free article] [PubMed] [Google Scholar]
- 31.Wolfle SJ, et al. PD-L1 expression on tolerogenic APCs is controlled by STAT-3. Eur J Immunol. 2011;41(2):413–24. doi: 10.1002/eji.201040979. [DOI] [PubMed] [Google Scholar]
- 32.Zhang N, et al. The EGFR pathway is involved in the regulation of PD-L1 expression via the IL-6/JAK/STAT3 signaling pathway in EGFR-mutated non-small cell lung cancer. Int J Oncol. 2016;49(4):1360–8. doi: 10.3892/ijo.2016.3632. [DOI] [PubMed] [Google Scholar]
- 33.Wang JD, et al. Targeting Btk with ibrutinib inhibit gastric carcinoma cells growth. Am J Transl Res. 2016;8(7):3003–12. [PMC free article] [PubMed] [Google Scholar]
- 34.Ezell SA, et al. Synergistic induction of apoptosis by combination of BTK and dual mTORC1/2 inhibitors in diffuse large B cell lymphoma. Oncotarget. 2014;5(13):4990–5001. doi: 10.18632/oncotarget.2071. [DOI] [PMC free article] [PubMed] [Google Scholar]
- 35.Zucha MA, et al. Bruton’s tyrosine kinase (Btk) inhibitor ibrutinib suppresses stem-like traits in ovarian cancer. Oncotarget. 2015;6(15):13255–68. doi: 10.18632/oncotarget.3658. [DOI] [PMC free article] [PubMed] [Google Scholar]
- 36.Ishdorj G, Johnston JB, Gibson SB. Inhibition of constitutive activation of STAT3 by curcurbitacin-I (JSI-124) sensitized human B-leukemia cells to apoptosis. Mol Cancer Ther. 2010;9(12):3302–14. doi: 10.1158/1535-7163.MCT-10-0550. [DOI] [PubMed] [Google Scholar]
- 37.Blaskovich MA, et al. Discovery of JSI-124 (cucurbitacin I), a selective Janus kinase/signal transducer and activator of transcription 3 signaling pathway inhibitor with potent antitumor activity against human and murine cancer cells in mice. Cancer Res. 2003;63(6):1270–9. [PubMed] [Google Scholar]
- 38.Mizoguchi A, et al. Chronic intestinal inflammatory condition generates IL-10-producing regulatory B cell subset characterized by CD1d upregulation. Immunity. 2002;16(2):219–30. doi: 10.1016/s1074-7613(02)00274-1. [DOI] [PubMed] [Google Scholar]
- 39.Herman SE, et al. Bruton tyrosine kinase represents a promising therapeutic target for treatment of chronic lymphocytic leukemia and is effectively targeted by PCI-32765. Blood. 2011;117(23):6287–96. doi: 10.1182/blood-2011-01-328484. [DOI] [PMC free article] [PubMed] [Google Scholar]
- 40.Sun C, et al. Partial reconstitution of humoral immunity and fewer infections in patients with chronic lymphocytic leukemia treated with ibrutinib. Blood. 2015;126(19):2213–9. doi: 10.1182/blood-2015-04-639203. [DOI] [PMC free article] [PubMed] [Google Scholar]
- 41.Dubovsky JA, et al. Ibrutinib is an irreversible molecular inhibitor of ITK driving a Th1-selective pressure in T lymphocytes. Blood. 2013;122(15):2539–49. doi: 10.1182/blood-2013-06-507947. [DOI] [PMC free article] [PubMed] [Google Scholar]
- 42.Topalian SL, Drake CG, Pardoll DM. Targeting the PD-1/B7-H1(PD-L1) pathway to activate anti-tumor immunity. Curr Opin Immunol. 2012;24(2):207–12. doi: 10.1016/j.coi.2011.12.009. [DOI] [PMC free article] [PubMed] [Google Scholar]
- 43.Pardoll DM. The blockade of immune checkpoints in cancer immunotherapy. Nat Rev Cancer. 2012;12(4):252–64. doi: 10.1038/nrc3239. [DOI] [PMC free article] [PubMed] [Google Scholar]
- 44.Norde WJ, et al. Coinhibitory molecules in hematologic malignancies: targets for therapeutic intervention. Blood. 2012;120(4):728–36. doi: 10.1182/blood-2012-02-412510. [DOI] [PubMed] [Google Scholar]
- 45.Frank DA, Mahajan S, Ritz J. B lymphocytes from patients with chronic lymphocytic leukemia contain signal transducer and activator of transcription (STAT) 1 and STAT3 constitutively phosphorylated on serine residues. J Clin Invest. 1997;100(12):3140–8. doi: 10.1172/JCI119869. [DOI] [PMC free article] [PubMed] [Google Scholar]
- 46.Yu H, et al. Revisiting STAT3 signalling in cancer: new and unexpected biological functions. Nat Rev Cancer. 2014;14(11):736–46. doi: 10.1038/nrc3818. [DOI] [PubMed] [Google Scholar]
- 47.Hossain DM, et al. Leukemia cell-targeted STAT3 silencing and TLR9 triggering generate systemic antitumor immunity. Blood. 2014;123(1):15–25. doi: 10.1182/blood-2013-07-517987. [DOI] [PMC free article] [PubMed] [Google Scholar]
- 48.Akinleye A, et al. Ibrutinib and novel BTK inhibitors in clinical development. J Hematol Oncol. 2013;6:59. doi: 10.1186/1756-8722-6-59. [DOI] [PMC free article] [PubMed] [Google Scholar]
- 49.Decker T, Kovarik P. Serine phosphorylation of STATs. Oncogene. 2000;19(21):2628–37. doi: 10.1038/sj.onc.1203481. [DOI] [PubMed] [Google Scholar]
- 50.Fraietta JA, et al. Ibrutinib enhances chimeric antigen receptor T-cell engraftment and efficacy in leukemia. Blood. 2016;127(9):1117–27. doi: 10.1182/blood-2015-11-679134. [DOI] [PMC free article] [PubMed] [Google Scholar]
- 51.Wei F, et al. Strength of PD-1 signaling differentially affects T-cell effector functions. Proc Natl Acad Sci U S A. 2013;110(27):E2480–9. doi: 10.1073/pnas.1305394110. [DOI] [PMC free article] [PubMed] [Google Scholar]
- 52.Gorgun G, et al. E(mu)-TCL1 mice represent a model for immunotherapeutic reversal of chronic lymphocytic leukemia-induced T-cell dysfunction. Proc Natl Acad Sci U S A. 2009;106(15):6250–5. doi: 10.1073/pnas.0901166106. [DOI] [PMC free article] [PubMed] [Google Scholar]
- 53.Yan XJ, et al. B cell receptors in TCL1 transgenic mice resemble those of aggressive, treatment-resistant human chronic lymphocytic leukemia. Proc Natl Acad Sci U S A. 2006;103(31):11713–8. doi: 10.1073/pnas.0604564103. [DOI] [PMC free article] [PubMed] [Google Scholar]
- 54.Johnson AJ, et al. Characterization of the TCL-1 transgenic mouse as a preclinical drug development tool for human chronic lymphocytic leukemia. Blood. 2006;108(4):1334–8. doi: 10.1182/blood-2005-12-011213. [DOI] [PMC free article] [PubMed] [Google Scholar]
- 55.Iwata Y, et al. Characterization of a rare IL-10-competent B-cell subset in humans that parallels mouse regulatory B10 cells. Blood. 2011;117(2):530–41. doi: 10.1182/blood-2010-07-294249. [DOI] [PMC free article] [PubMed] [Google Scholar]
- 56.Yanaba K, et al. A regulatory B cell subset with a unique CD1dhiCD5+ phenotype controls T cell-dependent inflammatory responses. Immunity. 2008;28(5):639–50. doi: 10.1016/j.immuni.2008.03.017. [DOI] [PubMed] [Google Scholar]
Associated Data
This section collects any data citations, data availability statements, or supplementary materials included in this article.


