

Abstract
The RNA-guided endonuclease Cas9 can be converted into a programmable transcriptional repressor, yet inefficiencies in target gene silencing have limited its utility. Here we describe an improved Cas9 repressor based on the C-terminal fusion of a rationally designed bipartite repressor domain, KRAB-MeCP2, to nuclease-null Cas9. We demonstrate the system’s superiority in silencing coding and non-coding genes, simultaneously repressing a series of target genes, improving the results of single and dual gRNA library screens, and enabling new architectures of synthetic genetic circuits.
INTRODUCTION
The Clustered Regularly Interspaced Short Palindromic Repeats (CRISPR)-Cas9 system, which mediates adaptive immunity within bacteria and archaea, has emerged as a powerful tool for genome engineering1-7. Cas9 is an RNA-guided endonuclease that can be directed to specific DNA sequences through complementarity between the Cas9-associated guide RNA (gRNA) and the target locus, provided that a protospacer-adjacent motif (PAM) is proximal to the target. Because changing the target locus only requires alteration of the delivered gRNA, Cas9 has been quickly adopted for selective gene ablation and for performing unbiased genome-wide screens8–11. However, Cas9 cutting can lead to cellular toxicity due to the formation of DNA double-strand breaks and Cas9-generated modifications are irreversible, which limit its applications12.
Within Cas9, the amino acids critical for DNA catalysis can be mutated to generate a nuclease-dead Cas9 (dCas9), which remains competent for DNA binding but lacks endonuclease activity13. When directed towards the transcriptional start site (TSS) of a gene, dCas9 can physically block RNA polymerase passage, thereby leading to gene silencing13. Further improvement in transcriptional inhibition can be achieved by addition of repression domains such as the Krüppel-associated box (KRAB) to dCas9, with the resultant dCas9-KRAB fusion protein being the current gold standard for dCas9-based repression studies14-17. While widely adopted, the dCas9-KRAB system suffers from inefficient knockdown and poor performance when compared to Cas9 nuclease-based methods14,18-19.
Previous work has shown that by fusing several transcriptional regulators to dCas9 in tandem, a synergistic increase in activity can be achieved20-23, with initial efforts focused on building more potent transcriptional activators. Here we assemble and screen combinations of potent repressor domains to engineer a highly effective dCas9-KRAB-MeCP2 transcriptional repressor.
RESULTS
Identification of dCas9-KRAB-MeCP2
To begin to design a more potent Cas9 repressor, we separately fused more than 20 different effector domains known to play a role in transcriptional regulation and gene silencing to the C-terminus of dCas9. The resulting dCas9 fusion proteins were then transfected into HEK293T cells along with a gRNA targeting the promoter of an enhanced yellow fluorescent protein (EYFP) reporter gene. The majority of dCas9 fusions were able to repress EYFP expression, with a few exhibiting greater repression (up to 8-fold) compared to dCas9 (Supplementary Fig. 1). Next we generated a library of dCas9 bipartite repressors consisting of the commonly used KRAB repressor and the six top-performing domains from our initial screen (MeCP2, SIN3A, HDT1, MBD2B, NIPP1, and HP1A). Our library contained all pairwise repeating and non-repeating combinations of the seven selected domains. As expected, many bipartite fusion proteins showed stronger improvement, ranging from 5- to 60-fold greater repression of EYFP compared to dCas9 (Supplementary Fig. 2).
Having done our initial studies with a synthetic reporter, we next determined whether our most potent repressors could also downregulate endogenous target genes. We selected nine bipartite repressors for further characterization. Each of the dCas9 variants was co-transfected into HEK293T cells along with a set of gRNAs targeting four different endogenous genes. While varying degrees of gene repression were observed depending upon the target gene, the dCas9 repressor consisting of KRAB and the TRD domain of MeCP2, named dCas9-KRAB-MeCP2 (Fig. 1a and Supplementary Table 1), was the most potent across all targets (Supplementary Fig. 3). We also generated a series of tripartite fusion proteins to test whether further improvements in repression could be achieved by employing three different effector domains (Supplementary Fig. 4). No improvement in gene silencing was obtained using any of the designed tripartite repressors as compared to the dCas9-KRAB-MeCP2 protein (Supplementary Fig. 5). The lack of improved repression with the tripartite repressors could be due to the domains recruiting identical secondary effectors that have already been recruited. It is also possible that the extent to which the domains fold and function properly decreases as greater numbers of effectors are fused together.
Figure 1.
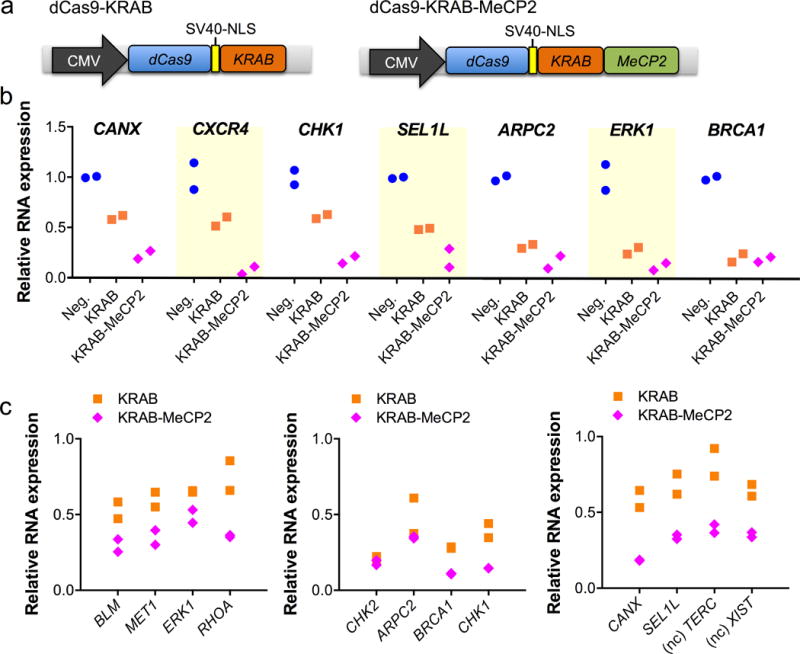
Repression of endogenous genes using dCas9-KRAB-MeCP2. (a) Schematic of dCAS9-KRAB and dCas9-KRAB-MeCP2 repressors. NLS=nuclear localization signal. (b) RNA expression of targeted single gene. n=2 biologically independent samples (cell cultures). (c) RNA expression during three separate multiplex repression studies. In each study, four different genes were targeted simultaneously. Two non-coding (nc) genes, XIST and TERC, were studied. n=2 biologically independent samples (cell cultures).
To understand the contributions of KRAB and MeCP2 to the overall effect, we performed a side-by-side comparison of different dCas9 fusion proteins consisting KRAB or MeCP2 (Supplementary Fig. 6). The dCas9-KRAB-MeCP2 fusion outperformed either KRAB or MeCP2 either as single or double fusions to dCas9, suggesting that it is the combined effect of both domains leading to increased gene repression.
Improved repression of endogenous gene using dCas9-KRAB-MeCP2
We next systematically compared the activity of dCas9-KRAB-MeCP2 to that of the current gold-standard dCas9-KRAB repressor by targeting a wide range of endogenous loci in HEK293T cells. For the majority of single genes tested, dCas9-KRAB-MeCP2 showed improved repression (Fig. 1b). To test whether dCas9-KRAB-MeCP2 could downregulate the expression of multiple genes more effectively, we co-transfected four gRNAs each targeting a different locus into HEK293T cells (Fig. 1c). dCas9-KRAB-MeCP2 showed improved multiplexed repression for all genes tested except for two where it showed similar activity to dCas9-KRAB.
We next designed an array of gRNAs targeting both the template and non-template strands ranging from 1-kb upstream to 1-kb downstream of the TSS for two different genes (CANX and SYVN1). 15 out of 25 gRNAs tested showed improved repression with dCas9-KRAB-MeCP2 as compared to dCas9-KRAB. These results were independent of the DNA strand targeted and whether or not the gRNA was directed outside of the previously characterized optimal targeting window for repression15 (Fig. 2a-b). Initial studies with CRISPR repressors suggested that using multiple gRNAs targeting the same locus led to marked improvement in gene knockdown13. In contrast to these results, neither dCas9-KRAB nor dCas9-KRAB-MeCP2 showed improved repression when multiple guides against the same target were used; rather, they exhibited an activity that appeared to be dictated by the most potent guide within the set tested, consistent with recent observations24 (Fig. 2b-c).
Figure 2.
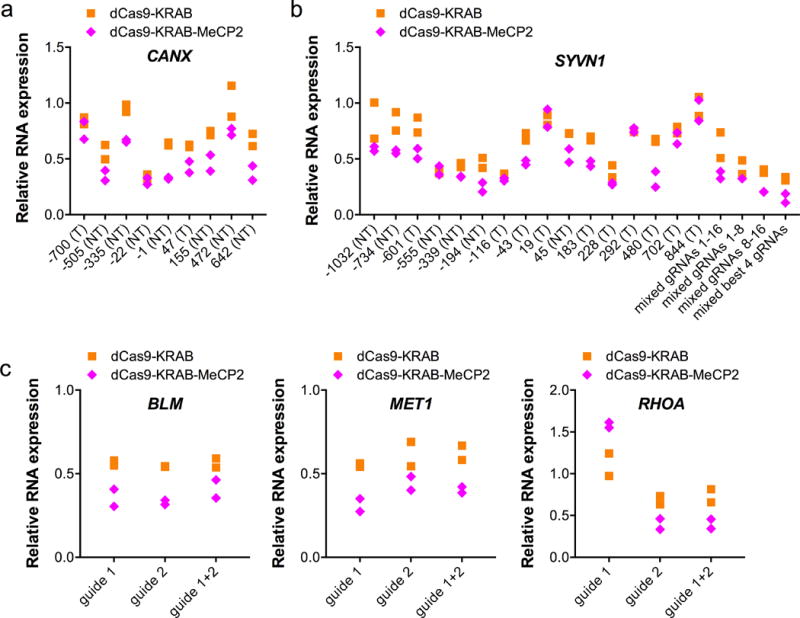
dCas9-KRAB-MeCP paired with gRNA at various positions. (a) An array of gRNAs was design to target 1-kb upstream to 1-kb downstream of the TSS for CANX. Shown is RNA expression of CANX when different gRNA was used. T=template strand, NT=non-template strand. n=2 biologically independent samples (cell cultures). (b) Shown is RNA expression of SYVN1 when individual or combinations of different gRNAs were used. n=2 biologically independent samples (cell cultures). (c) RNA expression of the indicated target genes using one or two gRNAs. n=2 biologically independent samples (cell cultures).
The effect of dCas9-KRAB-MeCP2 is highly specific
Effector domains recruiting chromatin modifiers can cause widespread epigenetic changes over large regions of DNA25-27. We evaluated the targeting specificity of dCas9-KRAB-MeCP2 by probing the expression of neighboring genes when either CXCR4 or SYVN1 was targeted (Supplementary Fig. 7a-b). No significant off-target effect was observed on the neighboring genes examined.
We next targeted the CXCR4 gene and performed whole-transcriptome sequencing (RNA-seq) to evaluate the specificity of dCas9-KRAB-MeCP2 on a genome-wide scale. Results were compared to those obtained from cells transfected with either dCas9 or dCas9-KRAB. dCas9-KRAB-MeCP2 showed the strongest repression signal for the target gene, CXCR4. The global transcriptome profiles of all dCas9-repressors were highly correlated with that of the negative control, cells transfected with gRNA alone (Fig. 3 and Supplementary Fig. 7c), although an overlapping set of differentially expressed (DE) genes was also observed (Supplementary Fig. 8-9, Supplementary Table 2-3, and Supplementary Data 1). Of the few DE genes that showed downregulation, none exhibited a near-sequence match to the CXCR4-targeting gRNA, suggesting that these changes did not result from inappropriate targeting of repressors to the loci with altered expression.
Figure 3.
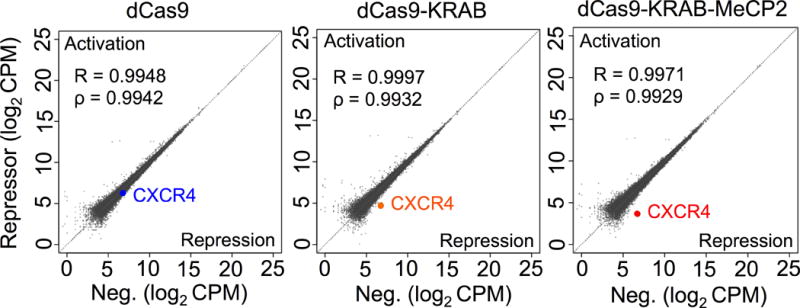
dCas9-KRAB-MeCP2-mediated repression is highly specific in human cells. RNA-seq analyses of HEK293T cells transfected with a gRNA targeting CXCR4 along with dCas9, dCas9-KRAB or dCas9-KRAB-MeCP2 repressors. Data are normalized and log2-transformed counts per million (CPM) values are plotted for each repressor (y-axis) versus that of a negative control transfected with gRNA alone (x-axis). Pearson’s and Spearman’s correlation coefficients are provided for each repressor. n=2 biologically independent samples (cell cultures).
dCas9-KRAB-MeCP2 efficiently suppresses genes when used at library scales
One of the most powerful uses of CRISPR-Cas9 technology is to enable facile genome-wide screens. To determine whether our tool was amenable to such screening, we generated heterogenous populations of human haploid (HAP1) cells stably expressing either dCas9, dCas9-KRAB, or dCas9-KRAB-MeCP2. RNA expression levels of the dCas9-KRAB and dCas9-KRAB-MeCP2 repressors were similar in these haploid lines but were significantly lower than that of dCas9 alone (Supplementary Fig. 10a). When endogenous genes were targeted, cells containing dCas9-KRAB-MeCP2 showed a stronger repression compared to cells with other dCas9 constructs (Supplementary Fig. 10b).
Genes that are essential for cellular function serve as a useful set of targets for comparing the relative performance of different screening platforms19. Consequently, we infected each of our dCas9-expressing lines, as well as wild-type HAP1 cells, with a lentiviral single-gRNA (sgRNA) library targeting an assortment of essential and non-essential genes. We then passaged the cells over a period of 14 days and quantified the extent to which the various sgRNAs were depleted over time. In the screen, cells-expressing dCas9-KRAB-MeCP2 showed the strongest depletion for guides targeting essential genes relative to non-essential genes (p= 3.52 × 10−80 using dCas9-KRAB-MeCP2 vs. 5.41 × 10⁻¹⁹ using dCas9-KRAB at day 14) (Fig. 4a, Supplementary Table 4, and Supplementary Data 2). In addition, strong depletion signals (up to 256-fold depletion) were observed with dCas9-KRAB-MeCP2 as early as day 7, compared to the mostly weak signals exhibited by dCas9-KRAB (up to 2-fold depletion). No depletion in sgRNAs targeting essential genes was observed for wild-type cells, indicating that our results were not due to technical artifacts (Supplementary Fig. 10c).
Figure 4.
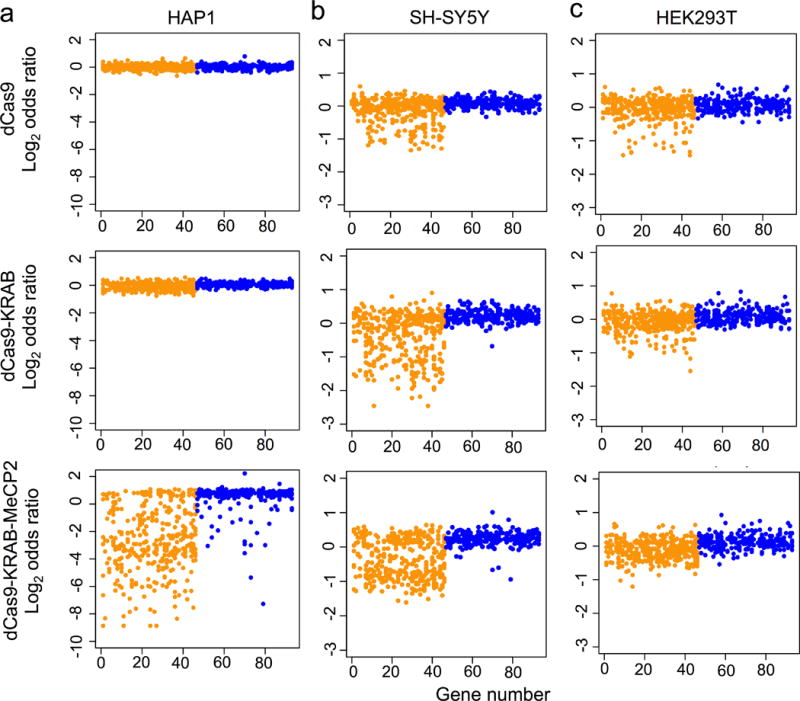
dCas9-KRAB-MeCP2 outperforms previous tools in screens of gene essentiality. (a) Shown are log2 odd ratios of all sgRNA constructs as compared to the HAP1 wild-type cells at days 14. sgRNAs targeting essential genes are marked in orange and sgRNAs targeting non-essential genes are marked in blue. A similar experiment was repeated in (b) SH-SY5Y and (c) HEK293T cells. Shown are log2 odd ratios of all sgRNA constructs as compared to the respective wild-type cells at days 14.
To test the generality of our system, we repeated the above screen in SH-SY5Y, a near-diploid human neuroblastoma cell line (Fig. 4b and Supplementary Data 3), and HEK293T (Fig. 4c and Supplementary Data 4). While the overall depletion signal was not as strong as that observed in HAP1 cells, cell lines containing dCas9-KRAB-MeCP2 showed a greater degree of depletion for sgRNAs targeting essential genes at all times of measurement compared to previous technologies (Supplementary Table 5-6).
We plotted sgRNA depletion as a function of position from the TSS for the several hundred essential gene-targeting sgRNAs used (Supplementary Fig. 11a and Supplementary Table 7). As expected, sgRNAs positioned within the previously identified optimal targeting window (-50bp to +200bp from TSS) showed a higher likelihood of being depleted compared to sgRNAs positioned outside of the window (Supplementary Fig. 11b). Regardless of targeting position, dCas9-KRAB-MeCP2 outperformed dCas9-KRAB (Supplementary Fig. 11c).
In the dCas9-KRAB-MECP2 screen, a few of the sgRNAs designed to target non-essential genes also showed marked depletion. We found that a subset of these sgRNAs also showed depletion when combined with either dCas9-KRAB or dCas9 alone (Supplementary Fig. 12 and Supplementary Data 5), indicating that the observed off-target binding is not only a property of our improved repressor. Furthermore, a few sgRNAs that showed unexpected depletion within the HAP1 screen also showed depletion within the SH-SY5Y screen for either dCas9-KRAB-MeCP2 or dCas9-KRAB (Supplementary Data 5). These data suggest that there are consistent off-target sites that these unique sgRNAs are binding to which affect growth. We hypothesize that because dCas9-KRAB-MeCP2 is a more potent repressor, signals from these off-target binding events are more readily observed.
To assess the overall performance of dCas9-KRAB-MeCP2 within screening environments, we used the conventional MAGeCK analysis pipeline28. MAGeCK takes into account the behavior of all sgRNAs against a given gene when determining whether it is subject to selection during the screen. In HAP1 cells, dCas9-KRAB-MeCP2 correctly identified 21 essential genes compared to only 3 identified by dCas9-KRAB at day 14. Similarly in HEK293T cells, dCas9-KRAB-MeCP2 identified 11 essential genes compared to 5 identified by dCas9-KRAB. In SH-SY5Y cells, dCas9-KRAB-MeCP2 showed similar performance by identifying 11 essential genes compared to 10 identified by dCas9-KRAB. No non-essential genes were deemed significant in any of the experimental groups, (Supplementary Fig. 13 and Supplementary Data 6). These results support that dCas9-KRAB-MeCP2 is a more potent tool for screening gene essentiality compared to dCas9-KRAB.
dCas9-KRAB-MeCP2 improves genetic interaction mapping
To further assess the capabilities of dCas9-KRAB-MeCP2, we performed a combinatorial repression screen. Our screening library consisted of dual guides against genes involved in DNA repair along with a set of positive and negative controls. Within our library each construct contained two gRNAs, with the majority of gRNA pairs targeted to two different genes (Supplementary Table 8). Similar to the single gene targeting screens, samples for the dual guide screen that contained dCas9-KRAB-MeCP2 showed improved selection for or against specific gRNA pairs over time compared to samples containing dCas9-KRAB (Fig. 5a).
Figure 5.
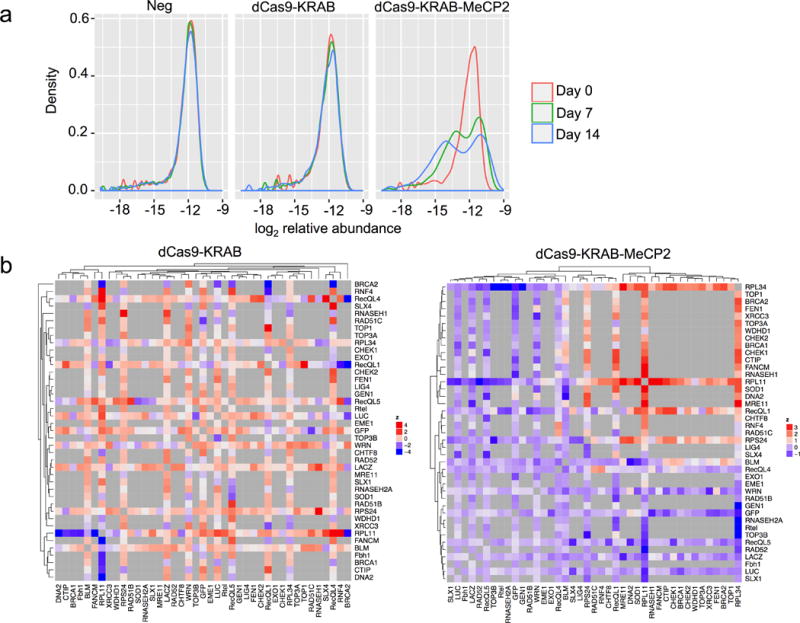
dCas9-KRAB-MeCP2 improves genetic interaction mapping. (a) A density plot showing negative and positive selection pressure against gRNA pairs over time. (b) Shown is the hierarchical clustered heatmap of genetic interactions for dCas9-KRAB and dCas9-KRAB-MeCP2. Only the screen using dCas9-KRAB-MeCP2 showed a discernible clustering structure.
We next estimated the fitness effects for each individual gRNA and quantified genetic interactions (indicated by pi-scores) between gene pairs29 (See Supplementary Note 1 for interpretation of pi-scores). Specifically, we tested whether distant gene pairs tend to engage more in negative genetic interactions, while gene pairs that form protein complexes tend to have positive pi-scores30,31. For the negative control and dCas9-KRAB screens, no clear correlation was observed between gene distance in the protein complex network and pi-scores. In contrast, the expected effect was observed in dCas9-KRAB-MeCP2 screens (Supplementary Fig. 14a-b).
Clustering of genetic interaction profiles provides a quantitative measure of functional similarity32. Among the samples, only dCas9-KRAB-MeCP2-containing cells showed a discernible clustering structure (Fig. 5b, Supplementary Fig. 14c-d, and Supplementary Data 7). We subsequently looked at the gene pairs with the strongest interactions within the dCas9-KRAB-MeCP2 dataset. One of the most significant negative interactions was between BLM and SOD1, in line with previous data showing this to be a synthetically lethal interaction33. We also detected a negative genetic interaction between BLM and DNA2, consistent with results from yeast showing that the BLM homologue, SGS1, could rescue DNA2 deficiency, and absence of both genes cause enhanced DNA damage sensitivity34,35. Analyses of the positive genetic interactions revealed a strong interaction between CHEK1 and RECQL1. This result is consistent with previous knowledge that a loss of RECQL1 led to activation of CHEK1 signaling, which causes cell cycle arrest. Thus in cells lacking RECQL1, the growth arrest caused by CHEK1 activation should be alleviated upon its removal, enabling the double mutants to grow better36. When the same interactions are examined within cells expressing dCas9-KRAB, either no interaction is observed (BLM-DNA2) or the interaction is the opposite of what is expected (BLM-SOD1 and CHEK1-RECQL1).
Superiority of dCas9-KRAB-MeCP2 in synthetic gene circuits
We next performed five separate experiments highlighting the benefit of dCas9-KRAB-MeCP2 in the context of synthetic gene circuits. First, we constructed a simple repressor circuit in which EYFP was repressed by a U6-driven gRNA in combination with different dCas9 repressors. Approximately 400-fold repression was observed using dCas9-KRAB-MeCP2, while earlier dCas9 variants repressed <60-fold (Supplementary Figure 15a).
Next, these U6-driven gRNAs were added to a two-layer repressor circuit. Here, an sgRNA/dCas9 pair repressed the expression of a TALE repressor, which in turn repressed expression of EYFP. EYFP should be repressed in the absence of sgRNA, but should be derepressed upon addition of sgRNA to the circuit, depending on the strength of the dCas9 repressor. As expected, dCas9-Krab-MeCP2 led to higher levels of derepression of EYFP, to the extent that it was indistinguishable from EYFP expressed in the absence of TALE repressors (Supplementary Fig. 15b).
Because inducible circuits are desirable within many synthetic gene networks, we reconstructed two previously described circuits in which gRNA expression was driven by a doxycycline-inducible RNA polymerase II (Pol II) promoter37. While similar constructs have previously been shown to be functional, their activity has been inferior to that of constructs in which gRNA expression is under the control of Pol III promoters37. In the context of a simple repressor circuit, dCas9-KRAB-MeCP2 significantly increased the efficiency of Pol II-driven gRNA repression (Fig. 6a). We next employed it within a Pol II-driven two-layer cascade. Unlike previous dCas9 tools, we observed, for the first time, a clear transfer of information using dCas9-KRAB-MeCP2, which showed the expected changes in EYFP expression between induced and uninduced states (Fig. 6b).
Figure 6.
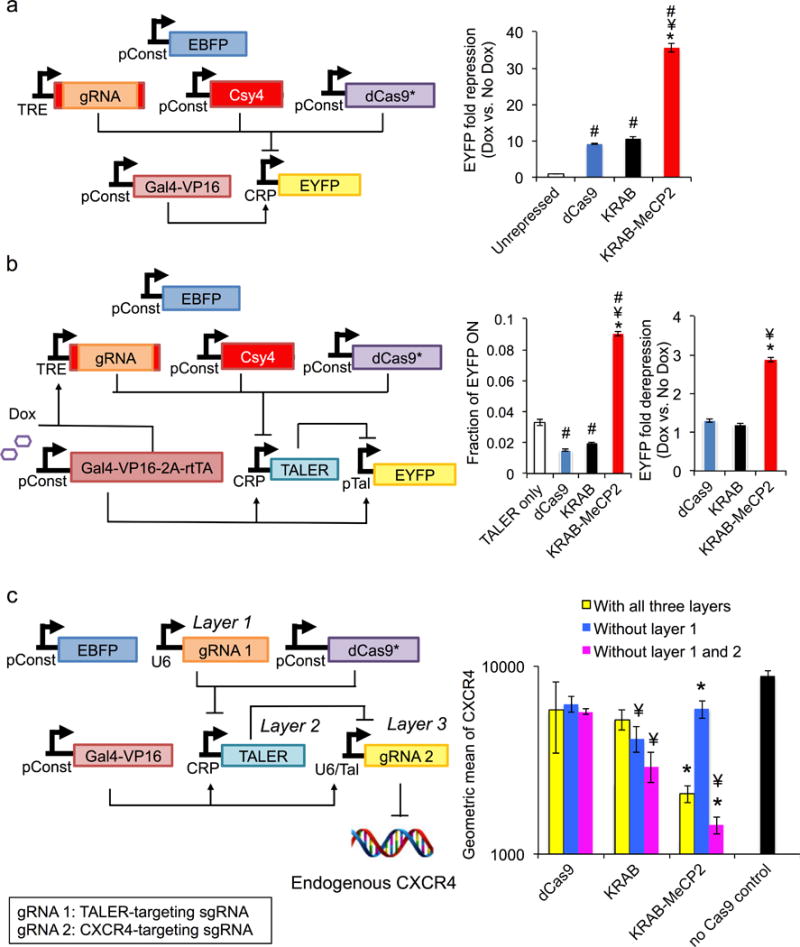
Superiority of dCas9-Krab-MeCP2 in regulating complex synthetic circuits. (a) When expressed from a doxycycline inducible Pol II promoter and edited by Csy4, gRNA showed improved repression of EYFP when co-expressed with dCas9-KRAB-MeCP2, relative to dCas9 or dCas9-KRAB. n=4 biologically independent samples (cell cultures). (b) Inducible Pol II-expressed gRNA edited by Csy4 and complexed with dCas9-KRAB-MeCP2 showed improved performance in a two-tier repressor cascade. n=4 biologically independent samples (cell cultures). (c) With full circuit, dCas9-KRAB-MeCP2 decreases CXCR4 protein level. In absence of layer 1, dCas9-KRAB-MeCP2 mediates derepression of CXCR4. In absence of layers 1 and 2, the repressor surpasses dCas9 and dCas9-KRAB in repressing CXCR4 levels. n=3 biologically independent samples (cell cultures). For a-c, data are presented as mean ± s.e.m. One-sided Student T-test was performed for all statistical comparison. # p< 0.05 vs. unrepressed or TALER only control, ¥ p< 0.05 v.s. dCas9, and *p < 0.05 v.s. dCas9-KRAB.
We next sought to determine whether dCas9-KRAB-MeCP2 could be used to create a functional three-layer cascade with an output being expression of an endogenous gene. We constructed a circuit in which a U6-driven gRNA/dCas9 complex represses a TALE repressor (layer1). The TALE repressor suppresses another gRNA (layer 2), which targets the endogenous CXCR4 locus and mediates repression of this gene when combined with dCas9 repressors (layer 3). We tested the different repressors in circuits containing either all three layers, layers 2 and 3, or layer 3 alone, and we measured the surface expression of CXCR4. Our results demonstrate that only dCas9-KRAB-MeCP2 can facilitate transfer of information in all settings, with CXCR4 levels showing the expected expression patterns (Fig. 6c).
DISCUSSION
Here we identify the multimeric fusion protein dCas9-KRAB-MeCP2 as a highly potent transcriptional repressor. Using this tool we observed improved knockdown of both reporter and endogenous genes. Furthermore, our data show that dCas9-KRAB-MeCP2 outperforms previous dCas9 repressors in identifying genes essential for cell survival, detecting genetic interactions between genes, and actuating complex regulatory activity within various synthetic gene circuits. These data demonstrate the power of our tool to assist in the interrogation and selective regulation of the mammalian genome.
Similar to our work with transcriptional activators, the improved performance of dCas9-KRAB-MeCP2 repressor is likely due to the distinct mechanisms by which each of the fused domains function. The KRAB domain represses transcription via interaction with KAP1, which functions as a scaffold to recruit co-repressors including heterochromatin protein 1 (HP1), histone deacetylases, and SETDB138-40. The transcription repression domain (TRD) of MeCP2 binds to a different set of transcriptional regulators including the DNA methyltransferase DNMT1 and the SIN3A-histone deacetylase corepressor complex41-44.
RNA-seq data suggest that dCas9-KRAB-MeCP2 is not inducing additional gross differences in the cellular transcriptome outside of those already produced by current methods. It is worth pointing out that in our screen targeting essential genes, the dCas9-KRAB-MECP2-expressing cells exhibited a much more robust depletion, but a few of the guides designed to target non-essential genes also showed marked depletion. Further investigations are needed to clarify the source of these effects. Although not utilized in these studies, various methods to improve Cas9 specificity have been reported in the literature such as using a “high-fidelity” Cas9 protein or truncated sgRNAs, each of which have been shown to help mitigate off-target activity45,46.
For the majority of loci tested, dCas9-KRAB-MeCP2 achieved greater degrees of gene repression than dCas9-KRAB. Yet, there were a few loci for which we observed only modest repression from either tool. Potential causes for variations in gene silencing include poorly functional guides, insufficient time between targeting and measurement of gene expression, local chromatin effects, competition for binding between Cas9 and endogenous transcriptional regulators, and interference from already present epigenetic marks preventing further modification by our tools47–49. For the most part, these inefficiencies in repression can be overcome by simply targeting the same gene with an array of different sgRNAs. The utility of this strategy is shown in our essential gene screen. For most essential genes tested, at least one of the targeting guides exhibited the expected levels of depletion, with the most robust effects observed in samples expressing dCas9-KRAB-MeCP2.
ONLINE METHODS
Repressor and gRNA plasmid construction
Repressor fusions were initially cloned into a modified Gateway-compatible dCas9 plasmid backbone50. The bipartite and tripartite dCas9 fusions were cloned into a modified Golden Gate-compatible version of the dCas9-m4 vector (Addgene plasmid #47316). DNA fragments containing the specific domains of interest were then PCR amplified and cloned into each of our vectors using either Gateway or Golden Gate assembly methods. For bipartite and tripartite repressors, a glycine-serine-rich linker was placed in between the different domains. The sequences, as well as species origin, of all protein domains used to construct the different repressors are listed in Supplementary Data 8. The sequences of dCas9-KRAB (Addgene plasmid #110820) dCas9-KRAB-MeCP2 (Addgene plasmid #110821) are provided in Supplementary Table 1. All other vectors are available upon request.
All gRNAs for endogenous gene repression were selected to bind within -50 to +200 bp around the gene TSS, unless the position was specified otherwise. Target genes were selected based on use in previous publications or because they were of particular interest to our research group, such as DNA repair and cell motility genes14,15. To generate sgRNA expression plasmids, oligonucleotides containing gRNA sequence were cloned into a pSB700 vector (Addgene plasmid #64046) or variants with different selection markers downstream of a U6 promoter using Golden Gate assembly methods. Sequences for gRNAs are listed in Supplementary Table 9.
Cell culture and transfections
HEK293T cells (gift from P. Mali, University of California, San Diego) were maintained in Dulbecco’s Modified Eagle’s Medium (DMEM) (Life Technologies) with 10% heat-inactivated fetal bovine serum (FBS) (Life Technologies) and penicillin-streptomycin (Life Technologies) as previously described50. Approximately 50,000 cells were seeded per well in 24-well plates and next day transfected using lipofectamine 2000 (Life Technologies) as previously described50. 200 ng of dCas9 repressors, 50 ng of sgRNA, and 60 ng of EYFP reporter along with 50 ng of Gal4-VP16 (reporter assay only) were delivered to each well of cells. 50 ng of puromycin-resistant plasmids (endogenous gene study) or 25 ng EBFP-expressing plasmids (reporter assay) were co-transfected to select for transfected cells. 10 ng of each sgRNA per gene were used during multiplex repression. For the endogenous gene study, cells were treated with 3 ug/ml of puromycin at 24 hours post-transfection to enrich for transfected cells. 48 or 72 hours after transfection cells were collected to assay by flow cytometry or lysed for RNA purification, for reporter and endogenous experiments, respectively. Cells were tested every 3 months for mycoplasma contamination and consistently tested negative.
Flow cytometry for reporter assays
Reporter assays were performed by targeting dCas9 fusion proteins to a Gal4-VP16 regulated EYFP reporter gene. The reporter plasmid contains an sgRNA-binding sequence (tacctcatcaggaacatgt) followed by a PAM (tgg). HEK293T cells were transfected with the reporter, Gal4-VP16 activator, sgRNA, and the indicated dCas9 fusion proteins along with an EBFP-expressing plasmid to aide in analyzing only cells that were transfected. Cells were assayed using flow cytometry 48 hours after transfection. Analysis was performed on cells expressing > 103 arbitrary units of EBFP2 and the median of EYFP intensity within the gated population was quantified using FlowJo.
Quantitative real-time polymerase chain reaction (qPCR) to analyze endogenous gene expression
Total RNA was extracted using RNAeasy Plus mini kit (Qiagen). 500 ng of RNA was used to make cDNA using qScript cDNA synthesis kit (Quanta Bio). KAPA SYBR Fast universal 2x quantitative PCR master mix (KAPA Biosystems) with 0.5 ul of cDNA and 0.4 ul of each forward and reverse primers at 10 uM were used for qPCR, with cycling conditions: 95 °C for 3 min, and 40 cycles of 95 °C for 10 sec, 55 °C for 20 sec, and 72 °C for 30 sec. RNA expression was normalized to the housekeeping gene ACTB and relative gene expression was calculated using 2−ΔΔCT method51. Sequences for qPCR primers are listed in Supplementary Table 10.
Statistical analysis
For reporter and endogenous gene targeting studies, at least two biologically independent samples (independent transfections) per group were used. Statistical comparison was performed in experiments using sample sizes (n) of 3 or 4 biologically independent samples using one-tailed Student’s T-test with a p-value < 0.05 as the threshold for significance. The exact n values used to calculate statistics are described in the associated figure legends. Statistical analyses for RNA-seq, gRNA library screening, and circuit experiments are described in Supplementary Note 2-5.
Whole transcriptome RNA sequencing (RNA-seq) for analyzing repressor specificity
For each sample, total RNA was extracted using RNeasy mini kit (Qiagen) and treated with on-column RNase-free DNase I (Qiagen) following manufacturer’s instructions. 1 ug of RNA from each sample was used for library preparation. RNA-seq libraries were constructed using TruSeq Stranded Total RNA Library Prep Kit with Ribo-Zero Gold (Illumina) designed for cytoplasmic and mitochondrial rRNA depletion. All coding RNA and certain forms of non-coding RNA were isolated using bead-based rRNA depletion, followed by cDNA synthesis, and PCR amplification as per the manufacturer’s protocol. Final libraries were analyzed on TapeStation, quantified with qPCR, pooled together, and run on one lane of an Illumina HiSeq 2500 using 2 × 100-bp paired-end reads. The Illumina paired-end adapter sequences were removed from the raw reads using Cutadapt v1.8.1. The TruSeq adaptor sequence 5′- AGATCGGAAGAGCACACGTCTGAACTCCAGTCAC-3′ was used for read 1, and its reverse complement, 3′-AGATCGGAAGAGCGTCGTGTAGGGAAAGAGTGTAGATCTCGGTGGTCGCCGTATCATT-5′ was used for read 2.
Next, RNA libraries were processed using a pipeline that includes STAR-HtSeq-EdgeR for alignment, count generation, and gene expression. Briefly, STAR aligner (v. 2.4.0j) was used to map the reads to hg19, and HtSeq was used to generate gene expression counts. For gene expression and differential expression (DE) analyses, edgeR, limma, and custom R scripts were used to filter out very lowly expressed genes (with a cutoff of 1 count in at least 2 samples), calculate normalization factors, and compute effective library sizes using Trimmed Mean of M Values (TMM) normalization. Gene count is then reported in counts per million (CPM) and correlations are calculated on log2-transformed data. Finally, to determine the most biologically significant differentially expressed genes, relative gene expression was performed by fold-change thresholding (log2 FC >1.5) and ranking by p-value. See Supplementary Note 2 for details in DE analysis. A small set of genes in addition to the target gene CXCR4 showed decreases (log2 FC < 1.5) in their transcript expression (Supplementary Table 3). These genes were further analyzed to assess whether the observed DE was caused by non-specific binding of our gRNA. Genomic sequences of 2 kb upstream and downstream from TSS of those genes were examined by searching for the presence of a full-length gRNA binding site (up to 6 mismatches for near matches) as well as searching for the seed region of the gRNA alone (8 bp in proximal to PAM).
Cell culture and generation repressor-expressing stable cell lines
HAP1 cells (Horizon Discovery) were maintained in Iscove’s Modified Dulbecco’s Medium (IMDM) with 10% FBS (Life Technologies) and penicillin-streptomycin (Life Technologies) following the manufacturer’s instructions. SH-SY5Y (ATCC) was maintained in 1:1 mixture of Eagle’s Minimum Essential Medium (EMEM) and F12 Medium (ATCC) with 10% FBS and penicillin-streptomycin following the manufacturer’s instructions. To generate stable dCas9 repressor-expressing cell lines, approximately 30,000-50,000 cells were transfected in 24-well plates with 400 ng of dCas9 repressor-containing PiggyBac expression plasmids (Addgene plasmid #110822, #110823, #110824) and 100 ng of transposase vector using lipofectamine 3000 (Life Technologies) as previously described50. Media was changed after 24 hours. Cells were allowed to recover for 2 days and then treated with 5 ug/ml of blasticidin. Cells were passaged regularly in drug media for more than 2 weeks to select for heterogeneous populations of dCas9 repressor integrant-containing cells.
Production of single gene-targeting gRNA lentivirus and cell transduction
HEK293T cells were seeded at 200,000 cells per well in 6-well plates a day prior to transfection. Cells were transfected with 450 ng of pSB700 sgRNA expression plasmid (with puromycin-resistant marker), 600 ng of psPAX2 (a gift from Didier Trono, Addgene plasmid # 12260), and 150 ng of pCMV-VSV-G (a gift from Bob Weinberg Addgene plasmid # 8454) using lipofectamine 2000 (Life Technologies). Viral supernatants were collected at 72 hours after transfection by centrifuging the medium at 400 g for 5 min to remove cell debris. HAP1 and SH-SY5Y repressor stable cell lines were seeded at ~15,000 and 35,000 cells, respectively, per well in 24-well plates. The following day each sample was infected with 100 ul of sgRNA-containing lentiviruses. Cells were treated with 0.5 ug/ml (HAP1) or 2.5 ug/ml (SH-SY5Y) of puromycin to select for transductants at 48 hours after transduction. Cells stably expressing sgRNA were passaged for 2 weeks and collected for RNA extraction and qPCR analysis. Sequences for qPCR primers are listed in Supplementary Table 10.
Production of lentiviral single and dual guide RNA (gRNA) libraries
The plasmid containing single guide RNA library targeting essential genes was a gift from Dr. Rene Bernards19. To generate the dual guide library a series of oligonucleotides were designed such that the forward oligo created the first gRNA within the array and the reverse oligo was used to introduce the second gRNA into the array (list of oligos used for library construction are provided within Supplementary Table 8). A template containing a modified sgRNA tail sequence fused in cis to the 7SK pol III promoter was then used as a PCR template (sequence of sgRNA2-7SK template listed in Supplementary Table 11). To generate the dual guide library a PCR reaction was performed in which all forward and reverse primers were mixed together. The resulting ~475bp PCR product was run on a gel, extracted and inserted into the pSB700 gRNA expression backbone using Golden Gate cloning. To produce lentiviruses expressing each gRNA library, approximately 1 million HEK293T cells were plated on a 10 cm dish. The following day cells were transfected with each of the gRNA library plasmids mixed with psPAX2 and pCMV-VSV-G at 4:3:2 ratio using a total of 7-8 ug of DNA using the following protocol. Total plasmid DNA was diluted in 1 ml of serum-free media. Polyethylenimine or PEI (Polysciences) was added to the diluted DNA based on 3:1 ratio of PEI (ug): total DNA (ug). Mixtures were incubated for 15 min at room temperature and then added onto the cells. Viral supernatants were collected at 72 hours and concentrated using PEG Virus Precipitation Kit (BioVision) according to manufacturer’s instructions.
CRISPR repressor screens
To compare the ability of different repressors in screening, a series of stable cell lines each containing a unique repressor along with a control cell line without a repressor integrated into the genome were seeded in 6-well plates and allowed to grow to 30-50% confluency to prepare for transduction the following day. Lentiviruses expressing each guide RNA library were produced and used to infect experimental cells so the multiplicity of infection (MOI) was <0.5. Cells were treated with 0.5 ug/ml (HAP1, 293T) or 2.5 ug/ml (SH-SY5Y) of puromycin at 48 hours (HAP1) or 72 hours (SY-SH5Y, 293T) post virus transduction. After drug selection, 50% of the cells were collected immediately for DNA extraction using Epicentre Quick Extract Solution, and 50% of the cells were seeded into a set of 15 cm dishes for subsequent passaging. Cells were regularly passaged using standard protocols and collected again at 7, 14, and 22 days (SH-SY5Y screen only) post-drug selection for DNA extraction. The number of cells manipulated was kept sufficiently large such that we maintained a ~500 to 1000-fold coverage of the library at each stage of passaging. For PCR, 25 ug (lethality screen) or 60 ug (gene epistasis screen) of genomic DNA divided over 25 or 60 reactions, respectively, were amplified using KAPA2G Robust PCR kit (KAPA Biosystems) along with primer set, PCR 1 (Supplementary Table 12). The products of all first-round PCR reactions from the same sample were then pooled. 1 ul of the pooled product was used for a sample indexing in preparation for next generation sequencing using either Illumina Truseq or Nextera indexing primers. PCR cycling conditions are listed in Supplementary Table 13. See Supplementary Note 3 and 4 for bioinformatics analyses of screen data.
Circuit experiments
HEK293FT cells were transfected as previously described37 using PEI reagents. For inducible circuits, 2 ug/uL of doxycycline was added to samples and changed daily post-transfection until flow-cytometry. All samples were processed for flow-cytometry at 72 hours post-transfection and data were analyzed by FlowJo. Supplementary Note 5 provides detailed methods and materials used to perform circuit experiments.
Software
FlowJo (version 7) was used to analyze data generated from flow-cytometry experiments. MAGeCK (0.5.7) was used to analyze single gRNA library screens to determine gene essentiality.
Detailed information on experimental design and reagents is described in the Life Sciences Reporting Summary
DATA AVAILABILITY AND ACCESSION CODE AVAILABILITY STATEMENTS
All NGS data generated in this study are deposited with NCBI SRA (SRP142027) under BioProject (PRJNA451252). The authors declare that all other data supporting the findings of this study are available within the paper and supplementary files. All custom scripts are available upon request.
Supplementary Material
Acknowledgments
G.M.C was supported by NIH grants RM1 HG008525 and P50 HG005550. A.C. was funded by the National Cancer Institute grant no. 5T32CA009216-34 and the Burroughs Wellcome Fund Career Award for Medical Scientists. S.K was supported by the DARPA Young Faculty Award D16AP00047 and Arizona State University, Fulton Schools of Engineering startup fund. J.J.C. was supported by the Paul G. Allen Frontiers Group.
Footnotes
AUTHOR CONTRIBUTIONS
A.C. and N.C.Y. conceived the study. N.C.Y. and A.C. designed experiments. A.C. and A.T. designed, built, and tested the initial set of dCas9 repressor fusions. N.C.Y. performed the majority of endogenous gene targeting experiments with assistance from A.L.B. along with additional technical contributions from Ryan C., M.T., and A.C. Library screens and next generation sequencing were performed by N.C.Y. with analysis of the essential gene library data performed by Y.C. with contributions from N.C.Y. and A.C. S.S. performed MAGeCK analysis. RNA-seq analysis was led by Denitsa M. with assistance in library preparation from N.C.Y. and data interpretation by N.C.Y and A.C. C.C.K. with oversight from N.E.L. analyzed the dual guide epistasis experiment and interpreted data with assistance from N.C.Y. and A.C. X.G. aided in next generation sequencing and performed preliminary analysis of the sequencing data. N.D. provided technical experience and insight. E.L. helped analyze a portion of the library screening data. David M. and S.P. performed the synthetic circuit experiments under the guidance of M.R.E. and S.K. S.K. designed all synthetic circuits used in the study. Research was performed within the laboratory of G.M.C with oversight from both J.J.C and G.M.C. N.C.Y. and A.C. wrote the manuscript with contributions from all authors.
COMPETING FINANCIAL INTERESTS STATEMENT
G.M.C. is a founder and advisor for Editas Medicine. G.M.C. has equity in Editas and Caribou Biosciences (for full disclosure list, please see: http://arep.med.harvard.edu/gmc/tech.html).
References
- 1.Cho SW, Kim S, Kim JM, Kim JS. Targeted genome engineering in human cells with the Cas9 RNA-guided endonuclease. Nat Biotechnol. 2013;31:230–232. doi: 10.1038/nbt.2507. [DOI] [PubMed] [Google Scholar]
- 2.Cong L, et al. Multiplex genome engineering using CRISPR/Cas systems. Science. 2013;339:819–823. doi: 10.1126/science.1231143. [DOI] [PMC free article] [PubMed] [Google Scholar]
- 3.Mali P, et al. RNA-guided human genome engineering via Cas9. Science. 2013;339:823–826. doi: 10.1126/science.1232033. [DOI] [PMC free article] [PubMed] [Google Scholar]
- 4.Jinek M, et al. A programmable dual-RNA-guided DNA endonuclease in adaptive bacterial immunity. Science. 2012;337:816–821. doi: 10.1126/science.1225829. [DOI] [PMC free article] [PubMed] [Google Scholar]
- 5.DiCarlo JE, et al. Genome engineering in Saccharomyces cerevisiae using CRISPR-Cas systems. Nucleic Acids Res. 2013;41:4336–4343. doi: 10.1093/nar/gkt135. [DOI] [PMC free article] [PubMed] [Google Scholar]
- 6.Hwang WY, et al. Efficient genome editing in zebrafish using a CRISPR-Cas system. Nat Biotechnol. 2013;31:227–229. doi: 10.1038/nbt.2501. [DOI] [PMC free article] [PubMed] [Google Scholar]
- 7.Wang H, et al. One-step generation of mice carrying mutations in multiple genes by CRISPR/Cas-mediated genome engineering. Cell. 2013;153:910–918. doi: 10.1016/j.cell.2013.04.025. [DOI] [PMC free article] [PubMed] [Google Scholar]
- 8.Zhou Y, et al. High-throughput screening of a CRISPR/Cas9 library for functional genomics in human cells. Nature. 2014;509:487–491. doi: 10.1038/nature13166. [DOI] [PubMed] [Google Scholar]
- 9.Shalem O, et al. Genome-scale CRISPR-Cas9 knockout screening in human cells. Science. 2014;343:84–87. doi: 10.1126/science.1247005. [DOI] [PMC free article] [PubMed] [Google Scholar]
- 10.Wang T, Wei JJ, Sabatini DM, Lander ES. Genetic screens in human cells using the CRISPR-Cas9 system. Science. 2014;343:80–84. doi: 10.1126/science.1246981. [DOI] [PMC free article] [PubMed] [Google Scholar]
- 11.Koike-Yusa H, Li Y, Tan EP, Velasco-Herrera MDC, Yusa K. Genome-wide recessive genetic screening in mammalian cells with a lentiviral CRISPR-guide RNA library. Nat Biotechnol. 2014;32:267–273. doi: 10.1038/nbt.2800. [DOI] [PubMed] [Google Scholar]
- 12.Mandegar MA, et al. CRISPR Interference Efficiently Induces Specific and Reversible Gene Silencing in Human iPSCs. Cell Stem Cell. 2016;18:541–553. doi: 10.1016/j.stem.2016.01.022. [DOI] [PMC free article] [PubMed] [Google Scholar]
- 13.Qi LS, et al. Repurposing CRISPR as an RNA-guided platform for sequence-specific control of gene expression. Cell. 2013;152:1173–1183. doi: 10.1016/j.cell.2013.02.022. [DOI] [PMC free article] [PubMed] [Google Scholar]
- 14.Gilbert LA, et al. CRISPR-mediated modular RNA-guided regulation of transcription in eukaryotes. Cell. 2013;154:442–451. doi: 10.1016/j.cell.2013.06.044. [DOI] [PMC free article] [PubMed] [Google Scholar]
- 15.Gilbert LA, et al. Genome-Scale CRISPR-Mediated Control of Gene Repression and Activation. Cell. 2014;159:647–661. doi: 10.1016/j.cell.2014.09.029. [DOI] [PMC free article] [PubMed] [Google Scholar]
- 16.Thakore PI, Black JB, Hilton IB, Gersbach CA. Editing the epigenome: technologies for programmable transcription and epigenetic modulation. Nat Methods. 2016;13:127–137. doi: 10.1038/nmeth.3733. [DOI] [PMC free article] [PubMed] [Google Scholar]
- 17.Konermann S, et al. Optical control of mammalian endogenous transcription and epigenetic states. Nature. 2013;500:472–476. doi: 10.1038/nature12466. [DOI] [PMC free article] [PubMed] [Google Scholar]
- 18.La Russa MF, Qi LS. The New State of the Art: Cas9 for Gene Activation and Repression. Mol Cell Biol. 2015;35:3800–3809. doi: 10.1128/MCB.00512-15. [DOI] [PMC free article] [PubMed] [Google Scholar]
- 19.Evers B, et al. CRISPR knockout screening outperforms shRNA and CRISPRi in identifying essential genes. Nat Biotechnol. 2016;34:631–633. doi: 10.1038/nbt.3536. [DOI] [PubMed] [Google Scholar]
- 20.Chavez A, et al. Highly efficient Cas9-mediated transcriptional programming. Nat Methods. 2015;12:326–328. doi: 10.1038/nmeth.3312. [DOI] [PMC free article] [PubMed] [Google Scholar]
- 21.Konermann S, et al. Genome-scale transcriptional activation by an engineered CRISPR-Cas9 complex. Nature. 2015;517:583–588. doi: 10.1038/nature14136. [DOI] [PMC free article] [PubMed] [Google Scholar]
- 22.Zalatan JG, et al. Engineering complex synthetic transcriptional programs with CRISPR RNA scaffolds. Cell. 2015;160:339–350. doi: 10.1016/j.cell.2014.11.052. [DOI] [PMC free article] [PubMed] [Google Scholar]
- 23.Tanenbaum ME, Gilbert LA, Qi LS, Weissman JS, Vale RD. A protein-tagging system for signal amplification in gene expression and fluorescence imaging. Cell. 2014;159:635–646. doi: 10.1016/j.cell.2014.09.039. [DOI] [PMC free article] [PubMed] [Google Scholar]
- 24.Shao S, et al. Multiplexed sgRNA Expression Allows Versatile Single Non-repetitive DNA Labeling and Endogenous Gene Regulation. 2017 doi: 10.1101/121905. [DOI] [PubMed] [Google Scholar]
- 25.Stolzenburg S, et al. Stable oncogenic silencing in vivo by programmable and targeted de novo DNA methylation in breast cancer. Oncogene. 2015;34:5427–5435. doi: 10.1038/onc.2014.470. [DOI] [PMC free article] [PubMed] [Google Scholar]
- 26.Li F, et al. Chimeric DNA methyltransferases target DNA methylation to specific DNA sequences and repress expression of target genes. Nucleic Acids Res. 2007;35:100–112. doi: 10.1093/nar/gkl1035. [DOI] [PMC free article] [PubMed] [Google Scholar]
- 27.Stepper P, et al. Efficient targeted DNA methylation with chimeric dCas9-Dnmt3a-Dnmt3L methyltransferase. Nucleic Acids Res. 2017;45:1703–1713. doi: 10.1093/nar/gkw1112. [DOI] [PMC free article] [PubMed] [Google Scholar]
- 28.Li W, et al. MAGeCK enables robust identification of essential genes from genome-scale CRISPR/Cas9 knockout screens. Genome Biol. 2014;15:554. doi: 10.1186/s13059-014-0554-4. [DOI] [PMC free article] [PubMed] [Google Scholar]
- 29.Shen JP, et al. Combinatorial CRISPR-Cas9 screens for de novo mapping of genetic interactions. Nat Methods. 2017;14:573–576. doi: 10.1038/nmeth.4225. [DOI] [PMC free article] [PubMed] [Google Scholar]
- 30.Dixon SJ, Costanzo M, Baryshnikova A, Andrews B, Boone C. Systematic mapping of genetic interaction networks. Annu Rev Genet. 2009;43:601–625. doi: 10.1146/annurev.genet.39.073003.114751. [DOI] [PubMed] [Google Scholar]
- 31.Menche J, et al. Disease networks Uncovering disease-disease relationships through the incomplete interactome. Science. 2015;347:1257601. doi: 10.1126/science.1257601. [DOI] [PMC free article] [PubMed] [Google Scholar]
- 32.Costanzo M, et al. A global genetic interaction network maps a wiring diagram of cellular function. Science. 2016;353 doi: 10.1126/science.aaf1420. [DOI] [PMC free article] [PubMed] [Google Scholar]
- 33.Sajesh BV, McManus KJ. Targeting SOD1 induces synthetic lethal killing in BLM- and CHEK2-deficient colorectal cancer cells. Oncotarget. 2015;6:27907–27922. doi: 10.18632/oncotarget.4875. [DOI] [PMC free article] [PubMed] [Google Scholar]
- 34.Imamura O, Campbell JL. The human Bloom syndrome gene suppresses the DNA replication and repair defects of yeast dna2 mutants. Proc Natl Acad Sci U S A. 2003;100:8193–8198. doi: 10.1073/pnas.1431624100. [DOI] [PMC free article] [PubMed] [Google Scholar]
- 35.Budd ME, Campbell JL. The pattern of sensitivity of yeast dna2 mutants to DNA damaging agents suggests a role in DSB and postreplication repair pathways. Mutat Res. 2000;459:173–186. doi: 10.1016/s0921-8777(99)00072-5. [DOI] [PubMed] [Google Scholar]
- 36.Popuri V, Croteau DL, Brosh RM, Bohr VA. RECQ1 is required for cellular resistance to replication stress and catalyzes strand exchange on stalled replication fork structures. Cell Cycle Georget Tex. 2012;11:4252–4265. doi: 10.4161/cc.22581. [DOI] [PMC free article] [PubMed] [Google Scholar]
- 37.Kiani S, et al. CRISPR transcriptional repression devices and layered circuits in mammalian cells. Nat Methods. 2014;11:723–726. doi: 10.1038/nmeth.2969. [DOI] [PMC free article] [PubMed] [Google Scholar]
- 38.Friedman JR, et al. KAP-1, a novel corepressor for the highly conserved KRAB repression domain. Genes Dev. 1996;10:2067–78. doi: 10.1101/gad.10.16.2067. [DOI] [PubMed] [Google Scholar]
- 39.Kim SS, et al. A novel member of the RING finger family, KRIP-1, associates with the KRAB-A transcriptional repressor domain of zinc finger proteins. PNAS. 1996;93:15299–304. doi: 10.1073/pnas.93.26.15299. [DOI] [PMC free article] [PubMed] [Google Scholar]
- 40.Moosmann P, et al. Transcriptional repression by RING finger protein TIF1 beta that interacts with the KRAB repressor domain of KOX1. Nucleic Acids Res. 1996;24:4859–67. doi: 10.1093/nar/24.24.4859. [DOI] [PMC free article] [PubMed] [Google Scholar]
- 41.Jones PL, et al. Methylated DNA and MeCP2 recruit histone deacetylase to repress transcription. Nat Genet. 1998;19:187–91. doi: 10.1038/561. [DOI] [PubMed] [Google Scholar]
- 42.Nan X, et al. Transcriptional repression by the methyl-CpG-binding protein MeCP2 involves a histone deacetylase complex. Nature. 1998;393:386–9. doi: 10.1038/30764. [DOI] [PubMed] [Google Scholar]
- 43.Wade PA, et al. Histone deacetylase directs the dominant silencing of transcription in chromatin: association with MeCP2 and the Mi-2 chromodomain SWI/SNF ATPase. Cold Spring Harb Symp Quant Biol. 1998;63:435–45. doi: 10.1101/sqb.1998.63.435. [DOI] [PubMed] [Google Scholar]
- 44.Kimura H, Shiota K. Methyl-CpG-binding protein, MeCP2, is a target molecule for maintenance DNA methyltransferase, Dnmt1. JBC. 2003;278:4806–12. doi: 10.1074/jbc.M209923200. [DOI] [PubMed] [Google Scholar]
- 45.Kleinstiver BP, et al. High-fidelity CRISPR-Cas9 nucleases with no detectable genome-wide off-target effects. Nature. 2016;529:490–495. doi: 10.1038/nature16526. [DOI] [PMC free article] [PubMed] [Google Scholar]
- 46.Fu Y, Sander JD, Reyon D, Cascio VM, Joung JK. Improving CRISPR-Cas nuclease specificity using truncated guide RNAs. Nat Biotechnol. 2014;32:279–284. doi: 10.1038/nbt.2808. [DOI] [PMC free article] [PubMed] [Google Scholar]
- 47.Polstein LR, et al. Genome-wide specificity of DNA binding, gene regulation, and chromatin remodeling by TALE- and CRISPR/Cas9-based transcriptional activators. Genome Res. 2015;25:1158–1169. doi: 10.1101/gr.179044.114. [DOI] [PMC free article] [PubMed] [Google Scholar]
- 48.Wu X, et al. Genome-wide binding of the CRISPR endonuclease Cas9 in mammalian cells. Nat Biotechnol. 2014;32:670–676. doi: 10.1038/nbt.2889. [DOI] [PMC free article] [PubMed] [Google Scholar]
- 49.Kuscu C, Arslan S, Singh R, Thorpe J, Adli M. Genome-wide analysis reveals characteristics of off-target sites bound by the Cas9 endonuclease. Nat Biotechnol. 2014;32:677–683. doi: 10.1038/nbt.2916. [DOI] [PubMed] [Google Scholar]
- 50.Chavez A, et al. Comparison of Cas9 activators in multiple species. Nat Methods. 2016;13:563–567. doi: 10.1038/nmeth.3871. [DOI] [PMC free article] [PubMed] [Google Scholar]
- 51.Livak KJ, Schmittgen TD. Analysis of relative gene expression data using real-time quantitative PCR and the 2(-Delta Delta C(T)) Method. Methods San Diego Calif. 2001;25:402–408. doi: 10.1006/meth.2001.1262. [DOI] [PubMed] [Google Scholar]
Associated Data
This section collects any data citations, data availability statements, or supplementary materials included in this article.
Supplementary Materials
Data Availability Statement
All NGS data generated in this study are deposited with NCBI SRA (SRP142027) under BioProject (PRJNA451252). The authors declare that all other data supporting the findings of this study are available within the paper and supplementary files. All custom scripts are available upon request.