Abstract
BACKGROUND:
The combined action of biological, physical, and chemical agents in the environment impacts on children's health resulting in illness and disability. Body measurements provide the optimum method of evaluating the health status of children. This study was done to measure the main air pollutants that affect the physical growth of primary schoolboys and compare the growth patterns of these young boys in three different areas in the city of Dammam in the Eastern Province of Saudi Arabia.
MATERIALS AND METHODS:
A cross-sectional survey was conducted in three different environmental areas (residential, commercial, and industrial). The total number of boys in the study was 851. Data were collected using a self-administered questionnaire with three main parts: sociodemographic, anthropometric measurements, and air pollutant measurements.
RESULTS:
Less than half the children (45%) residing in the residential area belonged to Classes 4 and 5 socioeconomic groups. In addition, 56.6% of the children residing in the commercial area and 26.5% of children in the industrial area belonged to the same socioeconomic class. There was a statistically significant difference between the mean age (P < 0.01), nationality, and the number of rooms and bedrooms (P < 0.001) in the boys' homes. Furthermore, there were statistically significant differences in weight (P < 0.05), height (P < 0.001), and height for age according to international standards (P < 0.01). Moreover, arm anthropometry of boys living in the residential area was higher than in the other two studied areas. Low values of all anthropometric measurements of the studied boys were significantly associated with exposure to high levels of nitrogen dioxide (NO2) >0.35 parts per million (ppm) or carbon monoxide >35 ppm (Saudi standard) outdoors, irrespective of socioeconomic conditions.
CONCLUSIONS:
The most significant factors that affected anthropometric values were total suspended particulate concentration in the outdoor air of the studied areas, parental education, and/or occupation. It is recommended that steps be taken to reduce indoor and outdoor air pollution.
Keywords: Air pollution, boys' anthropometry, physical growth, Saudi Arabia
Introduction
Ill health and disablement can result from the impact of the combined action of biological, physical, and chemical agents in the environment.
Body measurements can provide the best means of evaluating the health status of children.[1,2,3,4]
In the past 30 years, much progress has been made by society itself and through central federal air quality programs in reducing air pollution. However, children are still known to be at particular risk of airborne pollutants as they breathe more rapidly than adults and often breathe through their mouths, consequently bypassing the filtering effect of the nose allowing more pollutants to be inhaled.[5] In addition, since children tend to spend more time outdoors than adults, their exposure to air pollutant is greater.[1,2,3,4] Moreover, reports have shown that pollution has adverse effects on children's health and is associated with a nontrivial increase in the risk of chronic disease and death of children.[6,7] Children who are exposed to high concentrations of air pollutants have shown poor growth.[8]
Studies have shown that children living within 250 feet of a major road over a 1-year period have a 50% higher risk of exhibiting asthma symptoms compared to children of the same age who live 2–3 times further from the same road.[9] However, the association between air quality and severity of asthmatic attacks is also strongly related to socioeconomic characteristics of the families of the children.[10] Krämer et al. found a strong relation between the prevalence of asthma and levels of nitrogen dioxide (NO2) in children living in urban areas.[11]
Children are considered more vulnerable than adults because their health is more at risk with hazardous pollutants.[11] The current lack of data on the exposure of children to hazardous environmental pollutants makes the establishment of the link between environmental exposure of children and the negative effects on their anthropometry rather problematic.[3]
The aim of this study was to determine the association between air pollutants (both outdoor and indoor) and weight, height, and arm anthropometry of schoolchildren in the city of Dammam.
Materials and Methods
A cross-sectional epidemiological study based on community was carried out in three different environmental areas, namely residential, commercial, and industrial areas, in the city of Dammam. For the purpose of the study, children were considered as either living within 10 km of an industrial area, or a commercial area defined as an area in which the buying and selling of goods takes place, or a residential area defined as an area where there are only dwelling houses and apartments, an area devoid of any industrial or commercial activity.[2,3,4]
Primary schoolboys (aged 6–12 years) who were born in the studied areas, as proven by the birth certificate, and who had lived and been to school in the same area and remained in the selected schools for at least one academic year were included in the study.
The study was conducted from April 2013 to May 2014. Primary schools were selected at random, according to specific inclusion criteria, schoolboys aged 6–12 years of age, the unit of observation using the equation described by Rosner.[12]

where
α = 95% (1.96) if the sampling error is within 0.05 with probability of at least 0.95
β = 80% (0.840) if the sampling error within 0.05 with probability of at least 0.80.
SD1= Standard deviation of weight of children in nonpolluted area.
SD2= Standard deviation of weight of children in polluted area.
d2= Difference between mean weight of children in polluted and nonpolluted areas.
The estimated suitable sample size per studied area was 270 children. The number of children in the three studied areas totaled 851, taking into consideration 5% drop-out or nonresponse rate.
At the start of the study, the number of primary schools in Dammam totaled 104. Taking into account the proportional allocation of primary schoolchildren in the selected areas, one school was selected from a commercial area, one from residential area and three from an industrial area. Of the 851 boys in the study, 251 came from a school in the commercial area, 352 from one in the residential area, and 275 from the three schools in the industrial area.
A questionnaire for data collection to be completed by the boys' parents or guardians was developed by the research team. The questionnaire asked for personal demographic data that included the age of the boy in question, place of residence, parents' education and occupation, family size, number of rooms and bedrooms in the residence, history of medical illness, and family history of chest allergies. The socioeconomic status of the participants was determined by a scoring system using parental education (0–4 score for either paternal or maternal education); paternal occupation (2–7 score) and maternal occupation (0–1 score). Accordingly, the total score of socioeconomic status ranged from 2 to 16 and was divided into 5 classes, namely, Class 1 (score ranged from 14 to 16), Class 2 (score ranged from 11 to 13), Class 3 (score ranged from 8 to 10), Class 4 (score ranged from 5 to 7), and Class 5 (score ranged from 2 to 4).[13]
Anthropometric measurements included body weight (kg), standing height (cm), mid-arm circumference (mm), and triceps skin-fold thickness (mm). Weight was considered a key to all anthropometric values as it is the best index of actual growth or failure to grow.[14] Accordingly, 50th percentile of international standard (Harvard Standard) or local Saudi standard for boys (6–12 years) was taken as the mean value of weight for the study group and the difference between the 50th and 75th percentiles was taken as standard deviation of weight. The researchers assumed that the mean and standard deviation for the studied children were less than the corresponding values for the reference children by 5% for each age up to 12 years. Predicted anthropometric values were calculated in terms of weight for age (%), height for age (%), and using both international and local standards (50th percentiles for weight and height).[15,16]
The air measurements were carried out in order to assess the environmental levels of the total suspended particulate (TSP) (dust and fumes) and nonparticulate (gases; NO2and sulfur oxide [SO2]) air pollutants and their chemical components. A checklist was developed to support the collection of the measurements.
Four gaseous air pollutants measured in this study were SO2, carbon monoxide (CO), NO2, and carbon dioxide (CO2) measured in parts per million (ppm). At each school included in the study, both indoor and outdoor readings over a 2-h period were directly recorded on the basis of 5 min averages for each gaseous pollutant. The EntryRAE (PGM-3000) Multi-Gas Monitor was used for the measurement of CO2and the VRAE Hand Held 5 Gas Surveyor (Model 7800 Monitor-Geotech Environmental Equipment, Inc., Colorado, USA) with built-in sampling pump and level alarm was used for measurement of NO2, SO2, and CO. For quality assurance purposes, data of the two gas monitors were calibrated against known concentrations of these gases.
TSP was sampled on 60-mm diameter glass fiber filters by the precalibrated handheld battery portable air sampler on the basis of 2-h samples. TSP concentrations in μg/m3 were determined and calculated by gravimetric and measurements for both indoor and outdoor locations in the selected schools.
The collected data were reviewed, coded, verified, and statistically analyzed using the Statistical Package for the Social Sciences software SPSS for Windows version 16, SPSS Corp., SPSS Inc, Chicago, IL, USA. Analysis of contingency tables between the studied groups was done using Chi-square test as appropriate. Using t-test or ANOVA, a comparison of the groups for means of continuous variables, such as those obtained from anthropometric values, was done. Stratified analysis used to test the possibility at socioeconomic status had a confounding effect on anthropometric values of children included in the study. Linear regression analysis was used to determine the possible independent variables that might affect these anthropometric values.
This study was approved by the Ethics Committee of both King Abdul-Aziz City for Science and Technology (project alternative rate plans 32–33) and the General Directorate of Education of the Eastern Province. Written informed consent form, in Arabic, was signed by each participant's parent or guardian, with the right to consent or refuse to participate in this study. All participants were notified that collected data would be kept strictly confidential and would be used only for research purposes.
Results
Table 1 shows that less than half of the of children (45%|) who live in the residential area belonged to socioeconomic Classes 4 and 5. However, 56.6% of children residing in the commercial area and 26.5% of children residing in the industrial area belonged to the same socioeconomic class. The differences between the three studied areas were statistically significant (P < 0.001). There was a statistically significant difference between boys in the studied areas regarding the mean values of age (P < 0.01), nationality, number of rooms and bedrooms in their homes (P < 0.001) with the mean scores being higher in the residential area followed by the commercial area and then the industrial area.
Table 1.
Sociodemographic characteristics of boys in studied areas
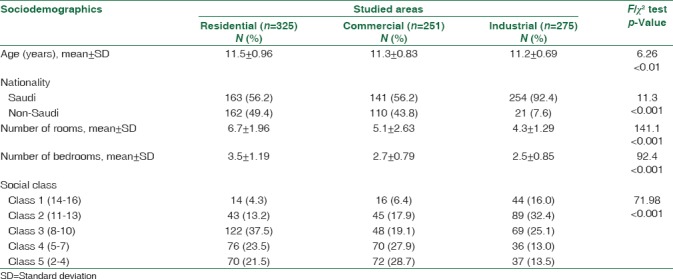
Table 2 shows that there were significant differences in weight (P < 0.05), height (P < 0.001), height for age by international standards (P < 0.01) between the boys in the studied areas, with the mean scores being higher in the residential area followed by the commercial area, followed by the industrial area. Moreover, arm anthropometries of the boys living in the residential area were higher than those of the boys living in the other two studied areas, but the difference was not statistically significant (P > 0.05). The differences were highly statistically significant with regard to the skinfold thickness of the triceps (P < 0.01), with the mean scores being higher in the residential area children than the commercial and industrial areas.
Table 2.
Mean values and standard deviations of weight, height, and arm anthropometry of boys in studied areas
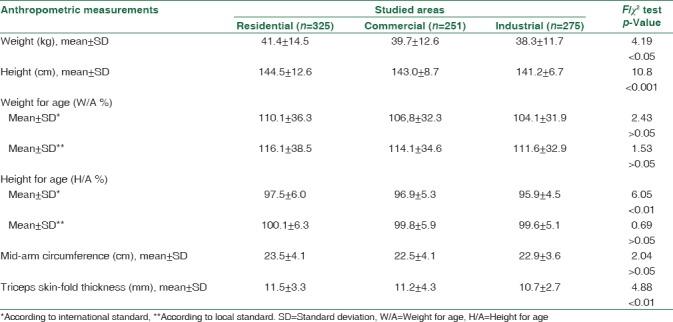
Table 3 describes the association between socioeconomic status and weight, height, and arm anthropometry. All anthropometric values of boys in Classes 1 and 2 were significantly higher than the corresponding values for boys in Classes 3 and 4.
Table 3.
Association between weight, height, arm anthropometry, and socioeconomic status of boys in the studied areas

Indoor and outdoor TSP concentrations [Table 4] exceeded the maximum allowable values reported by the WHO and Saudi standard values. Boys residing in the industrial area were exposed to a level of NO2and CO in outdoor air, higher than the Saudi standard, while boys residing in the commercial area were exposed to a level of SO2in outdoor air higher than the Saudi standard.[16] Therefore, the boys were divided into low and high exposure groups according to the type of air pollutants and corresponding Saudi standard [Table 5].[16]
Table 4.
Mean values and standard deviation of air pollutants in outdoor and indoor air in different locations of studied school areas
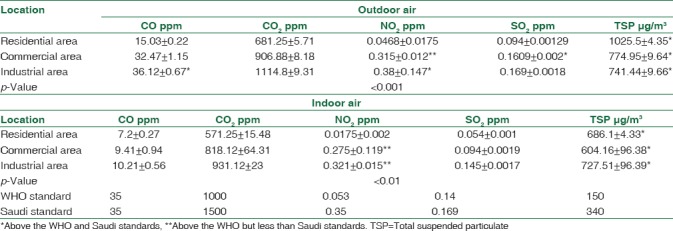
Table 5.
Mean values and standard deviation of anthropometric measurements of boys according to exposure to SO2, NO2, and CO concentration in the outdoor air of studied areas, based on the Saudi standard
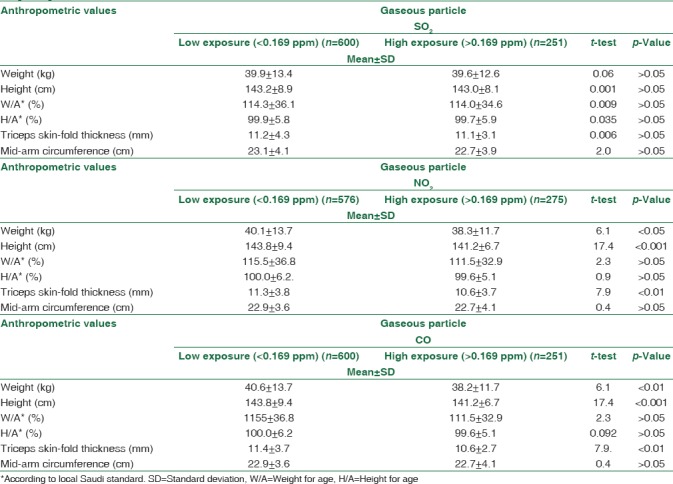
Table 5 shows that values of weight, height, height for age (based on Saudi standard), and arm anthropometry of boys in the two socioeconomic groups who were exposed to a low level of SO2in the outdoor air, which is less than the Saudi standard (<0.169 ppm) were not significantly different from boys with the corresponding socioeconomic score who were exposed to higher levels.[16] In addition, values of weight, height, skinfold thickness, and arm muscle circumference of boys in both socioeconomic groups who were exposed to a lower level of NO2than the Saudi standard (<0.35 ppm–) were higher than those of boys with corresponding socioeconomic score who were exposed to higher levels. The differences are statistically significant. Irrespective to socioeconomic status, values of weight, height, skinfold thickness, and arm muscle circumference of boys in both socioeconomic groups who were exposed to a lower level of CO in the outdoor air <35 ppm (Saudi standard) were higher than those of boys with the corresponding socioeconomic score who were exposed to higher levels. The differences were statistically significant. This may indicate that there is a significant association between these anthropometric values and exposure to the outdoor NO2and CO regardless of socioeconomic status.
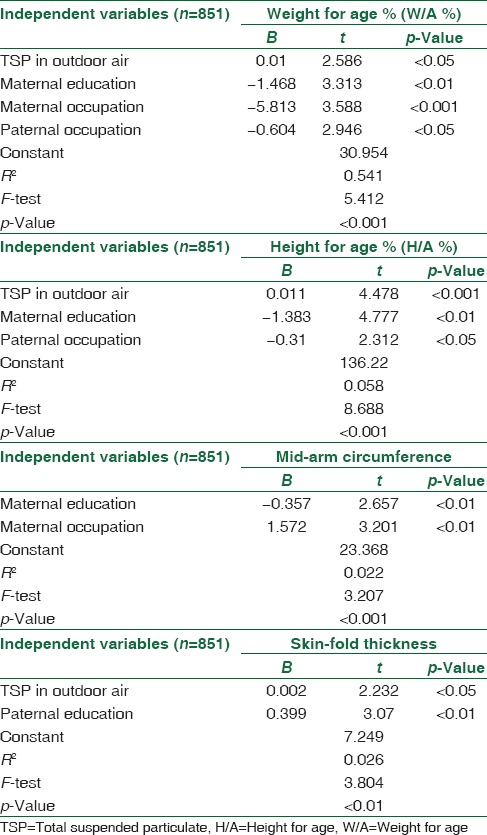
Linear regression analysis was used to determine the independent variables that affect these body measurements as dependent variables. The final significant independent variables that affected weight for age, height for age based on local Saudi standard, mid-arm circumference, and skinfold thickness are shown in Table 6.
Table 6.
Linear regression analysis for the effect of the studied independent variables on weight for age (%), height for age (%), and arm anthropometry of boys in the studied areas
Discussion
Child growth refers to an increase in physical size of the whole body or any of its parts.[3] The progress of growth and maturation of any child depend on a complex interaction of such diverse factors as socioeconomic, nutritional status, environmental pollution, racial, hormonal factors, and general diseases including parasitic and acute childhood diseases.[3] The sociodemographic features of the studied boys showed that the mean age ± SD of boys in the residential, commercial, and industrial areas were 11.5 ± 0.69, 11.3 ± 0.83, and 11.2 ± 0.69, respectively, with statistical significant differences of (P < 0.01). Moreover, there were highly significant differences between the studied areas regarding nationality and mean number of rooms and bedrooms (P < 0.001) in the boys' residences. In addition, there was a highly significant difference between boys in the studied areas with regard to their socioeconomic status [Table 1].
Body measurements are considered the best and most practical indicators of evaluating a child's health and growth.[15] Weight for age and height for age are practically independent of age and sex when compared with a local reference standard.[16] There were significant differences in weight (P < 0.05), height (P < 0.001), height for age based on international standards (P < 0.001), and in skinfold thickness [Table 2].
All anthropometric values of boys in socioeconomic Classes 1 and 2 were significantly higher than the corresponding values for boys in Class 3 and 4. This shows that there is a significant association between the socioeconomic status and anthropometric values [Table 3]. The main constraints of the process of growth during childhood are socioeconomic factors, environmental pollution, and general diseases including childhood illnesses and allergic pulmonary diseases.[5,6,9,17] In many cases, children have greater exposure to air pollutants than adults. Moreover, infants and children often breathe through their mouths, bypassing the filtering effect of the nose and allowing the inhalation of more air pollutants.[6]
The environmental data in the present study revealed that TSP matters in both indoors and outdoors in the selected school areas in Dammam were more than the International WHO and National Saudi Standards.[18,19] The industrial areas had the highest TSP levels owing to traffic and industrial emissions, and all levels in the studied areas showed significant variation between indoor and outdoor air. Also the level of SO2, both indoors and outdoors were lower than the WHO and Saudi standards except that the outdoor air in the commercial area was at a higher level than the Saudi standard.[18,19] In the industrial areas, the levels of NO2and CO in the outdoor air the boys were exposed to, were higher than the Saudi standard [Table 4].[19]
Many pollutants are generated in the refining of petroleum, such as particulate matter and organic and inorganic gases. One of the major air pollutants is aerosols, also known as particulate matter, which is dispersed in the air and as suspended mass varies in size.[20] Gas-exhaust heaters and boilers may also contain particles but in much smaller amounts.[21] The most common inorganic gaseous pollutants are ozone, NO2, and SO2.[22] According to our calculations and the monitoring measurements, the influence of the industrial sources over the city, with the exception of areas close to the industrial area exceeded the air quality standard.
The anthropometric values of the boys included in the study show that there were significantly higher values of weight, height, and skinfold thickness in both socioeconomic groups who were exposed to a lower Saudi standard level of either NO2of <0.35 ppm or CO <35 ppm in the outdoor air than boys with a corresponding socioeconomic score but who were exposed to higher levels [Table 5].
Weight for age, height for age, and arm anthropometry, as age-independent body measurements, were used in linear regression analysis, which was used to determine the independent variables that affect these body measurements as dependent variables.[23,24] In this study, the concentration of TSP in outdoor air and paternal education are the only factors that affected skinfold thickness [Table 6].
Conclusions and Recommendations
Our study shows that low values of all anthropometric measurements are significantly associated with exposure to higher levels than the Saudi standard of NO2(>0.35 ppm) or CO (>35 ppm) in outdoor air, irrespective of socioeconomic status. Moreover, the most significant factors that affected some anthropometric values were TSP concentration in the outdoor air, parental education, and/or occupation.
Indoor air quality within schools and their classrooms were adversely affected, depending on their locations relative to outdoor sources of air pollution, particularly traffic activity. It is recommended that steps be taken to reduce indoor and outdoor air pollution.
Limitations
The present study lacked data on the nutritional status of primary schoolchildren as regard food items available to them and the frequency of daily food consumption. Furthermore, active and passive smoking were not studied as confounding factors. The study was carried out over a period of 6 months. Therefore, seasons and weather conditions could have affected the outcome.
Financial support and sponsorship
King Abdul-Aziz City for Science and Technology gave the financial and technical support for this study (project alternative rate plans 32–33).
Conflicts of interest
There are no conflicts of interest.
Acknowledgments
The authors express their sincere gratitude to King Abdul-Aziz City for Science and Technology for their financial and technical support for this study (project alternative rate plans 32–33). Sincere thanks also go to the General Director of Education Directorate, and Director of the Department of Planning and Development, Ministry of Education in the Eastern Province, for their valuable help. Furthermore, the authors would like to extend their thanks to Local Education for their support and cooperation throughout the implementation phase of the study. In addition, our sincere appreciation goes to all the students and parents of the students who participated in our study.
References
- 1.Zanobetti A, Schwartz J. Are diabetics more susceptible to the health effects of airborne particles? Am J Respir Crit Care Med. 2001;164:831–3. doi: 10.1164/ajrccm.164.5.2012039. [DOI] [PubMed] [Google Scholar]
- 2.Bateson TF, Schwartz J. Who is sensitive to the effects of particulate air pollution on mortality? A case-crossover analysis of effect modifiers. Epidemiology. 2004;15:143–9. doi: 10.1097/01.ede.0000112210.68754.fa. [DOI] [PubMed] [Google Scholar]
- 3.Effects of Air Pollution on Children's Health and Development: A Review of The Evidence. Bonn: WHO Regional Office for Europe; 2005. World Health Organization-European Centre for Environment and Health. [Google Scholar]
- 4.Buka I, Koranteng S, Osornio-Vargas AR. The effects of air pollution on the health of children. Paediatr Child Health. 2006;11:513–6. [PMC free article] [PubMed] [Google Scholar]
- 5.A Fact Sheet by Cal/EPA's Office of Environmental Health Hazard Assessment and the American Lung Association of California. 2002. Feb 28, [Last accessed on 2017 Jul 23]. Available from: https://www.oehha.ca.gov/media/downloads/faqs/kidsair4-02.pdf .
- 6.Schwartz J. Air pollution and children's health. Pediatrics. 2004;113:1037–43. [PubMed] [Google Scholar]
- 7.Bateson TF, Schwartz J. Children's response to air pollutants. J Toxicol Environ Health A. 2008;71:238–43. doi: 10.1080/15287390701598234. [DOI] [PubMed] [Google Scholar]
- 8.Nikolić M, Stanković A, Jović S, Kocić B, Bogdanović D. Effects of air pollution on growth in schoolchildren. Coll Antropol. 2014;38:493–7. [PubMed] [Google Scholar]
- 9.McConnell R, Berhane K, Yao L, Jerrett M, Lurmann F, Gilliland F, et al. Traffic, susceptibility, and childhood asthma. Environ Health Perspect. 2006;114:766–72. doi: 10.1289/ehp.8594. [DOI] [PMC free article] [PubMed] [Google Scholar]
- 10.O'Neill MS, Jerrett M, Kawachi I, Levy JI, Cohen AJ, Gouveia N, et al. Health, wealth, and air pollution: Advancing theory and methods. Environ Health Perspect. 2003;111:1861–70. doi: 10.1289/ehp.6334. [DOI] [PMC free article] [PubMed] [Google Scholar]
- 11.Krämer U, Koch T, Ranft U, Ring J, Behrendt H. Traffic-related air pollution is associated with atopy in children living in urban areas. Epidemiology. 2000;11:64–70. doi: 10.1097/00001648-200001000-00014. [DOI] [PubMed] [Google Scholar]
- 12.Rosner B. Fundamentals of Biostatistics. 3rd ed. Boston, Massachusetts: PWS-Kent Publishing Company; 1990. p. 273. [Google Scholar]
- 13.Barker DJ, Bennett FT. Practical Epidemiology. 3rd ed. Edinburgh: The English Book Society and Churchill Livingstone; 1983. pp. 58–60. [Google Scholar]
- 14.Mahan LK, Escott-Stump S. Krause's Food, Nutrition and Diet Therapy. 11th ed. Philadelphia: WB Saunders; 2004. pp. 30–55. [Google Scholar]
- 15.Falkner F, Tanner JM. Human Growth: Developmental Biology, Prenatal Growth. 2nd ed. Vol. 1. New York: Plenum Press; 1986. [Google Scholar]
- 16.El-Mouzan MI, Al-Salloum AA, Al-Herbish AS, Foster B, Qurashi MM, Al-Omar AA. The 2005 Growth Charts for Saudi Children and Adolescents. (No. AR-20-63) Riyadh, KSA: King Abdulaziz City for Science and Technology; 2009. [Google Scholar]
- 17.Alharbi M, Almutairi A, Alotaibi D, Alotaibi A, Shaikh S, Bahammam AS, et al. The prevalence of asthma in patients with obstructive sleep apnoea. Prim Care Respir J. 2009;18:328–30. doi: 10.4104/pcrj.2009.00020. [DOI] [PMC free article] [PubMed] [Google Scholar]
- 18.World Health Organization. Cluster for Sustainable Development and Healthy Environment (SDE).Department of Protection of the Human Environment (OEP) Occupational and Environmental Health Programme (OEH) Geneva: World Health Organization; 2005. [Google Scholar]
- 19.Presidency of Metrology and Environment. Kingdom of Saudi Arabia. General Environmental Regulation (GER) Standards for the Environment. Document Number 1409-01. The Effective Date of this Standard is 24/03/2012. National Environmental Standards. Ambient Air Quality. 2012:1–6. [Google Scholar]
- 20.Fromme K, Corbin W. Prevention of heavy drinking and associated negative consequences among mandated and voluntary college students. J Consult Clin Psychol. 2004;72:1038–49. doi: 10.1037/0022-006X.72.6.1038. [DOI] [PubMed] [Google Scholar]
- 21.Diapouli E, Chaloulakou A, Mihalopoulos N, Spyrellis N. Indoor and outdoor PM mass and number concentrations at schools in the Athens area. Environ Monit Assess. 2008;136:13–20. doi: 10.1007/s10661-007-9724-0. [DOI] [PubMed] [Google Scholar]
- 22.Park MS, Joo SJ, Lee CS. Effects of an urban park and residential area on the atmospheric CO2 concentration and flux in Seoul, Korea. Adv Atmos Sci. 2013;30:503–14. [Google Scholar]
- 23.Jelliffe DB. World health Organization Monograph. Ser. 53. Geneva: World Health Organization; 1996. The Assessment of Nutritional Status of the Community; pp. 46–69.pp. 72–75.pp. 209pp. 230 [PubMed] [Google Scholar]
- 24.Topp SG, Cook J, Holland WW, Elliott A. Influence of environmental factors on height and weight of schoolchildren. Br J Prev Soc Med. 1970;24:154–62. doi: 10.1136/jech.24.3.154. [DOI] [PMC free article] [PubMed] [Google Scholar]


