

Abstract
Lateral meningocele syndrome (LMS) is a rare genetic disorder characterized by neurological complications and osteoporosis. LMS is associated with mutations in exon 33 of NOTCH3 leading to a truncated protein lacking sequences for NOTCH3 degradation and presumably causing NOTCH3 gain of function. To create a mouse model reproducing human LMS-associated mutations, we utilized CRISPR/Cas9 to introduce a tandem termination codon at bases 6691–6696 (ACCAAG→TAATGA) and verified this mutation (Notch3tm1.1Ecan) by DNA sequencing of F1 mice. One-month-old male and female heterozygous Notch3tm1.1Ecan mice had cancellous and cortical bone osteopenia but exhibited no obvious neurological alterations, and histopathology of multiple organs revealed no abnormalities. Microcomputed tomography of these mutants revealed a 35–60% decrease in cancellous bone volume associated with a reduction in trabecular number and decreased connectivity. During maturation, cancellous and cortical bones were restored in female but not in male mice, which exhibited cancellous bone osteopenia at 4 months. Cancellous bone histomorphometry revealed increased osteoblast and osteocyte numbers and a modest increase in osteoclast surface and bone formation rate. Notch3tm1.1Ecan calvarial osteoblasts had increased proliferation and increased bone γ-carboxyglutamate protein (Bglap) and TNF superfamily member 11 (Tnfsf11) mRNA levels and lower Tnfrsf11b levels. Tnfsf11 mRNA was increased in osteocyte-rich femora from Notch3tm1.1Ecan mice. Cultures of bone marrow–derived macrophages from Notch3tm1.1Ecan mice revealed increased osteoclast formation, particularly in cocultures with osteoblasts from Notch3tm1.1Ecan mice. In conclusion, the Notch3tm1.1Ecan mutation causes osteopenia despite an increase in osteoblast proliferation and function and is associated with enhanced Tnfsf11 expression in osteoblasts and osteocytes.
Keywords: Notch receptor, bone, osteoblast, osteoclast, osteocyte, bone loss, lateral meningocele syndrome, Lehman syndrome, osteopenia, skeletal abnormalities
Introduction
Notch1–4 are transmembrane receptors that mediate communication between neighboring cells and play a fundamental role in cell fate decisions (1, 2). The Notch extracellular domain interacts with classic ligands of the Jagged and Delta-like families (3) (Fig. 1). The negative regulatory region is the site of cleavage required for Notch activation, and it is located at the junction of the extracellular and the transmembrane domains of Notch. Following the activation of Notch, its Notch intracellular domain (NICD)3 is released and translocates to the nucleus (4, 5). There the NICD, recombination signal–binding protein for Ig of κ region (RBPJκ), and mastermind-like form a complex that leads to the induction of target gene transcription (2, 6, 7). Gene targets of this canonical Notch signaling are hairy and enhancer of split (Hes) and HES-related with YRPW motif (Hey) (8–10). A proline (P)-, glutamic acid (E)-, serine (S)-, threonine (T)-rich motif (PEST) domain is located in the C terminus of Notch, and ubiquitin ligases target this domain for the degradation of the NICD (11, 12) (see Fig. 1).
Figure 1.

Domains of Notch3 and engineering of the Notch3tm1.1Ecan mutant allele. A, domains of the Notch3 receptor depicting the 1) extracellular domain containing multiple epidermal growth factor (EGF)-like tandem repeats upstream of Lin12-Notch repeats (LNR); 2) heterodimerization domain (HD) that, in association with the Lin12-Notch repeats, forms the negative regulatory region; 3) transmembrane domain (TMD); and 4) NICD consisting of an RBPJκ-association module (RAM) linked to ankyrin (ANK) repeats and a nuclear localization sequence (NLS) upstream of a PEST domain. Under the NOTCH3 protein domains, the genomic structure of mutant exon 33 aligned with the corresponding protein structure is shown. Black bars represent exons (E) 29–32, the black box represents exon 33 containing the 6691–6696 ACCAAG→TAATGA mutation leading to a T2231X change at the amino acid level, and the white box represents the 3′-UTR. B, WT Notch3 exon 33 sequence with protospacer adjacent motif (PAM) for CRISPR/Cas9 targeting. C and D, genomic DNA from ear samples of F1 pups was used as a template for PCR, and products were sequenced by the Sanger method. Sequencing of the DNA fragment spanning the Notch36691-TAATGA mutation is shown in C. The 1:1 signal ratio for ACCAAG→TAATGA demonstrates heterozygosity for the mutation. The sequence of the mutant Notch3tm1.1Ecan allele is in D. E, sequence of donor oligonucleotide used to generate the Notch36691-TAATGA mutant, including a downstream c→g mutation to ensure the mutation was not a random event. * represents phosphorothioate linkage to protect from exonuclease degradation.
Notch1, -2, and -3 and low levels of Notch4 are expressed in skeletal cells (13, 14). Although some functional overlap is possible between Notch receptors, each Notch receptor exhibits unique roles in physiology (15–17). Differences in the actions of Notch receptors relate to differences in their structure, cellular and temporal expression, and highly specific negative regulatory region domains and variations in the interactions of specific NICDs with RBPJκ (18, 19). Notch1 and Notch2 have been studied extensively for their role in skeletal homeostasis (13, 20–25). Notch1 inhibits osteoblast and osteoclast differentiation, whereas Notch2 inhibits osteoblastogenesis but induces osteoclastogenesis, confirming distinct effects of the various Notch receptors in skeletal cells (13, 20, 26). Notch3 has a distinct structure, and its NICD is different from that of Notch1 and -2, indicating a potentially unique physiological role for Notch3 (27). However, knowledge regarding the actions of Notch3 in the skeleton is limited.
Lateral meningocele syndrome (LMS) or Lehman syndrome (Online Mendelian Inheritance in Man 130720) is a rare genetic disorder that presents with neuromuscular dysfunction, meningoceles, and distinct facial features (28). The clinical features of LMS include developmental delay, decreased muscle mass, and cardiac valve defects. Skeletal abnormalities are frequent, including thickening of the calvarial vault, craniofacial defects, short stature, scoliosis, and bone loss (29, 30). Exome-wide sequencing of individuals affected by LMS demonstrated the presence of mutations in exon 33 of NOTCH3. These mutations create a stop codon so that the PEST domain is not translated (31). Because the PEST domain is necessary for the ubiquitination and degradation of NOTCH3, the NOTCH3 NICD is presumably stable, resulting in persistent signaling and gain of function.
Despite the skeletal manifestations reported in LMS, there is limited knowledge about the mechanisms that operate or the actions of NOTCH3 in the skeleton. The purpose of the present work was to provide an understanding of the skeletal manifestations of LMS and responsible mechanisms. For this purpose, a mouse (Notch3tm1.1Ecan) model reproducing the NOTCH3 mutation harbored by subjects affected by LMS was engineered. To create an LMS mutant mouse, we introduced a tandem termination codon, ACCAAG→TAATGA, into exon 33 of the Notch3 gene at bp 6691–6696 from the start of translation. In the present work, we report the skeletal phenotype and underlying mechanisms of Notch3tm1.1Ecan mice.
Results
Generation and general appearance of Notch3tm1.1Ecan mutant mice
The RNA-guided clustered regularly interspaced short palindromic repeat (CRISPR)-associated Cas9 nuclease system was used to target exon 33 of Notch3 and introduce a TAATGA tandem termination codon at positions 6691–6696 from the start of translation (32–34). This genetic intervention leads to the translation of the truncated NOTCH3 protein T2231X consisting of 2230 amino acids (versus 2318 in WT). Single guide (sg) RNA, designed to cleave between nucleotides 6691 and 6692 of Notch3, and a single-strand DNA containing the tandem stop codon TAATGA were coinjected into C57BL/6J one-cell embryos with Cas9 mRNA (Fig. 1). The proper insertion of the Notch3 6691–6696 ACCAAG→TAATGA mutation was confirmed by DNA sequencing of F1 mice (Fig. 1). Heterozygous mutant mice were compared with sex-matched WT littermates in a C57BL/6J genetic background. Breeding between heterozygous LMS mutant and WT mice yielded offsprings composed of 55% WT and 45% heterozygous Notch3tm1.1Ecan mice. Notch3tm1.1Ecan mice appeared healthy, did not exhibit overt neuromuscular signs, and were fertile. Percent body fat, fasting serum insulin and glucose levels, and serum 17β-estradiol and parathyroid hormone (PTH) levels were not different between Notch3tm1.1Ecan and controls (Table 1). One-month-old heterozygous Notch3tm1.1Ecan mice did not appear different from controls and had a weight that was ∼10% lower than controls. However, the difference in weight was less pronounced as the mice matured, and at 4 months of age Notch3tm1.1Ecan mice weighed ∼5% less than control littermates. Femoral length was slightly shorter in Notch3tm1.1Ecan mice at 1 month but not at 4 months of age when femoral length was not different from controls (Fig. S1).
Table 1.
Percent body fat and hormonal/metabolic parameters in 4-month-old Notch3tm1.1Ecan mutant male and female mice and sex-matched control littermates
Body fat was determined by total body densitometry, and glucose and hormone levels were measured in fasting serum samples from Notch3tm1.1Ecan mutant mice and sex-matched control littermates. Values are means ± S.D.; n = 3–4. 17βE2, 17β-estradiol.
| Males |
Females |
|||
|---|---|---|---|---|
| Control | Notch3tm1.1Ecan | Control | Notch3tm1.1Ecan | |
| Body fat (%) | 17.9 ± 0.8 | 17.6 ± 0.6 | 20.0 ± 0.4 | 21.5 ± 0.7 |
| Glucose (mg/dl) | 88 ± 2 | 84 ± 1 | 91 ± 2 | 86 ± 2 |
| Insulin (μIU/ml) | 114 ± 7 | 132 ± 6 | 120 ± 36 | 110 ± 20 |
| PTH (pg/ml) | 426 ± 65 | 322 ± 107 | 325 ± 89 | 294 ± 82 |
| 17βE2 (pg/ml) | 37 ± 4 | 42 ± 8 | ||
Femoral microarchitecture of Notch3tm1.1Ecan mutant mice
Microcomputed tomography (μCT) of the distal femur demonstrated that 1-month-old male and female Notch3tm1.1Ecan mutant mice had a 35–60% decrease in cancellous bone volume (Table 2 and Figs. 2 and 3). The decreased cancellous bone was associated with decreased trabecular number and connectivity and higher structure model index, indicating a predominance of rodlike trabeculae. Trabecular thickness was not affected. Cortical bone was thin and porous in 1-month-old Notch3tm1.1Ecan mutant mice of both sexes, although total bone area was not different from controls, indicating normal bone size (Table 2 and Figs. 2 and 3). The decrease in trabecular bone volume was sustained and observed in 4-month-old male, but not female, Notch3tm1.1Ecan mutant mice. Male mice had a significant decrease in cancellous bone volume of ∼30% associated with decreased trabecular number and connectivity. However, cortical bone was not altered in Notch3tm1.1Ecan mice of either sex (Table 2).
Table 2.
Femoral microarchitecture assessed by μCT of 1- and 4-month-old Notch3tm1.1Ecan mutant male and female sex-matched mice and control littermates
μCT was performed in distal femora for trabecular bone and midshaft for cortical bone from 1- and 4-month-old male and female Notch3tm1.1Ecan mutant mice and sex-matched control littermates. Values are means ± S.D. *, significantly different between control and Notch3tm1.1Ecan, p < 0.05 by unpaired t test.
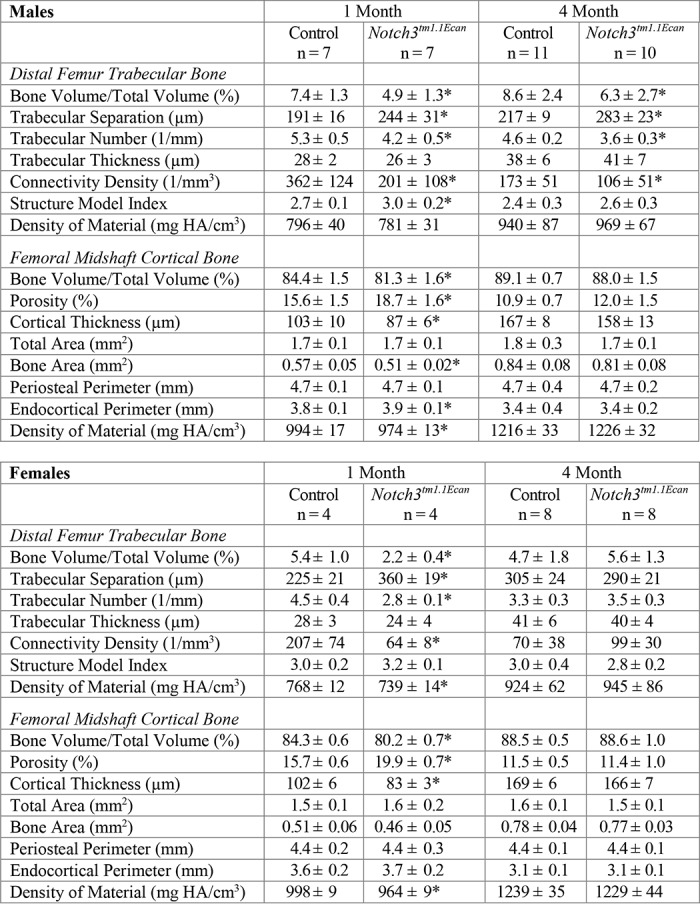
Figure 2.

Femoral architecture assessed by μCT of distal femora from 1-month-old male (A) and female (B) Notch3tm1.1Ecan mutant (black bars) and control littermates (white bars) mice. Data are expressed as cancellous bone volume/total volume (BV/TV), trabecular number (Tb.N), connectivity density (Conn.D), and cortical bone thickness (Ct.Th). Values are expressed as means ± S.D. (error bars); number of observations for Notch3tm1.1Ecan and control males, n = 7 each, and Notch3tm1.1Ecan and control females, n = 4 each. *, significantly different between Notch3tm1.1Ecan mutant and WT controls, p < 0.05 by unpaired t test.
Figure 3.
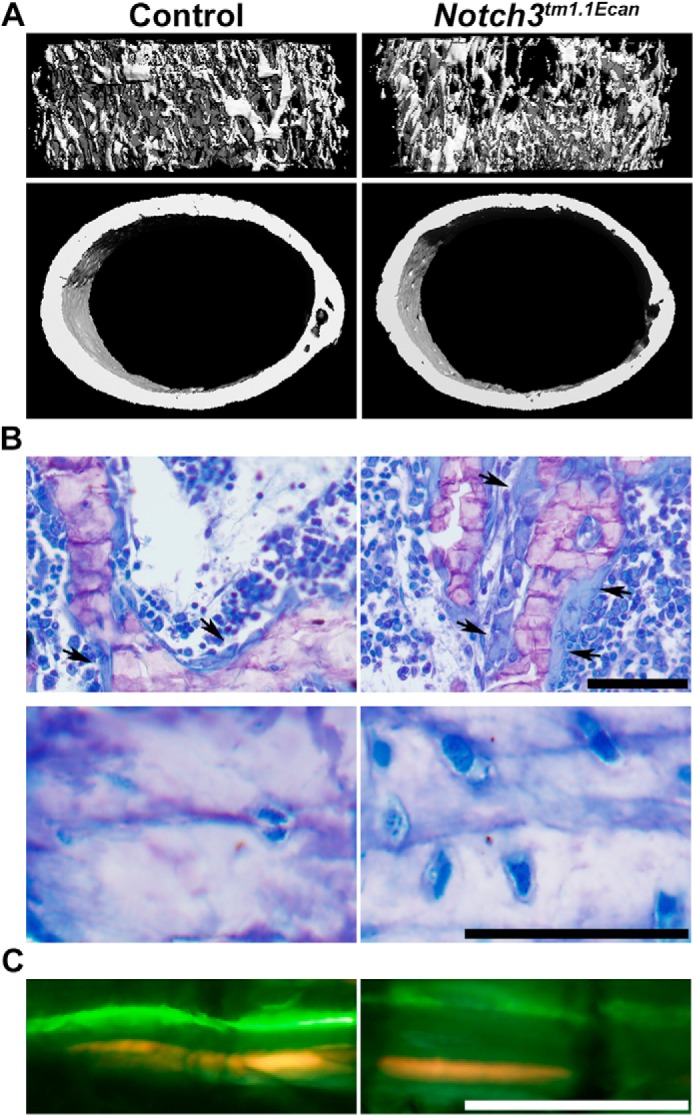
A, representative microcomputed tomography images of proximal trabecular bone and midshaft of femora showing cancellous bone osteopenia and decreased trabecular number and thinner cortical bone inNotch3tm1. 1Ecan mutant mice. The complete data set is shown in Table 2. B, representative static cancellous bone histological sections stained with toluidine blue showing increased number of osteoblasts (arrows) (B, upper panels) and osteocytes (B, lower panels) in Notch3tm1.1Ecan mice. C, calcein and demeclocycline labeling of cancellous bone showing a higher mineral apposition rate in Notch3tm1.1Ecan mice compared with control. The complete data set is shown in Table 3. All representative images are from femora from 1-month-old male Notch3tm1.1Ecan mutant and sex- and age-matched littermate WT controls. Scale bars, 50 μm.
Femoral histomorphometry of Notch3tm1.1Ecan mutant mice
In accordance with the μCT findings, cancellous bone histomorphometry of femora from Notch3tm1.1Ecan mice of both sexes revealed decreased bone volume/tissue volume and trabecular number (Table 3 and Fig. 3). There was an ∼2-fold increase in the number of osteoblasts and in osteoblast surface/bone surface in Notch3tm1.1Ecan mutant mice of both sexes as well as a 13–33% increase in osteocyte cell density. The higher osteoblast number was associated with an increase in mineral apposition rate in male Notch3tm1.1Ecan mutant mice and a nonsignificant (1.8–2.1-fold) increase in bone formation rate. Osteoclast surface/bone surface was increased in male Notch3tm1.1Ecan mutant mice, but osteoclast number/bone perimeter was not affected significantly in either sex. At 4 months of age, the cellular phenotype in male mutant mice was sustained, and they exhibited decreased bone volume/tissue volume associated with a 60% increase in osteoblast number and elevated bone formation rate when compared with WT sex-matched littermate mice (Table 4). However, neither osteoclast surface nor osteoclast number was significantly affected in Notch3tm1.1Ecan mice. These results suggest that Notch3tm1.1Ecan mice have a higher number of osteoblasts, possibly as a manifestation of high bone remodeling, but the cells are not sufficiently active to maintain skeletal homeostasis.
Table 3.
Cancellous bone histomorphometry of 1-month-old Notch3tm1.1Ecan mutant male and female mice and sex-matched control littermates
Histomorphometry was carried out on sagittal sections of distal femora from 1-month-old male and female Notch3tm1.1Ecan mutant mice and sex-matched control littermates. Values are means ± S.D.
| Males |
Females |
|||
|---|---|---|---|---|
| Control (n = 6) | Notch3tm1.1Ecan (n = 6) | Control (n = 7) | Notch3tm1.1Ecan (n = 7) | |
| Static histomorphometry | ||||
| Bone volume/tissue volume (%) | 14.2 ± 3.1 | 9.8 ± 2.6a | 10.3 ± 1.5 | 7.5 ± 2.3a |
| Trabecular separation (μm) | 226 ± 48 | 307 ± 66a | 268 ± 40 | 427 ± 182a |
| Trabecular number (1/mm) | 3.9 ± 0.7 | 3.0 ± 0.5a | 3.4 ± 0.6 | 2.4 ± 0.7a |
| Trabecular thickness (μm) | 36.0 ± 3.4 | 32.1 ± 6.1 | 30.4 ± 2.8 | 31.0 ± 4.8 |
| Osteoblast surface/bone surface (%) | 10.5 ± 6.8 | 25.4 ± 7.6a | 12.1 ± 6.2 | 21.6 ± 7.7a |
| Osteoblasts/bone perimeter (1/mm) | 10.3 ± 6.6 | 24.5 ± 7.2a | 11.9 ± 5.9 | 20.3 ± 6.6a |
| Osteoid surface/bone surface (%) | 1.2 ± 1.4 | 3.5 ± 2.4 | 1.0 ± 0.9 | 2.4 ± 1.6 |
| Osteocytes (mm2) | 565 ± 46 | 751 ± 151a | 628 ± 29 | 710 ± 84a |
| Osteoclast surface/bone surface (%) | 13.9 ± 5.9 | 20.3 ± 4.2b | 20.5 ± 3.3 | 23.7 ± 4.1 |
| Osteoclasts/bone perimeter (1/mm) | 6.6 ± 1.4 | 8.0 ± 1.7 | 7.9 ± 1.1 | 8.7 ± 1.9 |
| Eroded surface/bone surface (%) | 8.3 ± 5.8 | 6.1 ± 2.3 | 6.2 ± 2.4 | 7.5 ± 2.2 |
| Dynamic histomorphometry | ||||
| Mineral apposition rate (μm/day) | 2.3 ± 0.3 | 4.0 ± 0.8a | 2.9 ± 0.9 | 3.9 ± 1.2 |
| Mineralizing surface/bone surface (%) | 2.9 ± 0.7 | 3.8 ± 2.5 | 4.1 ± 2.0 | 6.0 ± 3.5 |
| Bone formation rate (μm3/μm2/day) | 0.07 ± 0.02 | 0.15 ± 0.09 | 0.12 ± 0.06 | 0.21 ± 0.09 |
a Significantly different between control and Notch3tm1.1Ecan, p < 0.05 by unpaired t test.
b p < 0.055.
Table 4.
Cancellous bone histomorphometry of 4-month-old Notch3tm1.1Ecan male and female mutant mice and control littermates
Bone histomorphometry was performed on sagittal sections of distal femora from 4-month-old male and female Notch3tm1.1Ecan mutant mice and sex-matched control littermates. Values are means ± S.D.
| Distal femur trabecular bone | Males |
Females |
||
|---|---|---|---|---|
| Control (n = 8) | Notch3tm1.1Ecan (n = 7) | Control (n = 5) | Notch3tm1.1Ecan (n = 6) | |
| Bone volume/tissue volume (%) | 11.0 ± 2.4 | 8.0 ± 2.0a | 5.7 ± 3.3 | 7.4 ± 2.4 |
| Trabecular separation (μm) | 326 ± 52 | 455 ± 93a | 718 ± 257 | 481 ± 160 |
| Trabecular number (1/mm) | 2.8 ± 0.4 | 2.1 ± 0.4a | 1.5 ± 0.6 | 2.1 ± 0.6 |
| Trabecular thickness (μm) | 40.3 ± 11.5 | 38.5 ± 8.1 | 38.0 ± 6.4 | 36.0 ± 4.6 |
| Osteoblast surface/bone surface (%) | 7.7 ± 2.6 | 12.7 ± 3.3a | 9.2 ± 0.8 | 10.3 ± 2.2 |
| Osteoblasts/bone perimeter (1/mm) | 6.8 ± 1.9 | 10.8 ± 3.4a | 7.7 ± 1.5 | 7.8 ± 3.8 |
| Osteoid surface/bone surface (%) | 0.7 ± 0.4 | 1.5 ± 0.6a | 1.0 ± 1.0 | 1.2 ± 0.8 |
| Osteocytes/bone area (mm2) | 599 ± 118 | 660 ± 99 | 735 ± 205 | 779 ± 148 |
| Osteoclast surface/bone surface (%) | 8.1 ± 2.5 | 10.2 ± 2.9 | 13.5 ± 7.5 | 14.9 ± 6.0 |
| Osteoclasts/bone perimeter (1/mm) | 3.2 ± 0.9 | 4.1 ± 1.2 | 5.4 ± 2.5 | 5.5 ± 2.2 |
| Eroded surface/bone surface (%) | 3.3 ± 1.0 | 3.7 ± 1.0 | 4.7 ± 3.5 | 5.1 ± 1.7 |
| Mineral apposition rate (μm/day) | 0.8 ± 0.2 | 1.0 ± 0.1 | 1.2 ± 0.1 | 1.6 ± 0.3 |
| Mineralizing surface/bone surface (%) | 6.5 ± 1.1 | 9.8 ± 4.7 | 8.9 ± 1.6 | 10.0 ± 5.0 |
| Bone formation rate (μm3/μm2/day) | 0.05 ± 0.02 | 0.09 ± 0.04a | 0.11 ± 0.02 | 0.15 ± 0.09 |
a Significantly different between control and Notch3tm1.1Ecan, p < 0.05 by unpaired t test.
Gene expression in Notch3tm1.1Ecan mutant mice
To search for mechanisms that could operate in Notch3tm1.1Ecanmutants, tibiae were analyzed for changes in gene expression. Quantitative RT-PCR (qRT-PCR) revealed expression of Notch36691-TAATGA transcripts and increased Hey1, Hey2, and HeyL mRNA levels in tibiae from mutant mice, demonstrating that Notch signaling was activated in bone (Fig. 4). In agreement with the increase in osteoclast surface in mutant mice, the expression of Tnfsf11 mRNA, encoding for receptor activator of NF-κB ligand (RANKL), was increased in femora from Notch3tm1.1Ecan mutant mice. A modest increase in Tnfrsf11b mRNA, encoding for osteoprotegerin, was noted.
Figure 4.

Notch36691-TAATGA, Hey1, Hey2, HeyL, Hes1, Tnfsf11 (RANKL), and Tnfrsf11b (osteoprotegerin) mRNA levels in tibiae from 1-month-old Notch3tm1.1Ecan mutant (black bars) and control littermate mice (white bars). Transcript levels are expressed as copy number corrected for Rpl38. Values are means ± S.D. (error bars); n = 8 for control; n = 8 for Notch3tm1.1Ecan for all transcripts with the exception of Tnfsf11 where n = 7 for control. Data are derived from biological replicates. *, significantly different between Notch3tm1.1Ecan mutant and WT control, p < 0.05 by unpaired t test.
Calvarial osteoblast cultures
To pursue the consequences of the Notch3tm1.1Ecan mutation in skeletal cells, calvarial osteoblasts were cultured. Osteoblasts from Notch3tm1.1Ecan mice, but not from controls, expressed Notch36691-TAATGA transcripts. Hey1 was transiently increased in Notch3tm1.1Ecan osteoblasts, whereas HeyL was increased for a 3-week culture period, documenting sustained activation of Notch signaling (Fig. 5). Osteoblast cultures from Notch3tm1.1Ecan mice expressed higher levels of Bglap (encoding for osteocalcin) and Tnfsf11 mRNAs and lower levels of Tnfrsf11b mRNA than control cultures. To estimate the rate of cellular proliferation, the reduction of 3-[4,5-dimethylthiazol-2-yl]-2,5-diphenyltetrazolium bromide (MTT) to its formazan salt was measured during the initial phases of the culture. This “MTT assay” measures mitochondrial activity of cells and as such is a proxy for cell proliferation. Osteoblasts from Notch3tm1.1Ecan mice proliferated at a rate 1.5 higher than that of cells from WT controls, an effect that is consistent with the increased number of osteoblasts in Notch3tm1.1Ecan mutants in vivo (Fig. 5). The results indicate enhanced osteoblast proliferation and differentiation in cells from Notch3tm1.1Ecan mutants as well as an increased ratio of RANKL to osteoprotegerin, providing a possible explanation for the findings in vivo.
Figure 5.

Cultured calvarial osteoblast-enriched cells from Notch3tm1.1Ecan mutant (black bars; filled black circles) and WT (white bars; open circles) littermate controls. A, total RNA was extracted, and gene expression was measured by qRT-PCR in the presence of specific primers and probes. Data are expressed as Notch36691-TAATGA copy number corrected for Rpl38 (n = 4) or relative expression of Notch3, Hey1, Hey2, HeyL, Bglap, Tnfsf11 (RANKL), and Tnfrsf11b (osteoprotegerin) after correction for Rpl38. Values are means ± S.D. (error bars); number of observations for control, n = 8, and for Notch3tm1.1Ecan, n = 8. Data were pooled from two experiments derived from technical replicates, and the control for each transcript (except Notch36691-TAATGA) was normalized to 1. B, change in the number of biochemically active cells estimated by measuring absorbance at 490 nm following a 4-h exposure to MTT. Data from control or Notch3tm1.1Ecan cells at day 0 are normalized to 1. Values are means ± S.D. (error bars); number of observations for control, n = 4, and for Notch3tm1.1Ecan, n = 4 with the exception of Notch3tm1.1Ecan at day 1 where n = 3. Data are derived from technical replicates. *, significantly different between Notch3tm1.1Ecan mutant and WT control cells, p < 0.05 in A by unpaired t test and in B by ANOVA with Holm–Šídák post hoc analysis.
Osteocyte-enriched cultures
Because a possible explanation for the Notch3tm1.1Ecan phenotype was an increase in osteoclastogenesis and because osteocytes play a major role in the control of bone resorption, we examined the expression of Tnfsf11 mRNA in enzymatically/EDTA-digested osteocyte-rich femora (14, 35). Osteocytes expressed the Notch36691-TAATGA transcript and increased levels of Hey1, Hey2, and HeyL, indicating enhanced Notch signaling. Tnfsf11 mRNA was increased 1.6-fold in osteocytes from Notch3tm1.1Ecan mutant mice, whereas the expression of Tnfrsf11b was not affected (Fig. 6).
Figure 6.

Isolated osteocyte-enriched cells from Notch3tm1.1Ecan mutant (black bars) and WT (white bars) littermate controls. Total RNA was extracted, and gene expression was measured by qRT-PCR in the presence of specific primers and probes. Data are expressed as Notch36691-TAATGA, Hey1, Hey2, HeyL, Hes1, Tnfsf11 (RANKL), and Tnfrsf11b (osteoprotegerin) copy number corrected for Rpl38. Values are means ± S.D. (error bars); number of observations for control, n = 7, and for Notch3tm1.1Ecan, n = 7. Date are derived from biological replicates. *, significantly different between Notch3tm1.1Ecan mutant and WT control cells, p < 0.05 by unpaired t test.
In vitro osteoclast formation
To explore whether a direct effect on osteoclast differentiation was operational, bone marrow–derived macrophages (BMMs) were isolated from Notch3tm1.1Ecan mutants and littermate controls. BMMs were cultured in the presence of macrophage colony-stimulating factor (M-CSF) at 30 ng/ml for 3 days and subsequently in the presence of M-CSF (30 ng/ml) and RANKL at 10 ng/ml. The number of tartrate-resistant acid phosphatase (TRAP)-positive multinucleated cells was increased in cultures from Notch3tm1.1Ecan mutants (Fig. 7). However, Notch3tm1.1Ecan mutant BMMs did not express Notch36691-TAATGA transcripts, and neither mutant nor WT cells expressed detectable levels of Notch3 mRNA. The results indicate that even though Notch3tm1.1Ecan mutant cells exhibited enhanced osteoclast differentiation the cellular phenotype is likely secondary to events that occurred in vivo prior to cell isolation, such as exposure to increased levels of RANKL. To determine whether the osteoblast or osteoclast was responsible for the enhanced osteoclastogenesis, BMMs from control and Notch3tm1.1Ecan mice were cocultured with osteoblasts from the respective mouse lines. Osteoclast differentiation was increased in BMMs from Notch3tm1.1Ecan mutants whether they were cultured in the presence of WT or mutant osteoblasts. In addition, osteoblasts from Notch3tm1.1Ecan mice enhanced osteoclastogenesis in both WT and Notch3tm1.1Ecan mutant BMMs. The results demonstrate both a BMM- and an osteoblast-dependent effect as responsible for the increased osteoclast differentiation in Notch3tm1.1Ecan mutants.
Figure 7.

BMMs harvested from long bones of Notch3tm1.1Ecan mutants (black bars) and WT littermate controls (white bars) cultured for 72 h in the presence of M-CSF at 30 ng/ml. In A, cells were seeded on culture dishes in the presence of M-CSF at 30 ng/ml and RANKL at 10 ng/ml and assessed for the appearance of osteoclasts defined as TRAP-positive multinucleated cells. In B, BMMs from control and Notch3tm1.1Ecan mutant mice were seeded on culture dishes in the presence of osteoblasts (OB) from control or Notch3tm1.1Ecan mutant mice with 1,25-dihydroxyvitamin D3 at 10 nm and assessed for the appearance of TRAP-positive multinucleated cells. Representative images of TRAP-stained multinucleated cells are shown in the left panels. Data are expressed as total number of TRAP-positive multinucleated cells/well. Values are means ± S.D. (error bars); n = 4 technical replicates. *, significantly different between Notch3tm1.1Ecan and WT control BMMs, p < 0.05 in A by unpaired t test and in B by ANOVA with Holm–Šídák post hoc analysis. #, significantly different between Notch3tm1.1Ecan and WT osteoblasts by ANOVA.
Discussion
The present work indicates that mice harboring a Notch3 gain-of-function mutation exhibit bone loss that affects both the cancellous and cortical compartments. The osteopenia was detected in 1-month-old mice of both sexes, although in mature animals the osteopenic phenotype affected the cancellous bone of male, but not female, mutant mice. The abatement of the osteopenia in mature female mice might have been related to a decrease in bone remodeling, secondary to an effect of estrogens on the skeleton. Estrogens decrease the lifespan of osteoclasts by promoting their apoptosis and suppress the secretion of the cytokine IL-7 by osteoblasts with a consequent decrease in RANKL expression and osteoclastogenesis (36–38). The phenotype of the Notch3tm1.1Ecan mutant mouse is congruent with the bone loss observed in humans with LMS. However, there is no information on sex- or age-related changes in bone mass in subjects affected by LMS because the number of cases reported is small (29, 31). Notch3tm1.1Ecan mutant mice did not have obvious neurological manifestations reported in humans afflicted by the disease. Moreover, histopathology of brain, lungs, heart, liver, spleen, and kidneys did not reveal any obvious abnormalities in Notch3tm1.1Ecan mice.4 A limitation of the present work is that relatively young mice were studied, and the phenotype might evolve as the mice age.
Stabilization of NOTCH3 protein is probably responsible for the increased Notch3 activity. The mutation in Notch3tm1.1Ecan mice was introduced upstream of the PEST domain, and this domain is essential for the ubiquitination of NOTCH3 (39). Similarly, mutations in exon 34 upstream of the PEST domain of Notch1 or Notch2 result in Notch gain of function and enhanced Notch signaling (40–42). The mechanism in LMS is analogous to that found in Hajdu–Cheney syndrome where affected individuals harbor mutations in exon 34 of NOTCH2 (43–45). The inheritance of LMS is not established, and autosomal-dominant inheritance as well as de novo heterozygous truncating mutations in exon 33 of NOTCH3 has been reported (29).
The osteopenia of Notch3tm1.1Ecan mutants was associated with an increase in the number of osteoblasts secondary to enhanced cell replication. Although bone formation was increased, the enhanced osteoblast number and function were not sufficient to maintain skeletal homeostasis, so bone loss occurred. In vitro cultures of osteoblasts revealed increased Bglap expression in Notch3tm1.1Ecan cells, indicating that osteoblast maturation was not impaired. There was a 45% increase in osteoclast surface/bone surface. This finding indicates that an increase in bone resorption contributed to the phenotype. This was secondary to an increased expression of RANKL and suppressed osteoprotegerin in cells of the osteoblast lineage. The capacity of osteoclast precursors to differentiate into mature osteoclasts in response to RANKL was enhanced in Notch3tm1.1Ecan mutants, although cells of the myeloid lineage do not express either WT or mutant Notch3 transcripts. This suggests that the enhanced osteoclastogenesis in vitro reflected events occurring in vivo. Cocultures of BMMs with osteoblasts confirmed that the osteoblast of Notch3tm1.1Ecan mutants contributed to the enhanced osteoclastogenesis, an effect congruent with the increased expression of RANKL by the osteoblast. There was a greater number of osteocytes in cancellous bone of Notch3tm1.1Ecan mice, and this is probably secondary to the increased number of osteoblasts. Osteocytes are an important source of RANKL and likely contributed to the osteopenic phenotype observed (46–49).
The phenotype reported in Notch3tm1.1Ecan mutant mice is different from that observed in Notch1 NICD–expressing mice or that reported in mice harboring a Notch2 gain-of-function mutation replicating Hajdu–Cheney syndrome (26). Notch1 activation in undifferentiated osteoblasts precludes their maturation and causes marked osteopenia, whereas NOTCH2 gain of function causes osteopenia secondary to an increase in osteoclast number and bone resorption (22, 26, 50). In contrast to the inhibitory actions of Notch1 and Notch2 on osteoblastogenesis, Notch3 gain of function enhanced osteoblast replication and function, establishing a distinct role of Notch3 in the skeleton. Although Notch2 and Notch3 enhance osteoclastogenesis, the mechanisms appear to be distinct. Notch2 is expressed by osteoclasts and has direct as well as osteoblast-dependent effects on osteoclastogenesis, whereas Notch3 is not expressed in cells of the myeloid/osteoclast lineage and enhances osteoclast differentiation by inducing RANKL and suppressing osteoprotegerin in the osteoblast lineage (20, 26). Notch3, like Notch1 and Notch2, induced the expression of Notch canonical target genes. It is reasonable to believe that the Notch3 NICD and RBPJκ have interactions distinct from the interactions of the Notch1 or Notch2 NICD; this would result in specific downstream events not shared by either Notch1 or Notch2 (19). Another source of the different actions of Notch receptors relates to their pattern of cellular expression as shown in the present work.
Although the goal was to replicate LMS, a limitation of the work is the use of a global mutation, so systemic or indirect consequences of the mutant Notch3tm1.1Ecan in bone cannot be excluded. However, no obvious neurological alterations were observed in mutant mice, and histopathology of multiple organs revealed no abnormalities. Other limitations of the work relate to the use of the CRISPR/Cas9 approach to create the Notch3tm1.1Ecan mouse model because it could have resulted in off-target effects. However, most of the off-target effects reported with CRISPR/Cas9 technology have used human-induced pluripotent or embryonic stem cells transfected with Cas9 and sgRNA expression vectors, generating Cas9 and sgRNA in significant amounts for a prolonged period of time and therefore increasing the possibility of off-target effects (51, 52). A limited amount of Cas9 mRNA and sgRNA was injected into one-cell embryos to create the Notch3tm1.1Ecan mutants described, decreasing the likelihood of off-target effects. Moreover, the sgRNA selected scored high by inverse likelihood of off-target binding, and we did not detect a change in phenotype following three to four rounds of matings of Notch3tm1.1Ecan heterozygous mice with WT mice (53). This suggests that off-target effects, which should segregate out, are not responsible for the phenotype.
Notch3 is associated with a variety of pathological conditions in addition to LMS. Notch3 promotes tumor cell proliferation and has been implicated in the bone-invasive potential of carcinoma of the breast and multiple myeloma and in the pathogenesis of mandibular torus (27, 54–57). Mutations in the extracellular domain of NOTCH3 cause cerebral autosomal-dominant arteriopathy with subcortical infarcts and leukoencephalopathy syndrome (CADASIL) (58–60). This cerebral vascular disorder is characterized by strokes at a young age and accumulation of NOTCH3 in small vessels of affected individuals (61).
In conclusion, Notch3tm1.1Ecan mice harboring a mutation analogous to that found in subjects with LMS exhibit marked osteopenia despite an increase in osteoblast proliferation and function. The osteopenia is associated with enhanced RANKL and suppressed osteoprotegerin expression by cells of the osteoblast lineage.
Experimental procedures
Lateral meningocele mutant mice (Notch3tm1.1Ecan)
RNA-guided CRISPR-associated Cas9 nuclease technology was used to create a mutation mimicking that found in a subject afflicted by LMS at the Center for Mouse Genome Modification of UConn Health (31–34). The subject harbored a single bp insertion at c.6692_93insC (from the start of translation) of NOTCH3, predicting the premature termination of a protein product devoid of the PEST domain. To engineer the Notch3tm1.1Ecan global mutant allele, the corresponding human NOTCH3 mutation was introduced into the mouse genome (6691–6696 ACCAAG→TAATGA), leading to a T2231X change at the amino acid level and creating a truncated protein of 2230 amino acids (versus 2318 in wildtype) devoid of the PEST domain. The databases http://zifit.partners.org/ZiFiT/5 (80, 81) and http://crispr.mit.edu5 were utilized to evaluate potential sgRNAs, and Notch3 sgRNA 5′-AACCCGCAGUAGCCCCACCA was selected because of its high score and limited probabilities of off-target effects and designed to cleave between nucleotides 6691 and 6692 of exon 33 of Notch3 adjacent to a protospacer adjacent motif (Fig. 1). A synthetic DNA fragment containing a T7 promoter driving sequences coding for Notch3 sgRNA was used as a template to synthesize the sgRNA. A single-strand DNA of 146 nucleotides containing the tandem stop codon TAATGA and 70 nucleotides of Notch3 homologous 5′- and 3′-arms (Fig. 1) were coinjected into C57BL/6J one-cell embryos with Notch3 sgRNA and Cas9 mRNA. Injected embryos were transferred into CD1 pseudopregnant foster females, and progeny were screened by PCR. The proper insertion of the Notch3 6691–6696 ACCAAG→TAATGA mutation was confirmed by sequencing of genomic DNA obtained from ear punches from F1 mice (Fig. 1) (GENEWIZ, South Plainfield, NJ). Heterozygous F1 mice were crossed with C57BL/6J WT mice to establish the mutant mouse line. Notch3tm1.1Ecan heterozygous mutant mice were crossed with WT mice to generate Notch3tm1.1Ecan mutants and sex-matched littermate controls in a C57BL/6J genetic background for study. Genotypes were determined by PCR analysis of tail DNA using forward primer 5′-GTGCTCAGCTTTGGTCTGCTC-3′ and reverse primer 5′-CGCAGGAAGCGCGCTCATTA-3′ for Notch3tm1.1Ecan or 5′-CGCAGGAAGCGGGCCTTGG-3′ for the WT allele (Integrated DNA Technologies, Coralville, IA). Studies were approved by the Institutional Animal Care and Use Committee of UConn Health.
Serum glucose and hormone assays
17β-Estradiol, murine PTH, and insulin were measured by ELISA assays in serum from Notch3tm1.1Ecan and control mice following an overnight fast using commercially available kits (17β-estradiol ELISA kit from Abcam, Cambridge, MA; murine insulin ELISA kit from Thermo Fisher Scientific, Waltham, MA; and mouse PTH(1–84) ELISA kit from Quidel Corp., San Diego, CA). Serum glucose was measured using an EnzyChrom glucose assay kit from BioAssay Systems (Hayward, CA).
Densitometry and body composition
Total body fat (grams) was measured on anesthetized mice using a PIXImus small animal DEXA system (GE Medical System/Lunar, Madison, WI) (62).
Microcomputed tomography
Femoral microarchitecture was determined using a μCT instrument (Scanco μCT 40, Scanco Medical AG, Bassersdorf, Switzerland), which was calibrated periodically using a phantom provided by the manufacturer (63, 64). Femora were scanned in 70% ethanol at high resolution, energy level of 55 peak kilovoltage (kVp), intensity of 145 μA, and integration time of 200 ms as reported previously (26, 50). A total of 100 slices at midshaft and 160 slices at the distal metaphysis were acquired at an isotropic voxel size of 216 μm3 and a slice thickness of 6 μm and chosen for analysis. Cancellous bone volume fraction (bone volume/total volume) and microarchitecture were evaluated starting ∼1.0 mm proximal from the femoral condyles. Contours were manually drawn every 10 slices, a few voxels away from the endocortical boundary, to define the region of interest for analysis, whereas the remaining slice contours were iterated automatically. Total volume, bone volume, bone volume fraction, trabecular thickness, trabecular number, connectivity density, structure model index, and material density were measured in trabecular regions using a Gaussian filter (σ = 0.8) and user-defined thresholds (63, 64). For analysis of cortical bone, contours were iterated across 100 slices along the cortical shell of the femoral midshaft, excluding the marrow cavity. Analysis of bone volume/total volume, porosity, cortical thickness, total cross-sectional and cortical bone area, periosteal and endosteal perimeter, and material density were conducted using a Gaussian filter (σ = 0.8, support = 1) with operator-defined thresholds.
Bone histomorphometry
Bone histomorphometry was carried out in 1- and 4-month-old mice injected with 20 mg/kg calcein and 50 mg/kg demeclocycline at a 2- and 7-day interval, respectively, and sacrificed 2 days after demeclocycline administration as reported previously (26, 50). Femora were dissected, fixed in 70% ethanol, and embedded in methyl methacrylate. For cancellous bone analysis, bones were sectioned at a thickness of 5 μm along the sagittal plane on a Microm microtome (Richards-Allan Scientific, Kalamazoo, MI) and stained with 0.1% toluidine blue. Static and dynamic parameters of bone morphometry were measured in a defined area between 0.35 and 2.16 mm from the growth plate at a magnification of 100× using an OsteoMeasure morphometry system (Osteometrics, Atlanta, GA). Stained sections were used to measure trabecular bone area; trabecular number and thickness; osteoblast, osteocyte, and osteoclast number; and osteoid and eroded surface. Mineralizing surface per bone surface and mineral apposition rate were measured on unstained sections visualized under UV light and a triple diamidino-2-phenylindole/fluorescein/Texas Red set long-pass filter, and bone formation rate was calculated. Terminology and units used for cancellous and cortical bone histomorphometry are those recommended by the Histomorphometry Nomenclature Committee of the American Society for Bone and Mineral Research (65, 66).
Osteoblast-enriched cell cultures and cell viability assay
Parietal bones from 3–5-day-old Notch3tm1.1Ecan mice and littermate controls were exposed to 1.2 units/ml Liberase TL (Sigma-Aldrich) for 20 min at 37 °C, and cells were extracted in five consecutive reactions (67). Cells from the last three digestions were pooled and seeded at a density of 10,000 cells/cm2 as described previously (50, 68). Osteoblast-enriched cells were cultured in Dulbecco's modified Eagle's medium supplemented with nonessential amino acids (both from Thermo Fisher Scientific), 20 mm HEPES, 100 μg/ml ascorbic acid (both from Sigma-Aldrich), and 10% heat-inactivated fetal bovine serum (FBS; Atlanta Biologicals, Norcross, GA) in a humidified 5% CO2 incubator at 37 °C. The number of biochemically active osteoblasts was estimated by measuring the product of MTT reduction to formazan with the Vybrant MTT cell proliferation assay kit (Thermo Fisher Scientific) according to the manufacturer's instructions (69).
Osteocyte-enriched cultures
Osteocyte-enriched cells were obtained following a modification of a method described previously (26, 35). Femora were removed aseptically from 1-month-old experimental and control mice. The surrounding tissues was dissected, the proximal epiphyseal end was excised, and the bone marrow was removed by centrifugation. The distal epiphysis was excised, and femora were digested for 20 min at 37 °C with type II bacterial collagenase pretreated with N-α-tosyl-l-lysyl-chloromethyl ketone hydrochloride and subsequently exposed to 5 mm EDTA for 10 min at 37 °C. The resulting osteocyte-enriched cortical femora were cultured individually in Dulbecco's modified Eagle's medium supplemented with nonessential amino acids (both from Life Technologies), 100 μg/ml ascorbic acid, and 10% FBS for 3 days at 37 °C in a humidified 5% CO2 incubator as described (26).
Culture of BMMs and osteoclast formation
To obtain BMMs, the marrow from Notch3tm1.1Ecn mice and littermate controls was removed by flushing with a 26-gauge needle, and erythrocytes were lysed in 150 mm NH4Cl, 10 mm KHCO3, and 0.1 mm EDTA (pH 7.4) as described previously (26, 50, 70). Cells were centrifuged, and the sediment was suspended in α-minimum essential medium (α-MEM) (Thermo Fisher Scientific) in the presence of 10% FBS and recombinant human M-CSF at 30 ng/ml as described (50). M-CSF cDNA and expression vector were obtained from D. Fremont (Washington University, St. Louis, MO), and M-CSF was purified as reported previously (71). Cells were seeded on uncoated plastic Petri dishes at a density of 300,000 cells/cm2 and cultured for 3–4 days. For osteoclast formation, cells were collected following treatment with 0.25% trypsin and EDTA for 5 min and seeded on tissue culture plates at a density of 47,000 cells/cm2 in α-MEM with 10% FBS, 30 ng/ml M-CSF, and 10 ng/ml recombinant murine RANKL. Tnfsf11 cDNA, encoding RANKL, and expression vector were obtained from M. Glogauer (Toronto, Canada), and glutathione S-transferase–tagged RANKL was expressed and purified as described (72). To determine the contribution of osteoblast-derived factors to osteoclast formation, calvarial osteoblast-enriched cells from Notch3tm1.1Ecan mutant and WT control littermates were seeded at a density of 15,700 cells/cm2 in α-MEM in the presence of BMMs from either genotype at a density of 47,000 cells/cm2 and cultured with 1,25-dihydroxyvitamin D3 at 10 nm. Cultures were carried out until the formation of multinucleated TRAP-positive cells was achieved. TRAP enzyme histochemistry was conducted using a commercial kit (Sigma-Aldrich), in accordance with the manufacturer's instructions, as reported previously (50). TRAP-positive cells containing three or more nuclei were considered osteoclasts.
Quantitative reverse transcription–polymerase chain reaction
Total RNA was extracted from cells with the RNeasy kit (Qiagen, Valencia, CA) and from homogenized tibiae or osteocyte-enriched femoral fragments, following the removal of the bone marrow by centrifugation, with the micro RNeasy kit (Qiagen), in accordance with the manufacturer's instructions, as reported previously (26, 50, 73, 74). The integrity of the RNA from tibiae and osteocyte-rich fragments was assessed by microfluidic electrophoresis on an Experion instrument (Bio-Rad), and only RNA with a quality indicator number equal to or higher than 7.0 was used for subsequent analysis. Equal amounts of RNA were reverse transcribed using the iScript RT-PCR kit (Bio-Rad) and amplified in the presence of specific primers (Integrated DNA Technologies) (Table 5) with iQ SYBR Green Supermix or SsoAdvanced Universal SYBR Green Supermix (Bio-Rad) at 60 °C for 35 cycles. Transcript copy number was estimated by comparison with a serial dilution of cDNA for Bglap (encoding for osteocalcin; from J. Lian, University of Vermont, Burlington, VT), Hey1 and Hey2 (both from T. Iso, Gunma University, Gunma, Japan), HeyL (from D. Srivastava, Gladstone Institute of Cardiovascular Disease, San Francisco, CA), Tnfsf11 (from Source BioScience, Nottingham, UK), or Tnfrsf11b (from American Type Tissue Culture Collection (ATCC), Manassas, VA) (75–77). Notch3tm1.1Ecan transcript copy number was estimated by comparison with a serial dilution of a synthetic DNA fragment (Integrated DNA Technologies) containing ∼90 bp surrounding the Notch3 6691–6696 ACCAAG→TAATGA mutation and cloned into pcDNA3.1(−) (Life Technologies) by isothermal single-reaction assembly using commercially available reagents (New England Biolabs, Ipswich, MA) (78). Amplification reactions were conducted in a CFX96 qRT-PCR detection system (Bio-Rad), and fluorescence was monitored during every PCR cycle at the annealing step. Data are expressed as copy number or relative transcript expression, both corrected for Rpl38 (from ATCC) (79).
Table 5.
Primers used for qRT-PCR determinations
GenBank accession numbers identify transcript recognized by primer pairs.
| Gene | Strand | Sequence (5′–3′) | GenBank accession no. |
|---|---|---|---|
| Bglap | Forward | 5′-GACTCCGGCGCTACCTTGGGTAAG-3′ | NM_001037939 |
| Reverse | 5′-CCCAGCACAACTCCTCCCTA-3′ | ||
| Hes1 | Forward | 5′-ACCAAAGACGGCCTCTGAGCACAGAAAGT-3′ | NM_008235 |
| Reverse | 5′-ATTCTTGCCCTTCGCCTCTT-3′ | ||
| Hey1 | Forward | 5′-ATCTCAACAACTACGCATCCCAGC-3′ | NM_010423 |
| Reverse | 5′-GTGTGGGTGATGTCCGAAGG-3′ | ||
| Hey2 | Forward | 5′-AGCGAGAACAATTACCCTGGGCAC-3′ | NM_013904 |
| Reverse | 5′-GGTAGTTGTCGGTGAATTGGACCT-3′ | ||
| HeyL | Forward | 5′-CAGTAGCCTTTCTGAATTGCGAC-3′ | NM_013905 |
| Reverse | 5′-AGCTTGGAGGAGCCCTGTTTC-3′ | ||
| Notch3 | Forward | 5′-CCGATTCTCCTGTCGTTGTCTCC-3′ | NM_008716 |
| Reverse | 5′-TGAACACAGGGCCTGCTGAC-3′ | ||
| Notch36691-TAATGA | Forward | 5′-AACCCGCAGTAGCCCCTAATG-3′ | Not applicable |
| Reverse | 5′-ATAAGGATGCTCGCTGGGAACC-3′ | ||
| Rpl38 | Forward | 5′-AGAACAAGGATAATGTGAAGTTCAAGGTTC-3′ | NM_001048057; NM_001048058; NM_023372 |
| Reverse | 5′-CTGCTTCAGCTTCTCTGCCTTT-3′ | ||
| Tnfrsf11b | Forward | 5′-CAGAAAGGAAATGCAACACATGACAAC-3′ | NM_008764 |
| Reverse | 5′-GCCTCTTCACACAGGGTGACATC-3′ | ||
| Tnfsf11 | Forward | 5′-TATAGAATCCTGAGACTCCATGAAAAC-3′ | NM_011613 |
| Reverse | 5′-CCCTGAAAGGCTTGTTTCATCC-3′ |
Statistics
Data are expressed as means ± S.D. All data except for osteoblast and BMM cultures represent biological replicates. qRT-PCR values were derived from two technical replicates of biological replicates as indicated in the text and tables. Statistical differences were determined by unpaired Student's t test or analysis of variance (ANOVA) with Holm–Šídák post hoc analysis for pairwise or multiple comparisons.
Author contributions
E. C. conceptualization; E. C., J. Y., and S. Z. formal analysis; E. C. funding acquisition; E. C. investigation; E. C. writing-original draft; E. C., J. Y., L. S., and S. Z. writing-review and editing; J. Y., L. S., S.-P. Y., and S. Z. methodology.
Supplementary Material
Acknowledgments
We thank J. Lian for Bglap cDNA, T. Iso for Hey1 and Hey2 cDNAs, D. Srivastava for HeyL cDNA, D. Bridgewater and T. Eller for technical assistance, and M. Yurczak for secretarial support.
This work was supported by NIAMS Grants AR063049 and AR072987 and NIDDK Grant DK045227 from the National Institutes of Health (all to E. C.). The authors declare that they have no conflicts of interest with the contents of this article. The content is solely the responsibility of the authors and does not necessarily represent the official views of the National Institutes of Health.
This article was selected as one of our Editors' Picks.
This article contains Fig. S1.
E. Canalis, unpublished observations.
Please note that the JBC is not responsible for the long-term archiving and maintenance of this site or any other third party-hosted site.
- NICD
- Notch intracellular domain
- α-MEM
- α-minimum essential medium
- BMM
- bone marrow–derived macrophage
- FBS
- fetal bovine serum
- Hes
- hairy and enhancer of split
- Hey
- HES-related with YRPW motif
- LMS
- lateral meningocele syndrome
- M-CSF
- macrophage colony-stimulating factor
- μCT
- microcomputed tomography
- MTT
- 3-[4,5-dimethylthiazol-2-yl]-2,5-diphenyltetrazolium bromide
- PTH
- parathyroid hormone
- qRT-PCR
- quantitative RT-PCR
- RANKL
- receptor activator of NF-κB ligand
- RBPJκ
- recombination signal–binding protein for Ig of κ region
- sg
- single guide
- TRAP
- tartrate-resistant acid phosphatase
- Tnfsf11
- tumor necrosis factor superfamily member 11
- Tnfrsf11b
- tumor necrosis factor receptor superfamily 11b
- Bglap
- γ-carboxyglutamate protein
- sg
- single guide
- ANOVA
- analysis of variance.
References
- 1. Zanotti S., and Canalis E. (2016) Notch signaling and the skeleton. Endocr. Rev. 37, 223–253 10.1210/er.2016-1002 [DOI] [PMC free article] [PubMed] [Google Scholar]
- 2. Artavanis-Tsakonas S., Rand M. D., and Lake R. J. (1999) Notch signaling: cell fate control and signal integration in development. Science 284, 770–776 10.1126/science.284.5415.770 [DOI] [PubMed] [Google Scholar]
- 3. Lindsell C. E., Boulter J., diSibio G., Gossler A., and Weinmaster G. (1996) Expression patterns of Jagged, Delta1, Notch1, Notch2, and Notch3 genes identify ligand-receptor pairs that may function in neural development. Mol. Cell. Neurosci. 8, 14–27 10.1006/mcne.1996.0040 [DOI] [PubMed] [Google Scholar]
- 4. Cordle J., Redfieldz C., Stacey M., van der Merwe P. A., Willis A. C., Champion B. R., Hambleton S., and Handford P. A. (2008) Localization of the Delta-like-1-binding site in human Notch-1 and its modulation by calcium affinity. J. Biol. Chem. 283, 11785–11793 10.1074/jbc.M708424200 [DOI] [PubMed] [Google Scholar]
- 5. Sanchez-Irizarry C., Carpenter A. C., Weng A. P., Pear W. S., Aster J. C., and Blacklow S. C. (2004) Notch subunit heterodimerization and prevention of ligand-independent proteolytic activation depend, respectively, on a novel domain and the LNR repeats. Mol. Cell. Biol. 24, 9265–9273 10.1128/MCB.24.21.9265-9273.2004 [DOI] [PMC free article] [PubMed] [Google Scholar]
- 6. Kovall R. A. (2008) More complicated than it looks: assembly of Notch pathway transcription complexes. Oncogene 27, 5099–5109 10.1038/onc.2008.223 [DOI] [PubMed] [Google Scholar]
- 7. Kovall R. A. (2007) Structures of CSL, Notch and Mastermind proteins: piecing together an active transcription complex. Curr. Opin. Struct. Biol. 17, 117–127 10.1016/j.sbi.2006.11.004 [DOI] [PubMed] [Google Scholar]
- 8. Ohtsuka T., Ishibashi M., Gradwohl G., Nakanishi S., Guillemot F., and Kageyama R. (1999) Hes1 and Hes5 as notch effectors in mammalian neuronal differentiation. EMBO J. 18, 2196–2207 10.1093/emboj/18.8.2196 [DOI] [PMC free article] [PubMed] [Google Scholar]
- 9. Iso T., Sartorelli V., Poizat C., Iezzi S., Wu H. Y., Chung G., Kedes L., and Hamamori Y. (2001) HERP, a novel heterodimer partner of HES/E(spl) in Notch signaling. Mol. Cell. Biol. 21, 6080–6089 10.1128/MCB.21.17.6080-6089.2001 [DOI] [PMC free article] [PubMed] [Google Scholar]
- 10. Iso T., Kedes L., and Hamamori Y. (2003) HES and HERP families: multiple effectors of the Notch signaling pathway. J. Cell. Physiol. 194, 237–255 10.1002/jcp.10208 [DOI] [PubMed] [Google Scholar]
- 11. Kopan R., and Ilagan M. X. (2009) The canonical Notch signaling pathway: unfolding the activation mechanism. Cell 137, 216–233 10.1016/j.cell.2009.03.045 [DOI] [PMC free article] [PubMed] [Google Scholar]
- 12. Zanotti S., and Canalis E. (2010) Notch and the skeleton. Mol. Cell. Biol. 30, 886–896 10.1128/MCB.01285-09 [DOI] [PMC free article] [PubMed] [Google Scholar]
- 13. Bai S., Kopan R., Zou W., Hilton M. J., Ong C. T., Long F., Ross F. P., and Teitelbaum S. L. (2008) NOTCH1 regulates osteoclastogenesis directly in osteoclast precursors and indirectly via osteoblast lineage cells. J. Biol. Chem. 283, 6509–6518 10.1074/jbc.M707000200 [DOI] [PubMed] [Google Scholar]
- 14. Zanotti S., and Canalis E. (2017) Parathyroid hormone inhibits Notch signaling in osteoblasts and osteocytes. Bone 103, 159–167 10.1016/j.bone.2017.06.027 [DOI] [PMC free article] [PubMed] [Google Scholar]
- 15. Swiatek P. J., Lindsell C. E., del Amo F. F., Weinmaster G., and Gridley T. (1994) Notch1 is essential for postimplantation development in mice. Genes Dev. 8, 707–719 10.1101/gad.8.6.707 [DOI] [PubMed] [Google Scholar]
- 16. Weinmaster G., Roberts V. J., and Lemke G. (1992) Notch2: a second mammalian Notch gene. Development 116, 931–941 [DOI] [PubMed] [Google Scholar]
- 17. McCright B., Gao X., Shen L., Lozier J., Lan Y., Maguire M., Herzlinger D., Weinmaster G., Jiang R., and Gridley T. (2001) Defects in development of the kidney, heart and eye vasculature in mice homozygous for a hypomorphic Notch2 mutation. Development 128, 491–502 [DOI] [PubMed] [Google Scholar]
- 18. Wu J., and Bresnick E. H. (2007) Bare rudiments of notch signaling: how receptor levels are regulated. Trends Biochem. Sci. 32, 477–485 10.1016/j.tibs.2007.09.002 [DOI] [PubMed] [Google Scholar]
- 19. Yuan Z., Friedmann D. R., VanderWielen B. D., Collins K. J., and Kovall R. A. (2012) Characterization of CSL (CBF-1, Su(H), Lag-1) mutants reveals differences in signaling mediated by Notch1 and Notch2. J. Biol. Chem. 287, 34904–34916 10.1074/jbc.M112.403287 [DOI] [PMC free article] [PubMed] [Google Scholar]
- 20. Fukushima H., Nakao A., Okamoto F., Shin M., Kajiya H., Sakano S., Bigas A., Jimi E., and Okabe K. (2008) The association of Notch2 and NF-κB accelerates RANKL-induced osteoclastogenesis. Mol. Cell. Biol. 28, 6402–6412 10.1128/MCB.00299-08 [DOI] [PMC free article] [PubMed] [Google Scholar]
- 21. Canalis E., Adams D. J., Boskey A., Parker K., Kranz L., and Zanotti S. (2013) Notch signaling in osteocytes differentially regulates cancellous and cortical bone remodeling. J. Biol. Chem. 288, 25614–25625 10.1074/jbc.M113.470492 [DOI] [PMC free article] [PubMed] [Google Scholar]
- 22. Canalis E., Parker K., Feng J. Q., and Zanotti S. (2013) Osteoblast lineage-specific effects of Notch activation in the skeleton. Endocrinology 154, 623–634 10.1210/en.2012-1732 [DOI] [PMC free article] [PubMed] [Google Scholar]
- 23. Engin F., Yao Z., Yang T., Zhou G., Bertin T., Jiang M. M., Chen Y., Wang L., Zheng H., Sutton R. E., Boyce B. F., and Lee B. (2008) Dimorphic effects of Notch signaling in bone homeostasis. Nat. Med. 14, 299–305 10.1038/nm1712 [DOI] [PMC free article] [PubMed] [Google Scholar]
- 24. Hilton M. J., Tu X., Wu X., Bai S., Zhao H., Kobayashi T., Kronenberg H. M., Teitelbaum S. L., Ross F. P., Kopan R., and Long F. (2008) Notch signaling maintains bone marrow mesenchymal progenitors by suppressing osteoblast differentiation. Nat. Med. 14, 306–314 10.1038/nm1716 [DOI] [PMC free article] [PubMed] [Google Scholar]
- 25. Zanotti S., Smerdel-Ramoya A., Stadmeyer L., Durant D., Radtke F., and Canalis E. (2008) Notch inhibits osteoblast differentiation and causes osteopenia. Endocrinology 149, 3890–3899 10.1210/en.2008-0140 [DOI] [PMC free article] [PubMed] [Google Scholar]
- 26. Canalis E., Schilling L., Yee S. P., Lee S. K., and Zanotti S. (2016) Hajdu Cheney mouse mutants exhibit osteopenia, increased osteoclastogenesis and bone resorption. J. Biol. Chem. 291, 1538–1551 10.1074/jbc.M115.685453 [DOI] [PMC free article] [PubMed] [Google Scholar]
- 27. Bellavia D., Checquolo S., Campese A. F., Felli M. P., Gulino A., and Screpanti I. (2008) Notch3: from subtle structural differences to functional diversity. Oncogene 27, 5092–5098 10.1038/onc.2008.230 [DOI] [PubMed] [Google Scholar]
- 28. Lehman R. A., Stears J. C., Wesenberg R. L., and Nusbaum E. D. (1977) Familial osteosclerosis with abnormalities of the nervous system and meninges. J. Pediatr. 90, 49–54 10.1016/S0022-3476(77)80763-4 [DOI] [PubMed] [Google Scholar]
- 29. Gripp K. W., Scott C. I. Jr., Hughes H. E., Wallerstein R., Nicholson L., States L., Bason L. D., Kaplan P., Zderic S. A., Duhaime A. C., Miller F., Magnusson M. R., and Zackai E. H. (1997) Lateral meningocele syndrome: three new patients and review of the literature. Am. J. Med. Genet. 70, 229–239 [PubMed] [Google Scholar]
- 30. Avela K., Valanne L., Helenius I., and Makitie O. (2011) Hajdu-Cheney syndrome with severe dural ectasia. Am. J. Med. Genet. A 155A, 595–598 10.1002/ajmg.a.33510 [DOI] [PubMed] [Google Scholar]
- 31. Gripp K. W., Robbins K. M., Sobreira N. L., Witmer P. D., Bird L. M., Avela K., Makitie O., Alves D., Hogue J. S., Zackai E. H., Doheny K. F., Stabley D. L., and Sol-Church K. (2015) Truncating mutations in the last exon of NOTCH3 cause lateral meningocele syndrome. Am. J. Med. Genet. A 167A, 271–281 10.1002/ajmg.a.36863 [DOI] [PMC free article] [PubMed] [Google Scholar]
- 32. Wang H., Yang H., Shivalila C. S., Dawlaty M. M., Cheng A. W., Zhang F., and Jaenisch R. (2013) One-step generation of mice carrying mutations in multiple genes by CRISPR/Cas-mediated genome engineering. Cell 153, 910–918 10.1016/j.cell.2013.04.025 [DOI] [PMC free article] [PubMed] [Google Scholar]
- 33. Yang H., Wang H., and Jaenisch R. (2014) Generating genetically modified mice using CRISPR/Cas-mediated genome engineering. Nat. Protoc. 9, 1956–1968 10.1038/nprot.2014.134 [DOI] [PubMed] [Google Scholar]
- 34. Williams A., Henao-Mejia J., and Flavell R. A. (2016) Editing the mouse genome using the CRISPR-Cas9 system. Cold Spring Harb. Protoc. 2016, 10.1101/pdb.top087536 [DOI] [PMC free article] [PubMed] [Google Scholar]
- 35. Halleux C., Kramer I., Allard C., and Kneissel M. (2012) Isolation of mouse osteocytes using cell fractionation for gene expression analysis. Methods Mol. Biol. 816, 55–66 10.1007/978-1-61779-415-5_5 [DOI] [PubMed] [Google Scholar]
- 36. Nakamura T., Imai Y., Matsumoto T., Sato S., Takeuchi K., Igarashi K., Harada Y., Azuma Y., Krust A., Yamamoto Y., Nishina H., Takeda S., Takayanagi H., Metzger D., Kanno J., et al. (2007) Estrogen prevents bone loss via estrogen receptor alpha and induction of Fas ligand in osteoclasts. Cell 130, 811–823 10.1016/j.cell.2007.07.025 [DOI] [PubMed] [Google Scholar]
- 37. Novack D. V. (2007) Estrogen and bone: osteoclasts take center stage. Cell Metab. 6, 254–256 10.1016/j.cmet.2007.09.007 [DOI] [PubMed] [Google Scholar]
- 38. Manolagas S. C. (2010) From estrogen-centric to aging and oxidative stress: a revised perspective of the pathogenesis of osteoporosis. Endocr. Rev. 31, 266–300 10.1210/er.2009-0024 [DOI] [PMC free article] [PubMed] [Google Scholar]
- 39. Rogers S., Wells R., and Rechsteiner M. (1986) Amino acid sequences common to rapidly degraded proteins: the PEST hypothesis. Science 234, 364–368 10.1126/science.2876518 [DOI] [PubMed] [Google Scholar]
- 40. Rossi D., Trifonov V., Fangazio M., Bruscaggin A., Rasi S., Spina V., Monti S., Vaisitti T., Arruga F., Famà R., Ciardullo C., Greco M., Cresta S., Piranda D., Holmes A., et al. (2012) The coding genome of splenic marginal zone lymphoma: activation of NOTCH2 and other pathways regulating marginal zone development. J. Exp. Med. 209, 1537–1551 10.1084/jem.20120904 [DOI] [PMC free article] [PubMed] [Google Scholar]
- 41. Weng A. P., Ferrando A. A., Lee W., Morris J. P. 4th, Silverman L. B., Sanchez-Irizarry C., Blacklow S. C., Look A. T., and Aster J. C. (2004) Activating mutations of NOTCH1 in human T cell acute lymphoblastic leukemia. Science 306, 269–271 10.1126/science.1102160 [DOI] [PubMed] [Google Scholar]
- 42. Breit S., Stanulla M., Flohr T., Schrappe M., Ludwig W. D., Tolle G., Happich M., Muckenthaler M. U., and Kulozik A. E. (2006) Activating NOTCH1 mutations predict favorable early treatment response and long-term outcome in childhood precursor T-cell lymphoblastic leukemia. Blood 108, 1151–1157 10.1182/blood-2005-12-4956 [DOI] [PubMed] [Google Scholar]
- 43. Gripp K. W. (2011) Lateral meningocele syndrome and Hajdu-Cheney syndrome: different disorders with overlapping phenotypes. Am. J. Med. Genet. A 155A, 1773–1774 10.1002/ajmg.a.34075 [DOI] [PubMed] [Google Scholar]
- 44. Isidor B., Lindenbaum P., Pichon O., Bézieau S., Dina C., Jacquemont S., Martin-Coignard D., Thauvin-Robinet C., Le Merrer M., Mandel J. L., David A., Faivre L., Cormier-Daire V., Redon R., and Le Caignec C. (2011) Truncating mutations in the last exon of NOTCH2 cause a rare skeletal disorder with osteoporosis. Nat. Genet. 43, 306–308 10.1038/ng.778 [DOI] [PubMed] [Google Scholar]
- 45. Simpson M. A., Irving M. D., Asilmaz E., Gray M. J., Dafou D., Elmslie F. V., Mansour S., Holder S. E., Brain C. E., Burton B. K., Kim K. H., Pauli R. M., Aftimos S., Stewart H., Kim C. A., et al. (2011) Mutations in NOTCH2 cause Hajdu-Cheney syndrome, a disorder of severe and progressive bone loss. Nat. Genet. 43, 303–305 10.1038/ng.779 [DOI] [PubMed] [Google Scholar]
- 46. Aguirre J. I., Plotkin L. I., Stewart S. A., Weinstein R. S., Parfitt A. M., Manolagas S. C., and Bellido T. (2006) Osteocyte apoptosis is induced by weightlessness in mice and precedes osteoclast recruitment and bone loss. J. Bone Miner. Res. 21, 605–615 10.1359/jbmr.060107 [DOI] [PubMed] [Google Scholar]
- 47. Nakashima T., Hayashi M., Fukunaga T., Kurata K., Oh-Hora M., Feng J. Q., Bonewald L. F., Kodama T., Wutz A., Wagner E. F., Penninger J. M., and Takayanagi H. (2011) Evidence for osteocyte regulation of bone homeostasis through RANKL expression. Nat. Med. 17, 1231–1234 10.1038/nm.2452 [DOI] [PubMed] [Google Scholar]
- 48. Plotkin L. I., Gortazar A. R., Davis H. M., Condon K. W., Gabilondo H., Maycas M., Allen M. R., and Bellido T. (2015) Inhibition of osteocyte apoptosis prevents the increase in osteocytic receptor activator of nuclear factor κB ligand (RANKL) but does not stop bone resorption or the loss of bone induced by unloading. J. Biol. Chem. 290, 18934–18942 10.1074/jbc.M115.642090 [DOI] [PMC free article] [PubMed] [Google Scholar]
- 49. Xiong J., Onal M., Jilka R. L., Weinstein R. S., Manolagas S. C., and O'Brien C. A. (2011) Matrix-embedded cells control osteoclast formation. Nat. Med. 17, 1235–1241 10.1038/nm.2448 [DOI] [PMC free article] [PubMed] [Google Scholar]
- 50. Zanotti S., Yu J., Sanjay A., Schilling L., Schoenherr C., Economides A. N., and Canalis E. (2017) Sustained Notch2 signaling in osteoblasts, but not in osteoclasts, is linked to osteopenia in a mouse model of Hajdu-Cheney syndrome. J. Biol. Chem. 292, 12232–12244 10.1074/jbc.M117.786129 [DOI] [PMC free article] [PubMed] [Google Scholar]
- 51. Kim D., Bae S., Park J., Kim E., Kim S., Yu H. R., Hwang J., Kim J. I., and Kim J. S. (2015) Digenome-seq: genome-wide profiling of CRISPR-Cas9 off-target effects in human cells. Nat. Methods 12, 237–243 10.1038/nmeth.3284 [DOI] [PubMed] [Google Scholar]
- 52. Fu Y., Foden J. A., Khayter C., Maeder M. L., Reyon D., Joung J. K., and Sander J. D. (2013) High-frequency off-target mutagenesis induced by CRISPR-Cas nucleases in human cells. Nat. Biotechnol. 31, 822–826 10.1038/nbt.2623 [DOI] [PMC free article] [PubMed] [Google Scholar]
- 53. Iyer V., Shen B., Zhang W., Hodgkins A., Keane T., Huang X., and Skarnes W. C. (2015) Off-target mutations are rare in Cas9-modified mice. Nat. Methods 12, 479 10.1038/nmeth.3408 [DOI] [PubMed] [Google Scholar]
- 54. Konishi J., Kawaguchi K. S., Vo H., Haruki N., Gonzalez A., Carbone D. P., and Dang T. P. (2007) γ-Secretase inhibitor prevents Notch3 activation and reduces proliferation in human lung cancers. Cancer Res. 67, 8051–8057 10.1158/0008-5472.CAN-07-1022 [DOI] [PubMed] [Google Scholar]
- 55. Zhang Z., Wang H., Ikeda S., Fahey F., Bielenberg D., Smits P., and Hauschka P. V. (2010) Notch3 in human breast cancer cell lines regulates osteoblast-cancer cell interactions and osteolytic bone metastasis. Am. J. Pathol. 177, 1459–1469 10.2353/ajpath.2010.090476 [DOI] [PMC free article] [PubMed] [Google Scholar]
- 56. Delgado-Calle J., Anderson J., Cregor M. D., Hiasa M., Chirgwin J. M., Carlesso N., Yoneda T., Mohammad K. S., Plotkin L. I., Roodman G. D., and Bellido T. (2016) Bidirectional Notch signaling and osteocyte-derived factors in the bone marrow microenvironment promote tumor cell proliferation and bone destruction in multiple myeloma. Cancer Res. 76, 1089–1100 10.1158/0008-5472.CAN-15-1703 [DOI] [PMC free article] [PubMed] [Google Scholar]
- 57. Dou X. W., Park W., Lee S., Zhang Q. Z., Carrasco L. R., and Le A. D. (2017) Loss of Notch3 signaling enhances osteogenesis of mesenchymal stem cells from mandibular torus. J. Dent. Res. 96, 347–354 10.1177/0022034516680349 [DOI] [PMC free article] [PubMed] [Google Scholar]
- 58. Domenga V., Fardoux P., Lacombe P., Monet M., Maciazek J., Krebs L. T., Klonjkowski B., Berrou E., Mericskay M., Li Z., Tournier-Lasserve E., Gridley T., and Joutel A. (2004) Notch3 is required for arterial identity and maturation of vascular smooth muscle cells. Genes Dev. 18, 2730–2735 10.1101/gad.308904 [DOI] [PMC free article] [PubMed] [Google Scholar]
- 59. Joutel A. (2011) Pathogenesis of CADASIL: transgenic and knock-out mice to probe function and dysfunction of the mutated gene, Notch3, in the cerebrovasculature. BioEssays 33, 73–80 10.1002/bies.201000093 [DOI] [PubMed] [Google Scholar]
- 60. Joutel A., Corpechot C., Ducros A., Vahedi K., Chabriat H., Mouton P., Alamowitch S., Domenga V., Cécillion M., Marechal E., Maciazek J., Vayssiere C., Cruaud C., Cabanis E. A., Ruchoux M. M., et al. (1996) Notch3 mutations in CADASIL, a hereditary adult-onset condition causing stroke and dementia. Nature 383, 707–710 10.1038/383707a0 [DOI] [PubMed] [Google Scholar]
- 61. Joutel A., Andreux F., Gaulis S., Domenga V., Cecillon M., Battail N., Piga N., Chapon F., Godfrain C., and Tournier-Lasserve E. (2000) The ectodomain of the Notch3 receptor accumulates within the cerebrovasculature of CADASIL patients. J. Clin. Investig. 105, 597–605 10.1172/JCI8047 [DOI] [PMC free article] [PubMed] [Google Scholar]
- 62. Nagy T. R., Prince C. W., and Li J. (2001) Validation of peripheral dual-energy X-ray absorptiometry for the measurement of bone mineral in intact and excised long bones of rats. J. Bone Miner. Res. 16, 1682–1687 10.1359/jbmr.2001.16.9.1682 [DOI] [PubMed] [Google Scholar]
- 63. Bouxsein M. L., Boyd S. K., Christiansen B. A., Guldberg R. E., Jepsen K. J., and Müller R. (2010) Guidelines for assessment of bone microstructure in rodents using micro-computed tomography. J. Bone Miner. Res. 25, 1468–1486 10.1002/jbmr.141 [DOI] [PubMed] [Google Scholar]
- 64. Glatt V., Canalis E., Stadmeyer L., and Bouxsein M. L. (2007) Age-related changes in trabecular architecture differ in female and male C57BL/6J mice. J. Bone Miner. Res. 22, 1197–1207 10.1359/jbmr.070507 [DOI] [PubMed] [Google Scholar]
- 65. Dempster D. W., Compston J. E., Drezner M. K., Glorieux F. H., Kanis J. A., Malluche H., Meunier P. J., Ott S. M., Recker R. R., and Parfitt A. M. (2013) Standardized nomenclature, symbols, and units for bone histomorphometry: a 2012 update of the report of the ASBMR Histomorphometry Nomenclature Committee. J. Bone Miner. Res. 28, 2–17 10.1002/jbmr.1805 [DOI] [PMC free article] [PubMed] [Google Scholar]
- 66. Parfitt A. M., Drezner M. K., Glorieux F. H., Kanis J. A., Malluche H., Meunier P. J., Ott S. M., and Recker R. R. (1987) Bone histomorphometry: standardization of nomenclature, symbols, and units. Report of the ASBMR Histomorphometry Nomenclature Committee. J. Bone Miner. Res. 2, 595–610 [DOI] [PubMed] [Google Scholar]
- 67. Yesil P., Michel M., Chwalek K., Pedack S., Jany C., Ludwig B., Bornstein S. R., and Lammert E. (2009) A new collagenase blend increases the number of islets isolated from mouse pancreas. Islets 1, 185–190 10.4161/isl.1.3.9556 [DOI] [PubMed] [Google Scholar]
- 68. Canalis E., Zanotti S., and Smerdel-Ramoya A. (2014) Connective tissue growth factor is a target of Notch signaling in cells of the osteoblastic lineage. Bone 64, 273–280 10.1016/j.bone.2014.04.028 [DOI] [PMC free article] [PubMed] [Google Scholar]
- 69. Mosmann T. (1983) Rapid colorimetric assay for cellular growth and survival: application to proliferation and cytotoxicity assays. J. Immunol. Methods 65, 55–63 10.1016/0022-1759(83)90303-4 [DOI] [PubMed] [Google Scholar]
- 70. Canalis E., Sanjay A., Yu J., and Zanotti S. (2017) An antibody to Notch2 reverses the osteopenic phenotype of Hajdu-Cheney mutant male mice. Endocrinology 158, 730–742 10.1210/en.2016-1787 [DOI] [PMC free article] [PubMed] [Google Scholar]
- 71. Lee S. H., Rho J., Jeong D., Sul J. Y., Kim T., Kim N., Kang J. S., Miyamoto T., Suda T., Lee S. K., Pignolo R. J., Koczon-Jaremko B., Lorenzo J., and Choi Y. (2006) v-ATPase V0 subunit d2-deficient mice exhibit impaired osteoclast fusion and increased bone formation. Nat. Med. 12, 1403–1409 10.1038/nm1514 [DOI] [PubMed] [Google Scholar]
- 72. Wang Y., Lebowitz D., Sun C., Thang H., Grynpas M. D., and Glogauer M. (2008) Identifying the relative contributions of Rac1 and Rac2 to osteoclastogenesis. J. Bone Miner. Res. 23, 260–270 [DOI] [PubMed] [Google Scholar]
- 73. Nazarenko I., Lowe B., Darfler M., Ikonomi P., Schuster D., and Rashtchian A. (2002) Multiplex quantitative PCR using self-quenched primers labeled with a single fluorophore. Nucleic Acids Res. 30, e37 10.1093/nar/30.9.e37 [DOI] [PMC free article] [PubMed] [Google Scholar]
- 74. Nazarenko I., Pires R., Lowe B., Obaidy M., and Rashtchian A. (2002) Effect of primary and secondary structure of oligodeoxyribonucleotides on the fluorescent properties of conjugated dyes. Nucleic Acids Res. 30, 2089–2195 10.1093/nar/30.9.2089 [DOI] [PMC free article] [PubMed] [Google Scholar]
- 75. Lian J., Stewart C., Puchacz E., Mackowiak S., Shalhoub V., Collart D., Zambetti G., and Stein G. (1989) Structure of the rat osteocalcin gene and regulation of vitamin D-dependent expression. Proc. Natl. Acad. Sci. U.S.A. 86, 1143–1147 10.1073/pnas.86.4.1143 [DOI] [PMC free article] [PubMed] [Google Scholar]
- 76. Iso T., Sartorelli V., Chung G., Shichinohe T., Kedes L., and Hamamori Y. (2001) HERP, a new primary target of Notch regulated by ligand binding. Mol. Cell. Biol. 21, 6071–6079 10.1128/MCB.21.17.6071-6079.2001 [DOI] [PMC free article] [PubMed] [Google Scholar]
- 77. Nakagawa O., Nakagawa M., Richardson J. A., Olson E. N., and Srivastava D. (1999) HRT1, HRT2, and HRT3: a new subclass of bHLH transcription factors marking specific cardiac, somitic, and pharyngeal arch segments. Dev. Biol. 216, 72–84 10.1006/dbio.1999.9454 [DOI] [PubMed] [Google Scholar]
- 78. Gibson D. G., Young L., Chuang R. Y., Venter J. C., Hutchison C. A. 3rd, and Smith H. O. (2009) Enzymatic assembly of DNA molecules up to several hundred kilobases. Nat. Methods 6, 343–345 10.1038/nmeth.1318 [DOI] [PubMed] [Google Scholar]
- 79. Kouadjo K. E., Nishida Y., Cadrin-Girard J. F., Yoshioka M., and St-Amand J. (2007) Housekeeping and tissue-specific genes in mouse tissues. BMC Genomics 8, 127 10.1186/1471-2164-8-127 [DOI] [PMC free article] [PubMed] [Google Scholar]
- 80. Sander J. D., Zaback P., Joung J. K., Voytas D. F., and Dobbs D. (2007) Zinc Finger Targeter (ZiFiT): an engineered zinc finger/target site design tool. Nucleic Acids Res. 35, W599–W605 10.1093/nar/gkm349 [DOI] [PMC free article] [PubMed] [Google Scholar]
- 81. Sander J. D., Maeder M. L., Reyon D., Voytas D. F., Joung J. K., and Dobbs D. (2010) ZiFiT (Zinc Finger Targeter): an updated zinc finger engineering tool. Nucleic Acids Res. 38, W462–W468 10.1093/nar/gkq319 [DOI] [PMC free article] [PubMed] [Google Scholar]
Associated Data
This section collects any data citations, data availability statements, or supplementary materials included in this article.