Abstract
The aim of this retrospective study is to evaluate the reliability and robustness of six glucose meters for point-of-care testing in our wards using a brand-new protocol. During a 30-days study period a total of 50 diabetes patients were subjected to venous blood sampling and glucose meter blood analysis. The results of six glucose meters were compared with our laboratory reference assay. GlucoMen Plus (Menarini) with the 82% of acceptable results was the most robust glucose meter. Even if the Passing-Bablok analysis demonstrates the presence of constant systematic errors and the Bland-Altman test highlighted a possible overestimation, the surveillance error grid analysis showed that this glucose meter can be used safely. We proved that portable glucose meters are not always reliable in routinely clinical settings.
Keywords: Passing-Bablok, Bland-Altman, self-monitoring, diabetes, glycemic control, blood glucose
Self-monitoring of blood glucose (SMBG) is recommended by American Diabetes Association (ADA), to allow diabetes patients to achieve and maintain specific glycemic goals.1 In hospitals, control of blood glucose requires appropriate near patient glucose monitoring techniques that need to be rapid, accurate and cost-effective. The reference standard remains the central laboratory method but its longtime results and remote location makes point-of-care testing (POCT) an ideal alternative. The adoption of glucose meters as point-of-care testing for monitoring blood glucose concentrations has been demonstrated.2 Use of POCT in clinical settings has advantages and disadvantages. An advantage is the rapid turnaround time of the POCT compared to a clinical laboratory test (<5 minutes vs at least 30-60 minutes). Another advantage is the volume of the sample: usually glucose meters need 0.3-1 µl of whole blood instead of 1-3 ml of serum/plasma usually needed by clinical laboratories.3 Nevertheless, POCT can lead to an increased patients cross-infection, due to operator errors such as absence of disinfection3 or bacterial contamination, in opened and unused test strips.4 The management of training for staff using POCT is not easy, especially in big health care centers where the number of people to be trained could be high. Furthermore, preanalytical and postanalytical factors can affect test results.3 Last, accuracy and precision of POCT remain a subject of debate. Nowadays, there is no international recognized gold standard for the measurement of blood glucose. An accurate glucose monitoring is necessary to improve outcomes of hospitalized patients5 and improved accuracy of blood glucose monitoring has been shown to lead to a higher quality of insulin dosing treatment.5 Therefore, it’s fundamental to have an easy and ready-to-use protocol to test the most robust instrument to be used as a POCT inside a hospital.
Materials and Methods
To design this study, completed in 2017, we used a brand-new protocol for the comparison of two analytical laboratory methods6 validated by SIBioC (Italian Society of Clinical Biochemistry and Clinical Molecular Biology).7 This protocol suggests to use Passing-Bablok regression analysis8 and Bland-Altman plot9 to correlate data and includes tools to verify the acceptability of data (MetComp ver. 1.0, Vidali e GdSSIBioC Statistica per il Laboratorio, Italy). Eventually, we used the surveillance error grid (SEG) analysis10 (not included in this new protocol) to evaluate the safety of glucose meters results.
This study was conducted among diabetes patients randomly enrolled during a 30-days period at the Diabetology Outpatient Clinic of Senigallia (Italy). Most of the studies and guidelines available in the literature suggest a minimum number of samples of 40-6011-15 and we selected a total of 50 subjects after a written informed consent and the ethical approval was obtained from the institutional review board. Glucose levels were estimated in fasting state from diabetes patients. Each patient has been subjected to a capillary blood glucose meter analysis (POCT), after puncture and compression of the index fingertip on the nondominant hand, and to a venous blood sampling. One trained nurse performed all the venous blood sampling (BD Vacutainer® ref. 368815, clot activator tube) and the glucose meter analysis. Another trained laboratory technician performed all the blood glucose analysis to minimize variability. All the venous blood samples were brought to the clinical laboratory to be analyzed within one hour after collection and glucose meter analysis.
Several studies have described the variation between venous and capillary samples. Capillary blood glucose shows levels slightly higher than venous blood. However, during fasting, the discrepancy is minimal (2-5 mg/dL) so glucose level differences are negligible.16,17
Exclusion criteria were as follows:18 patients who were taking medications that interfere with glucose determination; patients with kidney failure; samples with alterations like hemolysis; patients with abnormal hematocrit levels that can interfere with glucose meters readings (hematocrit lower than normal level can lead to overestimation of glucose values; hematocrit higher than normal level can lead to underestimation of glucose values).
Six glucose meters of the following companies were tested, as the most common instruments used in Italy: Accu-Check Aviva (Roche, M1), One Touch VerioPro (LifeScan, M2), GlucoMen Plus (Menarini, M3), BG-Star (Sanofi-Aventis, M4), G-sensor (Glucocard, M5), Contour XT (Bayer, M6). Our reference method, employed at the hospital clinical laboratory, was the VITROS system 5600 (Ortho-Clinical Diagnostics). These six glucose meters use three different technologies.19 Accu-Check Aviva, Contour XT and One Touch VerioPro use a static enzymatic electrochemical analysis system, based on the glucose dehydrogenase reaction. GlucoMen Plus and G-sensor use a static electrochemistry, based on the glucose oxidase reaction (Static-Gox). The BG-Star uses a dynamic electrochemistry based on glucose oxidase (Dynamic-Gox).
The calibration and the use of the glucose meter strips, obtained from the hospital pharmacy, were done according to the manufacturer instructions. The intra-assay precision, also referred to as repeatability of a measurement system, were verified by a 3 × 5 (3 replicates × 5 days) protocol using samples between 30 and 400 mg/dl. In this way, the estimated repeatability will take into account any factors that could change in ordinary operations (calibrations, temperature, operators, batch reagents). To achieve blood glucose concentrations in the lower and higher categories, in vivo glucose adjustments by intravenous infusion of glucose or insulin (for subjects with type 1 diabetes) and/or laboratory manipulation was performed. The CV was calculated as sample SD/sample mean both for the VITROS 5600 (CV%, 1.3) and the glucose meters (Table 1).
Table 1.
Summary of All Tested Glucometers.
| Glucometer | SEG |
Bland-Altman |
Intra-assay (3x5) |
Passing-Bablok regression | Combined CV% |
Acceptable results |
|---|---|---|---|---|---|---|
| Slight low risk (light-green) | Mean bias (%) | CV % | √ (CV12 + CV22) | |||
| Accu-Check Aviva (Roche, M1) | 2% hypo | −5.10 ± 1.97 | 3.21 | Constant systematic error | 3.445 | 64%(n.32) |
| One Touch VerioPro (LifeScan, M2) | 2% hypo | −4.50 ± 2.78 | 3.93 | No systematic errors | 4.158 | 66%(n.33) |
| GlucoMen Plus (Menarini, M3) | 2% hypo | −2.47 ± 2.58 | 5.29 | Constant systematic error | 5.486 | 82%(n.41) |
| BG-Star (Sanofi-Aventis, M4) | 18% hypo | −11.2 ± 2.35 | 4.75 | Proportional systematic error | 4.896 | 34%(n.17) |
| G-sensor (Glucocard, M5) | 4% hypo | −3.46 ± 2.75 | 4.02 | No systematic errors | 4.215 | 60%(n.30) |
| Contour XT (Bayer, M6) | No risk reported | −6.00 ± 1.78 | 3.71 | Constant systematic error | 3.941 | 58%(n.29) |
The VITROS 5600 system allows a quantitative analysis of the glucose concentration in serum, plasma, urine and cerebrospinal fluid. The plates Vitros-Glu20 were used for quantitative glucose analysis in blood samples (serum). Controls were done once a day with Liquid Assayed Multiqual 1,2,3 (lot 45770, Bio-rad, USA) and results were compared to an online consensus group. Calibration with Calibrator Kit 1 (lot 0137, Fisher Scientific, USA) was performed every change of reagent lot. Every venous sample was provided by a barcode and registered in the hospital management software for traceability.
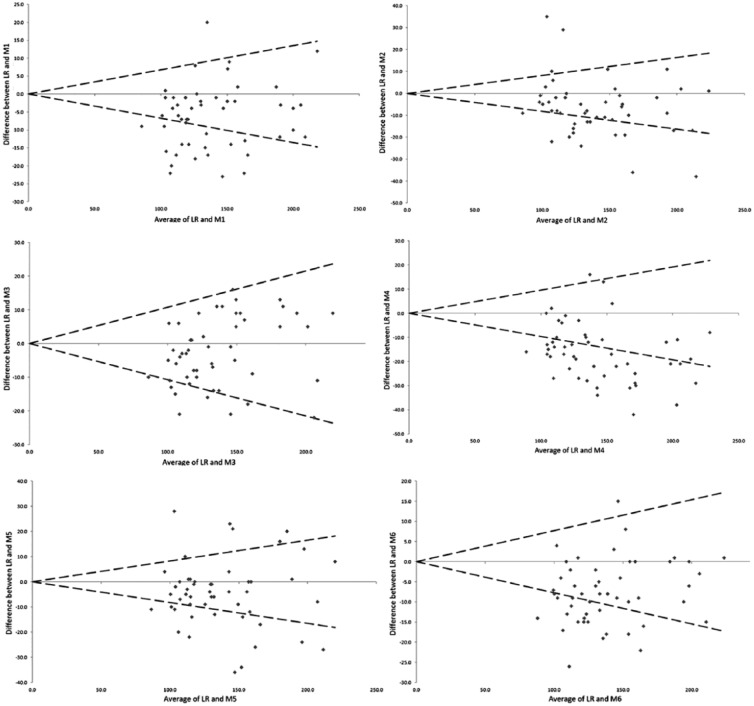
The procedure to evaluate the results acceptability is described in detail by the Vidali et al protocol.6 We calculated the acceptability limits for each glucose meter compared to the reference method (Vitros 5600) after the combination of the glucose meter CV1 and the reference method CV2 (Table 1). If the two methods are assumed not to differ significantly, then 95% of the differences between the two methods should be in the range of 0 ± 1.96 × combined CV%.
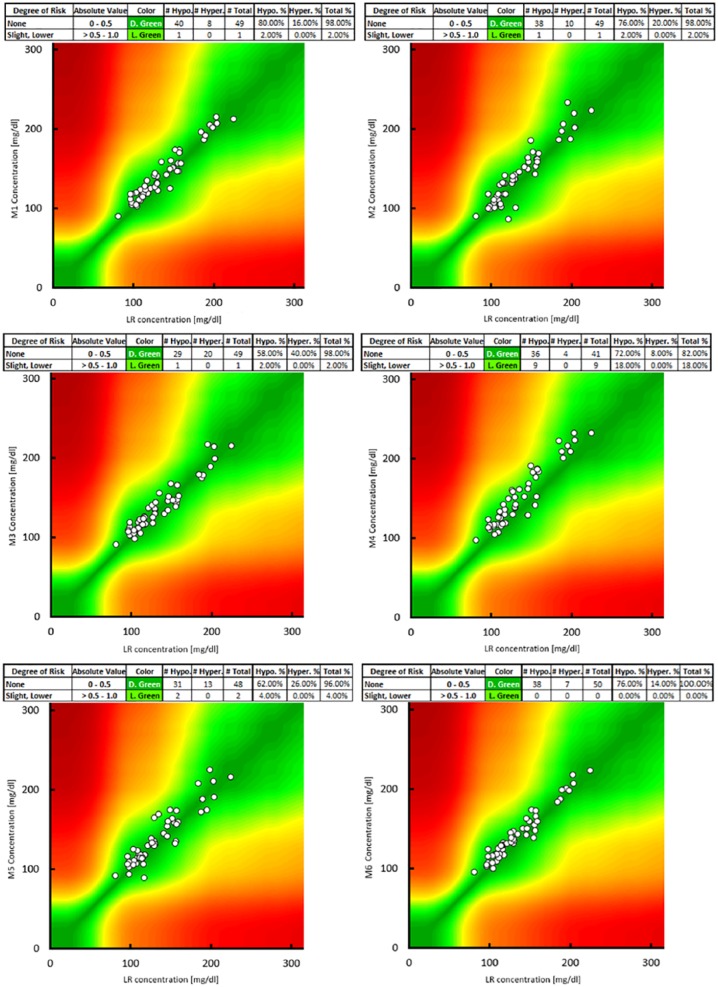
To test the safety of glucose meters in comparison to our laboratory reference, the SEG analysis was used. This tool assesses the degree of clinical risk from inaccurate blood glucose meters. The degree of risk can span from None (Dark Green color 0-0.5) to Extreme (Brown color >3.5). All SEG were plotted using the free software provided by the Diabetes Technology Society (California, USA) and downloadable at https://www.diabetestechnology.org/.
The lack of agreement between measurements was assessed by calculating the bias and displayed using the Bland-Altman plot. The Bland-Altman plot is used to compare two measures of the same nature: it is a scatter diagram in which the y-axis shows the differences between the two methods expressed as a percentage of the average (method1-method2/average*100) and the x-axis shows the reference values. The central horizontal line represents the mean of the differences and the other two lines the mean difference ± 1.96 × SD. The mean of the differences allows to estimate if a method underestimate or overestimate respect the other, while the other two dashed lines contain the 95% of the differences. Bland-Altman plots were performed for each individual glucose meter system.
Glucose meters and VITROS 5600 were compared performing the Passing-Bablok regression analysis. The results are presented in a scatter plot with a regression line (y = ax ± b). The intercept and the slope (95% CI confidence intervals were calculated) represent respectively the constant and proportional errors. Passing-Bablok regressions were performed for each individual glucose meter system.
Results
During the 30-days study period a total of 50 diabetes patients were enrolled. The gender distribution was 60% (n. 30) male and 40% (n. 20) female. The mean age was 62.6 ± 16.6 years. The youngest patient was 22 while the oldest patient was 88 years old. The samples included in the analysis had a glucose concentration that ranged from 81 to 224 mg/dL and a hematocrit range from 32.8% to 46.6%. Following the ADA’s standards, a fasting blood glucose ≥ 126 mg/dl was considered diabetes (pathological cut-off).21 The 56% of our values were ≥ 126 mg/dl and the 68% of it were in ± 20% range of the pathological cut-off.
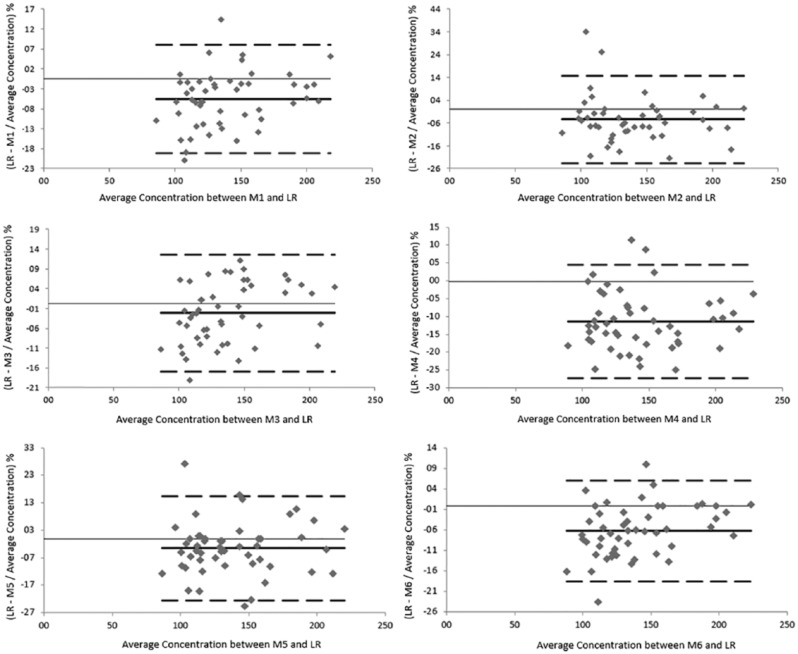
The Bland-Altman plots showed good overall agreement with our Vitros 5600 reference method. All the glucose meters had a mean bias ranging from -2.47 ± 2.58% (GlucoMen Plus, M3) to -11.2 ± 2.35% (BG-Star, M4). G-sensor (Glucocard, M5) had a bias of -3.46 ± 2.75%. The bias of Accu-Check Aviva (Roche, M1), One Touch VerioPro (LifeScan, M2) and Contour XT (Bayer, M6) was comparable with a value of -5.10 ± 1.97%, -4.50 ± 2.78%, and -6.00 ± 1.78% respectively. This means that the mean value obtained by Vitros 5600 is ~ 97.5% of the value obtained by GlucoMen Plus, ~ 96.5% of the value obtained with G-sensor, ~ 95% of the value obtained with Accu-Check Aviva and One Touch VerioPro, ~ 94% of the value obtained with Contour XT and ~ 89% of the value obtained with BG-Star (Figure 1).
Figure 1.
Bland-Altman plot. Thick line: mean; dashed line: 95% limit of agreement. Average of our central laboratory reference method (LR) and glucometer against absolute difference between LR and glucometer divided by their average concentration.
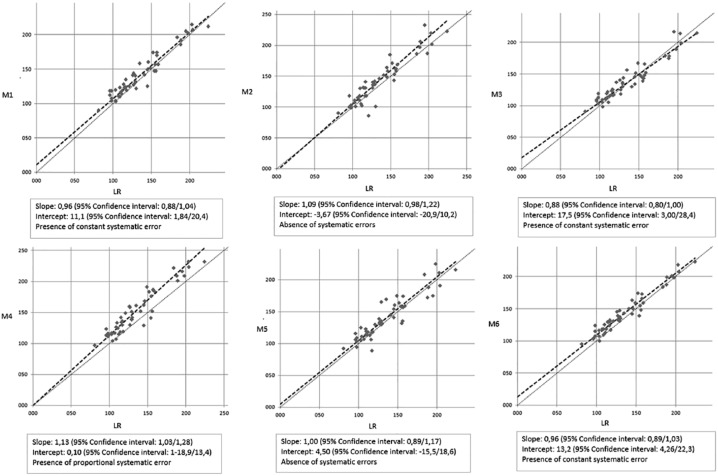
After the Passing-Bablok analysis the regression equations (y = ax ± b; the regression line slope a represents the proportional error; the regression line intercept b represents the constant error) were as follows: y = 0.96x + 12.9 (Accu-Check Aviva, M1); y = 1.09x − 3.67 (One Touch VerioPro, M2); y = 0.88x + 17.5 (GlucoMen Plus, M3); y = 1.13x + 0.1 (BG-Star, M4); y = x + 4.50 (G-sensor, M5); y = 0.96x + 13.2 (Contour XT, M6). To demonstrate the absence of constant and proportional systematic error, the 95% confidence intervals must include 0 for intercept and 1 for slope (Figure 2).
Figure 2.
Passing-Bablok regression analysis. Comparison of the six glucometers against our central laboratory reference method (LR). CUSUM test: no statistically significant variation (P > .05) for all glucometers.
According the protocol guidelines (95% of acceptable result) none of the glucose meters results were compatible with the central laboratory method results. Nevertheless, the GlucoMen Plus (Menarini, M3) produced the most similar results (82%) to the reference method. Contour XT (Bayer, M6), Accu-Check Aviva (Roche, M1), G-sensor (Glucocard, M5) and One Touch VerioPro (LifeScan, M2) had comparable performances with respectively the 58%, 64%, 60% and 66% of acceptable measures. The lower percentage of acceptable results was from BG-Star (Sanofi-Aventis, M4) with only a 34% (Figure 3).
Figure 3.
Acceptability charts. Acceptable results, within 0 ± 1.96x combined CV% (Table 1) compared to our central laboratory reference method (LR), are between dashed lines. All measures are in mg/dl.
SEG analyses showed that Contour XT (Bayer, M6) can be used without any risk with all results inside the dark green part of the grid. G-sensor (Glucocard, M5) had a 4% of risk and the other glucose meters had the 98% of results in the dark green gradient, so they had the 2% (light green) of risk to induce in patients a slight-low hypoglycemia for treatment overdose (Figure 4).
Figure 4.
Surveillance error grid analysis. Our central laboratory reference method (LR) results are on the x-axis. Glucometers are on the y-axis.
Discussion
In this study, none of the glucose meters fulfilled the acceptability requirements specified by the Vidali et al protocol6 with at least 95% of acceptable results. In general, if the test method has been found acceptable, it may replace the method currently in use. Our objective was not to replace the central laboratory reference method for diagnosis but to understand which portable glucose meter were the most robust according to our reference measurements. This protocol found that GlucoMen Plus (Menarini, M3), with 82% of accepted results, could be the glucose meter to adopt in our particular case.
We used specific blood concentrations obtained only within the pathological range, with few exceptions. Another limitation could be the use of only one test strip lot instead of three for every capillary blood sample, because the study was conducted in a limited resource setting.
Glucose meters demonstrate characteristic accuracy patterns that may generate erroneous results and discrepant values, including dangerous ones.22 In this study, SEG analyses demonstrated that all tested glucose meters had an adequate clinical action with no results that can affect patient care significantly.
On the Bland-Altman plot all the instruments yielded higher results than our reference with a general blood glucose overestimation. However, 95% of results of every glucose meter were within the acceptability region.
The Passing-Bablok analysis showed a constant systematic error in three glucose meters, Accu-Check Aviva, Contour XT and GlucoMen Plus. This kind of error results less relevant at higher concentration (>100 mg/dL) of blood glucose. G-sensor and One Touch VerioPro performed all the measurements without systematic error. The presence of proportional systematic error was detected only in the Sanofi-Aventis (BG-Star, M4) instrument, with higher errors for higher blood glucose level samples. The GlucoMen Plus regression line, even if affected by constant systematic error, for values >100 mg/dL had the smallest deviation from the x = y ideal line.
Despite the glucose meters are traditionally subjected to less stringent analytical requirements than instruments used for routine glucose testing in clinical laboratories, we shown that their analytical performances could be not always reliable in routinely clinical settings. Before introducing a new device in the hospital environment, or recommending it to the patients, the local health care facility should assess their analytical performances. At last, the Vidali et al6 protocol represents a practical and fast guide for medical personnel, useful to choose an appropriate POCT glucose meter. All sequential steps, including experimental design, familiarization with the new method, quality assessment, sample selection, definition of acceptability criteria, sample measurement, data analysis and evaluation, final decision, and reporting, are well described. We think that by following this protocol, technicians and untrained personnel who usually carry out the laboratory routine can quickly organize an effective and well-done study.
Footnotes
Abbreviations: ADA, American Diabetes Association; LR, central laboratory reference method; POCT, point-of-care testing; SEG, surveillance error grid; SMBG, self-monitoring of blood glucose.
Declaration of Conflicting Interest: The author(s) declared the following potential conflicts of interest with respect to the research, authorship, and/or publication of this article: The authors certify that they have no affiliations with or involvement in any organization or entity with any financial interest (such as honoraria; educational grants; participation in speakers’ bureaus; membership, employment, consultancies, stock ownership, or other equity interest; and expert testimony or patent-licensing arrangements), or nonfinancial interest (such as personal or professional relationships, affiliations, knowledge or beliefs) in the subject matter or materials discussed in this manuscript. AM is a PhD of the University of Camerino and GE is a student of Scuola di Specializzazione in Microbiologia e Virologia. SR, GT, LP, and SB are employees of the ASUR MARCHE AV2 institute. GC is an employee of the ASUR MARCHE AV2 institute and chief of clinical pathology laboratory. MV is employee at the Immunohaematology and Transfusion Medicine Service, Holy Trinity Hospital, Borgomanero.
Funding: The author(s) received no financial support for the research, authorship, and/or publication of this article.
ORCID iD: Alessio Mancini  https://orcid.org/0000-0002-4388-3769
References
- 1. Ullal A, Parmar GM, Chauhan PH. Comparison of glucometers used in hospitals and in outpatient settings with the laboratory reference method in a tertiary care hospital in Mumbai. Indian J Endocrinol Metab. 2013;17:s688-s693. [DOI] [PMC free article] [PubMed] [Google Scholar]
- 2. Püntmann I, Wosniok W, Haeckel R. Comparison of several point-of-care testing (POCT) glucometers with an established laboratory procedure for the diagnosis of type 2 diabetes using the discordance rate. A new statistical approach. Clin Chem Lab Med. 2003;41:809-820. [DOI] [PubMed] [Google Scholar]
- 3. Rajendran R, Rayman G. Point-of-care blood glucose testing for diabetes care in hospitalized patients: an evidence-based review. J Diabetes Sci Technol. 2014;8:1081-1090. [DOI] [PMC free article] [PubMed] [Google Scholar]
- 4. Perez-Ayala M, Oliver P, Rodriguez Cantalejo F. Prevalence of bacterial contamination of glucose test strips in individual single-use packets versus multiple-use vials. J Diabetes Sci Technol. 2013;7:854-862. [DOI] [PMC free article] [PubMed] [Google Scholar]
- 5. Montagnana M, Caputo M, Giavarina D, Lippi G. Overview on self-monitoring of blood glucose. Clin Chim Acta. 2009;402:7-13. [DOI] [PubMed] [Google Scholar]
- 6. Vidali M, Tronchin M, Dittadi R. Protocollo per la comparazione di due metodi analitici di laboratorio. Biochim Clin. 2015;40:129. [Google Scholar]
- 7. SIBioC. The Italian society of clinical biochemistry and clinical molecular biology. Available at: https://www.sibioc.it.
- 8. Passing H, Bablok W. A new biometrical procedure for testing the equality of measurements from two different analytical methods. Application of linear regression procedures for method comparison studies in clinical chemistry, part 1. J Clin Chem Clin Biochem. 1983;21:709-720. [DOI] [PubMed] [Google Scholar]
- 9. Bland JM, Altman DG. Statistical methods for assessing agreement between two methods of clinical measurement. Lancet. 1986;1:307-310. [PubMed] [Google Scholar]
- 10. Klonoff DC, Lias C, Vigersky R, et al. The surveillance error grid. J Diabetes Sci Technol. 2014;8:658-672. [DOI] [PMC free article] [PubMed] [Google Scholar]
- 11. Budd J, Durham A, Gwise T, et al. Measurement Procedure Comparison and Bias Estimation Using Patient Samples; Approved Guideline. 3rd ed. EP05-A3. CLSI Doc EP09-A3. Wayne, PA: Clinical and Laboratory Standards Insitute, 2013; 2014:1-40. [Google Scholar]
- 12. Chesher D. Evaluating assay precision. Clin Biochem Rev. 2008;29(suppl 1):s23-s26. [PMC free article] [PubMed] [Google Scholar]
- 13. Carey R, Anderson F, George H, et al. User Verification of Performance for Precision and Trueness; Approved Guideline. 2nd ed. CLSI document EP15-A2. CLSI Doc EP15-A2. Wayne, PA: Clinical and Laboratory Standards Insitute; 2013. 2006:1-64. [Google Scholar]
- 14. Clinical and Laboratory Standards Institute. EP15-A3: User Verification of Precision and Estimation of Bias; Approved Guideline. 3rd ed. Wayne, PA: Clinical and Laboratory Standards Institute; 2014. [Google Scholar]
- 15. Linnet K. Necessary sample size for method comparison studies based on regression analysis. Clin Chem. 1999;45:882-894. [PubMed] [Google Scholar]
- 16. Larsson-Cohn U. Differences between capillary and venous blood glucose during oral glucose tolerance tests. Scand J Clin Lab Invest. 1976;36:805-808. [DOI] [PubMed] [Google Scholar]
- 17. Somogyi M. Studies of arteriovenous differences in blood sugar; effect of hypoglycemia on the rate of extrahepatic glucose assimilation. J Biol Chem. 1948;174:597-603. [PubMed] [Google Scholar]
- 18. Ginsberg BH. Factors affecting blood glucose monitoring: sources of errors in measurement. J Diabetes Sci Technol. 2009;3:903-913. [DOI] [PMC free article] [PubMed] [Google Scholar]
- 19. Ferri S, Kojima K, Sode K. Review of glucose oxidases and glucose dehydrogenases: a bird’s eye view of glucose sensing enzymes. J Diabetes Sci Technol. 2011;5:1068-1076. [DOI] [PMC free article] [PubMed] [Google Scholar]
- 20. VITROS Chemistry Products GLU Slides. Available at: https://healthabc.nia.nih.gov/sites/default/files/GLU_MP2-8_EN_A.pdf
- 21. American Diabetes Association. Standards of medical care in diabetes—2011. Diabetes Care. 2011;34(suppl 1):s11-s61. [DOI] [PMC free article] [PubMed] [Google Scholar]
- 22. Kost GJ, Tran NK, Abad VJ, Louie RF. Evaluation of point-of-care glucose testing accuracy using locally-smoothed median absolute difference curves. Clin Chim Acta. 2008;389:31-39. [DOI] [PMC free article] [PubMed] [Google Scholar]


