

Abstract
Many newly synthesized cellular proteins pass through the Golgi complex from where secretory transport carriers sort them to the plasma membrane and the extracellular environment. The formation of these secretory carriers at the trans-Golgi network is promoted by the protein kinase D (PKD) family of serine/threonine kinases. Here, using mathematical modeling and experimental validation of the PKD activation and substrate phosphorylation kinetics, we reveal that the expression level of the PKD substrate deleted in liver cancer 1 (DLC1), a Rho GTPase–activating protein that is inhibited by PKD-mediated phosphorylation, determines PKD activity at the Golgi membranes. RNAi-mediated depletion of DLC1 reduced PKD activity in a Rho–Rho-associated protein kinase (ROCK)–dependent manner, impaired the exocytosis of the cargo protein horseradish peroxidase, and was associated with the accumulation of the small GTPase RAB6 on Golgi membranes, indicating a protein-trafficking defect. In summary, our findings reveal that DLC1 maintains basal activation of PKD at the Golgi and Golgi secretory activity, in part by down-regulating Rho–ROCK signaling. We propose that PKD senses cytoskeletal changes downstream of DLC1 to coordinate Rho signaling with Golgi secretory function.
Keywords: protein kinase D (PKD), Rho (Rho GTPase), deleted in liver cancer 1 (DLC1), secretion, kinetics, model selection, profile likelihood, trans-Golgi network, kinetic modeling
Introduction
Protein kinase D (PKD),4 comprising PKD1, PKD2, and PKD3, is a family of serine/threonine protein kinases that localizes to trans-Golgi network (TGN) membranes where it controls protein secretion (1, 2). PKD further plays an important role in the regulation of actin cytoskeleton remodeling and cell motility (3). Membrane recruitment of PKD depends on diacylglycerol (DAG), a lipid second messenger that also activates novel PKCs, which in turn phosphorylate and activate PKD (4). At the Golgi membranes, PKD phosphorylates and regulates the lipid kinase PI4KIIIβ (5), the BAR domain protein Arfaptin-1 (6), and the lipid transfer proteins CERT and OSBP (7, 8), which together coordinate the formation and budding of secretory vesicles. Although the biochemical mechanisms underlying PKD activation and its downstream substrates have been studied extensively, little is known about the negative regulation of PKD and whether PKD activity is subject to any feedback regulation. Although it is intuitively clear that Golgi secretory activity must adapt to changes in the cellular environment, how extracellular cues and signals emanating from the plasma membrane are relayed to the Golgi complex to coordinate secretion is still elusive.
Rho proteins are ubiquitously expressed small GTPases that coordinate actin and microtubule cytoskeleton rearrangements, thereby regulating diverse cellular processes such as cell adhesion and migration, cell division, and membrane trafficking (9). When bound to GTP, Rho GTPases can associate with different effector proteins, triggering the activation of downstream signaling. The cycle between the active GTP-bound and inactive GDP-bound state is regulated by the GEF proteins that promote the exchange of GDP for GTP, whereas GAP proteins accelerate the intrinsic GTPase activity, leading to the inactivation of the Rho protein (10). The RhoA isoform is associated mainly with the plasma membrane where it controls actin stress fiber formation and actomyosin contraction. Overexpression of constitutively active RhoA or the GEF protein Lbc was shown to increase basal PKD activity (11). Later, RhoA activation induced by oxidative stress or the loss of cell–cell adhesions was reported to increase PKD activity by a mechanism involving novel PKCs and the cytoplasmic kinases ROCK and Src (12, 13). Vice versa, PKD has also been implicated in controlling RhoA activity, for example, by the direct phosphorylation and stabilization of the RhoA effector protein rhotekin (14) and by the functional inactivation of the RhoGAP DLC1 (15). Upon PKD-mediated phosphorylation, DLC1 is bound and sequestered by 14-3-3 proteins, thereby preventing it from inactivating Rho-GTP. These observations raise the question of whether a positive feedback involving Rho GTPase signaling exists, maintaining cellular PKD activity and thus Golgi secretory function.
Here, we tested this hypothesis by a data-driven modeling approach that captures PKD activation depending on DLC1-mediated Rho regulation. Intriguingly, our model anticipates a DLC1-dependent negative effect of Rho signaling on PKD activity. These predictions were confirmed in subsequent cellular experiments, which further uncovered a novel role for DLC1 in the regulation of protein secretion from TGN membranes.
Results
Reciprocal activation of PKD and RhoA
To address whether PKD activity might be subject to Rho-dependent feedback regulation, we first examined whether the expression of active RhoA leads to PKD activation and concomitant inhibitory phosphorylation of the RhoGAP DLC1, a direct PKD substrate. Because of its GAP activity and tumor suppressor function, the overexpression of DLC1 is associated with strong morphological changes that can eventually lead to cell death. The endogenous protein, however, is expressed at very low levels that preclude quantitative analysis of DLC1 phosphorylation. We thus used as a model system the previously established Flp-In GFP-DLC1 cell line in which GFP-DLC1 expression can be induced by doxycycline addition (15). These cells were transiently transfected to express constitutively active (ca) or dominant negative (dn) RhoA and treated with doxycycline for 16 h. Compared with the GFP vector control cells, expression of RhoA-ca increased whereas RhoA-dn suppressed PKD activity as measured by an antibody that recognizes the autophosphorylated kinase (pPKD) (Fig. 1, A and B). In cells expressing RhoA-ca, this was associated with increased DLC1 phosphorylation detected by a PKD substrate antibody reactive with the phosphorylated PKD consensus motif (16) (Fig. 1, A and B). Note that HEK293 cells mainly express PKD2 and PKD3 and little PKD1. To test whether active PKD, in turn, stimulates RhoA activation, we expressed in HEK293T cells a genetically encoded RhoA FRET biosensor together with either ca or kinase-dead PKD1. In line with our hypothesis, expression of the active PKD1 significantly increased the FRET ratio of the RhoA biosensor measured in the cell lysates, whereas inactive PKD1 failed to do so (Fig. 1C). Immunoblotting of the cell lysates confirmed expression of the PKD variants (Fig. 1D). These results suggest a molecular pathway in which RhoA activates PKD, which phosphorylates and functionally inactivates DLC1, potentially resulting in an overall positive feedback (Fig. 1E).
Figure 1.

Reciprocal activation of PKD and RhoA. A, Flp-In GFP-DLC1 cells were transiently transfected with vectors encoding GFP, ca GFP-RhoA, or dn GFP-RhoA. Six hours post-transfection, GFP-DLC1 expression was induced with doxycycline. The next day, cells were lysed, and lysates were analyzed by immunoblotting. B, band intensities from three independent experiments were quantified and normalized to the loading control and control sample. Shown are the means with error bars depicting ±S.E. C, HEK293T cells were transiently cotransfected with vectors encoding ca or kinase-dead (kd) PKD1 and a RhoA FRET biosensor (27). The next day, cells were lysed, and the FRET ratio was analyzed. Shown are the mean FRET ratios from three independent experiments normalized to the control. Shown are the means with error bars depicting ±S.E. D, cell lysates from C were analyzed by immunoblotting. E, positive feedback hypothesis in which Rho activates PKD, which phosphorylates and inactivates the RhoGAP DLC1, to support further Rho activation. Data in B and C were analyzed by one-way analysis of variance followed by Dunnett's multiple comparisons test. Only statistically significant changes are indicated. **, p < 0.01.
To confirm that the activation of endogenous PKD also leads to DLC1 substrate phosphorylation, we stimulated the cells with the microtubule-depolymerizing agent nocodazole, which activates PKD at Golgi membranes (17). Nocodazole treatment of Flp-In GFP-DLC1 cells expressing GFP-DLC1 elevated the PKD phosphorylation levels, which was blocked by the selective PKD inhibitor kb NB 142-70 (kb-NB) and more efficiently by the more potent but less specific PKC/PKD inhibitor Gö-6976 (Fig. 2A). This was accompanied by increased DLC1 phosphorylation, which was also suppressed by pharmacological PKD inhibition (Fig. 2A). Significance of the effect of the inhibitors was investigated with an F-test. For this, we compared two parametrized model variants. In the null hypothesis H0, the inhibitor does not act significantly; the alternative hypothesis assumes a significant influence of the inhibitor under investigation on the pPKD and pDLC1 time courses. Results are shown in Fig. 2B. According to our test statistics, the pPKD and pDLC1 time courses are significantly below those of the control experiments for the inhibitor Gö-6976, whereas the effect is not significant for the inhibitor kb-NB (see supporting Section 1). Similar results were obtained upon stimulation of cells with the phorbol ester phorbol 12,13-dibutyrate (PDBu), an analogue of DAG. Phorbol ester treatment enhanced PKD and DLC1 phosphorylation, both of which could be blocked by kb-NB (Fig. S1).
Figure 2.

Modeling of nocodazole-induced PKD dynamics. A, Flp-In GFP-DLC1 cells were treated with doxycycline. The next day, the cells were treated with kb-NB or Gö-6976 for 2 h followed by nocodazole (Noc) treatment for the times indicated. Cells lysates were analyzed by immunoblotting. Band intensities from four independent experiments were quantified and normalized to the loading control and control sample. Shown are the means with error bars depicting ±S.E. B, significance of the effect of the inhibitors Gö-6976 and kb-NB was investigated via an F-test, according to which Gö-6976 suppresses phosphorylation time courses of PKD and DLC1 significantly with a 5% level of significance, whereas the null hypothesis H0 cannot be rejected, and hence the effect of kb-NB is not significant. C, asterisks indicate renormalized experimental data from A with normalization points denoted by diamonds together with trajectories of the calibrated model that all lie on top of each other. D, model validation via a bootstrapping approach in which the inferred stochastic model was used to resample new experimental data to estimate the probability density function (pdf) of the maximum-likelihood objective function value.
Computational modeling suggests negative feedback regulation of PKD activity
Based on the hypothesized model structure (Fig. 1E) and the measured outputs in the time series experiments, we formulated a model with two state variables that represent phosphorylated PKD and DLC1, respectively. We used mass action kinetics for phosphorylation and dephosphorylation kinetics.
| (Eq. 1) |
| (Eq. 2) |
The PKD phosphorylation rate k(DLC1,θ) depends on DLC1 via Rho and on the experimental treatment of the cells and is specified in Table S3. We eliminated unphosphorylated PKD and DLC1 by assuming mass conservation of respective total amounts and normalized both state variables accordingly (supporting Sections 1 and 2). For model calibration, we exploited maximum-likelihood estimation (MLE), which requires the choice of an appropriate error model for observed outputs. Selection of an error model was done as a data-driven preprocessing step, which is computationally more efficient than a combination of error model selection and model calibration. We set up different error models by combining additive normal and multiplicative log-normal error models with biased and unbiased variance estimators. We additionally compared different variants of pooling standard deviations. Comparison was done in terms of suitable information criteria as shown in Table S2 in supporting Section 1. Based on these results, we decided to use an additive normal error model and six standard deviations for the modeling study. For each experiment, we used a point control normalization to the highest signal value to avoid normalization to low signals with a low signal-to-noise ratio (18). The resulting optimization problem consisted of 16 parameters in total (see supporting Section 2).
Fig. 2C shows the calibrated courses of pPKD and pDLC1 after addition of nocodazole in the control case versus treatment with the PKD inhibitors kb-NB and Gö-6976 (compare Fig. 2A). Experimental data are indicated by asterisks. Trajectories were obtained by taking all parameters from the optimization runs into account that gave reasonable model fits. The response to nocodazole treatment is well captured, although the steady-state value prior to nocodazole addition is slightly underestimated for both variables in the control case. Both PKD inhibitors reduce the phosphorylation rate of PKD and thus slow down the dynamics of the system, which is more pronounced for Gö-6976 than for kb-NB, as suggested by the data. Respective model fits to measurements of the system response after treatment with PDBu (Fig. S1) and overexpression of Rho (Fig. 1, A and B) show that the model also captures these experiments (Fig. S5). Our approach further provided estimates for standard deviations of measured outputs, which are in good agreement with the respective empirical values which are directly derived from the data as shown in (Fig. S4).
Plausibility of the model was tested by a parametric bootstrapping approach in which we used the inferred stochastic model to generate many data sets with the same size and structure as the experimental data used for model calibration. Then we calculated the likelihood of these data sets by using simulations with the maximum-likelihood estimator θMLE and used these values to estimate a probability density p(Jopt) via kernel density estimation. This was compared with the likelihood value of the real experimental data (Fig. 2D and supporting Section 2). The objective function value of the MLE falls into the center of this distribution, indicating that we are neither in a poor fitting regime nor did we encounter an overfitting problem. Overall, the model is able to describe all experiments, and model granularity constitutes a good tradeoff between complexity and flexibility to adapt to different experimental conditions.
We also analyzed values and correlations of inferred parameters (Fig. S3). Strikingly, the optimizer consistently assigned very small values to the parameter θ6, a measure for the influence of DLC1 on PKD. Given this, PKD dynamics do not seem to be affected by DLC1 in the inferred model. Such a qualitative statement about the network structure, however, cannot only be based on dimensionless parameter values that have been rescaled in the normalization procedure and cannot directly be compared with another. Thus, we used the model to quantify the influence of DLC1 directly on pPKD by simulating the expected -fold change in pPKD in response to altered DLC1 total amounts, which is reflected by the scaling parameter s1 in Fig. 3. Fig. 3A shows that pPKD is only minimally affected, even when DLC1 amounts are very low, suggesting that DLC1 does not inhibit PKD activity.
Figure 3.

Mathematical modeling suggests a DLC1-dependent negative feedback of Rho signaling on PKD activity. A, -fold changes in pPKD upon changes in the DLC1 total (tot) amount as predicted by the model. Error bars represent S.D. B, profile likelihood for the feedback parameter θ6. C, Using model 2, pPKD clearly decreases with decreasing DLC1 amounts.
We then calculated the profile likelihood of the feedback parameter θ6 around the maximum-likelihood value (Fig. 3B). Because θ̂6 is very small, we also allowed negative θ6 values, which correspond to a sign change of the influence of DLC1 on pPKD in the network and hence imply a new network structure referred to as model 2. Surprisingly, the overall fit quality improved with negative θ6 values with an optimum at θ6* = −240. The expected -fold change in pPKD using θ6* as a new estimate is shown in Fig. 3C. Here, pPKD levels are tightly regulated by DLC1 and increase with increasing DLC1 amounts in an almost perfect linear way. Our model simulations and the profile-likelihood analysis are thus supportive of an overall negative rather than a positive feedback.
Experimental manipulation of DLC1 levels confirms Rho–ROCK-dependent negative regulation of PKD activity
To experimentally test the model prediction that PKD activity is sensitive to DLC1 expression levels, we first increased cellular DLC1 expression by doxycycline addition in Flp-In GFP-DLC1 cells and second reduced the endogenous DLC1 expression by RNAi-mediated DLC1 down-regulation followed by measurement of PKD autophosphorylation. Intriguingly, comparison of the PKD phosphorylation in doxycycline-treated Flp-In GFP-DLC1 cells with the PKD phosphorylation in untreated cells revealed an increase of 1.5-fold (Fig. 4A). Next, we down-regulated DLC1 by siRNA transfection in uninduced Flp-In GFP-DLC1 cells (Fig. 4C), resulting in the reduction of basal PKD phosphorylation (Fig. 4B, 0 min). Of note, PKD phosphorylation was still increased upon nocodazole treatment of cells (Fig. 4B, 10 and 30 min), ruling out a general inactivation mechanism. The suppression of basal PKD phosphorylation in cells depleted of DLC1 was partially rescued by pharmacological ROCK inhibition (H1152), indicating that Rho–ROCK signaling suppresses PKD in DLC1-depleted cells, whereas ROCK inhibition had no effect on the pPKD levels in the control siRNA (siNT)-transfected cells (Fig. 4D). Importantly, reduced PKD phosphorylation by DLC1 depletion was confirmed using independent siRNAs (Fig. S11A). These data strongly support model 2 wherein DLC1, by down-regulating Rho–ROCK signaling, contributes to the activation of PKD.
Figure 4.
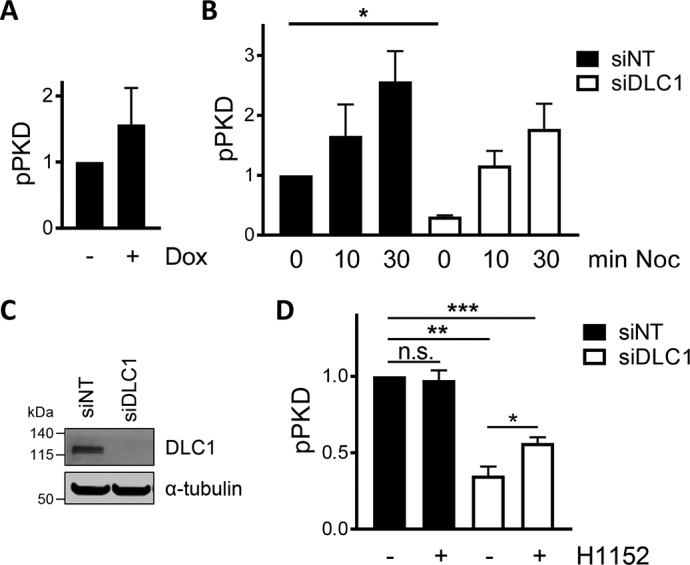
PKD activity positively correlates with DLC1 expression. A, Flp-In GFP-DLC1 cells were induced with doxycycline, and PKD activation was analyzed by immunoblotting. Band intensities from three independent experiments were quantified and normalized to the loading control and control sample. Shown are the means with error bars depicting ±S.E. B, uninduced Flp-In GFP-DLC1 cells were transfected with siNT or siDLC1. After 72 h, the cells were treated with nocodazole as indicated and lysed, and PKD activation was analyzed by immunoblotting. Band intensities from three independent experiments were quantified and normalized to the loading control and control sample. Shown are the means with error bars depicting ±S.E. *, p < 0.05 (one-sample t test). C, validation of DLC1 knockdown by immunoblotting. D, uninduced Flp-In GFP-DLC1 cells were transfected with the indicated siRNAs. After 2 days, cells were treated with H1152 where indicated. PKD activation was analyzed by immunoblotting. Band intensities from three independent experiments were quantified and normalized to the loading control and control sample. Shown are the means with error bars depicting ±S.E. *, p < 0.05 (paired two-sample t test); **, p < 0.01; n.s., not significant (one-sample t test); ***, p < 0.001.
We extended model 2 to include these new experiments. The resulting model fit is shown in Fig. 5. Details of the revised model and the estimation procedure are given in supporting Sections 3 and 4. Larger variability of trajectories results from the additional constraints in the optimization problem due to the new experiments. Comparing trajectories of models 1 and 2 for the nocodazole experiments (Fig. 2C), the negative feedback slows down the system dynamics and compensates for the differences in the effectiveness of the two inhibitors. All other experiments are also well captured (Fig. S7). Plausibility of the revised model was again confirmed by a bootstrapping approach (Fig. 5E). Taken together, the revised model is superior in fitting the experimental data, thus strengthening the hypothesis that, downstream of DLC1, Rho negatively controls PKD activity, resulting in an overall negative feedback.
Figure 5.

Negative feedback model 2 is superior in fitting all experimental data. Asterisks indicate renormalized experimental data with normalization points denoted by diamonds. Error bars represent S.D. A, nocodazole (Noc) induced PKD activation (cf. Fig. 2A). B, pPKD -fold change (cf. Fig. 4A). C, PKD activation dynamics (cf. Fig. 4B). D, pPKD -fold change (cf. Fig. 4D). E, model plausibility was tested by a bootstrapping approach.
DLC1 regulates PKD activity at Golgi membranes and protein secretion
The primary localization of PKD is at Golgi membranes, but PKD was also found to associate with the plasma membrane and mitochondria and to translocate to the nucleus. To determine whether the Golgi-localized PKD pool is sensitive to DLC1 regulation, we used a previously described PKD reporter that allows the specific determination of PKD activity at the Golgi membranes (17). Indeed, in HEK293T cells depleted of DLC1, phosphorylation of the Golgi-localized PKD reporter as measured in cell lysates was reduced by 50% (Figs. 6A and S11B). We confirmed these results by ratiometric imaging of PKD reporter phosphorylation, measuring specifically the signal intensity at the Golgi membranes (Fig. 6B). Compared with the control cells, in cells lacking DLC1, Golgi-localized PKD activity was significantly reduced.
Figure 6.

DLC1 depletion impairs protein secretion. A and B, 2 days post-siRNA transfection, HEK293T cells were transfected with the vector encoding the PKD reporter. A, the next day, cells were lysed, and lysates were analyzed by immunoblotting. The pPKDGolgi reporter signal was normalized to the GFP signal. Shown are the mean values of two independent experiments. The error bar indicates ±S.E. B, the next day, cells were fixed and stained with an antibody reactive with the phosphorylated reporter. PKD activity at the Golgi was determined by ratiometric imaging of 92 cells from two independent experiments. Scale bar, 10 μm. ****, p < 0.0001 (two-sample t test). C, Flp-In T-REx 293 FLAG-HRP cells were transfected with the indicated siRNAs. Expression of FLAG-HRP was induced with doxycycline. The next day, the medium was replaced with serum-free medium containing either kb-NB or DMSO. The supernatant was collected after 5 h for HRP measurements. Shown are the means with error bars depicting ±S.E. *, p < 0.05 (one-sample t test). D, U2OS cells were transfected with the indicated siRNAs. After 3 days, the cells were treated with nocodazole or DMSO for 10 min and lysed. The lysates were analyzed by immunoblotting with the indicated antibodies. E, U2OS cells were transfected with the indicated siRNAs. After 3 days, the cells were fixed and stained with antibodies specific for GM130 and RAB6. The images shown are maximum intensity projections of several confocal sections. Colocalization of GM130 and RAB6 (n = 11; N = 3) was analyzed with ImageJ. Scale bar, 10 μm. ****, p < 0.0001 (two-sample t test). DAPI, 4′,6-diamidino-2-phenylindole.
PKD activity at the TGN is essential for secretory vesicle formation. Considering the novel molecular link between DLC1 and PKD, we reasoned that DLC1 depletion should affect Golgi function. To quantitatively measure protein secretion, we used Flp-In T-REx 293 cells inducibly expressing FLAG-labeled horseradish peroxidase (HRP) fused to a signal peptide that directs HRP to the secretory pathway. ssHRP is a well characterized model cargo that is known to be secreted in a PKD-dependent manner (7, 19). Compared with siRNA-transfected control cells, the HRP activity measured in the supernatant of cells lacking DLC1 was significantly reduced and was similar to the HRP activity contained in the supernatants of cells treated with a PKD inhibitor (Fig. 6C).
Finally, we sought to validate our results in an independent cell line. In agreement with the observations in HEK293T cells, silencing of DLC1 in U2OS cells reduced basal and nocodazole-induced PKD phosphorylation (Fig. 6D). The post-Golgi carriers produced by PKD are known to be positive for the small GTPase RAB6 (20). Whereas RAB6 was dispersed in the control cells, in cells lacking DLC1, RAB6 accumulated at the Golgi complex (visualized by GM130 staining), indicative of a trafficking defect (Fig. 6E). Note that the Golgi complex also appeared more compact in DLC1-depleted cells. Based on these findings, we conclude that PKD activity at the TGN membranes and Golgi secretory function are positively regulated by DLC1.
Discussion
Here, we used a combination of experiments on the PKD regulation network and mathematical modeling of phosphorylation dynamics to describe the molecular interactions among PKD, Rho, and DLC1. Our study reveals a previously unknown molecular connection between DLC1 and PKD that controls the basal activation state of PKD at the TGN membranes and Golgi secretory function. TGN-derived vesicles formed by PKD deliver cargo to the plasma membrane (2). Cargo is also specifically delivered to focal adhesions (21), cell adhesion sites that connect the intracellular actin cytoskeleton via integrins with the extracellular matrix. In many cell types, including the U2OS cells used in this study, DLC1 localizes to FAs (Fig. S11C) to which it is recruited via the binding of talin and tensin adaptor proteins (22). Knockdown of DLC1 causes an increase in actin stress fibers and FAs, consistent with the elevated Rho signaling in cells lacking DLC1 (23). The down-regulation of PKD activity in the absence of DLC1 could thus be the result of a homeostatic feedback, requiring no further cargo delivery to FAs. It was recently reported that PKD also localizes to FAs (24), raising the possibility that DLC1 directly affects this particular PKD pool. However, using a Golgi-localized PKD reporter, we clearly show that it is the basal PKD activity at the TGN membranes that is sensitive to the DLC1 expression levels.
Negative feedback is generally known to stabilize systems, e.g. by making signaling pathways robust against variations in total protein concentrations, as demonstrated for extracellular signal-regulated kinase activity in the mitogen-activated protein kinase cascade (25). Here, we observed that the DLC1 expression level has a strong influence on basal PKD activity (Figs. 3 and S10). Similarly, phosphorylated DLC1 is very sensitive to changes in the amount of PKD. Surprisingly, this does not result in strong negative feedback regulation and robustness of pPKD to variations in total PKD concentrations. Very small fractions of phosphorylated PKD and DLC1 relative to the total protein amounts might provide an explanation, reminiscent of our previous finding that PKD activity is relatively insensitive to changes in CERT protein levels (cf. Ref. 26 and Fig. 5). Although alterations of the PKD protein level result in considerable -fold changes in DLC1 phosphorylation, the abundance of unphosphorylated DLC1, which regulates PKD activity as part of the feedback, appears to buffer the system. If this is the case, we anticipate that regulation via the feedback is hardly visible in the dynamics of PKD activity upon nocodazole stimulation because the -fold change of unphosphorylated DLC1 is not much affected in this scenario. Consequently, when comparing the time courses of pPKD in control and DLC1 siRNA (siDLC1) experiments after stimulation with nocodazole, we expect that pPKD increases in both scenarios and that PKD activity in the siDLC1 experiment remains constantly below that of the control experiment, which is in agreement with Fig. 4. Although Rho can activate PKD in response to stress signals (12, 13), these Rho pools must be spatially distinct from the one regulated by DLC1, which inactivates PKD. We have not observed any colocalization of DLC1 with Golgi markers, but we cannot rule out that DLC1 directly regulates PKD at the TGN as both RhoA and ROCK have been found at Golgi membranes (27, 28), and actin remodeling has been associated with cargo sorting at the TGN (29, 30). Regardless of where DLC1 exerts its function, PKD at the Golgi membranes appears to sense the cellular F-actin state whereby secretion is coordinated. A challenge for the future is the identification of the downstream signaling molecules that link Rho–ROCK with Golgi-localized PKD. 14-3-3 protein and chaperone p32 binding were previously reported to decrease PKD activity (31, 32), but the physiological conditions that engage these regulatory mechanisms are unknown. 14-3-3 binding is mediated by phosphorylation of serines 205/208 (RRLSNVSLT) and serines 219/223 (IRTSSAELST) within the C1 domain of activated PKD by a yet unknown upstream kinase. Intriguingly, serines 205 and 219 match the consensus sequence for ROCKs (33), raising the possibility that ROCK directly phosphorylates and negatively regulates PKD. In DLC1 knockdown cells, pharmacological ROCK inhibition only partially rescued the PKD phosphorylation; thus, other Rho effectors or Rho-independent mechanisms could also be involved in the regulation of PKD and secretory trafficking. For example, p122RhoGAP, the rat homolog of DLC1, was initially identified as a phospholipase C δ1–binding protein that activates its phosphatidylinositol 4,5-bisphosphate–hydrolyzing activity (34). Thus, DAG produced by phosphatidylinositol 4,5-bisphosphate hydrolysis may contribute to PKD activation, although a later study failed to demonstrate stimulation of phospholipase C δ1 enzyme activity by human DLC1 (35). DLC1 further comprises a START domain, which is found in a number of lipid transfer proteins (36). The lipid ligand for the DLC1 START domain still remains to be identified. START domain–mediated lipid transfer could be involved in the modification of the local membrane lipid composition, or it could provide specific lipid-metabolizing enzymes with their substrate, thereby contributing to PKD recruitment and/or activation at the TGN membranes.
In different types of human cancers, the expression of DLC1 is frequently down-regulated due to gene deletion or promoter hypermethylation (37). Work in cancer cell lines and mouse models of cancer has revealed a tumor and metastasis suppressor function for DLC1. In cells lacking DLC1, the aberrant Rho signaling and actin remodeling could lead to the missorting of cargo at the level of the Golgi, altering the cellular secretome and the communication of the cancer cells with the microenvironment. Considering that the different PKD isoforms have been associated with both oncogenic and tumor-suppressive functions depending on the tumor context (38), it is tempting to speculate that DLC1 loss could support neoplastic transformation in part by dampening PKD activity. Alternatively, elevated PKD activity could lead to the functional inactivation of DLC1 by phosphorylation and sequestration through 14-3-3 protein binding. In future studies, it will be of particular interest to clarify the reciprocal regulation of DLC1 and PKD in cancer cells of different tissue origin.
Experimental procedures
Antibodies
Primary antibodies used were: mouse mAb anti-DLC1 (#612020) and mouse mAb anti-GM130(#610823, both BD Biosciences); rabbit pAb anti-PKCμ (D20) to detect PKD1 + 2, rabbit pAb anti-GFP (FL) (sc-8334), and rabbit pAb anti-paxillin (H-114; all Santa Cruz Biotechnology, Dallas, TX); rabbit pAb anti-phospho-(Ser/Thr) PKD substrate antibody (4381) to detect pDLC1, rabbit mAb anti-PKD2 (D1A7), rabbit mAb anti-PKD3 (D57E6), and rabbit pAb anti-RAB6 (D37C7; all Cell Signaling Technology, Danvers, MA); and mouse antibody anti-GFP (11814460001, Roche Applied Science). The polyclonal rabbit antibodies against PI4KIIIβ pSer-294 and autophosphorylated PKD (pSer-910 in human PKD1) were described previously (5, 39). For immunoblotting, the following secondary antibodies were used: donkey anti-rabbit IgG and goat anti-mouse IgG coupled to IRDye 680RD or IRDye 800LW (all LI-COR Biosciences, Lincoln, NE) and HRP-conjugated sheep anti-mouse IgG and anti-rabbit IgG (both GE Healthcare). Secondary antibodies used for immunofluorescence were goat anti-mouse IgG and anti-rabbit IgG coupled to Alexa Fluor 488 or Alexa Fluor 546 (both Thermo Fisher Scientific, Waltham, MA), respectively.
Plasmids and siRNAs
Vectors encoding ca (Q63L) and dn (T19N) RhoA were generated from a WT RhoA construct (kindly provided by John Collard from The Netherlands Cancer Institute, Amsterdam, The Netherlands) by a PCR approach using the QuikChange site-directed mutagenesis system (Stratagene California, La Jolla, CA) according to the manufacturer's instructions. Expression vectors encoding kinase-dead (K612W) and ca (S738E/S742E) PKD1 (PKCμ) were described previously (31). pTriEx-RhoA FLARE.sc Biosensor WT was a gift from Klaus Hahn (Addgene plasmid 12150). The Golgi PKD activity reporter was described previously (17). ON-TARGETplus® nontargeting control SMARTpool siRNA (D-001810-10, Dharmacon, Lafayette, CO) was used as a negative control (siNT). siMAX siDLC1 was custom synthesized by MWG Biotech, Ebersberg, Germany (5′-UUAAGAACCUGGAGGACUATT-3′). Custom designed Silencer® Select human DLC1 siRNAs (siDLC1 number 2, s530697; siDLC1 number 3, s530699) were from Thermo Fisher.
Cell culture
HEK293T cells and Flp-In T-REx 293 FLAG-HRP cells were cultured in RPMI 1640 medium (Thermo Fisher) supplemented with 10% fetal calf serum at 37 °C in a humidified atmosphere of 5% CO2. Flp-In T-REx 293 GFP-DLC1 cells and U2OS cells were grown in Dulbecco's modified Eagle's medium (Thermo Fisher) supplemented with 10% fetal calf serum. TurboFect (Thermo Fisher) was used for plasmid transfections, and Lipofectamine RNAiMAX (Thermo Fisher) was used for siRNA transfections. The following reagents were used: doxycycline (10 ng/ml), Gö-6976 (5 μm), H1152 (10 μm), and nocodazole (10 μm; all from Merck) and kB NB 172-40 (5 μm) and PDBu (100 nm; Tocris Bioscience, Bristol, UK).
Western blotting
Cells were lysed in NEB extraction buffer (50 mm Tris (pH 7.5), 150 mm NaCl, 1% Nonidet P-40, 1 mm sodium orthovanadate, 10 mm sodium fluoride, 20 mm β-glycerophosphate, Complete protease inhibitors (Roche Applied Science)), and lysates were clarified by centrifugation at 16,000 × g for 10 min. Equal amounts of protein were loaded onto NuPAGE® 4–12% Bis-Tris precast gels (Thermo Fisher) and then blotted onto polyvinylidene difluoride membrane using an iBlot device (Thermo Fisher). Membranes were blocked in 0.5% blocking reagent (Roche Applied Science) in PBS containing 0.1% Tween 20 for 1 h at room temperature and incubated with primary antibodies followed by HRP-conjugated or IRDye-conjugated secondary antibodies, and visualization was carried out using the enhanced chemiluminescence detection system (Thermo Fisher) or an Odyssey device (LI-COR Biosciences), respectively. Quantification of signals was carried out with Odyssey imaging software.
Rho biosensor measurements
Cells were transiently transfected with a plasmid encoding the RhoA FLARE.sc biosensor along with PKD1 expression vectors. 24 h after transfection, cells were lysed in FRET buffer (50 mm Tris (pH 7.5), 5 mm β-glycerophosphate, 5 mm sodium fluoride, 0.5% Triton X-100), and the FRET ratio was measured in a multiwell plate reader (Tecan, Männedorf, Switzerland). CFP was excited at 433 nm, and CFP emission was detected at 475 nm. The FRET signal was measured by exciting CFP and detecting citrine emission at 527 nm. The FRET ratio was calculated by dividing the FRET signal by the CFP signal.
Ratiometric imaging to determine Golgi PKD activity
Ratiometric imaging of the Golgi PKD activity reporter was carried out as described previously (17). Briefly, HEK293T cells were seeded on collagen-coated glass coverslips and transfected with siRNAs. After 2 days, cells were transfected with the vector encoding the Golgi PKD activity reporter. The next day, cells were fixed with 4% paraformaldehyde, permeabilized with 0.2% Triton X-100, and stained with an antibody reactive with the phosphorylated reporter and Alexa Fluor 546–labeled secondary antibody. Samples were mounted with Fluoromount G (Southern Biotech, Birmingham, AL) and analyzed with a confocal laser-scanning microscope (LSM710, Zeiss, Jena, Germany). EGFP was excited with the 488-nm line of the argon laser, and emission was detected in the spectral window 496–553 nm. Alexa Fluor 546 was excited with the 561-nm line of a diode-pumped solid-state laser, and emission was detected from 563 to 621 nm. Laser powers were adjusted to prevent fluorophore saturation, and identical laser settings were maintained throughout the experiment. Maximum intensity projections of confocal stacks were analyzed with ZEN software (Zeiss). In reporter-expressing cells, the Golgi region of interest was defined in the EGFP channel. With the output mean intensity values, the ratio of Alexa Fluor 546 to EGFP signal was calculated.
Immunofluorescence
U2OS cells were seeded on collagen-coated glass coverslips and transfected with 10 nm siRNAs. After 3 days, cells were fixed with 4% paraformaldehyde. Staining and imaging were carried out as described above. Quantification of colocalization was carried out with the JaCoP plugin in ImageJ (40).
HRP secretion assay
Three days post-siRNA transfection, Flp-In HEK293 FLAG-HRP cells were replated into 24-well plates. 6 h after seeding, FLAG-HRP secretion was induced by doxycycline addition (10 ng/ml). The next day, the medium was replaced by phenol red– and serum-free medium containing doxycycline and the PKD inhibitor kb NB 142-70 or DMSO, respectively. The supernatant was collected after 5 h for HRP activity detection by addition of enhanced chemiluminescence reagent and measurement of the chemiluminescence signal using a multiplate reader (Tecan).
Statistical analysis
Data are shown as mean ± S.E.; n refers to the number of analyzed cells or images, and N refers to the number of independent experiments. Statistical significance was analyzed by the indicated statistical tests (GraphPad Prism version 7.03, GraphPad Software, La Jolla, CA). p values below 0.05 were considered as significant (*, p < 0.05; **, p < 0.01; ***, p < 0.001; ****, p < 0.0001).
Author contributions
A. J. and P. W. formal analysis; A. J. visualization; A. J., M. A. O., and N. E. R. methodology; A. J., Y. F., A. H., M. A. O., and N. E. R. writing-review and editing; Y. F., K. B., and S. S. data curation; A. H. investigation; M. A. O. and N. E. R. conceptualization; M. A. O. and N. E. R. resources; M. A. O. and N. E. R. supervision; M. A. O. and N. E. R. writing-original draft; M. A. O. and N. E. R. project administration; N. E. R. funding acquisition.
Supplementary Material
Acknowledgment
We thank Markus Morrison for helpful comments on the manuscript.
This work was supported in part by Grant ID OL239/8 from the Heisenberg program of the German Research Foundation (Deutsche Forschungsgemeinschaft (DFG)) (to M. A. O.). This work was also supported by the DFG within the Cluster of Excellence in Simulation Technology (Grant EXC 310/2) at the University of Stuttgart (to A. J., N. R., and M. A. O.). The authors declare that they have no conflicts of interest with the contents of this article.
This article contains supporting Sections 1–5 including Tables S1–S8 and Figs. S1–S11.
- PKD
- protein kinase D
- PKC
- protein kinase C
- DLC1
- deleted in liver cancer 1
- TGN
- trans-Golgi network
- DAG
- diacylglycerol
- pPKD
- autophosphorylated kinase
- ca
- constitutively active
- dn
- dominant negative
- kb-NB
- kb NB 142-70
- PDBu
- phorbol 12,13-dibutyrate
- MLE
- maximum-likelihood estimation
- siNT
- control siRNA
- HRP
- horseradish peroxidase
- siDLC1
- DLC1 siRNA
- ROCK
- Rho-associated protein kinase
- PI4K
- phosphatidylinositol 4-kinase
- CERT
- ceramide transport protein
- OSBP
- oxysterol-binding protein
- GEF
- guanine nucleotide exchange factor
- GAP
- GTPase-activating protein
- HEK
- human embryonic kidney
- ssHRP
- soluble secreted variant of horseradish peroxidase
- FA
- focal adhesion
- START
- StAR-related lipid transfer
- pAb
- polyclonal antibody
- Bis-Tris
- 2-[bis(2-hydroxyethyl)amino]-2-(hydroxymethyl)propane-1,3-diol
- CFP
- cyan fluorescent protein
- EGFP
- enhanced green fluorescent protein.
References
- 1. Fu Y., and Rubin C. S. (2011) Protein kinase D: coupling extracellular stimuli to the regulation of cell physiology. EMBO Rep. 12, 785–796 10.1038/embor.2011.139 [DOI] [PMC free article] [PubMed] [Google Scholar]
- 2. Malhotra V., and Campelo F. (2011) PKD regulates membrane fission to generate TGN to cell surface transport carriers. Cold Spring Harb. Perspect. Biol. 3, a005280 10.1101/cshperspect.a005280 [DOI] [PMC free article] [PubMed] [Google Scholar]
- 3. Olayioye M. A., Barisic S., and Hausser A. (2013) Multi-level control of actin dynamics by protein kinase D. Cell. Signal. 25, 1739–1747 10.1016/j.cellsig.2013.04.010 [DOI] [PubMed] [Google Scholar]
- 4. Baron C. L., and Malhotra V. (2002) Role of diacylglycerol in PKD recruitment to the TGN and protein transport to the plasma membrane. Science 295, 325–328 10.1126/science.1066759 [DOI] [PubMed] [Google Scholar]
- 5. Hausser A., Storz P., Märtens S., Link G., Toker A., and Pfizenmaier K. (2005) Protein kinase D regulates vesicular transport by phosphorylation and activation of phosphatidylinositol-4 kinase III β at the Golgi complex. Nat. Cell Biol. 7, 880–886 10.1038/ncb1289 [DOI] [PMC free article] [PubMed] [Google Scholar]
- 6. Gehart H., Goginashvili A., Beck R., Morvan J., Erbs E., Formentini I., De Matteis M. A., Schwab Y., Wieland F. T., and Ricci R. (2012) The BAR domain protein Arfaptin-1 controls secretory granule biogenesis at the trans-Golgi network. Dev. Cell 23, 756–768 10.1016/j.devcel.2012.07.019 [DOI] [PubMed] [Google Scholar]
- 7. Fugmann T., Hausser A., Schöffler P., Schmid S., Pfizenmaier K., and Olayioye M. A. (2007) Regulation of secretory transport by protein kinase D–mediated phosphorylation of the ceramide transfer protein. J. Cell Biol. 178, 15–22 10.1083/jcb.200612017 [DOI] [PMC free article] [PubMed] [Google Scholar]
- 8. Nhek S., Ngo M., Yang X., Ng M. M., Field S. J., Asara J. M., Ridgway N. D., and Toker A. (2010) Regulation of oxysterol-binding protein Golgi localization through protein kinase D–mediated phosphorylation. Mol. Biol. Cell 21, 2327–2337 10.1091/mbc.e10-02-0090 [DOI] [PMC free article] [PubMed] [Google Scholar]
- 9. Jaffe A. B., and Hall A. (2005) Rho GTPases: biochemistry and biology. Annu. Rev. Cell Dev. Biol. 21, 247–269 10.1146/annurev.cellbio.21.020604.150721 [DOI] [PubMed] [Google Scholar]
- 10. Bos J. L., Rehmann H., and Wittinghofer A. (2007) GEFs and GAPs: critical elements in the control of small G proteins. Cell 129, 865–877 10.1016/j.cell.2007.05.018 [DOI] [PubMed] [Google Scholar]
- 11. Yuan J., Slice L. W., and Rozengurt E. (2001) Activation of protein kinase D by signaling through Rho and the α subunit of the heterotrimeric G protein G13. J. Biol. Chem. 276, 38619–38627 10.1074/jbc.M105530200 [DOI] [PubMed] [Google Scholar]
- 12. Cowell C. F., Yan I. K., Eiseler T., Leightner A. C., Döppler H., and Storz P. (2009) Loss of cell–cell contacts induces NF-κB via RhoA-mediated activation of protein kinase D1. J. Cell. Biochem. 106, 714–728 10.1002/jcb.22067 [DOI] [PMC free article] [PubMed] [Google Scholar]
- 13. Song J., Li J., Lulla A., Evers B. M., and Chung D. H. (2006) Protein kinase D protects against oxidative stress-induced intestinal epithelial cell injury via Rho/ROK/PKC-δ pathway activation. Am. J. Physiol. Cell Physiol. 290, C1469–C1476 10.1152/ajpcell.00486.2005 [DOI] [PMC free article] [PubMed] [Google Scholar]
- 14. Pusapati G. V., Eiseler T., Rykx A., Vandoninck S., Derua R., Waelkens E., Van Lint J., von Wichert G., and Seufferlein T. (2012) Protein kinase D regulates RhoA activity via rhotekin phosphorylation. J. Biol. Chem. 287, 9473–9483 10.1074/jbc.M112.339564 [DOI] [PMC free article] [PubMed] [Google Scholar]
- 15. Scholz R.-P., Regner J., Theil A., Erlmann P., Holeiter G., Jähne R., Schmid S., Hausser A., and Olayioye M. A. (2009) DLC1 interacts with 14-3-3 proteins to inhibit RhoGAP activity and block nucleocytoplasmic shuttling. J. Cell Sci. 122, 92–102 10.1242/jcs.036251 [DOI] [PubMed] [Google Scholar]
- 16. Döppler H., Storz P., Li J., Comb M. J., and Toker A. (2005) A phosphorylation state-specific antibody recognizes Hsp27, a novel substrate of protein kinase D. J. Biol. Chem. 280, 15013–15019 10.1074/jbc.C400575200 [DOI] [PubMed] [Google Scholar]
- 17. Fuchs Y. F., Eisler S. A., Link G., Schlicker O., Bunt G., Pfizenmaier K., and Hausser A. (2009) A Golgi PKD activity reporter reveals a crucial role of PKD in nocodazole-induced Golgi dispersal. Traffic 10, 858–867, 10.1111/j.1600-0854.2009.00918.x 10.1111/j.1600-0854.2009.00918.x [DOI] [PubMed] [Google Scholar]
- 18. Degasperi A., Birtwistle M. R., Volinsky N., Rauch J., Kolch W., and Kholodenko B. N. (2014) Evaluating strategies to normalize biological replicates of Western blot data. PLoS One 9, e87293 10.1371/journal.pone.0087293 [DOI] [PMC free article] [PubMed] [Google Scholar]
- 19. Bard F., Casano L., Mallabiabarrena A., Wallace E., Saito K., Kitayama H., Guizzunti G., Hu Y., Wendler F., Dasgupta R., Perrimon N., and Malhotra V. (2006) Functional genomics reveals genes involved in protein secretion and Golgi organization. Nature 439, 604–607 10.1038/nature04377 [DOI] [PubMed] [Google Scholar]
- 20. Wakana Y., van Galen J., Meissner F., Scarpa M., Polishchuk R. S., Mann M., and Malhotra V. (2012) A new class of carriers that transport selective cargo from the trans Golgi network to the cell surface. EMBO J. 31, 3976–3990 10.1038/emboj.2012.235 [DOI] [PMC free article] [PubMed] [Google Scholar]
- 21. Stehbens S. J., Paszek M., Pemble H., Ettinger A., Gierke S., and Wittmann T. (2014) CLASPs link focal adhesion-associated microtubule capture to localized exocytosis and adhesion site turnover. Nat. Cell Biol. 16, 561–573 10.1038/ncb2975 [DOI] [PMC free article] [PubMed] [Google Scholar]
- 22. Braun A. C., and Olayioye M. A. (2015) Rho regulation: DLC proteins in space and time. Cell. Signal. 27, 1643–1651 10.1016/j.cellsig.2015.04.003 [DOI] [PubMed] [Google Scholar]
- 23. Holeiter G., Heering J., Erlmann P., Schmid S., Jähne R., and Olayioye M. A. (2008) Deleted in liver cancer 1 controls cell migration through a Dia1-dependent signaling pathway. Cancer Res. 68, 8743–8751 10.1158/0008-5472.CAN-08-0984 [DOI] [PubMed] [Google Scholar]
- 24. Durand N., Bastea L. I., Long J., Döppler H., Ling K., and Storz P. (2016) Protein kinase D1 regulates focal adhesion dynamics and cell adhesion through phosphatidylinositol-4-phosphate 5-kinase type-l γ. Sci. Rep. 6, 35963 10.1038/srep35963 [DOI] [PMC free article] [PubMed] [Google Scholar]
- 25. Fritsche-Guenther R., Witzel F., Sieber A., Herr R., Schmidt N., Braun S., Brummer T., Sers C., and Blüthgen N. (2011) Strong negative feedback from Erk to Raf confers robustness to MAPK signalling. Mol. Syst. Biol. 7, 489 10.1038/msb.2011.27 [DOI] [PMC free article] [PubMed] [Google Scholar]
- 26. Weber P., Hornjik M., Olayioye M. A., Hausser A., and Radde N. E. (2015) A computational model of PKD and CERT interactions at the trans-Golgi network of mammalian cells. BMC Syst. Biol. 9, 9 10.1186/s12918-015-0147-1 [DOI] [PMC free article] [PubMed] [Google Scholar]
- 27. Pertz O., Hodgson L., Klemke R. L., and Hahn K. M. (2006) Spatiotemporal dynamics of RhoA activity in migrating cells. Nature 440, 1069–1072 10.1038/nature04665 [DOI] [PubMed] [Google Scholar]
- 28. Quassollo G., Wojnacki J., Salas D. A., Gastaldi L., Marzolo M. P., Conde C., Bisbal M., Couve A., and Cáceres A. (2015) A RhoA signaling pathway regulates dendritic Golgi outpost formation. Curr. Biol. 25, 971–982 10.1016/j.cub.2015.01.075 [DOI] [PubMed] [Google Scholar]
- 29. von Blume J., Duran J. M., Forlanelli E., Alleaume A.-M., Egorov M., Polishchuk R., Molina H., and Malhotra V. (2009) Actin remodeling by ADF/cofilin is required for cargo sorting at the trans-Golgi network. J. Cell Biol. 187, 1055–1069 10.1083/jcb.200908040 [DOI] [PMC free article] [PubMed] [Google Scholar]
- 30. Salvarezza S. B., Deborde S., Schreiner R., Campagne F., Kessels M. M., Qualmann B., Caceres A., Kreitzer G., and Rodriguez-Boulan E. (2009) LIM kinase 1 and cofilin regulate actin filament population required for dynamin-dependent apical carrier fission from the trans-Golgi network. Mol. Biol. Cell 20, 438–451 10.1091/mbc.e08-08-0891 [DOI] [PMC free article] [PubMed] [Google Scholar]
- 31. Hausser A., Storz P., Link G., Stoll H., Liu Y.-C., Altman A., Pfizenmaier K., and Johannes F.-J. (1999) Protein kinase C μ is negatively regulated by 14-3-3 signal transduction proteins. J. Biol. Chem. 274, 9258–9264 10.1074/jbc.274.14.9258 [DOI] [PubMed] [Google Scholar]
- 32. Storz P., Hausser A., Link G., Dedio J., Ghebrehiwet B., Pfizenmaier K., and Johannes F.-J. (2000) Protein kinase C μ is regulated by the multifunctional chaperon protein p32. J. Biol. Chem. 275, 24601–24607 10.1074/jbc.M002964200 [DOI] [PubMed] [Google Scholar]
- 33. Amano M., Nakayama M., and Kaibuchi K. (2010) Rho-kinase/ROCK: a key regulator of the cytoskeleton and cell polarity. Cytoskeleton 67, 545–554 10.1002/cm.20472 [DOI] [PMC free article] [PubMed] [Google Scholar]
- 34. Homma Y., and Emori Y. (1995) A dual functional signal mediator showing RhoGAP and phospholipase C-δ stimulating activities. EMBO J. 14, 286–291 [DOI] [PMC free article] [PubMed] [Google Scholar]
- 35. Healy K. D., Hodgson L., Kim T.-Y., Shutes A., Maddileti S., Juliano R. L., Hahn K. M., Harden T. K., Bang Y.-J., and Der C. J. (2008) DLC-1 suppresses non-small cell lung cancer growth and invasion by RhoGAP-dependent and independent mechanisms. Mol. Carcinog. 47, 326–337 10.1002/mc.20389 [DOI] [PMC free article] [PubMed] [Google Scholar]
- 36. Alpy F., and Tomasetto C. (2014) START ships lipids across interorganelle space. Biochimie 96, 85–95 10.1016/j.biochi.2013.09.015 [DOI] [PubMed] [Google Scholar]
- 37. Popescu N. C., and Goodison S. (2014) Deleted in liver cancer-1 (DLC1): an emerging metastasis suppressor gene. Mol. Diagn. Ther. 18, 293–302 10.1007/s40291-014-0086-3 [DOI] [PMC free article] [PubMed] [Google Scholar]
- 38. Roy A., Ye J., Deng F., and Wang Q. J. (2017) Protein kinase D signaling in cancer: a friend or foe? Biochim. Biophys. Acta 1868, 283–294 10.1016/j.bbcan.2017.05.008 [DOI] [PMC free article] [PubMed] [Google Scholar]
- 39. Hausser A., Link G., Bamberg L., Burzlaff A., Lutz S., Pfizenmaier K., and Johannes F. J. (2002) Structural requirements for localization and activation of protein kinase C μ (PKC μ) at the Golgi compartment. J. Cell Biol. 156, 65–74 10.1083/jcb.200110047 [DOI] [PMC free article] [PubMed] [Google Scholar]
- 40. Bolte S., and Cordelières F. P. (2006) A guided tour into subcellular colocalization analysis in light microscopy. J. Microsc. 224, 213–232 10.1111/j.1365-2818.2006.01706.x [DOI] [PubMed] [Google Scholar]
Associated Data
This section collects any data citations, data availability statements, or supplementary materials included in this article.