Abstract
Elastin-like peptides are hydrophobic biopolymers that exhibit a reversible coacervation transition when the temperature is raised above a critical point. Here, we use a combination of linear infrared spectroscopy, two-dimensional infrared spectroscopy, and molecular dynamics simulations to study the structural dynamics of two elastin-like peptides. Specifically, we investigate the effect of the solvent environment and temperature on the structural dynamics of a short (5-residue) elastin-like peptide and of a long (450-residue) elastin-like peptide. We identify two vibrational energy transfer processes that take place within the amide I′ band of both peptides. We observe that the rate constant of one of the exchange processes is strongly dependent on the solvent environment and argue that the coacervation transition is accompanied by a desolvation of the peptide backbone where up to 75% of the water molecules are displaced. We also study the spectral diffusion dynamics of the valine(1) residue that is present in both peptides. We find that these dynamics are relatively slow and indicative of an amide group that is shielded from the solvent. We conclude that the coacervation transition of elastin-like peptides is probably not associated with a conformational change involving this residue.
Introduction
Elastin is the protein that provides elasticity to many mammalian tissues, such as lungs,1−3 skin,4−6 and arteries.4,7,8 Inside these tissues, elastin is present as elastic fibers formed by the self-assembly of the precursor protein tropoelastin (mature elastin fibers result from the enzymatic cross-linking of tropoelastin molecules). The properties of (tropo)elastin are intimately linked to its special structure, which consists of alternating hydrophilic and hydrophobic domains.9 The hydrophilic domains are the regions where the cross-links occur while the hydrophobic domains turn out to play a crucial role in the self-assembly process. These hydrophobic regions consist of short stretches of amino-acid residues that are repeated many times and adopt a disordered conformation.9 An example of such a repetitive sequence encountered in elastin is the pentapeptide repeat (Val-Pro-Gly-Val-Gly)n. Interestingly, synthetic polypeptides based on this repeating sequence, also known as elastin-like peptides (ELPs), can excellently mimic specific properties of elastin.10−12 For instance, solutions of ELPs display an inverse temperature transition around 37 °C: at low temperatures, the ELPs are highly soluble in water, but the ELP solution becomes milky due to the reversible aggregation of the ELP, when the temperature is increased above the transition temperature. This phenomenon, also referred to as coacervation, is thought to form the origin of the self-assembly of elastin. In addition to forming an excellent model system for studying the self-assembly of elastin, elastin-like peptides have attracted considerable research interest because of their application perspective in tissue engineering13,14 and drug delivery.15,16
The molecular mechanism underlying the inverse temperature transition of elastin-like peptides is not well understood. Pioneering work by Urry et al.10,17 suggested that the coacervation may be due to the formation of a β-turn between the two valine residues within the pentapeptide repeat unit (i.e., around the Pro-Gly fragment). These researchers hypothesized that the formation of a high density of β-turns would force the disordered peptide conformation (observed below the transition temperature) into a conformation displaying a long-range order, termed a β-spiral.18,19 However, the existence of the β-spiral remains highly speculative as molecular dynamics (MD) simulations indicate that this structure is not stable in water.20,21 In the past, a variety of spectroscopic techniques, including infrared,22−24 Raman,25,26 NMR,17,27,28 and circular dichroism10,11,24,29 spectroscopy, have been used to study the coacervation transition in ELPs. However, obtaining a detailed molecular picture of the coacervation mechanism has proven extremely difficult. The main challenge lies in the fact that ELPs populate a large ensemble of disordered conformations which, moreover, interconvert on very short time scales (down to nanoseconds).30 Ultrafast spectroscopic methods are in principle well suited to characterize the disordered conformational ensemble of ELPs because they probe molecular structures on time scales short with respect to the interconversion time. Recently, Tokmakoff and co-workers used two-dimensional infrared (2DIR) spectroscopy in combination with computational methods to study the structure of a number of very short elastin-like peptides (i.e., consisting of a single repeat unit).31,32 The authors found that the ELPs studied can indeed adopt a β-turn, but the β-turn turned out to be very labile, with the result that only a small fraction of the molecules adopt the β-turn. It should be noted that because of their short length, the ELPs in question did not exhibit a coacervation transition. As a result, the exact role of the β-turn in the coacervation transition of ELPs has yet to be resolved.
In this work, we use 2DIR spectroscopy to study the coacervation transition of ELPs. Our article is divided into two parts. The first part deals with a 450-residue ELP of the type (Val(1)-Pro(2)-Gly(3)-Xaa(4)-Gly(5))n. Here, Xaa represents a guest residue that can be any residue except proline. This ELP displays a sharp coacervation transition, and the transition temperature can be tuned by varying the hydrophobicity of the Xaa residue. We will specifically focus on spectroscopic observables that report on the local fluctuations experienced by the peptide, such as vibrational energy transfer rates and spectral diffusion rates. These observables provide information about the interaction of the peptide with its solvation shell, and we will study how this interaction changes as a function of temperature. In the second part of the article, we will draw a parallel between the behavior of this long ELP and that of a very short ELP, which is composed of the single pentapeptide repeat Val-Pro-Gly-Val-Gly. This latter ELP does not display a coacervation transition, but it serves as a good model system for studying the conformational flexibility of longer ELPs. In this case, we will modulate the interaction between this peptide and the solvent by adding the amphiphilic molecule trifluoroethanol (TFE) as a cosolvent. TFE is known to enhance secondary structural elements in peptides.33,34 By comparing the effects of temperature and solvent composition on the ELPs studied, we gain insight into the mechanism of the coacervation transition.
Materials and Methods
Sample
Figure 1 gives an overview of the chemical structure of elastin-like peptides and schematically illustrates the basic features observed in the infrared spectrum of this class of peptides. The two different elastin-like peptides studied in this work are referred to as ELP90 and ELP1. ELP90 is a 90-repeat elastin-like peptide described by the sequence (Val-Pro-Gly-Xaa-Gly)90, where the guest position Xaa is occupied by the residues Val, Leu, and Gly in a 5:2:3 ratio. ELP90 was synthesized using recombinant-protein expression as previously documented.37,38 The peptide was purified using inverse transition cycling39 and its purity was checked by sodium dodecyl sulfate-polyacrylamide gel electrophoresis. For the spectroscopic measurements, the peptide was dissolved in D2O (Cambridge Isotopes Laboratories, Inc.) at concentrations ranging from 10 to 60 mg/mL.
Figure 1.
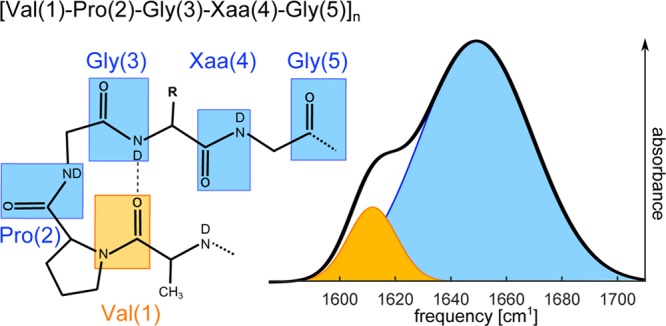
Chemical structure of elastin-like peptides with a schematic illustration of their infrared spectrum (in D2O). The amide I′ groups are indicated by rectangles. The figure also shows the experimental linear infrared absorption spectrum of ELP90 at 298 K in the frequency region of the amide I vibrations. This spectrum contains two major contributions. The amide groups labeled 2–5 give rise to a broad absorption band with a maximum at 1650 cm–1 (blue), whereas the amide I′ mode of the Val(1) residue has its maximum absorption at 1615 cm–1 (orange). The lower frequency of the Val(1) residue follows from the fact that this amide group is a tertiary amide, whereas the other four amide groups are secondary amides.31,35,36
ELP1 stands for the single-repeat pentapeptide Ac-Val-Pro-Gly-Val-Gly-NH2. The peptide was custom-synthesized by GL Biochem (Shanghai, China). To remove residual trifluoroacetic acid, the peptide was dissolved in DCl and lyophilized before use.40 The spectroscopic measurements were performed on solutions of ELP1 (25 mg/mL) in TFE/D2O mixtures (trifluoroethanol-d3, Sigma-Aldrich). In these experiments, the volume fraction of TFE was varied from 0 to 65%.
Linear Infrared Spectroscopy
All linear absorption measurements were performed using a Bruker Vertex 80v Fourier transform infrared (FTIR) spectrometer equipped with a liquid-nitrogen-cooled mercury–cadmium–telluride (MCT) detector. The spectra were recorded under a N2 atmosphere at a resolution of 2 cm–1. For every spectrum, 50 scans were averaged. In all measurements, a standard sample cell with a path length of 50 μm was used. The reported spectra were corrected for the absorption of the (TFE/D2O) solvent background. The temperature-dependent FTIR measurements on ELP90 were performed using a Peltier-cooled temperature cell (Mid-IR Falcon, Pike technologies). The temperature was ramped from 293 to 323 K at a rate of 0.4 K/min, and the spectra were acquired at intervals of 2 K. The background measurements on neat D2O were performed using the same ramping parameters.
Two-Dimensional Infrared Spectroscopy
Figure 2 displays a schematic representation of the experimental setup used to measure the 2DIR spectra. Our primary light source is a commercially available regenerative amplifier (Coherent, Legend Elite-USP-1k-HE+) generating 800 nm pulses with a duration of 35 fs and an energy of 5 mJ. The 800 nm pulses are split into 3 and 1 mJ pulses and fed into two commercial optical parametric amplifiers (OPAs; Light Conversion Ltd, TOPAS-Prime). The signal and idler outputs of the OPAs are difference-frequency mixed in AgGaS2 crystals to generate mid-infrared pulses centered at 1650 cm–1 (full width at half-maxima (FWHM) ∼ 250 cm–1, <100 fs) with energies of 25 and 4 μJ. The polarization of the mid-infrared pulses is perpendicular to the plane of the laser table. The low-energy pulse is reflected off a ZnSe wedge to create probe (front reflection) and reference pulses (back reflection). The polarization of the probe pulses is rotated by 45° using a λ/2 plate, which allows us to perform polarization-resolved measurements.
Figure 2.
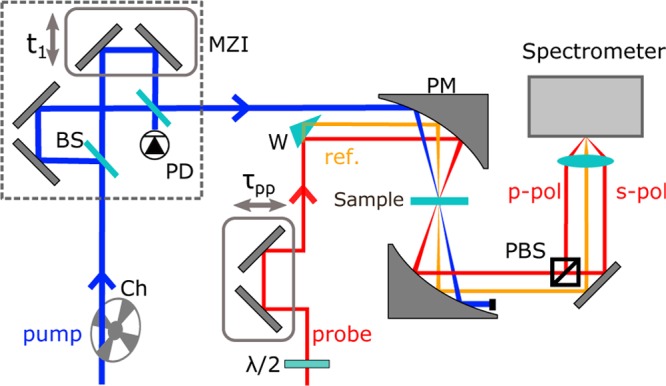
Experimental setup used for the 2DIR measurements. Abbreviations: MZI, Mach–Zehnder interferometer; BS, 50:50 beam splitter; PBS, polarizing beam splitter; PD, pyroelectric detector; Ch, chopper; PM, parabolic mirror; W, wedge.
The 2DIR spectra are recorded in a pump–probe geometry.41 In this scheme, one directly monitors the transmission change of the probe pulse induced by the pump pulse. For this purpose, a chopper wheel, synchronized to the laser system, is placed in the pump beam to block every other pump pulse. A pump–probe delay is introduced by guiding the probe beam over a computer-controlled mechanical delay stage. The reference pulses are used to correct for shot-to-shot fluctuations in the probe intensity. A gold parabolic mirror (R = 15 cm) is used to focus the pump, probe, and reference pulses onto the sample. The pump and probe foci are spatially overlapped inside the sample, whereas the reference focus is displaced by a few millimeters. Behind the sample, the three pulses are recollimated using a gold parabolic mirror identical to the one in front of the sample. After having interacted with the sample, the probe pulses are split into two perpendicularly polarized pulses (parallel and perpendicular to the polarization of the pump pulse), so that we can perform polarization-resolved measurements. The two probe beams and the reference beam are dispersed by a spectrometer, and they are simultaneously detected by a liquid-nitrogen-cooled mercury–cadmium–telluride (MCT, 3 × 32 pixel) detector.
In a 2DIR spectrum, the absorption change is presented as a function of both the pump and the probe frequency. The pump frequency is resolved by placing a Mach–Zehnder interferometer (MZI) into the pump beam. The interferometer creates a collinear pulse pair with a computer-controlled time delay t1 between the pulses. Pump–probe spectra are recorded for a range of t1 delays, and the data set is Fourier transformed along t1 to yield the 2DIR spectrum. The distance scanned by the interferometer is determined by simultaneously recording the interference pattern of a reference HeNe laser.41 We precisely calibrate the zero point of the t1 delay by recording an interferogram of the pump pulse using a pyrodetector in the unbalanced arm of the interferometer. The t1 delay is varied up to 4 ps, resulting in a resolution of Δνpump = 4.1 cm–1 along the excitation axis after Fourier transformation.
Artifacts originating from the interference of scattered pump light with the probe light on the detector are reduced by placing a wobbling ZnSe window under Brewster angle into the pump path.42 All experiments are performed under an N2 atmosphere in a standard sample cell with a path length of 50 μm. The temperature of the ELP90 samples is kept at 296 and 318 K using a Peltier element with an active feedback look.
Molecular Dynamics Simulations
Modeling
The pentapeptide ELP1 was modeled in two conformations, namely, an extended and a folded conformation. Modeling was done with the help of the Avogrado package.43 For the folded structure, a hydrogen bond between the Val(1) and the Val(4) residues was induced. Both peptide conformations were solvated in a cubic box in two different solvents: (1) bulk water, giving rise to a box with dimensions of 3 × 3 × 3 nm3, and (2) TFE/water 60:40 [v/v], for which the box dimensions were 4 × 4 × 4 nm3. The charges used to describe the TFE molecule were adapted from ethanol, where the hydrogen atoms were replaced by fluorine atoms and the charges were changed accordingly. The interactions between the molecules were described with the OPLS-AA force field.44
Simulations
A constant pressure production simulation of 10 ns with a time step of 0.001 fs, at 1 bar and 300 K, was performed using the Gromacs-4.6.1 suite.45 The pressure was kept constant with a Parrinello–Rahman barostat,46 with τp = 0.2 ps–1, whereas a V-rescale thermostat,47 with τp = 0.2 ps–1, was used to keep the temperature constant. The Lennard-Jones and Coulomb interactions were determined within a 1.1 nm cutoff.48 The latter were treated using Particle Mesh Ewald,49 with a grid spacing of 0.16 nm and a convergence criterion of 10–1. The bonds were constrained using the LINCS algorithm, and the atomic coordinates were stored every 10 fs.
Spectral Calculations
The amide I time-dependent vibrational Hamiltonian was constructed from the snapshots stored from the MD simulation, and has the following form
| 1 |
The site frequencies are described by ωi, and the transition dipoles μi, are calculated using electrostatic maps for the amide I mode. These maps relate the electrostatic environment generated by the force field point charges with the infrared frequencies of the dipoles. For this study, the Jansen map was chosen.50 The short-range couplings were determined using the nearest-neighbor coupling,35,51 which is a Ramachandran-angle-based mapping parameterized from the density functional theory calculations on dipeptides. The long-range couplings between the different amide I units were calculated using the transition-dipole-coupling model.52 After generating the amide I time-dependent Hamiltonian, the spectra are analyzed by numerical integration of the Schrödinger equation53,54 where an instantaneous interaction between the laser field and the system is assumed. This protocol has been demonstrated to yield good spectra for proteins.55
Results
Effect of Temperature on the Structural Dynamics of ELP90
Linear Infrared Spectra
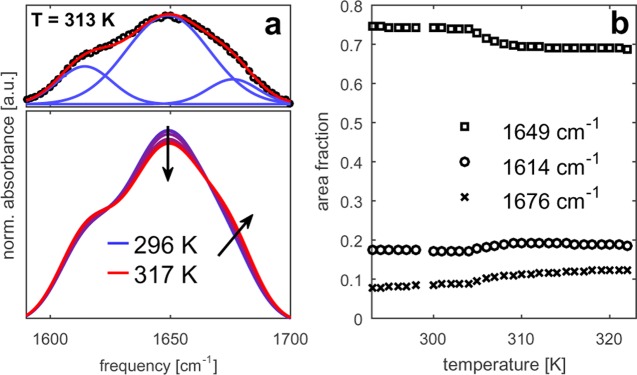
We characterize the temperature-induced collapse of ELP90 using conventional FTIR spectroscopy. Figure 3b displays linear infrared spectra of ELP90 recorded at a range of temperatures starting at ∼15 K below until ∼15 K above the transition temperature. The ELP90 spectrum clearly exhibits two maxima, as illustrated in Figure 1: the maximum at 1615 cm–1 is attributed to the resonance of the amide I vibration of Val(1) and the maximum at 1650 cm–1 is attributed to the resonances of the amide I vibrations of the other four amide groups in the pentapeptide repeat. The redshift of the amide I vibration of Val(1) is caused by the fact that this is a tertiary amide as opposed to the others that are secondary amides.31,35,36 Upon increasing the temperature, the peak absorbance at 1650 cm–1 decreases and a shoulder develops around 1675 cm–1. To quantify these spectral changes, we use a fitting procedure to deconvolute the ELP90 spectra into Gaussian bands (Figure 3a). Three Gaussians are required to adequately describe the IR spectra at all temperatures. These Gaussian bands are centered at 1614, 1649, and 1676 cm–1 and have full widths at half-maxima (FWHM) of 24, 41, and 24 cm–1, respectively. This result implies that the absorption of the amide I vibrations of the four secondary amide groups of the pentapeptide is not a single broad resonance, but consists of two distinct absorption bands that show an opposite dependence on temperature. In the fitting procedure, only the amplitudes of the three bands are allowed to vary as a function of temperature (their center position and FWHM remain fixed). Figure 3 shows the integrated intensity of these bands as a function of temperature. All bands show a sigmoidal dependence on temperature, with a transition point at 305 K. The sigmoidal temperature dependence clearly indicates that the temperature-induced aggregation is a two-state transition.
Figure 3.
(a) Linear infrared spectra of ELP90 in D2O (20 mg/mL) for temperatures between 296 and 317 K. The top panel illustrates the decomposition of the spectrum at 313 K (black squares) into three Gaussian bands (blue lines). The red solid line represents the sum of the three Gaussians. (b) Relative contributions of the three bands to the amide I′ spectrum of ELP90 as a function of temperature. The relative contribution is expressed as the integrated intensity of the respective band divided by the integrated intensity of the amide I′ spectrum.
Two-Dimensional Infrared Spectra
To gain more insight into the origin of the different bands observed in the linear infrared spectrum of ELP90, we performed 2DIR experiments. Figure 4 displays the (delay-dependent) 2DIR spectra of ELP90 recorded at temperatures below (296 K; left-hand side) and above (318 K; right-hand side) the transition temperature. We first consider the low-temperature 2DIR spectra. At short delays (0.3 ps), we observe a diagonally elongated lineshape, which indicates that the amide I′ spectrum is strongly inhomogeneously broadened. The 2DIR spectrum consists of a negative component on the diagonal, due to ground-state bleaching and stimulated emission of the 0 → 1 transition, and a positive component at lower probe frequencies, due to the induced absorption of the 1 → 2 transition. Contrary to the FTIR spectrum, the Val(1) band is observed in the 2DIR spectrum as a well-separated resonance at 1615 cm–1. The other two sub-bands constituting the amide I′ spectrum overlap and give rise to one broad resonance around 1650 cm–1. As the pump–probe delay is increased, two effects are observed. First, we see that cross-peaks appear between the Val(1) band and the band at 1650 cm–1. These ingrowing cross-peaks point at vibrational energy transfer between the Val(1) mode and the modes at 1650 cm–1. The appearance of cross-peaks on both sides of the diagonal demonstrates that both uphill and downhill energy transfer processes occur. The second effect observed with increasing pump–probe delay is the spectral reshaping of the band around 1650 cm–1: from a diagonally elongated lineshape at short delays to a round lineshape at long delays.
Figure 4.
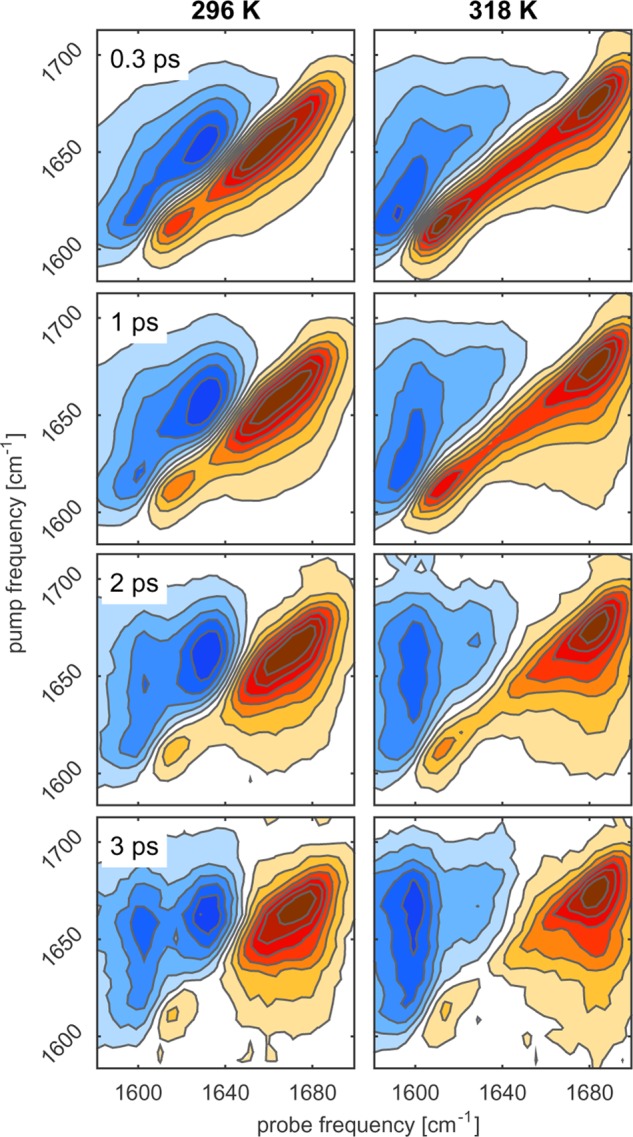
Isotropic 2DIR spectra of ELP90 in D2O (20 mg/mL) at different pump–probe delays and for two different temperatures. Negative absorption changes are depicted in red and positive absorption changes in blue. The contour lines are drawn equally spaced at 12.5% increments.
Next, we consider the changes that occur upon increasing the temperature above the transition point. For short delays (0.3 ps), we observe the appearance of a pronounced blue shoulder at ∼1675 cm–1. With increasing delay, we observe the same features as we observed at temperatures below the transition point: cross-peaks develop between the high-frequency band and the Val(1) band; also, the shape of the 1650 cm–1 band evolves from diagonally elongated to round.
Relaxation and Exchange Dynamics
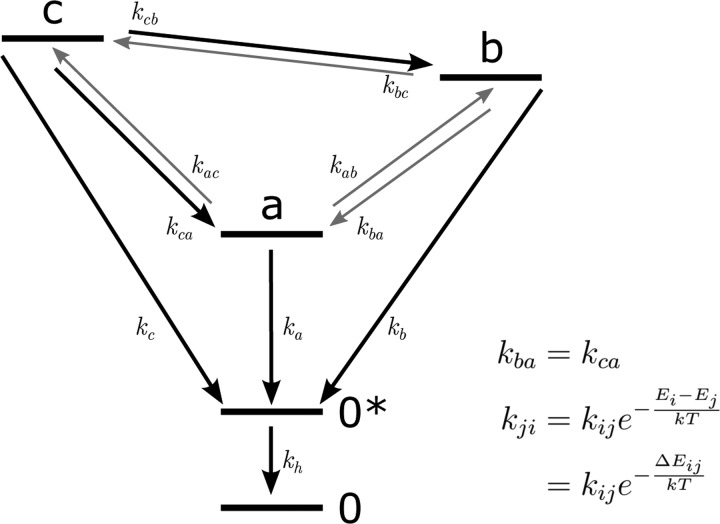
In the previous section, we have identified an exchange process between the band of the Val(1) residue and the two high-frequency modes at ∼1650 cm–1 and an exchange process between the two high-frequency modes (reshaping of the ∼1650 cm–1 band). We determine the time constants of these two exchange processes by fitting a relaxation model to our data. The relaxation model used is summarized in Figure 5. The model describes the time-dependent populations of the three bands identified in the linear spectrum. These modes exchange population with each other and lose population through vibrational relaxation. The vibrational relaxation of the three modes proceeds via an intermediate state to a hot ground state. The hot ground state accounts for the fact that vibrational relaxation leads to a slight increase in the sample temperature, which, in turn, affects the amide I′ spectrum.56,57 The intermediate state serves to describe the observation that sample heating is often slightly delayed with respect to the vibrational relaxation.58 The time-dependent populations of the levels ni (Figure 5) are governed by the following set of rate equations.
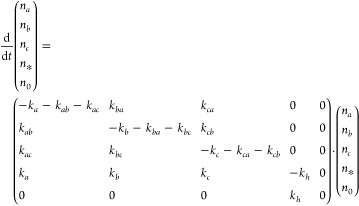 |
2 |
We relate
the uphill exchange rates to the
downhill rates with the detailed-balance condition  , where k is Boltzmann’s
constant, T is the absolute temperature, and ΔE is the energy difference between the two modes. To further
reduce the number of fitting parameters, we assume that the exchange
process with the Val(1) band is governed by a single time constant
(that is, we set kba = kca). We describe the experimental 2DIR signal
at three specific pump frequencies, specifically at the center frequencies
of the three modes identified in the linear spectra. The 2DIR signal
for these frequencies is given by
| 3 |
In this expression, the indices i and j serve as mode labels, which run over the set {a, b, c }, νpr represents the probe frequency, and νpu(i) represents the center frequency of mode i. The transient spectrum associated with mode j is denoted as σj(νpr) and can be obtained from the 2DIR spectrum at zero pump–probe delay (it is given by Δα(νpu, νpr, 0)). The heating spectrum σheat(i)(νpr) is obtained from the 2DIR spectrum at long delays (the dependence on mode index i amounts to a scaling factor due to the variation of the sample absorbance with the pump frequency). We note that nj(t) represents the time-dependent population of mode j when pumping mode i, so that every pump frequency in the 2DIR spectrum is associated with a different set of time-dependent populations nj(i)(t). The initial conditions for the populations in eq 2 depend on the pump frequency according to
| 4 |
where δij is the Kronecker delta. Finally, we mention that the scaling factors Rij are necessary to account for the different cross sections of the three modes. These 9 factors are not independent, and they can all be expressed in terms of the cross-section ratios of modes a to b and modes a to c (so that there are only two free parameters).
Figure 5.
Schematic representation of the model used to describe the exchange dynamics of the amide I′ vibrations of ELP90 in D2O. The amide I′ absorption band is described with three independent modes with central frequencies: a = 1613 cm–1, b = 1648 cm–1, and c = 1675 cm–1. Thick arrows denote independent time constants and thin arrows denote time constants that are derived from the independent constants using the equations on the right.
The above model describes the time dependence of the 2DIR spectrum (at three specific pump frequencies) in terms of four time-independent spectra that are directly extracted from the 2DIR spectrum (three mode spectra and one heating spectrum) and eight fitting parameters (three relaxation rates kj, the heating rate kh, two independent exchange constants kcb and kba, and two independent scaling factors Rij). Figure 6 displays the experimental 2DIR slices that were fitted with the model. Note that in this figure, the transient spectra have been normalized to emphasize the ingrowth of the cross peaks. Table 1 summarizes the rate constants extracted from the fits at both temperatures. We see that the relaxation constants and the exchange rate kba do not show a significant variation with the aggregation state of the peptide. Only the exchange between the two high-frequency modes (kcb) shows a small but significant slowdown upon aggregation.
Figure 6.
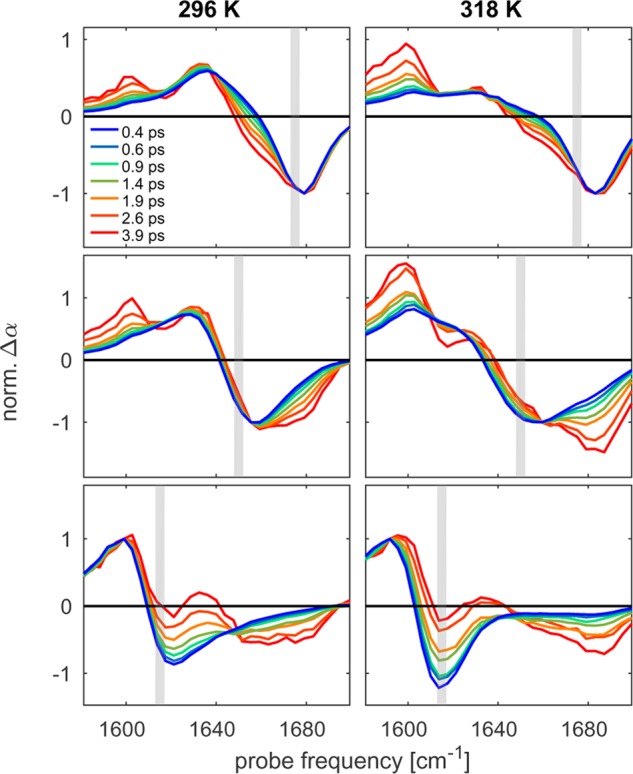
Experimental 2DIR slices for ELP90 (20 mg/mL) in D2O below Tc (296 K, left-hand side) and above Tc (318 K, right-hand side). The pump frequencies are indicated by gray vertical bars and correspond to νpump = 1675, 1648, and 1615 cm–1. The transient spectra are normalized to the maximum bleach (top and middle plots) or the maximum ESA (bottom plots) to emphasize the cross-peak dynamics.
Table 1. Results of the Fitting of the Relaxation Model to the ELP90 2DIR Dataa.
| temperature [K] | kc [ps–1] | kb [ps–1] | ka [ps–1] | kba [ps–1] | kcb [ps–1] | kSD [ps–1] |
|---|---|---|---|---|---|---|
| 296 | 0.55 ± 0.01 | 0.71 ± 0.02 | 1.04 ± 0.03 | 0.18 ± 0.02 | 0.38 ± 0.01 | 0.09 ± 0.02 |
| 318 | 0.54 ± 0.03 | 0.71 ± 0.05 | 1.04 ± 0.03 | 0.18 ± 0.02 | 0.31 ± 0.03 | 0.06 ± 0.02 |
The rate constants reported are the result of averaging five independent measurement series per temperature. The errors give the standard deviation of the mean. The spectral diffusion rate constants kSD are also listed. These are obtained by fitting the inverse nodal line slopes (INLSs) (Figure 7) to a monoexponential function.
Spectral Diffusion of the Val(1) Resonance
The 2DIR spectra in Figure 4 show that the Val(1) resonance (1615 cm–1) is essentially decoupled from the rest of amide I′ band of ELP90. This resonance therefore reports on the local fluctuations experienced by the Val(1) residue. At short delays (0.3 ps), we see that the Val(1) resonance shows a pronounced diagonal elongation, which points to a strong inhomogeneous broadening of the resonance. It is interesting to consider how fast this inhomogeneity decays over time because the decay constant reflects the degree of solvent exposure of the respective residue: a fast decay corresponds to a solvent-exposed residue, whereas a slow decay points to a residue that is shielded from the solvent.59−61 We quantify the (time-dependent) inhomogeneity of the Val(1) resonance through the (inverse of the) slope of the nodal line. The time-dependence of this parameter is shown in Figure 7 at temperatures above and below the transition temperature. We observe a very slow decay of the inverse nodal line slope at temperatures below the transition temperature, and, interestingly, this decay does not change significantly upon aggregation of the peptide (see Table 1 for the decay constants). As a reference experiment, we have repeated these spectral diffusion measurements for a molecule that has an amide group that is fully solvent exposed. For this purpose, we have chosen N-acetylated proline (AcPro) because its amide group has the same chemical environment as the amide group of the Val(1) residue in ELP90. As expected, we see that for AcPro, the inverse nodal line slope decays much faster than that for ELP90 (Figure 7). These spectral diffusion measurements indicate that the amide group of the Val(1) residue is shielded from the solvent both in the aggregated and in the nonaggregated state of the peptide.
Figure 7.
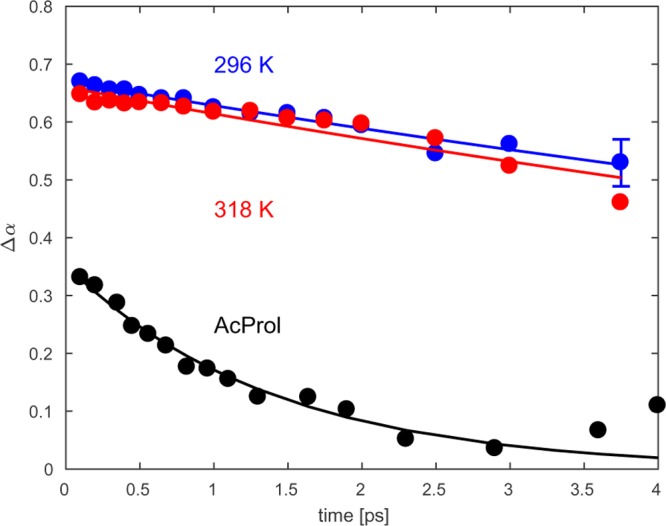
Inverse nodal line slope (INLS) of the Val(1) resonance of ELP90 above (red) and below (blue) the transition temperature. For comparison, the INLS of acetylated proline in D2O is shown in black.
Effect of the Solvent Composition on the Structural Dynamics of ELP1
Linear Infrared Spectra
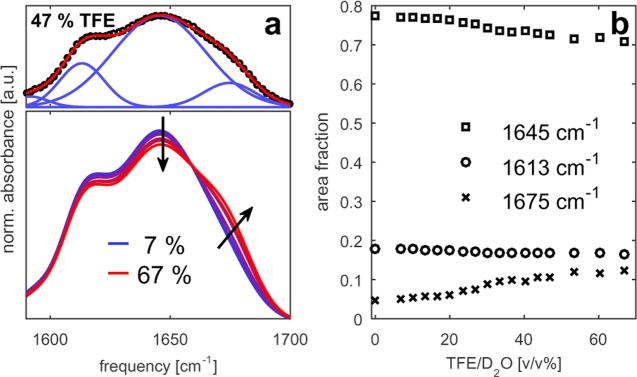
To gain more insight into the origin of the inverse temperature transition of ELP90, we performed additional experiments on the simpler ELP1 peptide, which is composed of a single pentapeptide repeat unit. Because ELP1 does not display a coacervation transition as a function of temperature, we study its behavior following the addition of the amphiphilic cosolvent trifluoroethanol (TFE). TFE is generally known to induce secondary structure in peptides.62−64 In our experiments, the solvent composition was varied from 0 to 65 vol % TFE in D2O [v/v %]. The FTIR spectra of these solutions are displayed in Figure 8. We have used the same global fitting procedure as for ELP90 to decompose these spectra into Gaussian bands (Figure 8, top panel). The ELP1 amide I′ band can be excellently described using a linear combination of four Gaussians (centered around 1590, 1613, 1645, and 1675 cm–1). Three of the four bands have nearly identical center positions as those for ELP90. The fourth band at 1590 cm–1 is assigned to the vibration of a carboxylic acid group present because of the incomplete amidation of the C-terminus of the pentapeptide. The intensity of this band is very small and does not vary with solvent composition. The intensities of the 1645 and 1675 cm–1 bands show a sigmoidal profile as a function of the TFE concentration, with a maximum slope at a TFE volume fraction of 30%. This sigmoidal profile points at a relatively strong change in the hydrogen-bond configuration of the solvent interacting with the amide groups near a volume fraction of 30% TFE.
Figure 8.
(a) Linear infrared spectra of ELP1 (25 mg/mL) in TFE/D2O mixtures of varying composition. The top panel illustrates the decomposition of a typical spectrum (black squares) into four Gaussian bands (blue lines). The red solid line represents the sum of the four Gaussians. (b) Relative contributions of the three main bands to the amide I′ spectrum of ELP1 as a function of the solvent composition.
2DIR Spectroscopy
Figure 9 shows the 2DIR spectra of ELP1 for two solvent compositions. We observe two effects in these spectra that parallel the observations made for ELP90. First, the pronounced separation between the Val(1) band at the 1615 and 1650 cm–1 bands is clearly visible. Second, we observe energy transfer between these two bands, as well as a reshaping of the 1650 cm–1 band with increasing delay time.
Figure 9.
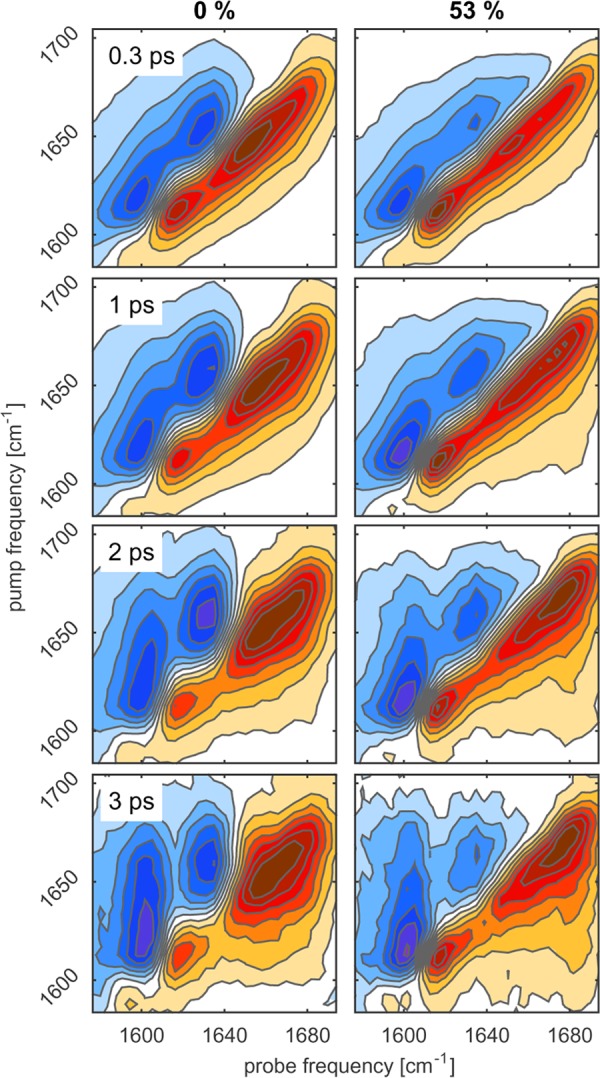
Isotropic 2DIR spectra of ELP1 (25 mg/mL) in TFE/D2O mixtures at different pump–probe delays and for two solvent compositions: 0% TFE (left) and 53% TFE (right). Negative absorption changes are depicted in red and positive absorption changes in blue. The contours are drawn equally spaced at 12.5% increments.
Relaxation and Exchange Dynamics
We use the same relaxation model as used in the above analysis of the ELP90 data to quantitatively describe the ELP1 data sets. The fitting results are summarized in Figure 10. Next, we consider the exchange dynamics and, interestingly, observe that the two exchange constants show a very different solvent dependence. Apparently, the exchange with the Val(1) band (characterized by the exchange constant kba) is independent of the solvent composition. The other exchange process (i.e., the reshaping of the high-frequency band characterized by the constant kcb), on the other hand, slows down dramatically with increasing TFE concentration.
Figure 10.
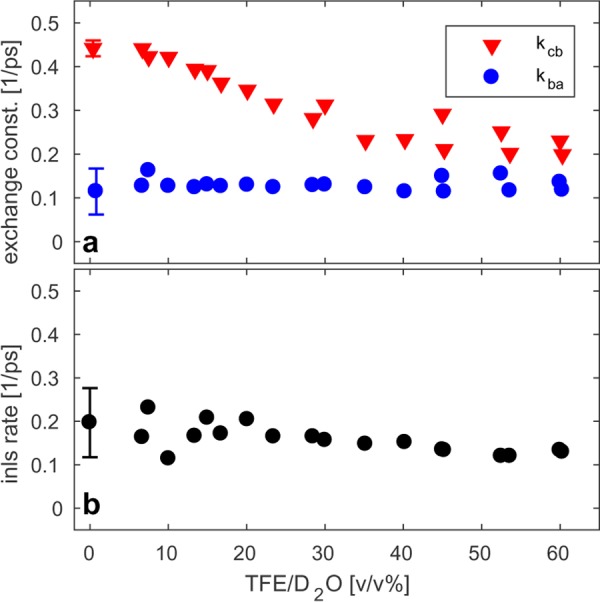
(a) Fitting results of the relaxation model described in the text to the ELP1 data sets. The exchange constants kcb and kba are plotted versus TFE volume fractions. (b) Decay rate of the spectral diffusion curves of the Val(1) resonance versus TFE volume fraction. The error bars represent the standard deviation of the mean of three measurements.
Spectral Diffusion of the Val(1) Resonance
In Figure 11 we have plotted the inverse nodal line slope of the Val(1) resonance of ELP1 for the two limiting solvent compositions studied (0 and 60% TFE). As a reference, we also include the spectral diffusion dynamics of ELP90 (dashed black lined) and AcPro (solid black line). We see that for ELP1 in neat D2O, the spectral diffusion is much slower than in the case for AcPro (whose amide group is fully solvent exposed). Upon increasing the TFE concentration of the solvent, these dynamics slow down and approach the slow spectral diffusion dynamics we observed for ELP90. We have quantified these observations by fitting a monoexponential to the decay curves and plotted the resulting decay constants in Figure 10b.
Figure 11.
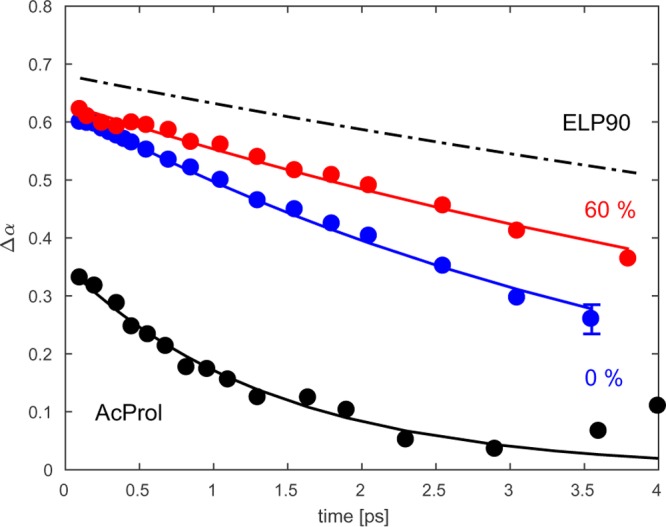
Inverse nodal line slope (INLS) of Val(1) at a low (blue) and a high (red) volume fraction of TFE. For comparison, the INLS of acetylated proline (30 mg/mL) in D2O (black, point dashed) and the INLS of ELP90 (20 mg/mL) in D2O (black, point dashed) are shown.
Discussion
We found that the linear amide I vibrational spectrum can be well modeled with three Gaussian bands centered at 1615, 1645, and 1675 cm–1, where we assigned the 1645 and 1675 cm–1 bands to the residues 2–5 of the pentapeptide repeat unit. In view of the correlation between the amide I′ frequency of the residue and the strength of its hydrogen bond,36,65,66 the low-frequency sub-band at 1645 cm–1 is likely associated with strongly hydrogen-bonded residues, whereas the high-frequency sub-band at 1675 cm–1 is likely due to more weakly hydrogen-bonded residues. This interpretation is in line with the observation that the high-frequency sub-band gains intensity at the expense of the low-frequency sub-band when the temperature or the TFE volume fraction is increased.
The above interpretation is further confirmed by molecular dynamics simulations of the ELP1 peptide. We simulated this peptide in two conformations: an extended conformation and a folded conformation (which contains a hydrogen bond between the two valine residues). As shown in Figure 12, the general trends observed in the linear spectra of ELP1 are best reproduced by the folded conformation, suggesting that the peptide predominantly adopts a folded conformation. The calculated dependence of the frequency–frequency correlation function is also best explained with a folded conformation of ELP1 (see the Supporting Information). The dominance of a folded conformation for ELP1 is consistent with the findings obtained for a similar peptide studied in refs (32) and (31). The presence of a hydrogen bond between the two valine residues implies that the Val(1) amide vibration is coupled to the other amide vibrations of the pentapeptide repeat unit. This coupling does not lead to a strong mode mixing because of the large frequency difference between the tertiary amide vibration of Val(1) and the secondary amide vibrations of residues 2–5. As a result, the Val(1) amide vibration is a well-localized vibration, and the coupling only leads to energy exchange with the amide vibrations of residues 2–5.
Figure 12.
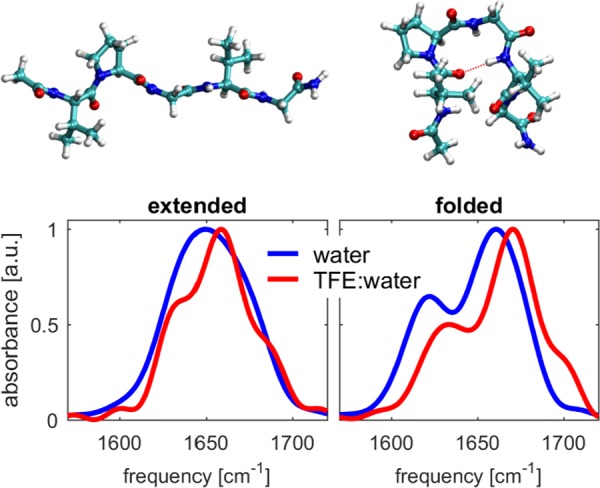
Linear infrared spectra calculated from the molecular dynamics simulations of the extended (left) and folded (right) ELP1 in water (blue) and a TFE/water (60:40 [v/v]) mixture (red). The corresponding molecular conformations are shown above the spectra.
Next, we used the MD simulations to determine the number of hydrogen bonds that ELP1 forms with the solvent. These numbers are given in Table 2. The total number of peptide–solvent hydrogen bonds decreases by approximately 30% when the TFE volume fraction is increased from 0 to 60% (both for the extended and folded conformations). The observed spectral difference between the folded and extended structures containing one and zero internal hydrogen bond, respectively, is consistent with the observations in previous studies.31,32 In these studies, it was found that an increase in the hydrophobicity of the amino acid at the valine position leads to enhanced folding of the protein.
Table 2. Average Number of Hydrogen Bonds per ELP1 Molecule in the MD Simulationsa.
| ELP1 conformation |
|||
|---|---|---|---|
| solvent | H-bond type | extended | folded |
| water | peptide–water | 12.61 ± 1.77 | 10.86 ± 1.57 |
| TFE/water | peptide–water | 3.88 ± 1.70 | 3.30 ± 1.52 |
| peptide–TFE | 5.40 ± 2.14 | 4.31 ± 1.71 | |
The errors give the standard deviation of the mean.
The ingrowth of the blue shoulder in the ELP1 spectrum with increasing TFE volume fraction can thus be attributed to a reduction in the number of hydrogen bonds formed by the peptide groups. Another effect that could contribute to the ingrowth of the blue sub-band is the weakening of the average hydrogen bond to water due to the truncation of the water hydrogen-bond network by TFE. The spectral similarities between ELP1 and ELP90 suggest that the molecular environment experienced by ELP90 in the coacervate is very similar to the environment created by the mixed TFE/D2O solvent. This means that the spectral changes observed upon the coacervation of ELP90 are very likely attributable to the dehydration of the peptide backbone.
Having assigned the Gaussian sub-bands that make up the linear spectra of ELP1 and ELP90, we next consider how to interpret the exchange dynamics observed between these bands. Exchange dynamics in the 2DIR spectra can have several origins, including vibrational energy transfer, hydrogen-bond dynamics, and conformational dynamics. From the molecular dynamics simulations, it follows that the reshaping of the ∼1650 cm–1 band and the dynamics of the cross-peak of the 1615 and 1650 cm–1 bands are due to vibrational energy exchange processes. The observed picosecond time scale of these dynamics agrees with the time scale of energy transfer among amide I vibrations found in previous studies.67,68 The molecular dynamics simulations show that the conformational dynamics of ELP1 take place on much longer time scales. We find that the two peptides exhibit striking similarities in their vibrational energy transfer dynamics. For both ELP1 and ELP90, we observe vibrational energy transfer between the Val(1) residue and the remaining four residues inside the pentapeptide repeat. (Val(1)-exchange process), and energy transfer between residues 2–5 of the pentapeptide repeat (tetrapeptide-exchange process).
A first point to note is that the two vibrational energy transfer processes occur on the picosecond time scale (for both peptides and under all circumstances investigated). Vibrational energy transfer requires the presence of fluctuations of the coupling and/or the energy levels of the coupled modes to compensate for the energy mismatch between the modes.69−71 These fluctuations follow from the dynamics of coupled low-frequency modes of the peptide or the solvent. The occurrence of picosecond vibrational energy transfer points to a well-hydrated structure, as fluctuating hydrogen-bond interactions with mobile water molecules induce relatively large frequency modulations of the amide I vibrations. The low-frequency modes of the peptide itself usually induce much smaller frequency fluctuations of the amide I frequencies, thus making these modes less effective in compensating the energy mismatches. Applying this reasoning to ELP90 above the transition temperature, we reach the important conclusion that despite the desolvation described above, the ELP90 aggregates still contain mobile water molecules.
For ELP1, the tetrapeptide-exchange process slows down with increasing volume fraction of TFE. This slowdown is likely caused by the replacement of light and mobile water molecules in the hydration shell of ELP1 by the heavier and relatively immobile TFE molecules. TFE molecules are known to aggregate around peptides,34,72 which implies that TFE is very effective at displacing water molecules. A final interesting observation is that for both ELP90 and ELP1, kcb > kba. That is, vibrational energy transfer proceeds more slowly to and from the Val(1) residue than within the tetrapeptide unit. A likely explanation could be that for the Val(1) exchange process, the frequency mismatch is relatively large, i.e., larger than the typical magnitude of the frequency fluctuations. Given that for ELP1 the exchange constant kcb is sensitive to the degree of hydration, it would be interesting to use the ELP1 data as a reference and to estimate the degree of desolvation that occurs during the aggregation of ELP90. This can be done as follows. For ELP90, the rate constant kcb decreases by about 20% upon aggregation of the peptide (Table 1). To achieve a similar decrease for ELP1, the volume fraction of TFE needs to be ∼25% (Figure 10). Because of the preferential aggregation of TFE, mentioned above, this actually corresponds to a much higher TFE concentration inside the solvation shell of ELP1. The degree of preferential aggregation of TFE around ELP1 (in its folded conformation) can be straightforwardly obtained from the MD simulations (where we assume a solvation shell of 0.6 nm34). We find that (at a bulk TFE concentration of 25%) the concentration of TFE inside the solvation shell is 3.0 times higher than the bulk concentration, which is similar to previous findings for other peptides.34 Using this result, we find that for an ELP1 solution in 25% TFE/D2O, the TFE volume fraction inside the solvation shell is as large as 75%. From this, we conclude that during the aggregation of ELP90, roughly 3 out of 4 water molecules are removed from its solvation shell.
We end the discussion of our results by turning to the spectral diffusion dynamics of the Val(1) residue, which are displayed in Figures 7 and 11. The decay of the inverse nodal line slopes shown in these figures directly reflects the degree of solvent exposure of the Val(1) residue. As can be seen from the black curves in Figures 7 and 11, a fully solvent-exposed residue, such as the amide group of AcPro, exhibits a complete decay of the nodal line slope on a ∼2 ps time scale. Figure 11 shows that the decay rate slows down with increasing concentration of TFE. When water is replaced for a mixture of TFE/water of 25:75, the decay rate of the INLS decreases by ∼20%, which is consistent with the observations for kcb.
For ELP90, we observe a much slower decay of the nodal line slope, which indicates that in this peptide, the Val(1) residue is shielded from the solvent. A likely explanation for this strong shielding is that the C=O group of the Val(1) residue may form an intrapeptide hydrogen bond with the NH group of the Val(4) residue. The presence of such a hydrogen bond is in line with the notion that the Pro-Gly sequence is often located inside a β-turn.73,74 The experiments show that the spectral diffusion dynamics and thus the degree of solvent shielding are identical in the dissolved and aggregated state of ELP90. This implies that the β-turn is present in both states of ELP90, and, therefore, we conclude that the coacervation transition of elastin-like peptides is not actively driven by the formation of a β-turn, in contrast to previous suggestions.75−78 Instead, we speculate that the role of the β-turn may be more indirect: the β-turn may stabilize a conformation in which a large number of hydrophobic side chains are exposed, so that hydrophobic association can occur once the driving force (and therefore the temperature) is high enough.
Conclusions
We used linear infrared spectroscopy, 2DIR spectroscopy, and MD simulations to study the structural dynamics of elastin-like peptides (ELPs). To gain insight into the coacervation transition displayed by this class of peptides, we performed experiments on two different ELPs. We studied a 90-repeat ELP (450 residues), for which coacervation can be induced by increasing the temperature above the transition point. We also performed reference measurements on a single-repeat ELP (5-residues). This ELP is too short to show a coacervation transition. For this peptide, we studied the effects of a change in the solvent composition (i.e., different volume fractions of TFE in water).
Our results show that for both peptides, the amide I′ spectrum can be well described with three Gaussian bands located at 1615, 1645, and 1675 cm–1. We assign the 1615 cm–1 band to the localized amide I′ resonance of the Val(1) residue. The 1645 and 1675 cm–1 bands are associated with the residues 2–5 in the pentapeptide repeat unit, where the low-frequency band is due to more strongly hydrogen-bonded residues and the high-frequency band is due to more weakly hydrogen-bonded residues.
From the 2DIR measurements, we have identified two vibrational energy transfer processes that take place between the three Gaussian bands. The first process corresponds to the vibrational energy transfer between the Val(1) residue and the residues 2–5 of the pentapeptide repeat. The second process corresponds to energy transfer among the residues 2–5 of the pentapeptide repeat. We find that the latter process slows down as the volume fraction of water decreases in the peptide solvation shell. From this we have estimated the degree of dehydration that occurs upon coacervation of the 90-repeat ELP, and we find that this dehydration corresponds to a loss of roughly three out of four water molecules in the hydration shell.
Finally, we studied the spectral-diffusion dynamics of the Val(1) residue. We find that these dynamics are very slow and indicative of an amide group that is shielded from the solvent. Surprisingly, for the 90-repeat ELP, these dynamics do not change with the aggregation state of the peptide. We conclude that the slow dynamics are likely due to the fact that the Val(1) residue forms an intrapeptide hydrogen bond with the Val(4) residue (β-turn), and that this hydrogen bond is present in both solvated and aggregated forms of ELP90. We thus speculate that the β-turn stabilizes a conformation in which a large number of hydrophobic side chains are exposed to water, with the result that hydrophobic association will occur once the driving force, i.e., the temperature, is sufficiently high. This mechanism likely explains the occurrence of coacervation for elastin-like peptides.
Acknowledgments
This work is part of the research programme of the Netherlands Organization for Scientific Research (NWO) and was performed at the research institute AMOLF.
Supporting Information Available
The Supporting Information is available free of charge on the ACS Publications website at DOI: 10.1021/acs.jpcb.8b05221.
Vibrational relaxation; simulated frequency–frequency correlation function (PDF)
The authors declare no competing financial interest.
Supplementary Material
References
- Starcher B. C. Elastin and the Lung. Thorax 1986, 41, 577–585. 10.1136/thx.41.8.577. [DOI] [PMC free article] [PubMed] [Google Scholar]
- Foster J. A.; Curtiss S. W. The Regulation of Lung Elastin Synthesis. Am. J. Physiol.: Lung Cell. Mol. Physiol. 1990, 259, L13–L23. 10.1152/ajplung.1990.259.2.L13. [DOI] [PubMed] [Google Scholar]
- Starcher B. C. Lung Elastin and Matrix. Chest 2000, 117, 229S–234S. 10.1378/chest.117.5_suppl_1.229S-a. [DOI] [PubMed] [Google Scholar]
- Robert L.; Jacob M. P.; Frances C.; Godeau G.; Hornebeck W. Interaction between Elastin and Elastases and its Role in the Aging of the Arterial Wall, Skin and other Connective Tissues. A Review. Mech. Ageing Dev. 1984, 28, 155–166. 10.1016/0047-6374(84)90015-0. [DOI] [PubMed] [Google Scholar]
- Oxlund H.; Manschot J.; Viidik A. The Role of Elastin in the Mechanical Properties of Skin. J. Biomech. 1988, 21, 213–218. 10.1016/0021-9290(88)90172-8. [DOI] [PubMed] [Google Scholar]
- Frances C.; Robert L. Elastin and Elastic Fibers in Normal and Pathologic Skin. Int. J. Dermatol. 1984, 23, 166–179. 10.1111/j.1365-4362.1984.tb04506.x. [DOI] [PubMed] [Google Scholar]
- Tsamis A.; Krawiec J. T.; Vorp D. A. Elastin and Collagen Fibre Microstructure of the Human Aorta in Ageing and Disease: A Review. J. R. Soc., Interface 2013, 10, 20121004 10.1098/rsif.2012.1004. [DOI] [PMC free article] [PubMed] [Google Scholar]
- Patel A.; Fine B.; Sandig M.; Mequanint K. Elastin Biosynthesis: The Missing Link in Tissue-Engineered Blood Vessels. Cardiovasc. Res. 2006, 71, 40–49. 10.1016/j.cardiores.2006.02.021. [DOI] [PubMed] [Google Scholar]
- Debelle L.; Tamburro A. M. Elastin: Molecular Description and Function. Int. J. Biochem. Cell Biol. 1999, 31, 261–272. 10.1016/S1357-2725(98)00098-3. [DOI] [PubMed] [Google Scholar]
- Urry D. W.; Long M. M.; Cox B. A.; Ohnishi T.; Mitchell L. W.; Jacobs M. The Synthetic Polypentapeptide of Elastin Coacervates and Forms Filamentous Aggregates. Biochim. Biophys. Acta 1974, 371, 597–602. 10.1016/0005-2795(74)90057-9. [DOI] [PubMed] [Google Scholar]
- Reiersen H.; Clarke A. R.; Rees A. R. Short Elastin-Like Peptides Exhibit the Same Temperature-Induced Structural Transitions as Elastin Polymers: Implications for Protein Engineering. J. Mol. Biol. 1998, 283, 255–264. 10.1006/jmbi.1998.2067. [DOI] [PubMed] [Google Scholar]
- Bellingham C. M.; Lillie M. A.; Gosline J. M.; Wright G. M.; Starcher B. C.; Bailey A. J.; Woodhouse K. A.; Keeley F. W. Recombinant Human Elastin Polypeptides Self-Assemble into Biomaterials with Elastin-Like Properties. Biopolymers 2003, 70, 445–455. 10.1002/bip.10512. [DOI] [PubMed] [Google Scholar]
- Nettles D. L.; Chilkoti A.; Setton L. A. Applications of Elastin-Like Polypeptides in Tissue Engineering. Adv. Drug Delivery Rev. 2010, 62, 1479–1485. 10.1016/j.addr.2010.04.002. [DOI] [PMC free article] [PubMed] [Google Scholar]
- Daamen W. F.; Veerkamp J. H.; van Hest J. C. M.; van Kuppevelt T. H. Elastin as a Biomaterial for Tissue Engineering. Biomaterials 2007, 28, 4378–4398. 10.1016/j.biomaterials.2007.06.025. [DOI] [PubMed] [Google Scholar]
- Massodi I.; Bidwell G. L.; Raucher D. Evaulation of Cell Penetrating Peptides Fused to Elastin-like Polypeptide for Drug Delivery. J. Controlled Release 2005, 108, 396–408. 10.1016/j.jconrel.2005.08.007. [DOI] [PubMed] [Google Scholar]
- Schmaljohann D. Thermo- and pH-responsive Polymers in Drug Delivery. Adv. Drug Delivery Rev. 2006, 58, 1655–1670. 10.1016/j.addr.2006.09.020. [DOI] [PubMed] [Google Scholar]
- Khaled M. A.; Urry D. W. Nuclear Overhauser Enhancement Demonstration of the Type II β-Turn in Repeat Peptides of Tropoelastin. Biochem. Biophys. Res. Commun. 1976, 70, 485–491. 10.1016/0006-291X(76)91072-X. [DOI] [PubMed] [Google Scholar]
- Venkatachalam C. M.; Urry D. W. Development of a Linear Helical Conformation from Its Cyclic Correlate. β-Spiral Model of the Elastin Poly(pentapeptide) (VPGVG)n. Macromolecules 1981, 14, 1225–1229. 10.1021/ma50006a017. [DOI] [Google Scholar]
- Urry D. W. Entropic Elastic Processes in Protein Mechanisms. I. Elastic Structure Due to an Inverse Temperature Transition and Elasticity Due to Internal Chain Dynamics. J. Protein Chem. 1988, 7, 1–34. 10.1007/BF01025411. [DOI] [PubMed] [Google Scholar]
- Li B.; Alonso D. O. V.; Daggett V. The Molecular Basis for the Inverse Temperature Transition of Elastin. J. Mol. Biol. 2001, 305, 581–592. 10.1006/jmbi.2000.4306. [DOI] [PubMed] [Google Scholar]
- Krukau A.; Brovchenko I.; Geiger A. Temperature-induced Conformational Transition of a Model Elastin-like Peptide GVG(VPGVG)3 in Water. Biomacromolecules 2007, 8, 2196–2202. 10.1021/bm070233j. [DOI] [PubMed] [Google Scholar]
- Nicolini C.; Ravindra R.; Ludolph B.; Winter R. Characterization of the Temperature- and Pressure-induced Inverse and Reentrant Transition of the Minimum Elastin-like Polypeptide GVG(VPGVG) by DSC, PPC, CD, and FT-IR Spectroscopy. Biophys. J. 2004, 86, 1385–1392. 10.1016/S0006-3495(04)74209-5. [DOI] [PMC free article] [PubMed] [Google Scholar]
- Serrano V.; Liu W.; Franzen S. An Infrared Spectroscopic Study of the Conformational Transition of Elastin-like Polypeptides. Biophys. J. 2007, 93, 2429–2435. 10.1529/biophysj.106.100594. [DOI] [PMC free article] [PubMed] [Google Scholar]
- Cho Y.; Sagle L. B.; Iimura S.; Zhang Y.; Kherb J.; Chilkoti A.; Scholtz J. M.; Cremer P. S. Hydrogen Bonding of β-Turn Structure Is Stabilized in D2o. J. Am. Chem. Soc. 2009, 131, 15188–15193. 10.1021/ja9040785. [DOI] [PMC free article] [PubMed] [Google Scholar]
- Ahmed Z.; Scaffidi J. P.; Asher S. A. Circular Dichroism and UV-resonance Raman Investigation of the Temperature Dependence of the Conformations of Linear and Cyclic Elastin. Biopolymers 2009, 91, 52–60. 10.1002/bip.21081. [DOI] [PMC free article] [PubMed] [Google Scholar]
- Thomas G. J. Jr.; Prescott B.; Urry D. W. Raman Amide Bands of Type-II β-Turns in Cyclo-(VPGVG)3 and Poly-(VPGVG), and Implications for Protein Secondary-structure Analysis. Biopolymers 1987, 26, 921–934. 10.1002/bip.360260611. [DOI] [PubMed] [Google Scholar]
- Kurková D.; Kríz J.; Schmidt P.; Dybal J.; Rodríguez-Cabello J. C.; Alonso M. Structure and Dynamics of Two Elastin-like Polypentapeptides Studied by NMR Spectroscopy. Biomacromolecules 2003, 4, 589–601. 10.1021/bm025618a. [DOI] [PubMed] [Google Scholar]
- Glaves R.; Baer M.; Schreiner E.; Stoll R.; Marx D. Conformational Dynamics of Minimal Elastin-Like Polypeptides: The Role of Proline Revealed by Molecular Dynamics and Nuclear Magnetic Resonance. ChemPhysChem 2008, 9, 2759–2765. 10.1002/cphc.200800474. [DOI] [PubMed] [Google Scholar]
- Nuhn H.; Klok H. A. Secondary Structure Formation and LCST Behavior of Short Elastin-like Peptides. Biomacromolecules 2008, 9, 2755–2763. 10.1021/bm800784y. [DOI] [PubMed] [Google Scholar]
- Rousseau R.; Schreiner E.; Kohlmeyer A.; Marx D. Temperature-dependent Conformational Transitions and Hydrogen-bond Dynamics of the Elastin-like Octapeptide GVG(VPGVG): A Molecular-Dynamics Study. Biophys. J. 2004, 86, 1393–1407. 10.1016/S0006-3495(04)74210-1. [DOI] [PMC free article] [PubMed] [Google Scholar]
- Lessing J.; Roy S.; Reppert M.; Baer M.; Marx D.; Jansen T. L. C.; Knoester J.; Tokmakoff A. Identifying Residual Structure in Intrinsically Disordered Systems: A 2D IR Spectroscopic Study of the GVGXPGVG Peptide. J. Am. Chem. Soc. 2012, 134, 5032–5035. 10.1021/ja2114135. [DOI] [PubMed] [Google Scholar]
- Reppert M.; Roy A. R.; Tempkin J. O. B.; Dinner A. R.; Tokmakoff A. Refining Disordered Peptide Ensembles with Computational Amide I Spectroscopy: Application to Elastin-like Peptides. J. Phys. Chem. B 2016, 11395–11404. 10.1021/acs.jpcb.6b08678. [DOI] [PMC free article] [PubMed] [Google Scholar]
- Buck M. Trifluoroethanol and Colleagues: Cosolvents Come of Age. Recent Studies with Peptides and Proteins. Q. Rev. Biophys. 1998, 31, 297–355. 10.1017/S003358359800345X. [DOI] [PubMed] [Google Scholar]
- Roccatano D.; Colombo G.; Fioroni M.; Mark A. E. Mechanism by Which 2,2,2-Trifluoroethanol/Water Mixtures Stabilize Secondary-structure Formation in Peptides: A Molecular Dynamics Study. Proc. Natl. Acad. Sci. U.S.A. 2002, 99, 12179–12184. 10.1073/pnas.182199699. [DOI] [PMC free article] [PubMed] [Google Scholar]
- Roy S.; Lessing J.; Meisl G.; Ganim Z.; Tokmakoff A.; Knoester J.; Jansen T. L. C. Solvent and Conformation Dependence of Amide I Vibrations in Peptides and Proteins Containing Proline. J. Chem. Phys. 2011, 135, 234507 10.1063/1.3665417. [DOI] [PubMed] [Google Scholar]
- Barth A. Infrared Spectroscopy of Proteins. Biochim. Biophys. Acta 2007, 1767, 1073–1101. 10.1016/j.bbabio.2007.06.004. [DOI] [PubMed] [Google Scholar]
- Teeuwen R. L. M.; Zuilhof H.; de Wolf F. A.; van Hest J. C. M. Temperature-controlled Positioning of Fusion Proteins in Microreactors. Soft Matter 2009, 5, 2261–2268. 10.1039/b903087e. [DOI] [Google Scholar]
- van Eldijk M. B.; Smits F. C. M.; Vermue N.; Debets M. F.; Schoffelen S.; van Hest J. C. M. Synthesis and Self-assembly of Well-sefined Elastin-like Polypeptide-poly(ethyleneglycol) Conjugates. Biomacromolecules 2014, 15, 2751–2759. 10.1021/bm5006195. [DOI] [PubMed] [Google Scholar]
- Meyer D. E.; Chilkoti A. Purification of Recombinant Proteins by Fusion with Thermally-responsive Polypeptides. Nat. Biotechnol. 1999, 17, 1112–1115. 10.1038/15100. [DOI] [PubMed] [Google Scholar]
- Andrushchenko V. V.; Vogel H. J.; Prenner E. J. Optimization of the Hydrochloric Acid Concentration Used for Trifluoroacetate Removal from Synthetic Peptides. J. Pept. Sci. 2007, 13, 37–43. 10.1002/psc.793. [DOI] [PubMed] [Google Scholar]
- Helbing J.; Hamm P. Compact Implementation of Fourier Transform Two-dimensional IR Spectroscopy without Phase Ambiguity. J. Opt. Soc. Am. B 2011, 28, 171–178. 10.1364/JOSAB.28.000171. [DOI] [Google Scholar]
- Bloem R.; Garrett-Roe S.; Strzalka H.; Hamm P.; Donaldson P. Enhancing Signal Detection and Completely Eliminating Scattering Using Quasi-phase-cycling in 2D IR Experiments. Opt. Express 2010, 18, 27067–27078. 10.1364/OE.18.027067. [DOI] [PubMed] [Google Scholar]
- Hanwell M. D.; Curtis D. E.; Lonie D. C.; Vandermeersch T.; Zurek E.; Hutchison G. R. Avogadro: An Advanced Semantic Chemical Editor, Visualization, and Analysis Platform. J. Cheminf. 2012, 4, 17. 10.1186/1758-2946-4-17. [DOI] [PMC free article] [PubMed] [Google Scholar]
- Jorgensen W. L.; Tirado-Rives J. Potential Energy Functions for Atomic-level Simulations of Water and Organic and Biomolecular Systems. Proc. Natl. Acad. Sci. U.S.A. 2005, 102, 6665–6670. 10.1073/pnas.0408037102. [DOI] [PMC free article] [PubMed] [Google Scholar]
- Van der Spoel D.; Lindahl E.; Hess B.; Groenhof G.; Mark A. E.; Berendsen H. J. C. Gromacs: Fast, Flexible, and Free. J. Comput. Chem. 2005, 26, 1701–1718. 10.1002/jcc.20291. [DOI] [PubMed] [Google Scholar]
- Parrinello M.; Rahman A. Polymorphic Transitions in Single Crystals: A New Molecular Dynamics Method. J. Appl. Phys. 1981, 52, 7182–7190. 10.1063/1.328693. [DOI] [Google Scholar]
- Bussi G.; Donadio D.; Parrinello M. Canonical Sampling through Velocity Rescaling. J. Chem. Phys. 2007, 126, 014101 10.1063/1.2408420. [DOI] [PubMed] [Google Scholar]
- Brooks C. L. Computer Simulation of Liquids. J. Solution Chem. 1989, 18, 99. 10.1007/BF00646086. [DOI] [Google Scholar]
- Darden T.; York D.; Pedersen L. Particle Mesh Ewald: An N·Log(n) Method for Ewald Sums in Large Systems. J. Chem. Phys. 1993, 98, 10089–10092. 10.1063/1.464397. [DOI] [Google Scholar]
- Jansen T. L. C.; Knoester J. A Transferable Electrostatic Map for Solvation Effects on Amide I Vibrations and Its Application to Linear and Two-dimensional Spectroscopy. J. Chem. Phys. 2006, 124, 044502 10.1063/1.2148409. [DOI] [PubMed] [Google Scholar]
- Jansen T. L. C.; Dijkstra A. G.; Watson T. M.; Hirst J. D.; Knoester J. Erratum: “Modeling the Amide I Bands of Small Peptides” [J. Chem. Phys.125, 044312 (2006)]. J. Chem. Phys. 2012, 136, 209901 10.1063/1.4722584. [DOI] [PubMed] [Google Scholar]
- Torii H.; Tasumi M. Ab Initio Molecular Orbital Study of the Amide I Vibrational Interactions between the Peptide Groups in Di- and Tripeptides and Considerations on the Conformation of the Extended Helix. J. Raman Spectrosc. 1998, 29, 81–86. . [DOI] [Google Scholar]
- Jansen T. L. C.; Knoester J. Nonadiabatic Effects in the Two-dimensional Infrared Spectra of Peptides: Application to Alanine Dipeptide. J. Phys. Chem. B 2006, 110, 22910–22916. 10.1021/jp064795t. [DOI] [PubMed] [Google Scholar]
- Liang C.; Jansen T. L. C. An Efficient N3-scaling Propagation Scheme for Simulating Two-dimensional Infrared and Visible Spectra. J. Chem. Theory Comput. 2012, 8, 1706–1713. 10.1021/ct300045c. [DOI] [PubMed] [Google Scholar]
- Cunha A. V.; Bondarenko A. S.; Jansen T. L. C. Assessing Spectral Simulation Protocols for the Amide I Band of Proteins. J. Chem. Theory Comput. 2016, 12, 3982–3992. 10.1021/acs.jctc.6b00420. [DOI] [PubMed] [Google Scholar]
- Lotze S.; Olijve L. L. C.; Voets I. K.; Bakker H. J. Observation of Vibrational Energy Exchange in a Type-III Antifreeze Protein. J. Phys. Chem. B 2014, 118, 8962–8971. 10.1021/jp503481e. [DOI] [PubMed] [Google Scholar]
- Piatkowski L.; Bakker H. J. Vibrational Dynamics of the Bending Mode of Water Interacting with Ions. J. Chem. Phys. 2011, 135, 214509 10.1063/1.3664866. [DOI] [PubMed] [Google Scholar]
- Rezus Y. L. A.; Bakker H. J. On the Orientational Relaxation of HDO in Liquid Water. J. Chem. Phys. 2005, 123, 114502 10.1063/1.2009729. [DOI] [PubMed] [Google Scholar]
- Guo Q.; Pagano P.; Li Y.-L.; Kohen A.; Cheatum C. M. Line Shape Analysis of Two-dimensional Infrared Spectra. J. Chem. Phys. 2015, 142, 212427 10.1063/1.4918350. [DOI] [PMC free article] [PubMed] [Google Scholar]
- Roy S.; Jansen T. L. C.; Knoester J. Structural Classification of the Amide I Sites of a Beta-hairpin with Isotope Label 2DIR Spectroscopy. Phys. Chem. Chem. Phys. 2010, 12, 9347–9357. 10.1039/b925645h. [DOI] [PubMed] [Google Scholar]
- Kim Y. S.; Liu L.; Axelsen P. H.; Hochstrasser R. M. 2D IR Provides Evidence for Mobile Water Molecules in β-Amyloid Fibrils. Proc. Natl. Acad. Sci. U.S.A. 2009, 106, 17751–17756. 10.1073/pnas.0909888106. [DOI] [PMC free article] [PubMed] [Google Scholar]
- Vass E.; Kurz M.; Konat R. K.; Hollósi M. FTIR and CD Spectroscopic Studies on Cyclic Penta- and Hexa-peptides. Detailed Examination of Hydrogen Bonding in β- and γ-Turns Determined by NMR. Spectrochim. Spectrochim. Acta, Part A 1998, 54, 773–786. 10.1016/S1386-1425(98)00028-6. [DOI] [Google Scholar]
- Ohnishi S.; Koide A.; Koide S. Solution Conformation and Amyloid-like Fibril Formation of a Polar Peptide Derived from a β-Hairpin in the OspA Single-layer β-Sheet. J. Mol. Biol. 2000, 301, 477–489. 10.1006/jmbi.2000.3980. [DOI] [PubMed] [Google Scholar]
- Ramírez-Alvarado M.; Serrano L.; Blanco F. J. Conformational Analysis of Peptides Corresponding to All the Secondary Structure Elements of Protein L B1 Domain: Secondary Structure Propensities Are Not Conserved in Proteins with the Same Fold. Protein Sci. 1997, 6, 162–174. 10.1002/pro.5560060119. [DOI] [PMC free article] [PubMed] [Google Scholar]
- Jackson M.; Mantsch H. H. The Use and Misuse of FTIR Spectroscopy in the Determination of Protein Structure. Crit. Rev. Biochem. Mol. Biol. 1995, 30, 95–120. 10.3109/10409239509085140. [DOI] [PubMed] [Google Scholar]
- Demmel F.; Doster W.; Petry W.; Schulte A. Vibrational Frequency Shifts As a Probe of Hydrogen Bonds: Thermal Expansion and Glass Transition of Myoglobin in Mixed Solvents. Eur. Biophys. J. 1997, 26, 327–335. 10.1007/s002490050087. [DOI] [PubMed] [Google Scholar]
- Jansen T. L. C.; Knoester J. Two-dimensional Infrared Population Transfer Spectroscopy for Enhancing Structural Markers of Proteins. Biophys. J. 2008, 94, 1818–1825. 10.1529/biophysj.107.118851. [DOI] [PMC free article] [PubMed] [Google Scholar]
- Cunha A. V.; Salamatova E.; Bloem R.; Roeters S. J.; Woutersen S.; Pshenichnikov M. S.; Jansen T. L. C. Interplay between Hydrogen Bonding and Vibrational Coupling in Liquid N-Methylacetamide. J. Phys. Chem. Lett. 2017, 8, 2438–2444. 10.1021/acs.jpclett.7b00731. [DOI] [PMC free article] [PubMed] [Google Scholar]
- Bakker H. J.; Planken P. C. M.; Lagendijk A. Role of Solvent on Vibrational Energy Transfer in Solution. Nature 1990, 347, 745–747. 10.1038/347745a0. [DOI] [Google Scholar]
- Kenkre V. M.; Tokmakoff A.; Fayer M. D. Theory of Vibrational Relaxation of Polyatomic Molecules in Liquids. J. Chem. Phys. 1994, 101, 10618–10629. 10.1063/1.467876. [DOI] [Google Scholar]
- Woutersen S.; Mu Y.; Stock G.; Hamm P. Subpicosecond Conformational Dynamics of Small Peptides Probed by Two-dimensional Vibrational Spectroscopy. Proc. Natl. Acad. Sci. U.S.A. 2001, 98, 11254–11258. 10.1073/pnas.201169498. [DOI] [PMC free article] [PubMed] [Google Scholar]
- Fioroni M.; Diaz M. D.; Burger K.; Berger S. Solvation Phenomena of a Tetrapeptide in Water/Trifluoroethanol and Water/Ethanol Mixtures: A Diffusion NMR, Intermolecular NOE, and Molecular Dynamics Study. J. Am. Chem. Soc. 2002, 124, 7737–7744. 10.1021/ja0259335. [DOI] [PubMed] [Google Scholar]
- Yang A.-S.; Hitz B.; Honig B. Free Energy Determinants of Secondary Structure Formation: III. β-Turns and Their Role in Protein Folding. J. Mol. Biol. 1996, 259, 873–882. 10.1006/jmbi.1996.0364. [DOI] [PubMed] [Google Scholar]
- Hutchinson E. G.; Thornton J. M. A Revised Set of Potentials for β-Turn Formation in Proteins. Protein Sci. 1994, 3, 2207–2216. 10.1002/pro.5560031206. [DOI] [PMC free article] [PubMed] [Google Scholar]
- Li B.; Alonso D. O. V.; Bennion B. J.; Daggett V. Hydrophobic Hydration Is an Important Source of Elasticity in Elastin-based Biopolymers. J. Am. Chem. Soc. 2001, 123, 11991–11998. 10.1021/ja010363e. [DOI] [PubMed] [Google Scholar]
- Cook W. J.; Einspahr H.; Trapane T. L.; Urry D. W.; Bugg C. E. Crystal Structure and Conformation of the Cyclic Trimer of a Repeat Pentapeptide of Elastin, Cyclo-(l-valyl-l-prolylglycyl-l-valylglycyl)3. J. Am. Chem. Soc. 1980, 102, 5502–5505. 10.1021/ja00537a014. [DOI] [Google Scholar]
- Yamaoka T.; Tamura T.; Seto Y.; Tada T.; Kunugi S.; Tirrell D. A. Mechanism for the Phase Transition of a Genetically Engineered Elastin Model Peptide (VPGIG)40 in Aqueous Solution. Biomacromolecules 2003, 4, 1680–1685. 10.1021/bm034120l. [DOI] [PubMed] [Google Scholar]
- Urry D. W.; Shaw R. G.; Prasad K. U. Polypentapeptide of Elastin: Temperature Dependence of Ellipticity and Correlation with Elastomeric Force. Biochem. Biophys. Res. Commun. 1985, 130, 50–57. 10.1016/0006-291X(85)90380-8. [DOI] [PubMed] [Google Scholar]
Associated Data
This section collects any data citations, data availability statements, or supplementary materials included in this article.


