

Abstract
Cuprizone intoxication is a common animal model used to test myelin regenerative therapies for the treatment of diseases such as multiple sclerosis. Mice fed this copper chelator develop reversible, region-specific oligodendrocyte loss and demyelination. While the cellular changes influencing the demyelinating process have been explored in this model, there is no consensus about the biochemical mechanisms of toxicity in oligodendrocytes and about whether this damage arises from the chelation of copper in vivo. Here we have identified an oligodendroglial cell line that displays sensitivity to cuprizone toxicity and performed global metabolomic profiling to determine biochemical pathways altered by this treatment. We link these changes with alterations in brain metabolism in mice fed cuprizone for 2 and 6 weeks. We find that cuprizone induces widespread changes in one-carbon and amino acid metabolism as well as alterations in small molecules that are important for energy generation. We used mass spectrometry to examine chemical interactions that are important for copper chelation and toxicity. Our results indicate that cuprizone induces global perturbations in cellular metabolism that may be independent of its copper chelating ability and potentially related to its interactions with pyridoxal 5′-phosphate, a coenzyme essential for amino acid metabolism.
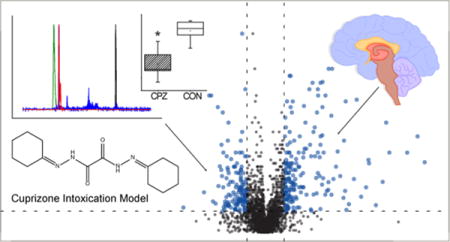
Graphical abstract
The myelination of neuronal axons in the central nervous system (CNS) permits the rapid conduction of nerve impulses and maintains axonal integrity.1 This structure is formed by the spiral wrapping of the oligodendrocyte plasma membrane around axons, and its destruction occurs as part of diseases such as multiple sclerosis.2 Cuprizone (CPZ) intoxication is used to study pathways involved in oligodendrocyte injury and test compounds that can promote remyelination.3 C57BL/6 mice are fed this copper chelator, leading to the development of demyelinating lesions in brain regions such as the corpus callosum and hippocampus.4 The brain pathology that occurs in this model has been extensively studied and is thought to result from both cell-specific toxicity and activation of innate immune effectors. The death of myelinating oligodendrocytes is accompanied by microglial and macrophage activation, astrogliosis, and an increased level of production of inflammatory cytokines.5,6 Knockout experiments have shown the importance of chemokine receptors such as CXCR27 as well as inflammatory cytokines8,9 to the development of demyelination. However, this complicated inflammatory milieu in vivo has made it difficult to identify cell intrinsic pathways that lead to oligodendrocyte injury.
In solution, CPZ is an effective copper chelator, leading to the hypothesis that its toxicity is the result of a disruption in copper homeostasis in the brain. However, measurements of brain copper levels during CPZ intoxication have shown inconsistent results. One study demonstrated that oligomers of CPZ-Cu2+ precipitated in the gut, and this was proposed to result in a widespread deficiency of copper throughout the body, including the brain.10 In contrast, chemical studies of the binding of CPZ to copper showed that upon copper binding, a 2CPZ-Cu3+ species was formed and an extended feeding of low concentrations of CPZ resulted in increased levels of copper in the brain.5 Recently, copper, iron, and manganese levels were measured in the brain after CPZ treatment for 6 weeks. Only a reduction in the level of manganese was observed in this study, providing additional evidence that alterations in copper levels in the brain might not be involved in oligodendrocyte death.11 Several enzymatic targets have been implicated in CPZ-induced toxicity, including monoamine oxidase inhibition,12 alterations in electron transport chain complexes,13 and disruption of copper zinc superoxide dismutase.14 Ultimately, these changes may lead to mitochondrial dysfunction and inhibited energy generation that culminates in oligodendrocyte death.14,15
Because of conflicting reports concerning the mechanisms of CPZ-mediated oligodendrocyte death, we sought to determine whether CPZ intoxication perturbs cellular metabolism by using a systems biology approach. Metabolomics is an emerging technology that detects changes in endogenous small molecules by using liquid chromatography and mass spectrometry (LC–MS). This technology allows for global determination of dysregulation in biochemical pathways that are important for energy generation, myelin synthesis, and cell survival.16–18
In this study, we demonstrate that CPZ can accumulate within cells and leads to cell death in the oligodendroglial cell line, MO3.13. Metabolomic profiling of treated cells and tissue isolated from CPZ-fed mice shows that the compound induces widespread metabolic dysfunction that is region-specific and consistent with the cellular pathology. Additionally, we used mass spectrometry and nuclear magnetic resonance (NMR) to probe the ability of CPZ to interact with copper contained within small molecule mimics of protein copper sites as well as pyridoxal 5′-phosphate (P5P), a vitamin coenzyme essential for amino acid metabolism. Our results indicate that CPZ toxicity in oligodendrocytes may be due to a disruption of the enzymes responsible for amino acid metabolism leading to increased susceptibility to reactive oxygen species and energy depletion.
MATERIALS AND METHODS
Chemicals
High-performance liquid chromatography (HPLC) grade (≥99.9%) acetonitrile, ethanol, isopropanol, methanol, and water used for extractions and LC–MS analysis were purchased from Fisher Scientific (Fair Lawn, NJ). Chloroform (HPLC grade, ≥99.5%) and NP-40 were purchased from Alfa Asear (Ward Hill, MA). Cuprizone (biscyclohexanone oxaldihydrazone), copper(II) sulfate pentahydrate (BioReagent, ≥98%), thiazolyl blue tetrazolium bromide (MTT) (BioReagent, ≥97.5%), P5P (pyridoxal 5′-phosphate hydrate) (Bioreagent, ≥98%), DAPI, goat anti-mouse IgG (H+L) conjugated to FITC (F-2761), and ammonium acetate (HPLC grade) were purchased from Sigma-Aldrich (St. Louis, MO). Anti-CNPase (ab6319) was purchased from Abcam (Cambridge, MA). All cell culture materials, including phosphate-buffered saline (PBS), fetal bovine serum (FBS), Dulbecco’s modified Eagle’s medium (DMEM), and penicillin/streptomycin were purchased from Corning (Manassas, VA). D2O was purchased from Cambridge Isotope Laboratories (Tewksbury, MA).
Cell Culture
The MO3.13 human oligodendrocyte cell line was obtained from CELLutions Biosystems Inc. (Burlington, ON). MO3.13 cells were cultured in DMEM supplemented with 10% FBS and 1% penicillin/streptomycin and grown at 37 °C in 5% CO2 for all experiments.
For metabolomic analyses, cells were seeded in six-well plates at a density of 1.0 × 10⁶ cells/well for 24 h and left to attach. After incubation, the medium was aspirated and replaced with medium containing 1 mM CPZ in a vehicle containing 0.3% ethanol. The cells were incubated with CPZ, and metabolite extraction was performed just prior to the loss of viability at 24 h.
Preparation of the CPZ Solution
The CPZ solution was made fresh by dissolving powder in an amount of ethanol equal to 30% of the final solution volume. After the powder was partially dissolved, ddH2O was used to dilute the solution to the final volume. The solution was then gently heated while being stirred until all of the CPZ dissolved. Afterward, the solution was filtered (22 μm) into its final container. Each batch was used within 2–3 days. The maximal concentration achieved, while fully dissolved, was 10 mM.
Live/Dead Cell Viability Assay and MTT Assay
MO3.13 cells or the rat astrocyte cell line (DI TNC1) was seeded into three separate 96-well plates at a density of 73000 cells/mL. The last row of each plate contained 100 μL of tissue culture medium with no cells to act as a blank control. The cells were left to attach for 24 h followed by treatment with 0.125, 0.25, 0.5, or 1 mM CPZ and 0.3% ethanol in DMEM, or a vehicle of DMEM with 0.3% ethanol. The plates were subsequently incubated for 6, 18, or 24 h. For the live/dead cell viability assay (ThermoFisher, Waltham, MA), an additional row of cells was treated with 500 μM H2O2 for 10 min prior to any measurements, to act as a positive control for dead cells. The live/dead assay standard protocol for a fluorescence microplate was followed, using final concentrations of 2 μM calcein AM and 4 μM EthD-1. The percentage of live cells was calculated as shown:
where F(530)sample is the fluorescence at 530 nm in the experimental cell sample, labeled with both calcein AM and EthD-1, F(530)min is the fluorescence of a sample in which all (or nearly all) cells are alive and labeled with EthD-1 only, and F(530)max is a sample in which all (or nearly all) cells are alive and labeled with calcein AM only.
For the MTT assay, 20 μL of 5 mg/mL MTT was added to each well after the respective time point. Each plate was then incubated for 3.5 h at 37 °C; lysis buffer was added (4 mM HCl and 0.1% NP40 buffer in isopropanol), and the absorbance was read at 590 nm with a 620 nm reference filter by using a Spectramax M2 plate reader (Molecular Devices, Sunnyvale, CA). The percent metabolic activity was calculated using the vehicle control set as 100% metabolic activity.
Immunofluorescence
MO3.13 cells were seeded onto glass coverslips in a six-well plate at a density of 1.0 × 10⁶ cells/well and left to attach for 24 h. After incubation, the medium was aspirated and replaced with DMEM with 0.3% ethanol containing 1 mM CPZ or DMEM with 0.3% ethanol vehicle. After CPZ treatment for 24 h, the medium was removed and the cells were washed with PBS. Cells were fixed in 4% paraformaldehyde for 10 min and then permeabilized by using 1% Tween for 20 min. Cells were then left to block in a 1% BSA/10% FBS mixture for 2 h followed by incubation with anti-CNPase at 10 μg/mL overnight at 4 °C. Detection was performed with a goat anti-mouse IgG (H+L) conjugated to FITC (2 μg/mL). DAPI was used to stain the cell nuclei, and cells were imaged by using a Nikon A1+ confocal microscope.
Cuprizone and CuCPZ Absorbance Assay
MO3.13 cells were first seeded in four six-well plates at a density of 1.0 × 10⁶ cells/well and left to attach for 24 h. After incubation, the medium was aspirated and replaced with DMEM containing either 10 μM CPZ with 0.003% ethanol, 10 μM CPZ and 5 μM CuSO4·5H2O with 0.003% ethanol, 5 μM CuSO4·5H2O, or 0.003% ethanol; 100 μL of the medium was sampled from each plate at 0, 12, 24, 36, and 48 h. After collection of the medium, the absorbance of the complex (CuCPZ) was measured at 600 nm. To measure the levels of copper or CPZ in samples, the opposite constituent was added in excess to first form the CuCPZ complex, followed by the absorbance measurement at 600 nm. After 48 h, the cells were removed via scraping and extracted for SRM-MS analysis.
Mass Spectrometry and Absorbance of CPZ and CPZ-Copper Site Mimics
All CPZ stocks used for direct injection mass spectrometry were prepared with CPZ at the desired concentration in methanol. Samples were analyzed by direct injection with the 5600+ TripleTOF mass spectrometer (Sciex, Framingham, MA) in positive mode. Samples were injected at a flow rate of 10 μL/min. The ion source nebulizer gas was set at 18 psi, the heater gas at 18 psi, and the curtain gas at 20 psi. The ion spray voltage was set to 5000 V, and the declustering potential (DP) was set to 100. The time-of-flight (TOF) scan was performed over the mass range of 50–1000 Da. Fragmentation data were subsequently collected over a range of 20–500 Da with a collision energy (CE) of 25 V.
The stoichiometric ligand binding ratio analysis of CuCPZ with each protein mimic was performed by preparing solutions with differing mole fractions of CPZ, ranging from 0.1 to 1 XCPZ in steps of 0.1 XCPZ, in phosphate buffer (7.4) to keep the pH consistent, at a combined molar concentration of 1 mM. Triplicates of each solution were prepared and incubated for 1 h. All samples were read on a 96-well plate at the respective complex λmax using a Spectramax M2 plate reader. For mass spectrometry analysis of the CPZ and the mimc “B” complex, three solutions with CPZ:B ratios of 1:3, 1:1, and 3:1 were prepared. The solutions were made in 35% acetonitrile at a total molar concentration of 1 mM and left to incubate for 1 h prior to analysis. Each solution was analyzed by direct injection in positive mode on a 5600+ TripleTOF mass spectrometer. Samples were injected at a rate of 10 μL/min over 10 min. The ion source nebulizer gas was set at 18 psi, the heater gas at 18 psi, and the curtain gas at 20 psi. The ion spray voltage was set to 5000 V, and the DP was set to 100. A TOF scan was performed over the mass range of 100–1000 Da.
Cuprizone Treatment of Mice
All animal experiments were approved by the Institutional Animal Care and Use Committee (IACUC) of the Cleveland Clinic. Six-week-old C57BL/6 male mice were purchased from The Jackson Laboratory (Bar Harbor, ME) and used for all experiments. Upon arrival, mice were fed standard chow for 7–10 days. To induce demyelination, mice were fed a diet containing 0.3% cuprizone (biscyclohexanone oxaldihydrazone, Sigma-Aldrich), thoroughly mixed into standard chow and custom-made into pellets by Harlan Teklad (Madison, WI), for 2 or 6 weeks ad libitum. Cuprizone chow was changed twice weekly, and the weights of the mice were monitored on a weekly basis. At the end of the 2 or 6 week demyelination, mice were perfused with phosphate-buffered saline (PBS) and fresh tissue was harvested and placed on dry ice for subsequent analysis.
Metabolomic Analysis
A modified form of the Bligh–Dyer extraction was used for metabolite extraction.19,20 Following cuprizone treatment, MO3.13 cells were lysed by the addition of 180 μL of HPLC grade water with 20 μL of HPLC grade methanol and removed from the tissue culture dishes by gentle scraping. Tissue samples were normalized by weight and suspended in 200 μL of cold HPLC grade methanol. The cell/tissue suspensions were then subjected to three cycles of freezing in liquid nitrogen, thawing, and sonication; 750 μL of a 1:2 (v:v) chloroform/methanol mixture and 125 μL of chloroform were added to each sample. The samples were vortexed, and an additional 250 μL of water was added. Cells were incubated at −20 °C for 1 h and centrifuged at 1000g for 10 min at 4 °C to give a two-phase system: an aqueous layer on top and an organic layer below, with a protein disk interphase. The aqueous and organic phases were separately collected into 1.5 mL tubes. Extracted metabolites were dried in a CentriVap Concentrator (LABCONCO, Kansas, MO) and then stored at −80 °C until analysis could be performed. Protein pellets were used to normalize extracted metabolite quantities based on protein concentration with a bicinchoninic acid (BCA) protein assay (G-Biosciences, St. Louis, MO).21 For metabolomic analysis, the dried polar metabolites were first resuspended in 35% acetonitrile (volume normalized via the BCA assay) and injected at a volume of 6 μL into a Micro200 LC instrument (Eksigent, Redwood, CA) equipped with a hydrophilic interaction liquid chromatography (HILIC) column (Luna 3 μ NH2 100 Å, 150 mm × 1.0 mm, Phenomenex, Torrance, CA). The mobile phases for separation consisted of water (A) and acetonitrile (B), both supplemented with 5 mM ammonium acetate and adjusted to pH 7.3 using ammonium hydroxide. The gradient proceeded at a flow rate of 30 μL/min as follows: 98% B at 0 min, 95% B at 1 min, 80% B at 5 min, 46% B at 6 min, 14.7% B at 13 min, 0% B at 17 min, 100% B at 17.1 min, and 100% B at 23 min. After separation, samples were analyzed on a Sciex 5600+ TripleTOF mass spectrometer. The ion source nebulizer gas was set at 15 psi, the heater gas at 20 psi, and the curtain gas at 25 psi. The samples were collected in positive mode with an ion spray voltage of 5000 V and a DP of 100 V. Samples were processed with Information Dependent Acquisition (IDA), first utilizing a time-of-flight scan of 60–1000 Da with a 250 ms accumulation time and a background threshold of 10 counts/s. Fragmentation data were collected on all selected candidate ions using a collision energy spread (CES) of 25–40 V.
SRM-MS Analysis of CPZ Uptake in Cells
Standards and metabolite extracts from cells were resuspended in methanol and processed using the previously described LC gradient on the Micro200 LC instrument coupled with the 5600+ TripleTOF mass spectrometer. The ion source nebulizer gas and heater gas were set at 18 psi, and the curtain gas was set at 20 psi. The ion spray voltage was set at 5000 V with a DP set at 100. A TOF scan was performed over the mass range of 100–500 Da. A product ion scan of 279.18 was collected over a range of 50–300 Da using a CE of 25 V. The extracted ion chromatogram (XIC) of the m/z 279.18 → m/z 139.09 transition and the MS/MS fragmentation pattern were both used to verify the identity of CPZ. A standard curve based on peak height versus concentration of the CPZ standards was constructed for quantification.
Mass Spectrometry and Absorbance Spectroscopy of P5P and CPZ
All samples for LC–MS analysis were prepared fresh at a final concentration of 100 μM. P5P was prepared in water at a concentration of 100 μM and titrated with NaOH to a pH of 7 for dissolution. CPZ was prepared in ethanol at a concentration of 100 μM. To prepare the P5P/CPZ mixture, P5P was first dissolved in water and titrated with NaOH to pH 7. Stock CPZ in ethanol was then added, achieving final concentrations of 100 μM CPZ and 100 μM P5P in 1% ethanol. Samples were injected in a volume of 6 μL into a Micro200 LC instrument with a HILIC column (Luna 3 μ NH2 100 Å, 150 mm × 1.0 mm, Phenomenex). The mobile phases for separation consisted of water (A) and acetonitrile (B), both containing 5 mM ammonium acetate and adjusted to pH 7.3 using ammonium hydroxide. The gradient (flow rate of 30 μL/min) was as follows: 10% B at 0 min, 10% B at 3 min, 90% B at 23 min, and 90% B at 30 min. The ion source nebulizer gas was set at 18 psi, the heater gas at 18 psi, and the curtain gas at 20 psi. The ion spray voltage was set to 5500 V, and the DP was set to 100. The TOF scan was performed over the mass range of 50–500 Da. Fragmentation data for m/z 348.07 were subsequently collected over a range of 20–500 Da with a CE of 20 V.
For absorbance studies, all samples were prepared as described above and then added to a 96-well plate in a volume of 150 μL with 12 replicates each. The plate was scanned from 300 to 500 nm at 0, 4, 30, 52, 72, and 86 h at 27 °C.
Preparation of a Schiff Base from P5P and Oxalydihydrazide
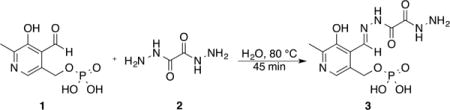
Pyridoxal 5-phosphate 1 (0.2 mmol, 50 mg) was dissolved in distilled water (10 mL) at 80 °C. The resulting solution was added dropwise while being stirred to a 5-fold excess of oxalydihydrazide 2 (1.0 mmol, 118 mg) in water (15 mL) at 80 °C. After complete addition of pyridoxal phosphate, the reaction mixture was stirred for an additional 30 min at 80 °C. The light yellow precipitate was filtered without being cooled, washed with hot water two or three times, dried (0.1 mmol, 45 mg, 65% yield), and identified as Schiff base 3 by NMR (Supporting Information).
Analysis of Transaminase Activity in Cells
MO3.13 cells were seeded in a six-well plate at a density of 3.0 × 10⁵ cells/well and left for 24 h at 37 °C and 5% CO2. All cells were then treated with 1 mM [15N]aspartate. After the addition of 0.3% ethanol containing 1 mM CPZ or 0.3% ethanol as a vehicle, cells were incubated for 4 or 8 h, respectively. The cell metabolites were extracted with the Bligh–Dyer method, and the concentrations of [14N]glutamate and [15N]glutamate were analyzed by mass spectrometry. All the samples were normalized to the sample protein content measured with a BCA assay. The mobile phases for separation consisted of water (A) and acetonitrile (B), both supplemented with 5 mM ammonium acetate and adjusted to pH 7.3 using ammonium hydroxide. A sample volume of 5 μL was eluted with a 45 min gradient: 85% B at 0 min, 85% B at 5 min, 20% B at 35 min, 20% B at 40 min, 85% B at 41 min, and 85% B at 45 min. To detect glutamate and its isotope, ions at m/z 148.06 and 149.06 were selected as the parent ions for [14N]glutamate and [15N]glutamate based on authentic standards, respectively. A DP of 70 V and a CE of 10 V were used to monitor the m/z 148.061 → m/z 130.051 or m/z 149.061 → m/z 131.051 transition.
NMR Analysis of P5P and CPZ
All NMR data were collected at 298 K on an Agilent DD2 750 MHz spectrometer equipped with a HCN cryoprobe. To prepare the sample, P5P was first dissolved in water (no NaOH) and then titrated with 100 mM CPZ in methanol until a concentration of the predicted product (1:1 molar ratio) of 1 mM was reached. This was allowed to sit for 4 h to achieve a reaction. The product solution had a final methanol concentration of 1% and was filtered through a 4 μm nylon syringe filter. Prior to the acquisition of data, D2O was added to a concentration of 8% as the lock solvent. 1H NMR data were collected with 32 transients, 2048 points, and a recycle delay of 25 s.
Shotgun Lipidomics
Lipid samples were obtained from the dried organic phase after the modified Bligh–Dyer extraction. The dried extracts were resuspended in a methanol/chloroform/water solvent [45:45:10 (v:v:v), 5 mM ammonia acetate]. Each sample was injected into the mass spectrometer at a flow rate of 10 μL/min. A MS/MSALL method was employed for the lipid analysis22 using an initial scan range of 200–1200 Da with an accumulation time of 300 ms, followed by 1000 individual MS/MS experiments with a 1.001 Da window width selected via a product ion IDA scan. The parameters were optimized as follows. The ion source nebulizer gas was set at 14 psi, the heater gas at 15 psi, and the curtain gas at 25 psi. The method was repeated twice, once in positive mode and once in negative mode. The DP was set to ±80 V; the CE was set to ±10.0, and the CES was set to ±30.0–50.0 V using positive or negative mode.
Data Processing
Untargeted metabolomics uses an unbiased approach, generating hundreds to thousands of “features” (peaks with a unique m/z ratio and retention time). Features do not necessarily correspond to a characterized metabolite entity. Relevant features must first be selected on the basis of statistical criteria, limiting the baseline noise and aligning peaks.23 Metabolite identification can then be putatively assigned to a peak by using databases like METLIN and HMDB, followed by metabolite validation using the MS/MS data. Initial processing of HILIC–MS data was performed by using MarkerView (version 1.2.1.1).24 Isotopic ion peaks were excluded before analysis. Exploratory statistical analysis of the metabolites was performed using MetaboAnalyst 3.0 (http://www.metaboanalyst.ca),25 limited by P < 0.05 and –log 2 FC ≥ 2. Features were identified by comparing accurate mass and fragmentation data to standards in the METLIN (https://metlin.scripps.edu)26–28 and HMDB (http://www.hmdb.ca/) databases.29 Shotgun lipidomic data were processed using LipidView software (Sciex) with a mass tolerance of 0.05 Da, a minimum percent intensity of 0.1%, and a signal-to-noise ratio of ≥3. Lipids with different chain lengths were indicated by their fragments’ mass to charge ratio. Unpaired t tests on all grouped data sets were performed using GraphPad Prism version 5.00 for Windows (GraphPad Software, San Diego, CA). 1H NMR data were processed and analyzed using ACD/NMR Processor Academic Edition, version 12.01. In silico MS/MS data were collected using CFM-ID version 2.0 (cfmid.wishartlab.com/).
RESULTS AND DISCUSSION
Cellular Uptake and Toxicity of CPZ
To identify cell intrinsic mechanisms of CPZ toxicity, we first developed an in vitro assay of CPZ-mediated death by using the oligodendrocyte cell line, MO3.13. CPZ can impact cell function in a cell-specific manner that is dependent on the developmental stage.30 MO3.13 cells were treated with increasing concentrations of CPZ for 24 h, and viability was measured with a live/dead fluorescence assay. Following treatment, only cells treated for the longest time point and at 1 mM displayed any loss of viability or metabolic activity (Figure 1a–c and Supplemental Figure 1a–c). A rat astrocyte cell line was treated with the same concentrations of CPZ but did not show reduced viability (Supplemental Figure 1d). This indicates that CPZ can disrupt cellular function even in the absence of innate immune cells. The chelation of copper by CPZ in solution results in the formation of a strong peak at 600 nm, and we used this property to confirm the uptake of this compound by cells. We treated MO3.13 cells with CPZ, copper, or the CuCPZ complex and continuously sampled the tissue culture medium for 48 h (Figure 1d). The collected medium was then supplemented with the opposite complex component (copper or CPZ) in excess to form CuCPZ, resulting in the characteristic λmax at 600 nm.5,31 Over time, the levels of both CuCPZ and CPZ were diminished in the tissue culture medium, suggesting that these compounds could penetrate the cell membrane. In contrast, the presence of copper remained nearly constant, consistent with the tight control of its uptake into cells. We subsequently confirmed the presence of CPZ within cells by using mass spectrometry. Cellular extracts were collected after 48 h and analyzed for the presence of unbound CPZ by monitoring the m/z 279.18 → m/z 139.09 product ion transition (Figure 1e). We detected unbound ligand in cells at a concentration of approximately 30 nM (Supplemental Figure 2) after treatment with 10 μM CPZ, indicating its ability to cross the membrane and accumulate in cells. Our data are consistent with a study in which mature rat oligodendrocytes exhibited reduced viability upon being treated with CPZ;30 however, relatively high concentrations of CPZ are required to induce cell death in our system, and this may explain the difficulty in establishing consistent in vitro models of demyelination with this compound.
Figure 1.
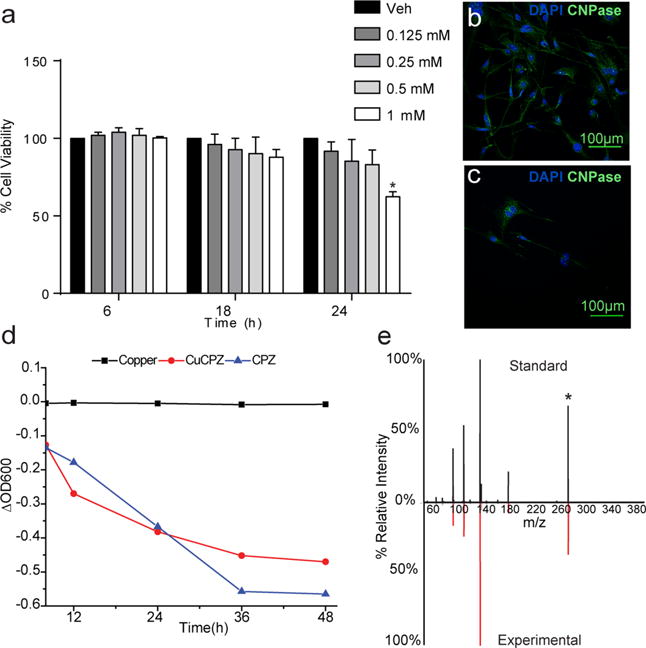
Cellular uptake and toxicity of CPZ in vitro. (a) A live/dead fluorescence assay was used to measure the percentage of live MO3.13 cells treated with increasing concentrations of CPZ at 6, 18, and 24 h. Concentrations ranged from 0 (vehicle) to 1 mM (black to white) (*P < 0.001; n = 24 cultures). Fluorescence microscopy of MO3.13 cells treated with (b) vehicle or (c) 1 mM CPZ and stained with anti-CNPase antibody after treatment for 12 h. (d) Absorbance measurements at 600 nm for MO3.13 cells treated with 10 μM CPZ (squares), 10 μM CPZ and 5 μM CuSO4·5H2O (circles), and 5 μM CuSO4·5H2O (triangles). Tissue culture medium was collected every 12 h (n = 6 cultures for each condition). (e) MS/MS data of unbound CPZ in cells matched to an authentic standard. The m/z 279.18 → m/z 139.09 transition was used to determine the concentration of unbound ligand in cells. An asterisk marks the parent ion.
CPZ Interacts with Copper Protein Analogues
The treatment of cells with CPZ (10 μM) resulted in the presence of approximately 30 nM CPZ in its unbound state, and this low level of uptake could be due to inefficient transport across the plasma membrane or the immediate chelation of copper upon internalization. We sought to test whether CPZ could effectively pull away copper contained within small molecule mimics of protein copper binding sites (Figure 2a). Copper-bound 1,8-dithia-4,11-diazacyclotetradecane (R) is a type 1 copper center mimic, while copper bound 1,4,7-triazacyclononane (B) mimics a copper B center.32,33 Upon incubation of each complex with CPZ, a noticeable shift in absorbance that is unique for the characteristic 600 nm λmax of CuCPZ occurred (Supplemental Figure 3). This shift in color suggests the formation of a new complex as opposed to copper chelation by CPZ. To characterize the binding stoichiometry of CPZ with the small molecule mimics, we utilized Job’s methods (method of continuous variation). In this method, the complex absorbance peak maximum corresponds to the stable mole fraction of ligands bound. While the stoichiometric ligand:metal ratio of CPZ with copper falls at 2:1 (OD600), when combined with either mimic CPZ instead forms a 1:1 binding ratio at the respective shifted absorbance (Figure 2b–d). This provides additional evidence of a stable complex between CPZ and each mimic. To confirm the presence of this complex, we analyzed different molar ratios of CPZ with complex B by using mass spectrometry. With excess CPZ present, the mass spectrum shows that the intact [CPZ + H]+ peak dominates at m/z 279.18 along with the presence of the [CPZ + Na]+ peak at m/z 301.16 (Figure 2e). Alternatively, when the ratio is shifted toward excess B, peaks that correspond to the Cu(I) [B]+ (m/z 192.05) and Cu(II) [B + ClO4]+ (m/z 291.00) forms of the mimics are observed (Figure 2f). These have been previously noted in the characterization of B.32 The spectra for the 1:1 ratio show evidence of two different complex formations made of either the intact CPZ with B, [B + CPZ]+ at m/z 470.23, or monocyclohexane-hydrolyzed CPZ with B, [B + CPZ-R]+ at m/z 390.17 (Figure 2g). These complexes are also found when the stoichiometry is shifted to favor either CPZ or B, although at a lower intensity. Interestingly, the [B + CPZ]+ complex is favored with excess CPZ, while the [B + CPZ-R]+ complex is favored in the presence of excess B (Figure 2f). Our results obtained with the small molecule mimics are similar to those from a previous study showing a weak binding event within the complicated structure of a folded protein.34 These data support the idea that CPZ-mediated toxicity may not arise from a functional depletion of copper from proteins, but perhaps by forming unstable or nonfunctional complexes.
Figure 2.
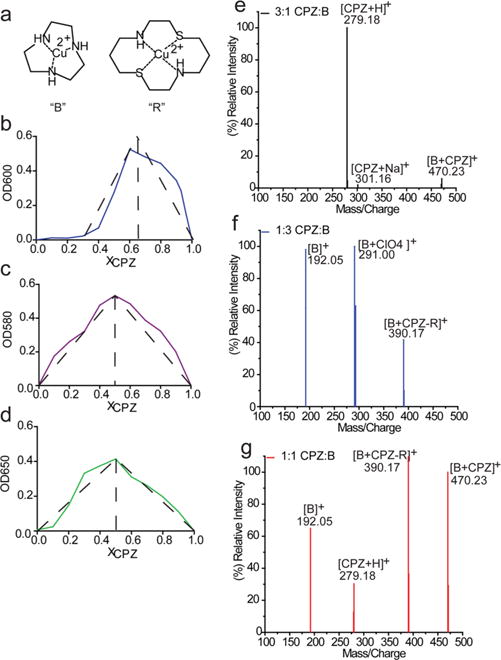
CPZ forms a complex with small copper active site mimics. (a) Structures of both protein active site mimics, abbreviated as R and B. Job plots showing the stoichiometric ligand binding ratio of CPZ with (b) copper, (c) the R mimic, and (d) the B mimic. Solutions were prepared with differing mole fractions of CPZ, ranging from 0.1 to 1 XCPZ in steps of 0.1 XCPZ, to explore CPZ’s binding preference as a ligand in each scenario (repeated in triplicate). Each sample was analyzed at the respective complex λmax (CuCPZ at 600 nm, CPZ and R at 583 nm, and CPZ and B at 627 nm). Direct injection TOF-MS spectra of the CPZ and mimc B complex at (e) 3:1, (f) 1:3, and (g) 1:1 CPZ:B ratios. The solutions were made in 35% acetonitrile at a total molar concentration of 1 mM and left to incubate for 1 h prior to analysis. Two different forms of the proposed complex between B and CPZ are denoted as [B + CPZ]+ and [B + CPZ-R]+, where CPZ-R represents a CPZ with one hydrolyzed cyclohexane ring.
CPZ Induces Metabolic Dysregulation in Vitro and in Vivo
The ability of CPZ to induce cell death in cultured cells indicates that some component of its toxicity is due to the direct disruption of oligodendrocyte function. Therefore, we sought to examine metabolic pathways that are altered by CPZ treatment by using a global metabolomic approach. Cells were treated with 1 mM CPZ or vehicle followed by metabolite extraction and LC–MS analysis. We first identified alterations in cellular pathways that correlated with CPZ toxicity. Pathways that were significantly dysregulated include NAD+ metabolism, cellular antioxidant capacity, ammonia homeostasis, and vitamin B6 metabolism (Figure 3a). Perturbations in energy generation have been suggested to play a role in CPZ toxicity, and megamitochondria are seen after long-term treatment.35–37 In agreement with this, NAD+ metabolism was significantly dysregulated in CPZ-treated cells. NAD+ is formed in cells through two pathways, de novo synthesis using tryptophan and salvage from nicotinamide-containing compounds.38 Levels of tryptophan and 5-hydroxytryptophan are both significantly increased in MO3.13 cells after CPZ treatment, while kynurenine and nicotinamide levels are decreased (Figure 3b–e and Supplemental Figure 4). Recently, it was shown that myelinating oligodendrocytes perform aerobic glycolysis as an energy source, and this requires lactate dehydrogenase activity to regenerate NAD+.39 This metabolic state is associated with Warburg metabolism and also occurs in rapidly proliferating cancer and stem cells.40,41 Myelination also requires an upregulation of NAD+-consuming enzymes, such as sirtuins,42 indicating that the preservation of NAD+ levels is critical for proper myelin maintenance.43 The disruption of the de novo synthesis and salvage pathways to produce NAD+ may lead to a block in glycolysis and energy depletion that would preferentially affect these mature oligodendrocytes. Other metabolic changes include downregulation of reduced glutathione, an antioxidant tripeptide, and one of its precursor amino acids, cysteine (Figure 3f,g). Finally, members of the vitamin B family, choline and pyridoxine, are also significantly downregulated by CPZ treatment (Figure 3h,i).
Figure 3.
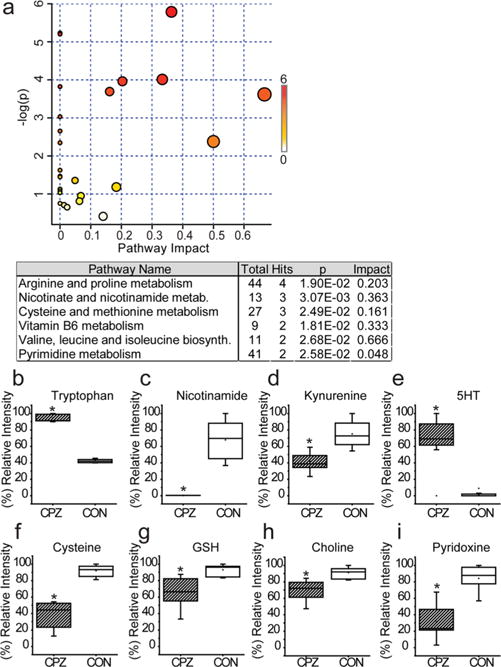
CPZ perturbs the metabolism of MO3.13 cells. (a) Pathway analysis of metabolic changes induced by CPZ treatment of MO3.13 cells as determined by MetaboAnalyst. The overview shows all matched pathways according to P values from pathway enrichment analysis and pathway impact values from pathway topology analysis (varying from yellow to red). The node color is based on the P value, and the node radius is determined on the basis of the pathway impact values. (b–i) Box and whisker plots of significant features (P < 0.05; t test; >2-fold change) identified with both parent ion and fragment ion information compared between the CPZ (n = 10) and control (CON) (n = 10) treated MO3.13 cells (*P < 0.001). 5-HT represents 5-hydroxytryptophan and GSH reduced glutathione.
We sought to extend our in vitro studies by examining metabolites that are altered in tissue samples of the corpus callosum, hippocampus, and spinal cord taken from mice fed a diet of 0.3% CPZ for a total of 2 or 6 weeks. In the mouse model of CPZ demyelination, the corpus callosum suffers a loss of oligodendrocytes by 6 weeks, causing lesion formation, along with demyelination in the hippocampus and cortex.44,45 Interestingly, lesions do not form in the spinal cord after CPZ treatment, but this regional variability remains unexplained.46,47 An examination of the total number of dysregulated features after the two treatment time points shows a pronounced difference in the hippocampus and corpus callosum when compared to the spinal cord, matching the extent of tissue demyelination in these regions (Figure 4a). Furthermore, a comparison of individual metabolites in corpus callosum, hippocampus, and spinal cord shows that metabolic alterations in the spinal cord are the opposite of those detected in the corpus callosum and hippocampus (Figure 4c and Supplemental Figure 5). Similar to our cell data, perturbations in amino acid metabolism were particularly prominent in regions that undergo demyelination at both 2 and 6 weeks (Figure 4b). Significant downregulation of amino acids or related metabolites such as glutamate, homocysteine, and cysteine was seen progressing from 2 to 6 weeks of CPZ treatment in both the corpus callosum and hippocampus, but levels did not change or were upregulated in the spinal cord (Figure 4c). Levels of glutamine and tryptophan were upregulated in the corpus callosum and hippocampus, while levels of these metabolites did not change in the spinal cord. Amino acid perturbations have been documented in a shorter study (CPZ exposure for 4 days) in the plasma of mice,48 and our results are in line with this study. Products of amino acid metabolism also showed dysregulation after CPZ treatment. The level of reduced glutathione was downregulated in the brain but slightly upregulated in spinal cord. Glutathione homeostasis works as an important antioxidant system to protect against reactive oxygen species, and the depletion of reduced glutathione has been implicated in several neurodegenerative diseases.49–51 The maintenance of reduced glutathione pools may facilitate oligodendrocyte protection in the spinal cord. Levels of metabolites associated with one-carbon metabolism such as folate and tetrahydrofolate (THF) are increased in the brain; however, levels of other metabolites that function in this pathway such as S-adenosylmethionine (SAM) and 5-methyl THF are downregulated (Figure 4c). Proteomic investigations have previously linked CPZ effects to the disruption of pathways associated with mitochondrial function and oxidative stress.52,53 Overall, the patterns detected from both cell and tissue investigations reflect a metabolic dysfunction of amino acid metabolism that may lead to a reduction in the number of antioxidant molecules and perturbation of energy-generating pathways. Interestingly, the region-specific vulnerability was recapitulated in the metabolic profiles of the different tissues, as the spinal cord showed the smallest number of significant features that changed upon CPZ treatments detected by LC–MS. Recently, single-cell transcriptomics has been used to identify region-specific heterogeneity in oligodendrocyte populations in the mature CNS.54 Our data suggest that metabolic heterogeneity may also occur in a localized manner and that these distinct populations may display differing functional responses after toxin administration.
Figure 4.
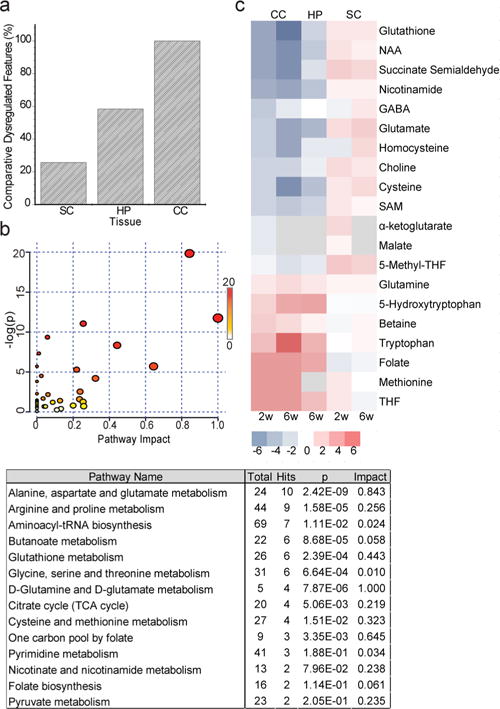
CPZ induces region-specific alterations in metabolism in the central nervous system. Global metabolic profiling of the corpus callosum (CC) and spinal cord (SC) from C57Bl/6 mice after treatment with CPZ for 2 or 6 weeks and hippocampus after CPZ treatment for 6 weeks (n = 10 mice per condition). (a) Percentage of dysregulated metabolic features (P < 0.05; >2-fold change) found in the CC, HP, and SC in CPZ-treated vs control mice. (b) Pathway analysis of metabolic changes induced by cuprizone in the brain. Pathways were constructed on the basis of putatively identified metabolites found dysregulated in both the CC and HP based on information obtained with Metaboanalyst. The node color is based on the P value, and the node radius is determined on the basis of the pathway impact values. (c) Heat map of metabolites changing in the CC, HP, and SC of CPZ-treated vs control mice (P < 0.05). Metabolites were identified with accurate mass and fragmentation information. The generated heat map ranges from a –log 2 fold change of 6 (red) to −6 (blue). Gray represents a metabolite with a matching accurate mass but no confirmative MS/MS data.
CPZ demyelination has been examined extensively through histological analysis; however, global perturbations in lipid homeostasis may also occur in tandem with myelin loss. We also performed lipidomic analysis of tissue isolated from animals fed CPZ for 2 and 6 weeks. These time points represent a pathological continuum characterized by oligodendrocyte dysfunction, but not overt loss (2 weeks) to complete demyelination of corpus callosum (6 weeks).55 After 2 weeks of CPZ feeding, lipid levels in the corpus callosum showed small changes compared to the control, primarily downregulation of ceramides and diacylglycerols. In contrast, levels of spinal cord lipid species, including phosphatidic acid and phosphatidylethanolamine, were upregulated at this early time point (Figure 5a). By 6 weeks, the corpus callosum lipidomic profile showed a reduction in most lipid classes, especially diacylglycerols and ceramides, while the relative levels of spinal cord lipid species were preserved compared to controls (Figure 5b). The loss of both saturated and unsaturated ceramide species occurred after CPZ treatment when compared to controls (Figure 5c). Glycosphingolipids, which consist of a ceramide core, are one of the major components of myelin56 and have been demonstrated to play a role in the functional regulation of oligodendrocyte differentiation.57 Depletion of these species would be expected to impact myelin structure and formation. Interestingly, neutral lipids, especially diacylglycerol species, were depleted after CPZ treatment (Figure 5d). We found that the level of choline was also significantly downregulated in both the hippocampus and corpus callosum (Figure 4c). These changes (DAG and choline) might indicate impaired de novo synthesis of phosphatidylcholine (PC) species. This idea is supported by the ability of exogenous CDP–choline administration to promote remyelination after CPZ feeding.58 Overall, the lipidomic results match well with histologic changes in myelin observed in affected brain regions.
Figure 5.
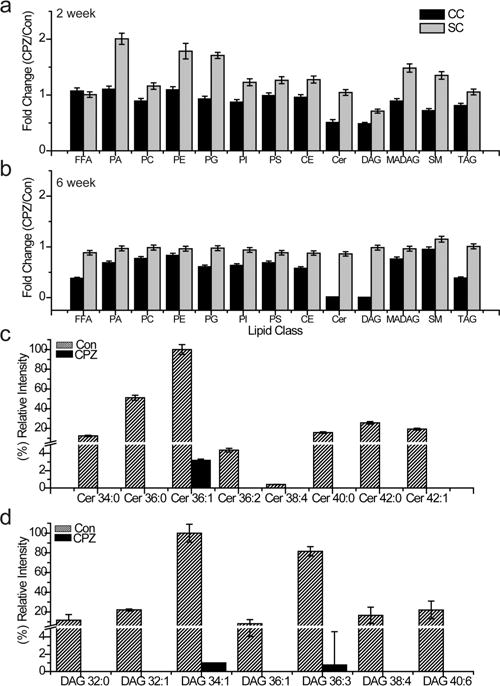
CPZ perturbs lipid homeostasis in the corpus callosum but not the spinal cord. Shotgun lipidomics was performed on CNS tissue from CPZ-treated and control mice. Lipid profiles are expressed as the fold change ratio of the extracted corpus callosum (black) or the spinal cord (gray), using the peak intensity fold change of CPZ-treated samples to vehicle-treated samples. A ratio of 1 represents no change between the CPZ and the control sample group. Ten mice were analyzed for each condition at either (a) 2 or (b) 6 weeks. Relative intensity of (c) ceramide and (d) DAG lipids detected in the corpus callosum by shotgun lipidomics. The relative intensity for each lipid species for control tissue (diagonally filled) and CPZ-treated tissue (black) is the average of 10 mice per group. All ceramide and DAG lipid changes have a P of <0.001.
CPZ Binds Pyridoxal 5′-Phosphate, Perturbing Ami-notransferase Activity
Our metabolomic results indicate that amino acid metabolism is a major target of CPZ in the CNS. Enzymes that utilize amino acids as substrates often use the active form of vitamin B6, P5P. P5P-containing enzymes act largely as aminotransferases but also play roles in neurotransmitter synthesis, the conversion of tryptophan to nicotinic acid, transulfuration, glycogenolysis, and sphingosine biosynthesis.59 Metabolites in these pathways were dysregulated early and late after CPZ feeding (Figure 4c), and the level of a derivative of P5P, pyridoxine, was downregulated in CPZ-treated oligodendrocytes (Figure 3i). The coenzyme P5P is also known to interact with hydrazine derivatives;60,61 thus, we explored potential chemical interactions between CPZ and P5P as well as its possible downstream impact on aminotransferase activity in oligodendrocytes.
Addition of CPZ to P5P causes an immediate shift in the absorbance at 350 nm, as previously reported,34 which is stable for at least 86 h (Figure 6a). A comparison of a solution of P5P and CPZ to that of CPZ, or P5P alone, by LC–MS showed the appearance of a major peak with a retention time of 8.48 min at m/z 348.070 (Figure 6b and Supplemental Figure 6a). A secondary peak was also noted at m/z 428.133. These peaks correspond to a predicted complex involving CPZ hydrolyzed to form oxalylhydrazide bound through a Schiff base to P5P ([CPZ-2R + P5P]+) and a similar complex retaining one cyclohexane ring ([CPZ-1R + P5P]+), respectively. As the [CPZ-2R + P5P]+ species at m/z 348.070 is the main analyte in solution, we sought to validate our proposed structure. We performed in silico MS/MS to predict a fragmentation pattern and subsequently synthesized a [CPZ-2R + P5P]+ standard to verify the structure (Figure 6c and Supplemental Figure 6a). The synthesized structure’s retention time (Supplemental Figure 6b) and fragmentation data provide confirmation of the ability of CPZ to interact with P5P. NMR data also support a positively charged Schiff base linkage between P5P and CPZ (Figure 6d). The resonance of the proton on P5P coupled to the carbon of the Schiff base is shifted dramatically downfield (8.75 ppm) of the aromatic proton (7.75 ppm), suggesting the presence of a positively charged amino group. The chemical shifts of the aromatic proton (7.75 ppm) and Schiff base proton (8.75 ppm) also demonstrate the charged nitrogen in the heterocyclic ring. The same 1H NMR peaks match the synthesized [CPZ-2R + P5P]+ (Supplemental Figure 7).
Figure 6.
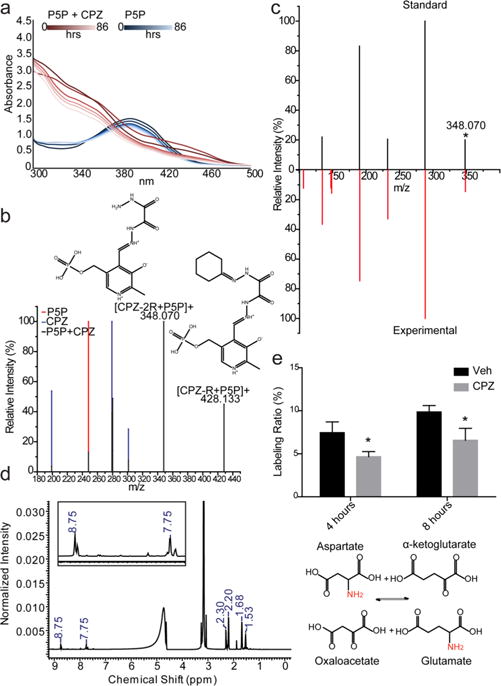
Pyridoxal 5′-phosphate is a potential in vivo target for CPZ. (a) Absorbance spectroscopy of a CPZ/P5P solution (red) compared to a P5P solution (blue). Both solutions were incubated from 0 to 86 h to ensure stability (darker to lighter lines). (b) Solutions of P5P (red), CPZ (blue), and CPZ with P5P (black) were examined via LC–MS. A TOF scan was performed from 50 to 500 Da for each solution. The relative intensity for each analyte is shown. All peaks from the CPZ/P5P solution overlap with known peaks, from either CPZ or P5P, except those at m/z 348.070 and 428.133 (labeled). Each novel peak has the predicted complex annotated above the peak, where CPZ-R represents a CPZ with one hydrolyzed cyclohexane ring and CPZ-2R represents a CPZ with two hydrolyzed cyclohexane rings. (c) MS/MS data for the ion at m/z 348.070 (collision energy of 20 V; the asterisk marks the parent ion) from the CPZ/P5P solution matched to a synthesized standard. (d) 1H NMR data of the CPZ/P5P solution indicating the presence of the Schiff base via the downfield-shifted amino group. Large unlabeled peaks are attributed to sample solvent (methanol and water). (e) Cells were treated for 4 or 8 h with CPZ after being pulsed with [15N]aspartate, and the ratio of [15N]glutamate to unlabeled glutamate was measured for MO3.13 cells treated with either CPZ (gray) or vehicle (black) (*P < 0.001; n = 6 cultures, representative of duplicate independent experiments) (top). Scheme showing the reaction catalyzed by AST with the stable isotope-labeled nitrogen colored red (bottom).
Having support for the isolated binding of P5P and CPZ, we chose to examine the effect of CPZ on aspartate aminotransferase (AST). AST is a prominent glial aminotransferase, which catalyzes the reversible transamination between aspartate and α-ketoglutarate to form oxaloacetate and glutamate.62 We monitored AST activity in the presence of CPZ by feeding cells [15N]aspartate and examining the production of [15N]-glutamate (Figure 6e). The percentage of labeled [15N]-glutamate was significantly decreased in CPZ-treated cells at both 4 and 6 h compared to vehicle controls, indicating that the rate of transfer of the amino group catalyzed by AST is reduced in the presence of CPZ. Overall, these data support the idea that P5P is an early target of cell intrinsic CPZ toxicity.
CONCLUSIONS
In this study, we have sought to identify oligodendrocyte-specific biochemical toxicity associated with CPZ treatment. We confirm that there is cellular uptake of CPZ into cells and unbound ligand is internalized in vitro. By using analogues of protein copper sites, we found that rather than actively chelating away copper, CPZ forms a complex with these small molecules. Global metabolomic profiling of both CPZ-treated cells and tissues, from 2 and 6 week time points in the CPZ demyelination animal model, indicates a disruption of shared metabolic pathways directly related to amino acid metabolism, including NAD+ generation, glutathione metabolism, the one-carbon metabolism cycle, and lipid synthesis. These changes are region-specific and correlate to areas that develop demyelinating lesions. Additionally, our spectroscopic data indicate that CPZ can bind P5P via Schiff base formation, revealing a capacity for CPZ to disrupt metabolism through perturbation of enzymes that require the coenzyme P5P such as AST. Our results point to region-specific perturbations in amino acid metabolism that potentially represent a unique metabolic vulnerability by oligodendrocytes.
Supplementary Material
Acknowledgments
We thank Randy Arnold, Brigitte Simons, and Paul Baker at Sciex for advice and suggestions during method development.
Funding
This work was supported by the University of Akron, the AB Sciex Young Investigator Award, and Grant 1R15 GM119074−01 (L.P.S.), the Choose Ohio First Bioinformatics program (A.T.), and Renovo Neural (R.A. and S.M.).
ABBREVIATIONS
- CPZ
cuprizone (biscyclohexanone oxaldihydrazone)
- CuCPZ
copper-bound cuprizone
- LC–MS
liquid chromatography–mass spectrometry
- R
copper-bound 1,8-dithia-4,11-diazacyclotetradecane
- B
copper-bound 1,4,7-triazacyclononane
- DAG
diacylglycerol
- PC
phosphatidylcholine
- THF
tetrahydrofolate
- NAD+
reduced nicotinamide adenine dinucleotide
- MTT
3-(4,5-dimethylthiazol-2-yl)-2,5-diphenyltetrazolium bromide
- P5P
pyridoxal 5-phosphate
Footnotes
ORCID
Alexandra Taraboletti: 0000-0002-8779-483X
Supporting Information
The Supporting Information is available free of charge on the ACS Publications website at DOI: 10.1021/acs.biochem.6b01072.
Further data for the CPZ standard curve, small active site mimic absorbance spectrum, and all MS/MS spectra for each identified compound (PDF)
Author Contributions
A.T. and L.P.S. wrote the initial draft of the manuscript, which was later reviewed by all authors. A.T., R.A., H.H., and J.C. performed experiments. T.W. synthesized copper site mimics. E.M. synthesized the [CPZ-2R + P5P]+ standard. L.P.S., T.C.L., D.A.M., R.A., and S.M. supervised the study.
Notes
The authors declare no competing financial interest.
References
- 1.Aggarwal S, Yurlova L, Simons M. Central nervous system myelin: structure, synthesis and assembly. Trends Cell Biol. 2011;21:585–593. doi: 10.1016/j.tcb.2011.06.004. [DOI] [PubMed] [Google Scholar]
- 2.Deshmukh VA, Tardif V, Lyssiotis CA, Green CC, Kerman B, Kim HJ, Padmanabhan K, Swoboda JG, Ahmad I, Kondo T, Gage FH, Theofilopoulos AN, Lawson BR, Schultz PG, Lairson LL. A regenerative approach to the treatment of multiple sclerosis. Nature. 2013;502:327–332. doi: 10.1038/nature12647. [DOI] [PMC free article] [PubMed] [Google Scholar]
- 3.Denic A, Johnson AJ, Bieber AJ, Warrington AE, Rodriguez M, Pirko I. The relevance of animal models in multiple sclerosis research. Pathophysiology. 2011;18:21–29. doi: 10.1016/j.pathophys.2010.04.004. [DOI] [PMC free article] [PubMed] [Google Scholar]
- 4.Schmidt T, Awad H, Slowik A, Beyer C, Kipp M, Clarner T. Regional Heterogeneity of Cuprizone-Induced Demyelination: Topographical Aspects of the Midline of the Corpus Callosum. J Mol Neurosci. 2013;49:80–88. doi: 10.1007/s12031-012-9896-0. [DOI] [PubMed] [Google Scholar]
- 5.Messori L, Casini A, Gabbiani C, Sorace L, Muniz-Miranda M, Zatta P. Unravelling the chemical nature of copper cuprizone. Dalt Trans. 2007:2112–2114. doi: 10.1039/b701896g. [DOI] [PubMed] [Google Scholar]
- 6.Buschmann JP, Berger K, Awad H, Clarner T, Beyer C, Kipp M. Inflammatory response and chemokine expression in the white matter corpus callosum and gray matter cortex region during cuprizone-induced demyelination. J Mol Neurosci. 2012;48:66–76. doi: 10.1007/s12031-012-9773-x. [DOI] [PMC free article] [PubMed] [Google Scholar]
- 7.Liu L, Belkadi A, Darnall L, Hu T, Drescher C, Cotleur AC, Padovani-Claudio D, He T, Choi K, Lane TE, Miller RH, Ransohoff RM. CXCR2-positive neutrophils are essential for cuprizone-induced demyelination: relevance to multiple sclerosis. Nat Neurosci. 2010;13:319–326. doi: 10.1038/nn.2491. [DOI] [PMC free article] [PubMed] [Google Scholar]
- 8.Maña P, Liñares D, Fordham S, Staykova M, Willenborg D. Deleterious role of IFNgamma in a toxic model of central nervous system demyelination. Am J Pathol. 2006;168:1464–1473. doi: 10.2353/ajpath.2006.050799. [DOI] [PMC free article] [PubMed] [Google Scholar]
- 9.Kang Z, Liu L, Spangler R, Spear C, Wang C, Gulen MF, Veenstra M, Ouyang W, Ransohoff RM, Li X. IL-17-induced Act1-mediated signaling is critical for cuprizone-induced demyelination. J Neurosci. 2012;32:8284–8292. doi: 10.1523/JNEUROSCI.0841-12.2012. [DOI] [PMC free article] [PubMed] [Google Scholar]
- 10.Benetti F, Ventura M, Salmini B, Ceola S, Carbonera D, Mammi S, Zitolo A, D’Angelo P, Urso E, Maffia M, Salvato B, Spisni E. Cuprizone neurotoxicity, copper deficiency and neurodegeneration. NeuroToxicology. 2010;31:509–517. doi: 10.1016/j.neuro.2010.05.008. [DOI] [PubMed] [Google Scholar]
- 11.Moldovan N, Al-Ebraheem A, Lobo L, Park R, Farquharson MJ, Bock NA. Altered transition metal homeostasis in the cuprizone model of demyelination. NeuroToxicology. 2015;48:1–8. doi: 10.1016/j.neuro.2015.02.009. [DOI] [PubMed] [Google Scholar]
- 12.Kesterson JW, Carlton WW. Monoamine oxidase inhibition and the activity of other oxidative enzymes in the brains of mice fed cuprizone. Toxicol Appl Pharmacol. 1971;20:386–395. doi: 10.1016/0041-008x(71)90281-x. [DOI] [PubMed] [Google Scholar]
- 13.Acs P, Selak MA, Komoly S, Kalman B. Distribution of oligodendrocyte loss and mitochondrial toxicity in the cuprizone-induced experimental demyelination model. J Neuroimmunol. 2013;262:128–131. doi: 10.1016/j.jneuroim.2013.06.012. [DOI] [PubMed] [Google Scholar]
- 14.De AK, Subramanian M. Effect of cuprizone feeding on hepatic superoxide dismutase and cytochrome oxidase activities in mice. Experientia. 1982;38:784–785. doi: 10.1007/BF01972269. [DOI] [PubMed] [Google Scholar]
- 15.Werner SR, Saha JK, Broderick CL, Zhen EY, Higgs RE, Duffin KL, Smith RC. Proteomic analysis of demyelinated and remyelinating brain tissue following dietary cuprizone administration. J Mol Neurosci. 2010;42:210–225. doi: 10.1007/s12031-010-9354-9. [DOI] [PubMed] [Google Scholar]
- 16.Patti GJ, Yanes O, Siuzdak G. Innovation: Metabolomics: the apogee of the omics trilogy. Nat Rev Mol Cell Biol. 2012;13:263–269. doi: 10.1038/nrm3314. [DOI] [PMC free article] [PubMed] [Google Scholar]
- 17.Blasco H, Corcia P, Pradat PF, Bocca C, Gordon PH, Veyrat-Durebex C, Mavel S, Nadal-Desbarats L, Moreau C, Devos D, Andres CR, Emond P. Metabolomics in Cerebrospinal Fluid of Patients with Amyotrophic Lateral Sclerosis: An Untargeted Approach via High-Resolution Mass Spectrometry. J Proteome Res. 2013;12:3746–3754. doi: 10.1021/pr400376e. [DOI] [PubMed] [Google Scholar]
- 18.Huang H, Taraboletti A, Shriver LP. Dimethyl fumarate modulates antioxidant and lipid metabolism in oligodendrocytes. Redox Biol. 2015;5:169–175. doi: 10.1016/j.redox.2015.04.011. [DOI] [PMC free article] [PubMed] [Google Scholar]
- 19.Bligh EG, Dyer WJ. A Rapid Method of Total Lipid Extraction and Purification. Can J Biochem Physiol. 1959;37:911–917. doi: 10.1139/o59-099. [DOI] [PubMed] [Google Scholar]
- 20.Fei F, Bowdish DM, McCarry BE. Comprehensive and simultaneous coverage of lipid and polar metabolites for endogenous cellular metabolomics using HILIC-TOF-MS. Anal Bioanal Chem. 2014;406:3723–3733. doi: 10.1007/s00216-014-7797-5. [DOI] [PMC free article] [PubMed] [Google Scholar]
- 21.Smith PK, Krohn RI, Hermanson GT, Mallia AK, Gartner FH, Provenzano MD, Fujimoto EK, Goeke NM, Olson BJ, Klenk DC. Measurement of protein using bicinchoninic acid. Anal Biochem. 1985;150:76–85. doi: 10.1016/0003-2697(85)90442-7. [DOI] [PubMed] [Google Scholar]
- 22.Simons B, Kauhanen D, Sylvanne T, Tarasov K, Duchoslav E, Ekroos K. Shotgun Lipidomics by Sequential Precursor Ion Fragmentation on a Hybrid Quadrupole Time-of-Flight Mass Spectrometer. Metabolites. 2012;2:195–213. doi: 10.3390/metabo2010195. [DOI] [PMC free article] [PubMed] [Google Scholar]
- 23.Vinaixa M, Samino S, Saez I, Duran J, Guinovart JJ, Yanes O. A Guideline to Univariate Statistical Analysis for LC/MS-Based Untargeted Metabolomics-Derived Data. Metabolites. 2012;2:775–95. doi: 10.3390/metabo2040775. [DOI] [PMC free article] [PubMed] [Google Scholar]
- 24.MarkerView Software 1.2.1 for Metabolomic and Biomarker Profiling Analysis. SCIEX; Framingham, MA: 2015. [Google Scholar]
- 25.Xia J, Sinelnikov IV, Han B, Wishart DS. MetaboAnalyst 3.0—making metabolomics more meaningful. Nucleic Acids Res. 2015;43:W251–W257. doi: 10.1093/nar/gkv380. [DOI] [PMC free article] [PubMed] [Google Scholar]
- 26.Smith CA, O’Maille G, Want EJ, Qin C, Trauger SA, Brandon TR, Custodio DE, Abagyan R, Siuzdak G. METLIN: a metabolite mass spectral database. Ther Drug Monit. 2005;27:747–751. doi: 10.1097/01.ftd.0000179845.53213.39. [DOI] [PubMed] [Google Scholar]
- 27.Tautenhahn R, Cho K, Uritboonthai W, Zhu Z, Patti GJ, Siuzdak G. An accelerated workflow for untargeted metabolomics using the METLIN database. Nat Biotechnol. 2012;30:826–828. doi: 10.1038/nbt.2348. [DOI] [PMC free article] [PubMed] [Google Scholar]
- 28.Ivanisevic J, Zhu ZJ, Plate L, Tautenhahn R, Chen S, O’Brien PJ, Johnson CH, Marletta MA, Patti GJ, Siuzdak G. Toward ‘Omic Scale Metabolite Profiling: A Dual Separation–Mass Spectrometry Approach for Coverage of Lipid and Central Carbon Metabolism. Anal Chem. 2013;85:6876–6884. doi: 10.1021/ac401140h. [DOI] [PMC free article] [PubMed] [Google Scholar]
- 29.Wishart DS, Jewison T, Guo AC, Wilson M, Knox C, Liu Y, Djoumbou Y, Mandal R, Aziat F, Dong E, Bouatra S, Sinelnikov I, Arndt D, Xia J, Liu P, Yallou F, Bjorndahl T, Perez-Pineiro R, Eisner R, Allen F, Neveu V, Greiner R, Scalbert A. HMDB 3.0–The Human Metabolome Database in 2013. Nucleic Acids Res. 2013;41:D801–D807. doi: 10.1093/nar/gks1065. [DOI] [PMC free article] [PubMed] [Google Scholar]
- 30.Benardais K, Kotsiari A, Skuljec J, Koutsoudaki PN, Gudi V, Singh V, Vulinovic F, Skripuletz T, Stangel M. Cuprizone [bis(cyclohexylidenehydrazide)] is selectively toxic for mature oligodendrocytes. Neurotoxic Res. 2013;24:244–250. doi: 10.1007/s12640-013-9380-9. [DOI] [PubMed] [Google Scholar]
- 31.Nilsson G, Erdtman H, Lindstedt G, Kinell PO. A New Colour Reaction on Copper and Certain Carbonyl Compounds. Acta Chem Scand. 1950;4:205–205. [Google Scholar]
- 32.Walker TL, Mula S, Malasi W, Engle JT, Ziegler CJ, van der Est A, Modarelli J, Taschner MJ. Blue copper protein analogue: synthesis and characterization of copper complexes of the N2 S2 macrocycle 1,8-dithia-4,11-diazacyclotetradecane. Dalt Trans. 2015;44:20200–20206. doi: 10.1039/c5dt03389f. [DOI] [PubMed] [Google Scholar]
- 33.Walker TL, Malasi W, Bhide S, Parker T, Zhang D, Freedman A, Modarelli JM, Engle JT, Ziegler CJ, Custer P, Youngs WJ, Taschner MJ. Synthesis and characterization of 1,8-dithia-4,11-diazacyclotetradecane. Tetrahedron Lett. 2012;53:6548–6551. [Google Scholar]
- 34.LindstrÖM A, Pettersson G. The Mechanism of Inhibition of Pig-Plasma Benzylamine Oxidase by the Copper-Chelating Reagent Cuprizone. Eur J Biochem. 1974;48:229–236. doi: 10.1111/j.1432-1033.1974.tb03760.x. [DOI] [PubMed] [Google Scholar]
- 35.Wakabayashi T, Asano M, Kurono C, Ozawa T. Mechanism of the formation of megamitochondria induced by copper-chelating agents. II. Isolation and some properties of megamitochondria from the cuprizone-treated mouse liver. Pathol Int. 1975;25:39–49. [PubMed] [Google Scholar]
- 36.Flatmark T, Kryvi H, Tangerås A. Induction of megamitochondria by cuprizone (biscyclohexanone oxaldihydrazone). Evidence for an inhibition of the mitochondrial division process. Eur J Cell Biol. 1980;23:141–8. [PubMed] [Google Scholar]
- 37.Petronilli V, Zoratti M. A characterization of cuprizone-induced giant mouse liver mitochondria. J Bioenerg Biomembr. 1990;22:663–677. doi: 10.1007/BF00809070. [DOI] [PubMed] [Google Scholar]
- 38.Belenky P, Bogan KL, Brenner C. NAD+ metabolism in health and disease. Trends Biochem Sci. 2007;32:12–19. doi: 10.1016/j.tibs.2006.11.006. [DOI] [PubMed] [Google Scholar]
- 39.Funfschilling U, Supplie LM, Mahad D, Boretius S, Saab AS, Edgar J, Brinkmann BG, Kassmann CM, Tzvetanova ID, Mobius W, Diaz F, Meijer D, Suter U, Hamprecht B, Sereda MW, Moraes CT, Frahm J, Goebbels S, Nave KA. Glycolytic oligodendrocytes maintain myelin and long-term axonal integrity. Nature. 2012;485:517–521. doi: 10.1038/nature11007. [DOI] [PMC free article] [PubMed] [Google Scholar]
- 40.Weinhouse S, Warburg O, Burk D, Schade AL. On respiratory impairment in cancer cells. Science. 1956;124:267–272. doi: 10.1126/science.124.3215.267. [DOI] [PubMed] [Google Scholar]
- 41.Varum S, Rodrigues AS, Moura MB, Momcilovic O, Easley CA, Ramalho-Santos J, Van Houten B, Schatten G. Energy Metabolism in Human Pluripotent Stem Cells and Their Differentiated Counterparts. PLoS One. 2011;6:e20914. doi: 10.1371/journal.pone.0020914. [DOI] [PMC free article] [PubMed] [Google Scholar]
- 42.Li W, Zhang B, Tang J, Cao Q, Wu Y, Wu C, Guo J, Ling EA, Liang F. Sirtuin 2, a mammalian homolog of yeast silent information regulator-2 longevity regulator, is an oligodendroglial protein that decelerates cell differentiation through deacetylating alpha-tubulin. J Neurosci. 2007;27:2606–2616. doi: 10.1523/JNEUROSCI.4181-06.2007. [DOI] [PMC free article] [PubMed] [Google Scholar]
- 43.Bogan KL, Brenner C. Nicotinic acid, nicotinamide, and nicotinamide riboside: a molecular evaluation of NAD+ precursor vitamins in human nutrition. Annu Rev Nutr. 2008;28:115–130. doi: 10.1146/annurev.nutr.28.061807.155443. [DOI] [PubMed] [Google Scholar]
- 44.Torkildsen Ø, Brunborg LA, Myhr KM, Bø L. The cuprizone model for demyelination. Acta Neurol Scand. 2008;117:72–76. doi: 10.1111/j.1600-0404.2008.01036.x. [DOI] [PubMed] [Google Scholar]
- 45.Kipp M, Clarner T, Dang J, Copray S, Beyer C. The cuprizone animal model: new insights into an old story. Acta Neuropathol. 2009;118:723–736. doi: 10.1007/s00401-009-0591-3. [DOI] [PubMed] [Google Scholar]
- 46.Love S. Cuprizone neurotoxicity in the rat: morphologic observations. J Neurol Sci. 1988;84:223–237. doi: 10.1016/0022-510x(88)90127-x. [DOI] [PubMed] [Google Scholar]
- 47.Herder V, Hansmann F, Stangel M, Skripuletz T, Baumgartner W, Beineke A. Lack of cuprizone-induced demyelination in the murine spinal cord despite oligodendroglial alterations substantiates the concept of site-specific susceptibilities of the central nervous system. Neuropathol Appl Neurobiol. 2011;37:676–684. doi: 10.1111/j.1365-2990.2011.01168.x. [DOI] [PubMed] [Google Scholar]
- 48.Goldberg J, Daniel M, van Heuvel Y, Victor M, Beyer C, Clarner T, Kipp M. Short-Term Cuprizone Feeding Induces Selective Amino Acid Deprivation with Concomitant Activation of an Integrated Stress Response in Oligodendrocytes. Cell Mol Neurobiol. 2013;33:1087–1098. doi: 10.1007/s10571-013-9975-y. [DOI] [PubMed] [Google Scholar]
- 49.Carvalho AN, Lim JL, Nijland PG, Witte ME, Van Horssen J. Glutathione in multiple sclerosis: more than just an antioxidant? Mult Scler. 2014;20:1425–1431. doi: 10.1177/1352458514533400. [DOI] [PubMed] [Google Scholar]
- 50.Johnson WM, Wilson-Delfosse AL, Mieyal JJ. Dysregulation of glutathione homeostasis in neurodegenerative diseases. Nutrients. 2012;4:1399–1440. doi: 10.3390/nu4101399. [DOI] [PMC free article] [PubMed] [Google Scholar]
- 51.Pompella A, Visvikis A, Paolicchi A, De Tata V, Casini AF. The changing faces of glutathione, a cellular protagonist. Biochem Pharmacol. 2003;66:1499–1503. doi: 10.1016/s0006-2952(03)00504-5. [DOI] [PubMed] [Google Scholar]
- 52.Werner SR, Saha JK, Broderick CL, Zhen EY, Higgs RE, Duffin KL, Smith RC. Proteomic analysis of demyelinated and remyelinating brain tissue following dietary cuprizone administration. J Mol Neurosci. 2010;42:210–225. doi: 10.1007/s12031-010-9354-9. [DOI] [PubMed] [Google Scholar]
- 53.Partridge MA, Gopinath S, Myers SJ, Coorssen JR. An initial top-down proteomic analysis of the standard cuprizone mouse model of multiple sclerosis. J Chem Biol. 2016;9:9–18. doi: 10.1007/s12154-015-0138-0. [DOI] [PMC free article] [PubMed] [Google Scholar]
- 54.Marques S, Zeisel A, Codeluppi S, van Bruggen D, Mendanha Falcão A, Xiao L, Li H, Häring M, Hochgerner H, Romanov RA, Gyllborg D, Muñoz-Manchado AB, La Manno G, Lönnerberg P, Floriddia EM, Rezayee F, Ernfors P, Arenas E, Hjerling-Leffler J, Harkany T, Richardson WD, Linnarsson S, Castelo-Branco G. Oligodendrocyte heterogeneity in the mouse juvenile and adult central nervous system. Science. 2016;352:1326–1329. doi: 10.1126/science.aaf6463. [DOI] [PMC free article] [PubMed] [Google Scholar]
- 55.Mason JL, Jones JJ, Taniike M, Morell P, Suzuki K, Matsushima GK. Mature oligodendrocyte apoptosis precedes IGF-1 production and oligodendrocyte progenitor accumulation and differentiation during demyelination/remyelination. J Neurosci Res. 2000;61:251–262. doi: 10.1002/1097-4547(20000801)61:3<251::AID-JNR3>3.0.CO;2-W. [DOI] [PubMed] [Google Scholar]
- 56.Morell P, Quarles RH. Myelin Formation, Structure and Biochemistry. Lippincott-Raven; Philadelphia: 1999. [Google Scholar]
- 57.Bansal R, Winkler S, Bheddah S. Negative regulation of oligodendrocyte differentiation by galactosphingolipids. J Neurosci. 1999;19:7913–7924. doi: 10.1523/JNEUROSCI.19-18-07913.1999. [DOI] [PMC free article] [PubMed] [Google Scholar]
- 58.Skripuletz T, Manzel A, Gropengießer K, Schäfer N, Gudi V, Singh V, Salinas Tejedor L, Jörg S, Hammer A, Voss E, Vulinovic F, Degen D, Wolf R, Lee DH, Pul R, Moharregh-Khiabani D, Baumgärtner W, Gold R, Linker RA, Stangel M. Pivotal role of choline metabolites in remyelination. Brain. 2015;138:398–413. doi: 10.1093/brain/awu358. [DOI] [PubMed] [Google Scholar]
- 59.Percudani R, Peracchi A. A genomic overview of pyridoxal-phosphate-dependent enzymes. EMBO Rep. 2003;4:850–854. doi: 10.1038/sj.embor.embor914. [DOI] [PMC free article] [PubMed] [Google Scholar]
- 60.Echevarría Gorostidi GR, Basagoitía A, Santos Blanco JG, García Blanco F. Kinetic study of the reaction of pyridoxal 5′-phosphate with hydrazine. J Mol Catal A: Chem. 1998;129:173–177. [Google Scholar]
- 61.Echevarría GR, Basagoitia A, Santos JG, García Blanco F. Determination of the rates of formation and hydrolysis of the Schiff bases formed by pyridoxal 5′-phosphate and hydrazinic compounds. J Mol Catal A: Chem. 2000;160:209–215. [Google Scholar]
- 62.Kirsch JF, Eichele G, Ford GC, Vincent MG, Jansonius JN, Gehring H, Christen P. Mechanism of action of aspartate aminotransferase proposed on the basis of its spatial structure. J Mol Biol. 1984;174:497–525. doi: 10.1016/0022-2836(84)90333-4. [DOI] [PubMed] [Google Scholar]
Associated Data
This section collects any data citations, data availability statements, or supplementary materials included in this article.