Transected axons fail to regrow across anatomically complete spinal cord injuries (SCI) in adults. Diverse molecules can partially facilitate or attenuate axon growth during development or after injury1–3, but efficient reversal of this failure remains elusive4. Here, we show that three mechanisms, which are essential for developmental axon growth but are attenuated or lacking in adults, (i) neuron intrinsic growth capacity2,5–9, (ii) growth-supportive substrate10,11 and (iii) chemoattraction12,13, are all individually required and are in combination sufficient to stimulate robust axon regrowth across anatomically complete SCI lesions in adult rodents. We reactivated the growth capacity of mature descending propriospinal neurons with osteopontin, IGF1 and CNTF prior to SCI14,15, induced growth-supportive substrates with FGF2 and EGF, and chemoattracted propriospinal axons with GDNF16,17 delivered via spatially and temporally controlled release from biomaterial depots18,19 placed sequentially after SCI. We show in both mice and rats, that providing these three mechanisms in combination, but not individually, stimulated robust propriospinal axon regrowth through astrocyte scar borders and across non-neural lesion core tissue that was over 100-fold greater than controls. Stimulated, supported and chemoattracted propriospinal axons regrew a full spinal segment beyond lesion centers, passed well into spared neural tissue, formed terminal-like contacts exhibiting synaptic markers, and conveyed a significant return of electrophysiological conduction capacity across lesions. Thus, overcoming the failure of axon regrowth across anatomically complete SCI lesions after maturity required the combined sequential reinstatement of multiple developmentally essential axon-growth facilitating mechanisms. These findings identify a mechanism-based biological repair strategy for complete SCI lesions to deploy with rehabilitation paradigms designed to augment functional recovery of remodeling circuits.
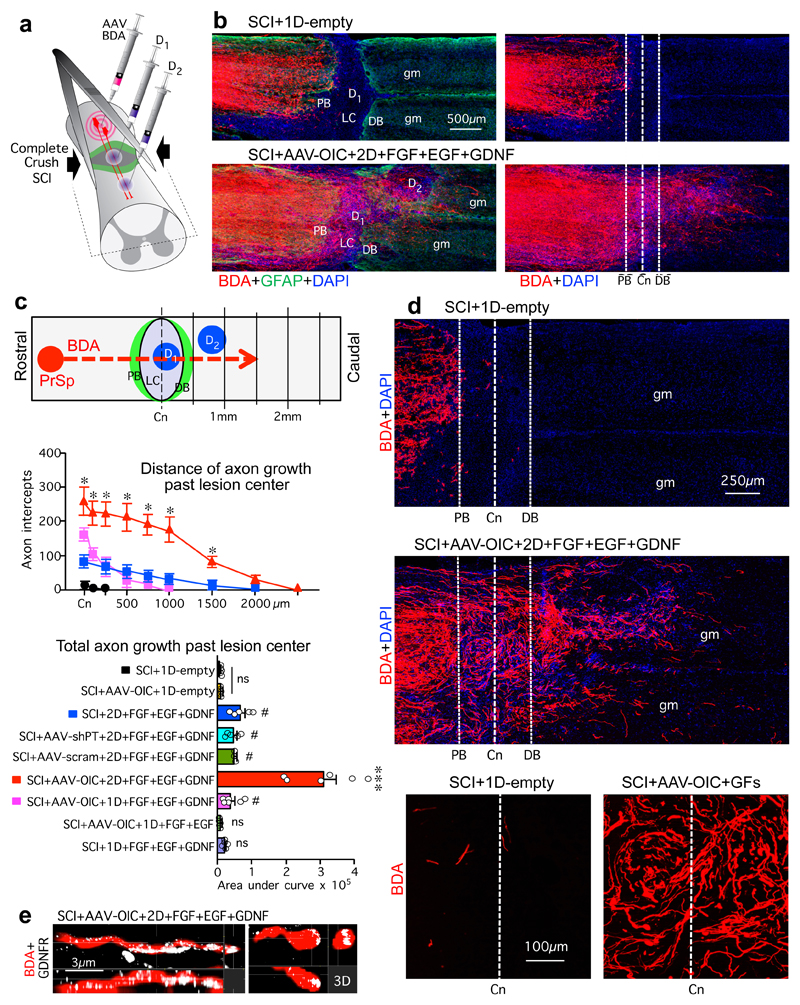
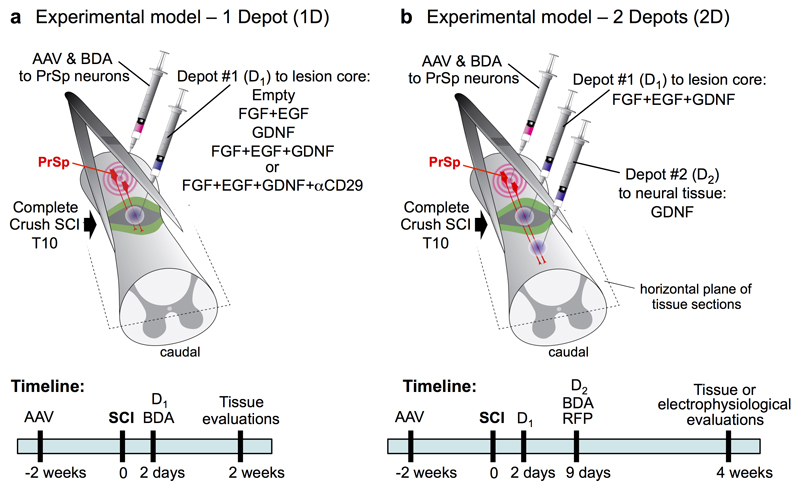
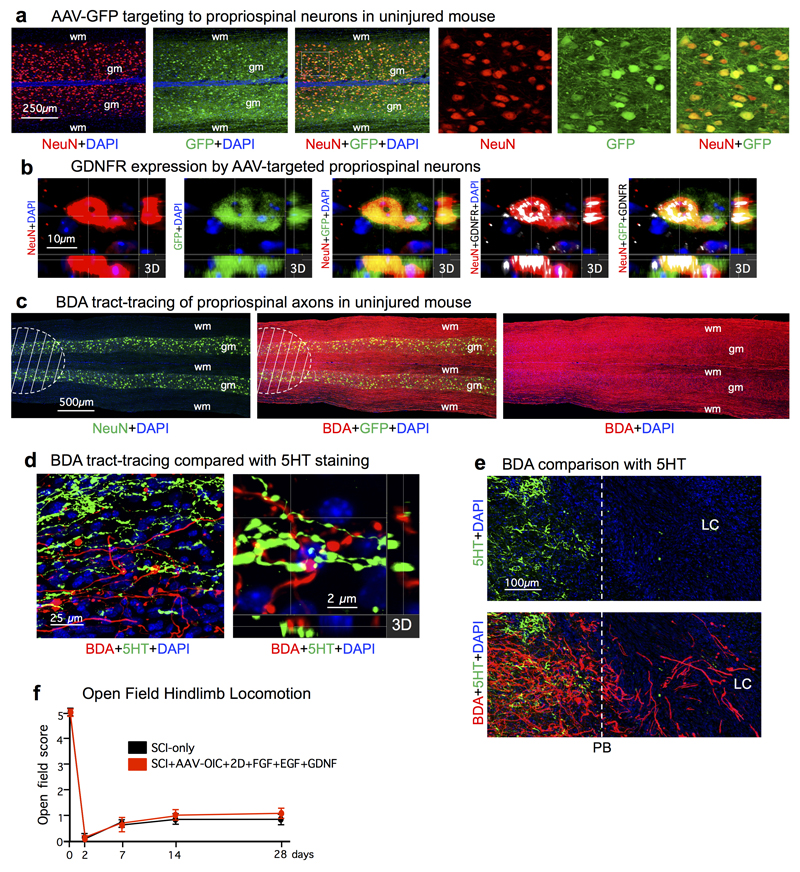
We tested the hypothesis that failure of adult CNS axons to regrow across complete SCI lesions is due to a combined lack of multiple mechanisms required for developmental axon growth. We targeted descending propriospinal neurons because after incomplete SCI they spontaneously form new intraspinal circuits that relay functionally meaningful information past lesions20–22. Thus, short distance regrowth of transected propriospinal axons across complete SCI lesions has the potential to find new neuronal targets and form new relay circuits. To reactivate intrinsic propriospinal neuronal growth capacity, which is attenuated in adult CNS neurons2,5–9, we tested two approaches previously successful with retinal and corticospinal neurons by using adenoassociated viral vectors (AAV) to deliver either PTEN knockdown (AAV-shPT)23, or to express osteopontin, IGF1 and CNTF (AAV-OIC)14,15. To increase axon growth-supportive substrates such as laminin10,11,19,24, we delivered fibroblast growth factor 2 (FGF)25 and epidermal growth factor (EGF)26. To chemoattract12,13 propriospinal axons, we delivered glial-derived growth factor (GDNF) because propriospinal neurons express GDNF receptors (GDNFR), increase GDNFR expression after SCI16 and regrow axons into GDNF-secreting grafts17, and because SCI lesions lack GDNF19. To provide temporally controlled and spatially targeted delivery of growth factors or function-blocking antibodies, we used biomaterial depots of synthetic hydrogels18,19 placed sequentially into SCI lesion centers and into caudal spared neural tissue (Fig. 1a, Extended Data Fig. 1). AAV injected one segment rostral to SCI lesions efficiently targeted propriospinal neurons, including neurons expressing GDNFR (Extended Data Fig. 2a,b). These manipulations were tested alone and in combinations first in adult mice and then in adult rats with severe crush SCI causing anatomically complete lesions across which there is no spontaneous regrowth of descending or ascending axons19.
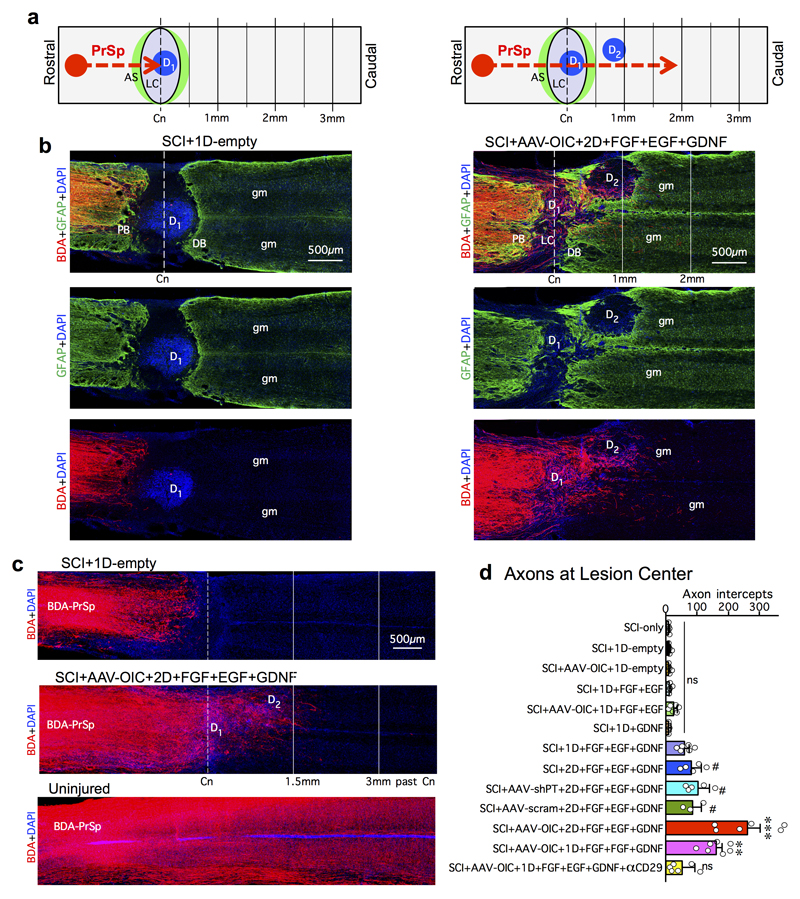
Figure 1. Stimulated and chemoattracted propriospinal (PrSp) axons regrow robustly across anatomically complete SCI lesions in mice receiving combined delivery of AAV-OIC plus FGF+EGF+GDNF in two sequentially placed hydrogel depots.
a, Experimental model. b, BDA-labeled axons in composite tiled scans of horizontal sections also stained for astrocytes (GFAP, left) and cell nuclei (DAPI). Dotted lines demarcate astrocyte proximal (PB) and distal (DB) border around lesion core (LC). Dashed line demarcates lesion center (Cn). D1, D2, hydrogel depot 1 or 2; gm, grey matter. c, Top, schematic of axon intercept. Middle, mean±SEM axon intercepts at specific distances past lesion centers (color coding and n as in graph below). Bottom, mean±SEM areas under axon intercept curves (dots show n mice per group, ns not significant versus SCI+1D-empty, #P <0.01 versus SCI+1D-empty and ns versus each other, *P <0.01 versus all other groups, two-way ANOVA/Bonferroni; ***P <0.0001 versus all other groups, one-way ANOVA/Bonferroni. d, Surveys (top) and details (bottom) of BDA-labeled axons. e, Three-dimension (3D) detail of BDA-labeled axon and growth cone expressing GDNFR in LC.
Propriospinal axon regeneration was quantified as tract-tracer-labeled axons that regrew to lesion centers or beyond (Fig. 1b-d, Extended Data Figs. 2c-e,3,4). Mice with SCI-only or SCI plus empty hydrogel depots exhibited few or no axons at lesion centers. Individual interventions, AAV-shPT or AAV-OIC alone, or depots with FGF+EGF alone or GDNF alone, did not significantly increase this number. Combined delivery of all three growth factors, FGF+EGF+GDNF in one or two depots, but without AAV, led to modest but significantly increased axon regrowth. Combined delivery of AAV-shPT plus FGF+EGF+GDNF did not significantly increase axon numbers compared with FGF+EGF+GDNF alone or AAV-scrambled plus FGF+EGF+GDNF. In striking contrast, combined delivery of AAV-OIC plus FGF+EGF+GDNF synergistically facilitated robust propriospinal axon regrowth. In mice with two sequentially placed depots, this regrowth passed through non-neural lesion cores and their astrocyte scar borders, and penetrated well into spared grey matter (Figs. 1-3, Extended data Figs. 3,4). In these mice, total axon regrowth past lesion centers was over 100-fold greater than SCI-only or SCI plus empty depots (Fig. 1c). Regrowing propriospinal axons expressed detectable GDNFR (Fig. 1e) and followed irregular paths (Fig. 1d) consistent with regrowing, as opposed to spared, axons27. BDA tract-tracer did not label axons of passage, such as serotonin axons (Extended Data Fig. 2d,e). In all cases, no BDA-labeled axons were present at 3mm past lesion centers, confirming that lesions were complete (Fig. 1b-d, Extended Data Figs. 3,4).
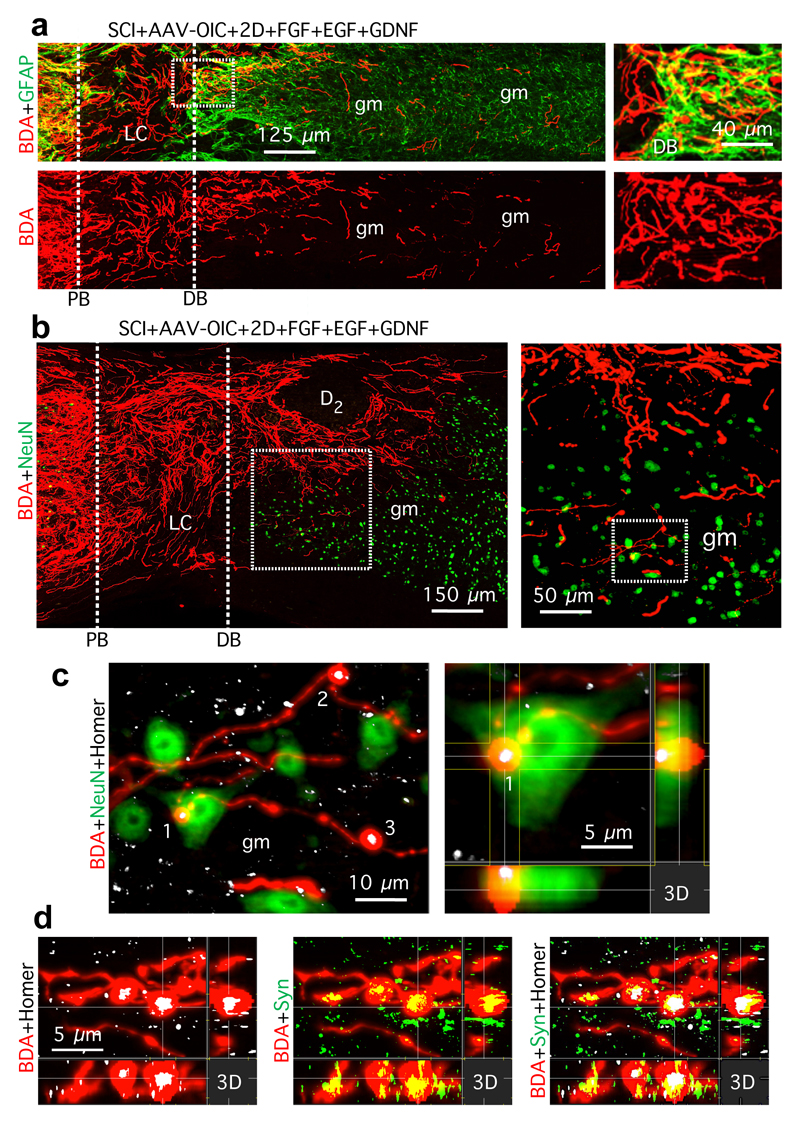
Figure 3. Stimulated and chemoattracted murine propriospinal axons regrow past astrocyte scar distal borders (DB) into grey matter (gm) and form synapse-like contacts with neurons.
a,b, Surveys and details (boxed areas) of BDA-labeled axon regrowth across DB and into gm. c, Detail of b (boxed area) and 3-dimensional (3D) view of synapse-like contact of BDA-labeled terminal with post-synaptic marker, homer, on NeuN-positive neuron. d, Synapse-like BDA-labeled terminals with overlapping pre- and post-synaptic markers, synaptophysin (Syn) and homer.
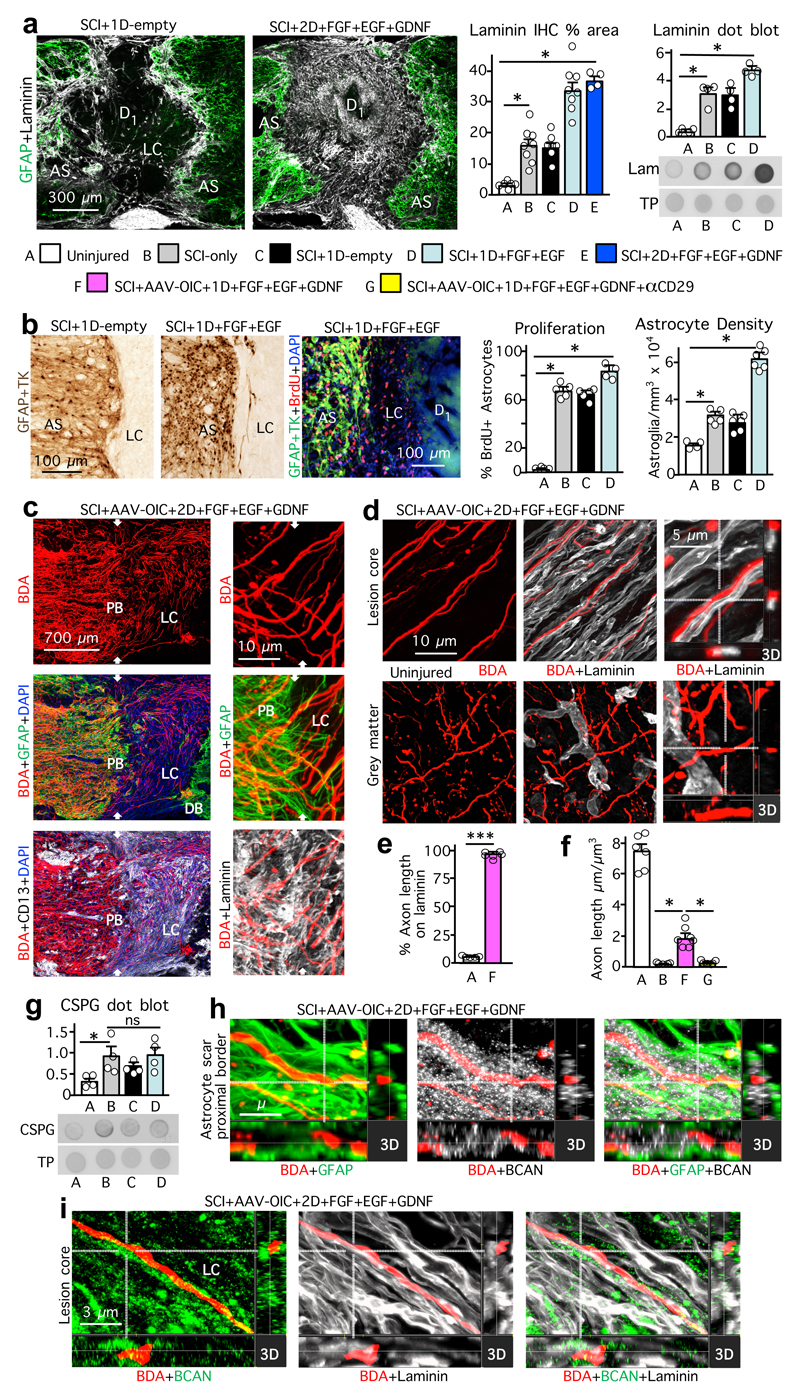
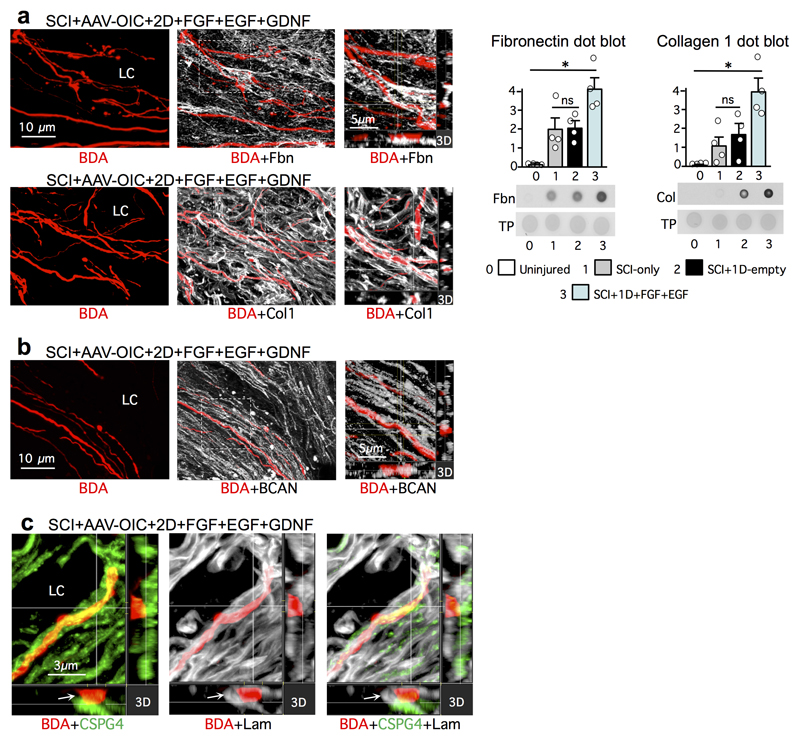
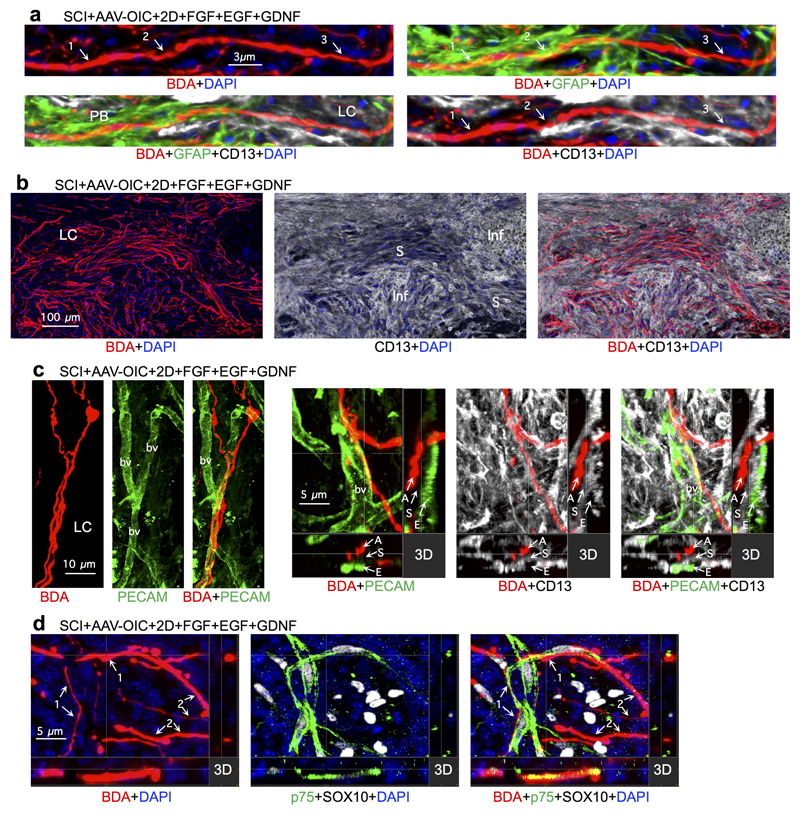
To dissect cellular and molecular mechanisms underlying this robust axon regrowth, we first examined axon-substrate interactions (Fig. 2, Extended Data Figs. 5,6). FGF+EGF significantly increased known axon-supportive substrate molecules11, laminin, fibronectin and collagen in SCI lesions (Fig. 2a, Extended Data Fig. 5a), whereas potentially inhibitory chondroitin sulfate proteoglycans (CSPG)28 were not significantly altered (Fig. 2g). FGF+EGF significantly increased astrocyte proliferation and density (Fig. 2b), yet despite this increase, stimulated and chemoattracted propriospinal axons regrew robustly through and beyond proximal (Fig. 2c) and distal (Fig. 3a) astrocyte scar borders, consistent with observations for sensory axons19. FGF+EGF also increased stromal cell density in lesion core (Fig. 2a, Extended Data Fig. 6b). Axons transitioned readily from regrowing along astrocytes in proximal scar borders to regrowing along stromal cells in lesion core (Fig. 2c, Extended Data Fig. 6a), often orientated along stromal cells or blood vessels and circumventing inflammatory cell clusters (Fig. 2c, Extended Data Fig. 6a-c). Some regrowing axons partially contacted cells expressing Schwann cell markers (Extended Data Fig. 6d). Thus, appropriately stimulated and attracted axons regrew in contact with multiple cell types. Notably, over 98% of regrowing propriospinal axons in SCI lesions had at least one surface continually in contact with laminin, whereas axon surfaces in mature uninjured tissue rarely contacted laminin (Fig. 2d,e). Many regrowing axons also contacted fibronectin or collagen (Extended Data Fig. 5a). Simultaneous in vivo delivery of anti-CD29, an integrin-function-blocking antibody19,24, significantly prevented most axon regrowth (Fig. 2f, Extended Data Figs. 3d,4), demonstrating that regrowth required integrin-dependent axon-substrate interactions with laminin, fibronectin or collagen.
Figure 2. Stimulated, supported and chemoattracted murine propriospinal axons regrow through astrocyte scar (AS) proximal borders (PB) and lesion core (LC) stromal cells along laminin upregulated by delivered growth factors, in spite of CSPG.
a, Laminin immunohistochemistry (IHC) images plus quantification (mean±SEM stained area), and dot blot plus quantification (mean±SEM density). TP, total protein. (*P <0.01, one-way ANOVA/Bonferroni). b, IHC images and quantification (mean±SEM cell number) of astrocyte proliferation and density. (ns non-significant, *P <0.0005, one-way ANOVA/Bonferroni). c, BDA-labeled axon regrowth past PB and in LC among CD13-positive stromal cells (left) and along laminin (right). White arrows denote PB. d-f, IHC images (d) and graphs of mean±SEM axon contact with laminin (e) (***P <0.0001; Student’s two-tailed t-test, t (9)=107.4), and mean±SEM axon length per tissue volume (f) (*P <0.0005 one-way ANOVA/Bonferroni). g, CSPG dot blot (mean±SEM density). (ns non-significant, *P <0.05, one-way ANOVA/Bonferroni). For all graphs, dots show n mice per group. h, i, BDA-labeled axon regrowth through astrocytes of PB (h) and along laminin in LC (i) in spite of dense brevican (BCAN).
Nevertheless, upregulation of permissive substrate alone was not sufficient to attract activated axon regrowth. AAV-OIC plus depots of only FGF+EGF exhibited no significant regrowth, whereas AAV-OIC+FGF+EGF+GDNF did (Fig. 1c, Extended Data Fig. 3d,4), demonstrating that axon regrowth also required chemoattraction.
Remarkably, AAV-OIC+FGF+EGF+GDNF stimulated axons regrew robustly through dense areas of CSPGs, including in direct contact with brevican or CSPG4 in both astrocyte scars and non-neural lesion cores. This regrowth occurred along surfaces with high laminin expression (Fig. 2h,i, Extended Data Fig. 5b,c), consistent with in vitro observations that CSPG inhibition is relative rather than absolute, such that increasing laminin overrides CSPG presence29.
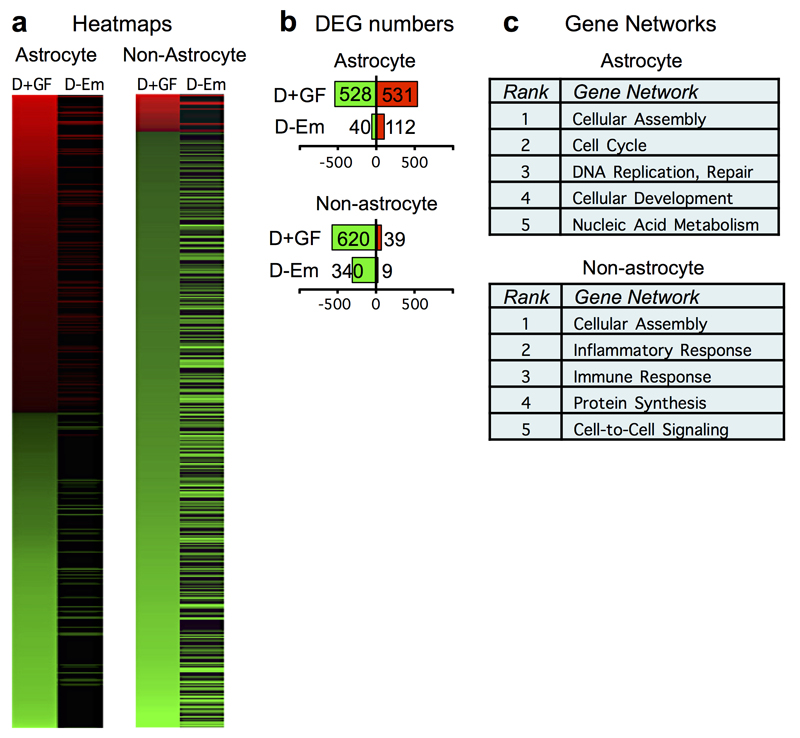
To probe more broadly the effects of prolonged FGF+EGF treatment on astrocytes and other cells in SCI lesions, we conducted genome-wide sequencing of astrocyte-specific ribosome-associated RNA and RNA from non-astrocyte cells19 at two weeks after SCI. At this time point, FGF+EGF treatment continued to significantly regulate many genes. The most significantly regulated gene networks were associated with astrocyte proliferation and development, and with non-astrocyte inflammatory responses (Extended Data Fig.7a-c).
We next identified mechanisms required to achieve propriospinal axon regrowth beyond lesion cores and distal borders into spared grey matter. In early experiments with one depot of AAV-OIC plus FGF+EGF+GDNF in lesion cores, we noted that propriospinal axons regrew robustly to surround and encircle depots, but did not pass beyond (Extended data Fig. 4). We therefore injected a second depot of GDNF into spared grey matter caudal to injuries at one week after the first depot (Extended data Fig. 1b). In mice with two such spatially and temporally separated depots, axons regrew robustly across lesion cores and their distal astrocyte borders and routinely reached a full spinal segment past lesion centers (Fig. 1b-d, Extended data Figs. 3a-c), demonstrating that chemoattraction is required to draw robust regrowth of mature endogenous axons into spared neural tissue beyond injuries. Notably, the second depot was placed at 9 days after SCI, indicating that GDNF efficiently chemoattracted regrowing axons across already formed distal astrocyte scar borders without altering CSPG levels (Fig. 3a; Extended data Fig. 3b). Starting just beyond lesion borders (Fig. 3b,c), propriospinal axons regrowing in spared grey matter intermingled with NeuN-positive neurons, and some formed terminal-like swellings that contacted neurons, colocalized with the pre-synaptic marker, synaptophysin, and were in apposition with the post-synaptic marker, homer (Fig. 3b-d). Such contacts were found wherever regrowing axons were present in grey matter, up to a full spinal segment (1500µm) beyond lesion centers. As expected and discussed below, over-ground locomotion did not improve in these experiments focused on dissecting mechanisms required to achieve axon regrowth across lesions (Extended Data Fig. 2f).
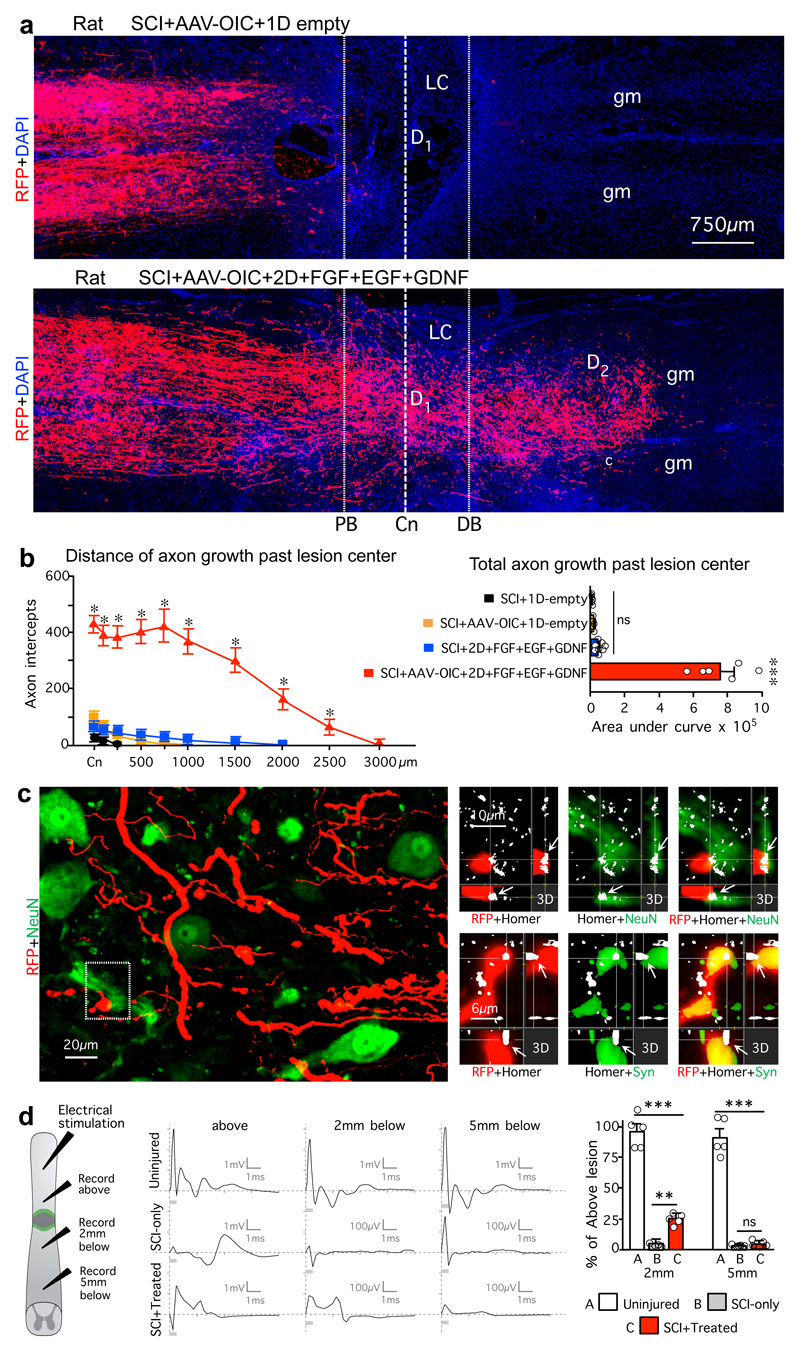
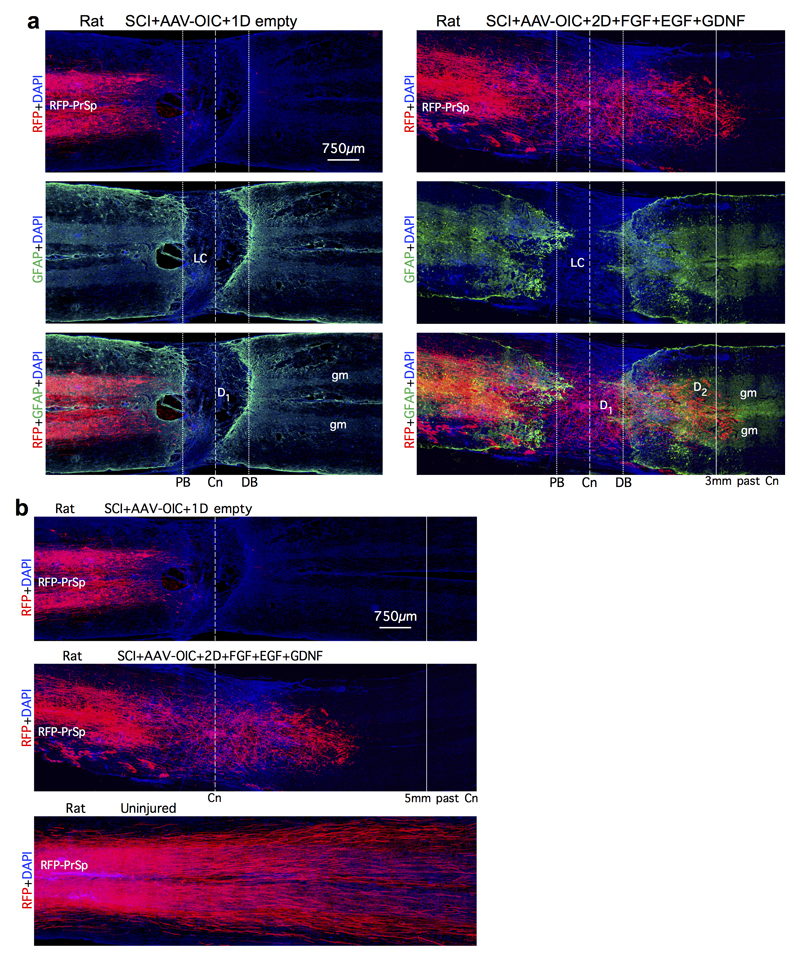
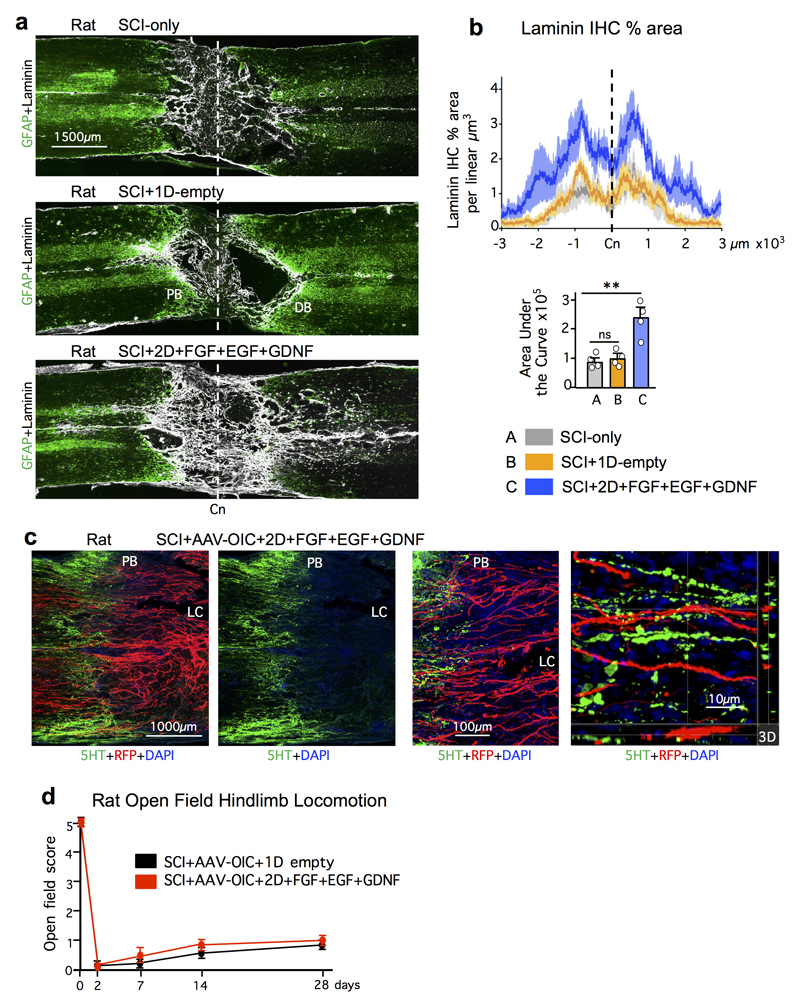
We next tested whether our findings could be extended to rats, whose lesion core pathophysiology has been proposed as more similar to humans. As expected, rats exhibited little or no propriospinal axon regrowth after SCI plus empty hydrogel. Axon regrowth was not increased by AAV-OIC alone, and only minimally by FGF+EGF+GDNF alone. In striking contrast, and consistent with our observations in mice, rats given combined AAV-OIC plus two depots of FGF+EGF+GDNF exhibited robust propriospinal axon regrowth that routinely reached a full spinal segment or more past lesion centers and penetrated well into spared grey matter around the second depot but not further (Fig. 4a,b, Extended Data Fig. 8,9). Total axon regrowth past lesion centers was over 140-fold greater in rats with AAV-OIC plus FGF+EGF+GDNF versus SCI with empty hydrogel (Fig. 4b). AAV-derived tract-tracer, RFP, was not expressed by axons of passage, such as serotonin axons. Moreover, in striking contrast with the robust regrowth of RFP-labeled propriospinal axons, serotonin axons exhibited no regrowth (Extended Data Fig. 9c), indicating that our growth factor depots did not simply alter lesion core environment to broadly enable regrowth of all axon types. Regrowing propriospinal axons that reached spared grey matter intermingled with NeuN-positive neurons and some axons formed terminal-like swellings that contacted neurons, colocalized with synaptophysin and were in apposition with homer (Fig. 4c). As in mice, over-ground locomotion of rats did not improve in these experiments that probed mechanisms required for axon regrowth but did not provide rehabilitation to elicit use-dependent plasticity (Extended Data Fig. 9d). Nevertheless, to look for potential basic functionality of regrown propriospinal axons, we measured electrophysiological signals across lesions. Rats with SCI-only exhibited essentially no conduction above background levels across lesions, whereas rats with AAV-OIC plus FGF+EGF+GDNF exhibited conduction at about 25% of control levels at 2mm past lesions, which disappeared by 5mm past lesions (Fig. 4d), indicating that propriospinal axon regrowth was associated with a significant return of conduction capacity that correlated with the distance of regrowth past lesions.
Figure 4. Stimulated and chemoattracted propriospinal axons regrow robustly and conduct electrophysiological signals across anatomically complete SCI lesions in rats with combined delivery of AAV-OIC plus FGF+EGF+GDNF in two sequentially placed hydrogel depots.
a, BDA-labeled axons in composite tiled scans of horizontal sections. Dotted lines demarcate astrocyte proximal (PB) and distal (DB) border around lesion core (LC). Dashed line demarcates lesion center (Cn). b, Left, mean±SEM axon intercepts at specific distances past lesion centers (color coding and n as in bar graph). Right, mean±SEM areas under axon intercept curves. (*P <0.01 versus all other groups, ***P <0.0001 versus all other groups, one-way ANOVA/Bonferroni). c, Detail images from area c in a. Left, BDA-labeled axons among NeuN-positive neurons in spared grey matter 2000µm past Cn. Top right, 3D detail of boxed area shows synapse-like contact of BDA-labeled terminal with post-synaptic marker, homer, on neuron. Bottom right, BDA-labeled terminal co-labeled with presynaptic marker, synaptophysin (Syn) in synapse-like contact with post-synaptic marker, homer. d, Left, spinal cord stimulation and recording sites. Middle, electrophysiological traces after spinal cord stimulation. Right, mean±SEM of peak to peak amplitude of the evoked potential at 2 and 5 mm below lesions relative to above lesion in SCI-only or SCI-Treated (SCI+OIC-AAV+FGF+EGF+GDNF) or equivalent distance in uninjured. (ns non-significant, **P <0.005, ***P <0.0001, one-way ANOVA/Bonferroni). For all graphs, dots show n rats per group.
Biological repair of anatomically complete SCI will require axon regrowth across lesions with non-neural tissue cores and astrocyte limitans borders to reach spared grey matter and form new circuits3. A mechanistic understanding of why spontaneous axon regrowth fails in adults is fundamental to creating beneficial interventions4. Our findings, in both mice and rats, strongly support the hypothesis that adult axon regrowth across such lesions fails primarily because of the simultaneous absence or inadequate presence of three types of mechanisms essential for facilitating developmental axon growth, (i) neuron intrinsic growth capacity2,5–9, (ii) supportive substrate10,11, and (iii) chemoattraction12,13. We show that each of these mechanisms is required, and that in combination, but not individually, they are sufficient to achieve robust axon regrowth across lesions in spite of the presence of putative growth inhibitors. We extend previous observations that providing individual growth-facilitators is not sufficient to achieve meaningful axon regrowth across complete lesions and combinations can improve regrowth3,4,19,23,30,31. Importantly, our findings identify chemoattraction as critically required for robust axon regrowth, and point towards the need to identify chemoattractants effective for other axon populations desirable to target after SCI. The different response of propriospinal neurons to AAV-shPT and AAV-OIC reflects previous observations of neuron-specific activation requirements14 and points towards the need to identify growth activators for different neuronal populations and the means to achieve activation at subacute or chronic times after SCI. Although propriospinal axon regrowth was associated with a significant return of electrophysiological conduction across lesions, there was, as expected4, no detectable improvement of locomotor function, consistent with accumulating evidence that new circuits formed after complete SCI cannot be expected to acquire function spontaneously, but will require rehabilitation that fosters their integration into functional networks through use-dependent plasticity4,20,21,32. Our findings provide proof-of-concept evidence that robust and physiologically active descending propriospinal axon regrowth can be achieved across anatomically complete SCI lesions, and identify a mechanism-based biological repair strategy for such lesions to test in conjunction with targeted rehabilitation paradigms32 designed to augment synapse remodeling and functional recovery of remodeling circuits.
Methods
Mice
All experiments using mice were conducted at UCLA using C57/BL6 female and male mice. RNA sequencing experiments used C57/BL6 mice expressing an mGFAP-RiboTag transgene generated and characterized as described 19. All mice used were young adults between 10 weeks and four months old at the time of spinal cord injury. Mice receiving AAV injections were between 6 and 9 weeks old at the time of AAV injection. All mice were housed in a 12-hour light/dark cycle in a specific pathogen-free facility with controlled temperature and humidity and were allowed free access to food and water. Animal care, including manual bladder voiding, was performed at least twice daily or as needed following SCI for the duration of the experiment. All experiments were conducted according to protocols approved by the Animal Research Committee of the Office for Protection of Research Subjects at University of California Los Angeles.
Rats
All surgical procedures in rats were done at EPFL. Experiments were conducted on young adult female Lewis rats between two and four months of age (180-220g body weight) housed three to a cage on a 12-hour light/dark cycle with access to food and water ad libitum. Housing, surgery, and euthanasia were performed in compliance with the Swiss Veterinary Law guidelines. Animal care, including manual bladder voiding, was performed twice daily following SCI for the duration of the experiment. All procedures and experiments were approved by the Veterinary Office of the canton of Vaud and the Veterinary Office of the canton of Geneva (Switzerland).
Surgical procedures for mice
All surgeries on mice were performed at UCLA under general anesthesia with isoflurane in oxygen-enriched air using an operating microscope (Zeiss, Oberkochen, Germany), and rodent stereotaxic apparatus (David Kopf, Tujunga, CA). AAV injections were made two weeks prior to SCI to allow time for molecular expression and were targeted at propriospinal neurons between one and two segments rostral to planned locations of SCI lesions after laminectomy of a single vertebra. AAV (see below) were injected into 2 sites (1 on each side of the cord) x 0.25µl (AAV2/9 OPN: 1x10^13, IGF: 5x10^12, CNTF: 5x10^12 gc/ml in sterile saline) 0.6 mm below surface at 0.1µl per minute using glass micropipettes (ground to 50 to 100 µm tips) connected via high-pressure tubing (Kopf) to 10µl syringes under control of microinfusion pumps. Severe crush SCI were made at the level of T10 after laminectomy of a single vertebra by using No. 5 Dumont forceps (Fine Science Tools, Foster City, CA) without spacers and with a tip width of 0.5mm to completely compress the entire spinal cord laterally from both sides for 5 seconds19,33–35 (Extended Data Fig. 1). Hydrogel depots were injected stereotaxically into the center of SCI lesions 0.6 mm below surface at 0.15µl per minute using glass micropipettes (ground to 50 to 100 µm tips) connected via high-pressure tubing (Kopf) to 10µl syringes under control of microinfusion pumps, two days after SCI 36. Tract-tracing of propriospinal neurons was performed by injection of biotinylated dextran amine 10000 (BDA, Sigma) 10% wt/vol in sterile saline injected 2 x 0.4µl into the same rostral segments targeted with AAV injections as described above. In animals receiving two hydrogel depots, the second depot was placed 1mm below the SCI 9 days post SCI. Timelines of all injections are provided in Extended Data Figure 1. All mice received analgesic prior to wound closure and every 12 hours for at least 48 hours post-injury. Animals were randomly assigned numbers and evaluated thereafter blind to experimental condition.
Surgical procedures for rats
All surgeries on rats were performed at EPFL under general anaesthesia with isoflurane in oxygen-enriched air using an operating microscope (Zeiss, Oberkochen, Germany), and rodent stereotaxic apparatus (David Kopf, Tujunga, CA). AAV injections were made two weeks prior to SCI to allow time for molecular expression and were targeted at propriospinal neurons one and two segments rostral to planned locations of SCI lesions after laminectomy of a single vertebra. AAV were injected into 4 sites (2 on each side of the cord) x 0.25µl (AAV2/9 OPN: 1x10^13, IGF: 5x10^12, CNTF: 5x10^12 gc/ml in sterile saline) 1.1 mm below the surface at 0.2 μl per minute using glass micropipettes connected via high pressure tubing (Kopf) to 10μl syringes under control of microinfusion pumps. Severe crush SCI were made at the level of T10 laminectomy of a single vertebra by using No. 2 Dumont Forceps (Fine Science Tools, Foster City, CA) without spacers and with a tip of 0.5mm to completely compress the entire spinal cord laterally from both sides for 5 seconds (Extended Data Fig. 1). Hydrogel depots were injected stereotaxically into the center of SCI lesions 1.1 mm below the surface at 0.2µl per minute using glass micropipettes connected via high pressure tubing (Kopf) to 10µl syringes under control of microinfusion pumps, two days after SCI. One week later, a hydrogel depot was placed 2mm below the SCI. During the same surgery, tract-tracing of propriospinal neurons was performed by injection of AAV2/5 red fluorescent protein (RFP, University of Pennsylvania Vector Core, 2.612x10^13 gc/ml) injected 4 x 0.25 µl into the same rostral segments targeted with AAV injections as described above. Timelines of all injections are provided in Extended Data Figure 1. All rats received analgesia (buprenorphine Temgesic, ESSEX Chemie AG, Switzerland, 0.01-0.05 mg per kg, s.c.) and antibiotics (Baytril 2.5%, Bayer Health Care AG, Germany, 5-10 mg per kg, s.c.) were provided for 3 and 5 days post-surgery, respectfully. Animals were randomly assigned numbers and evaluated thereafter blind to experimental condition.
AAVs
Various adeno associated viral vectors (AAV) were used to deliver either scrambled control AAV (AAV2/1-scrambled: 5x10^12 gc/ml) or PTEN knockdown (AAV2/1-shPTEN: 5x10^12 gc/ml)23; or to express the growth factors osteopontin (OPN), IGF1 and CNTF (AAV2/9 OPN: 1x10^13 gc/ml; AAV2/9 IGF-1: 5x10^12 gc/ml; AAV2/9 CNTF: 5x10^12 gc/ml)14,15; or to express green fluorescent protein (GFP) as a reporter protein (AAV2/9 GFP: 2x10^13 gc/ml) or red fluorescent protein (RFP) as an axonal tract-tracer (AAV2/5-RFP: 2.612x10^13 gc/ml)(University of Pennsylvania Vector Core).
Hydrogel depots with growth factors and function-blocking antibodies
Biomaterial depots were prepared using well characterized diblock copolypeptide hydrogels that are CNS biocompatible, biodegrade over several weeks in vivo and provide prolonged delivery of bioactive growth factors in CNS tissue for two or more weeks after injection18,19,37,38. Diblock copolypeptide hydrogel K180L20 was fabricated, conjugated with blue fluorescent dye (AMCA-X) and loaded with growth factor and antibody cargoes as described36–38. Cargo molecules were as follows: Human recombinant FGF2, EGF and GDNF were purchased from PeproTech (Rocky Hill, NJ): (i) Human FGF2 (FGF-basic) (154 a.a.) Cat#100-18B-100UG, Lot#091608 C0617; (ii) Human EGF Cat#AF-100-15-100UG, Lot#0816AFC05 B2317; (iii) Human GDNF Cat#405-10-100UG, Lot#0606B64 A2517. Integrin-function-blocking Hamster anti-rat CD29 monoclonal antibody was purchased from BD Bioscience (San Diego, CA) as a custom order at 10.3mg/ml (product #624084; lot#7165896). Freeze dried K180L20 powder was reconstituted to 3.0% or 3.5% wt/vol in sterile PBS without cargo or with combinations of FGF2 (1.0µg/µl), EGF (1.0µg/µl), GDNF (1.0µg/µl) and anti-CD29 (5µg/µl). Diblock copolypeptide hydrogel formulations were prepared to have G′ (storage modulus at 10 rad s-1) between 75 and 100 Pascal (Pa), somewhat below that of mouse brain at 200 Pa37,38.
Hindlimb locomotor evaluation
At 2,7,14 days and 28 days after SCI, hindlimb movements were scored using a simple six-point scale in which 0 is no movement and 5 is normal walking34.
Animal inclusion and exclusion criteria
Two days after SCI, all mice or rats were evaluated in open field and all animals exhibiting any hindlimb movements were not studied further. Rodents that passed this inclusion criterion were randomized into experimental groups for further treatments and were thereafter evaluated blind to their experimental condition.
Histology and immunohistochemistry
After terminal anesthesia by barbiturate overdose mice or rats were perfused transcardially with 4% paraformaldehyde and spinal cords processed for immunofluorescence as described19,33–35. Primary antibodies were: rabbit anti-GFAP (1:2000; Dako, Santa Clara, CA); rat anti-GFAP (1:1000, Thermofisher, Grand Island, NY); chicken anti-GFAP (1:1000, Novus Biologicals, Littleton, CO); rabbit anti NeuN (1:1000, Abcam, Cambridge, MA); rabbit anti-GDNFR-a (GDNF-receptor alpha) (1:1000, Abcam, Cambridge, MA); sheep anti-BrdU (1:300, Maine Biotechnology Services, Portland, ME); rabbit anti-HSV-TK (1:1,000, 35,39); goat anti-CD13 (1:1000, R&Dsystems, Minneapolis, MN); rabbit anti-Laminin 1 (1:100, Sigma, St.Louis, MO); rabbit anti-Fibronectin (1:500, Millipore, Burlington, MA); rabbit anti-Collagen 1a1 (1:300, Novus Biologicals, Littleton, CO); mouse anti-NeuN (1:2000, Millipore, Burlington, MA); mouse anti-CSPG40 (1:100, Sigma); rabbit anti-Brevican (BCAN) (1:300, Novus Biologicals, Littleton, CO); guinea pig anti-NG2 (CSPG4) (Drs. E.G. Hughes and D.W. Bergles41, Baltimore, MA); rat anti-PECAM-1 (1:200, BD Biosciences, San Jose, CA); guinea pig anti-homer1 (1:600, Synaptic Systems GmbH, Germany); rabbit anti-Synaptophysin (1:600,Dako, Santa Clara, CA); rabbit anti-RFP (1:1000, Rockland,Limerick,PA); chicken anti-RFP (1:500, Novus Biologicals, Littleton, CO); goat anti-GFP (1:1000, Novus Biologicals, Littleton, CO). Fluorescence secondary antibodies were conjugated to: Alexa 488 (green) or Alexa 405 (blue) (Molecular Probes), or to Cy3 (550, red) or Cy5 (649, far red) all from (Jackson Immunoresearch Laboratories). BDA tract-tracing was visualized with streptavidin-HRP plus TSB Fluorescein geen or Tyr-Cy3 (Perkin Elmer). Nuclear stain: 4',6'-diamidino-2-phenylindole dihydrochloride (DAPI; 2ng/ml; Molecular Probes). Sections were coverslipped using ProLong Gold anti-fade reagent (InVitrogen, Grand Island, NY). Sections were examined and photographed using deconvolution fluorescence microscopy and scanning confocal laser microscopy (Zeiss, Oberkochen, Germany). Tiled scans of individual whole sections were prepared using a x20 objective and the scanning function of a Leica Aperio Versa 200 Microscope (Leica, Wetzlar, Germany) available in the UCLA Translational Pathology Core Laboratory. Composite survey images were prepared from tiled scans of multiple sections from the same animals oriented and overlaid using Imaris ® software (9.1.2 64 Bit, Bitplane, Oxford Instruments,Abingdon, U.K.).
Axon quantification
Axons labeled by tract tracing using BDA or RFP were quantified using image analysis software (NeuroLucida®, 9.14.5 32 Bit, MicroBrightField, Williston, VT) operating a computer-driven microscope regulated in the x, y and z axes (Zeiss) by observers blind to experimental conditions. Using NeuroLucida ®, lines were drawn across horizontal spinal cord sections at SCI lesion centers and at regular distances beyond (Fig. 1c, Extended Data Fig. 3a,b) and the number of axons intercepting lines was counted by observers blind to experimental conditions. Multiple sections through the middle of the cord where propriospinal axons were densest, were counted per mouse or rat and expressed as total intercepts per location per animal. To determine efficacy of axon transection after SCI, we examined labeling 3mm distal to SCI lesion centers in mice and 5mm distal to lesion centers in rats, with the intention of eliminating animals that had labeled axons at this location on grounds that these mice may have had incomplete lesions. However, essentially all mice or rats that had met the strict behavioral inclusion criterion of no hindlimb movements two days after severe crush SCI, exhibited no detectable axons 3mm or 5mm, respectively, distal to SCI lesions regardless of treatment group.
Quantification of immunohistochemically stained areas
Sections stained for laminin 1, fibronectin, collagen 1a1 or CSPG were scanned using constant exposure settings. Single channel immunofluorescence images were converted to black and white and thresholded (Fig. 2a) and the amount of stained area measured in different tissue compartments using NIH Image J (1.51) software19.
Quantification of astrocyte proliferation and density
To quantify astrocyte proliferation and the number of astrocytes in the immediate scar border previously defined as zone 135, we used a well characterized transgenic mouse line that expresses thymidine kinase (TK) in astrocyte cell bodies and thereby facilitating quantification of cell number and co-localization with other markers35. To quantify the proportion of newly proliferated astroglia in the scar boarder, we injected daily single doses of the cell division marker, bromodeoxyuridine (BrdU, Sigma), 100 mg/kg/day dissolved in saline plus 0.007N NaOH on days 2-7 following SCI. Newly proliferated astrocytes quantified by determining the percentage of astrocytes stained for both GFAP,TK and BrdU in zone 135. Total astrocyte numbers in the immediate scar border (zone 1)35 were determined by counting the number of cells per defined tissue volume. Cell counts were performed using stereological image analysis software (StereoInvestigator®, 9.14.5 32 Bit, and NeuroLucida®, 9.14.5 32 Bit, MicroBrightField, Williston, VT) operating a computer-driven microscope regulated in the x, y and z axes (Zeiss).
Dot blot
For dot blot immunoassay of laminin 1, fibronectin, collagen 1 or CSPG, spinal cord tissue blocks were lysed and homogenized in standard RIPA (radio-immuno-precipitation-assay) buffer. LDS (lithium dodecyl sulfate) buffer (Life Technologies) was added to the post-mitochondrial supernatant and 2μL containing 2μg/uL protein was spotted onto a nitrocellulose membrane (Life Technologies), set to dry and incubated overnight with primary antibodies: rabbit anti-Laminin 1 (1:4000, Sigma, St.Louis, MO); rabbit anti-Fibronectin (1:7000, Millipore, Burlington, MA); rabbit anti-Collagen 1a1 (1:7000, Novus Biologicals, Littleton, CO); mouse anti-chondroitin sulfate antibody (CS-56, 1:3000, Sigma Aldrich), an IgM-monoclonal antibody that detects glyco-moieties of all CSPGs40. Immunoreactivity was detected on X-ray film with horse radish peroxidase (HRP)-conjugated secondary antibody (1:5000) and chemiluminescent substrate (ThermoFisher, Grand Ilsand, NY). Densitometry measurements of immunoreactivity were obtained using ImageJ software (NIH) and normalized to total protein (Ponceau S) density43. Raw images of dot blots are provided as Supplementary figure 1.
Isolation and sequencing of RNA from astrocytes and non-astrocyte cells
Using mice expressing an mGFAP-RiboTag transgene, RNA was evaluated as previously described19 from uninjured mice, and mice two weeks after SCI after treatment with hydrogel depots that either contained no cargo (empty depots) or delivered FGF+EGF (Extended Data Fig. 1a). Briefly, spinal cords were rapidly dissected out of the spinal canal and the central 3mm of the lower thoracic lesion including the lesion core and 1mm rostral and caudal were rapidly removed and snap frozen in liquid nitrogen. Hemagglutinin (HA) immuno-precipitation (IP) of astrocyte ribosomes and ribosome-associate mRNA (ramRNA) was carried out as described44. The non-precipitated flow through (FT) from each sample was collected for analysis of non-astrocyte total RNA. HA and FT samples underwent on-column DNA digestion using the RNase-Free Dnase Set (Qiagen) and RNA purified with the RNeasy Plus Micro kit (Qiagen). Integrity of the eluted RNA was analyzed by a 2100 Bioanalyzer (Agilent) using the RNA Pico chip, average RIN = 7.9 + 1.4. RNA concentration determined by RiboGreen RNA Assay kit (Life Technologies). cDNA was generated from 5ng of IP or FT RNA using the Nugen Ovation® 2 RNA-Seq Sytstem V2 kit (Nugen). One µg of cDNA was fragmented using the Covaris M220. Paired-end libraries for multiplex sequencing were generated from 300 ng of fragmented cDNA using the Apollo 324 automated library preparation system (Wafergen Biosystems), enriched over 10 cycles of PCR cycles and purified with Agencourt AMPure XP beads (Beckman Coulter). All samples were analyzed by an Illumina NextSeq 500 Sequencer (Illumina) using 75-bp pair-end sequencing. The number of reads obtained are between 38.0 to 71.0M (avg 52.1M). Sequences were aligned to mouse mm10 genome using STAR aligner (2.4.0j). Uniquely aligned reads were between 57.1 to 87.0% (avg 73.9%). Read counts were determined using HT-seq (0.6.0). Differential expression analysis was conducted using Bioconductor EdgeR package (3.20.1) after removal of low count genes (5 counts for at least two samples). Three samples from astrocyte samples were excluded due to low RIN values (<5.7), no samples were excluded for non-astrocyte samples.
Rat electrophysiology
Terminal electrophysiological assessments were carried out as previously described45 four weeks after SCI. Briefly, animals were anaesthetised with urethane (1.5 g/kg; i.p.) and core body temperature was maintained at 37°C using a self-regulating heated pad connected to a rectal probe. Depth of anaesthesia was continually monitored by assessing withdrawal reflexes and respiratory rate. After laminectomy to expose the injury site and 7mm rostral and caudal to the lesion site by removal of one vertebra on either side of the injury, the dura was removed, and the exposed spinal cord was covered with warm mineral oil to prevent drying. For stimulation, a tungsten bipolar concentric electrode was positioned intraspinally at the rostral-most point of the laminectomy. A silver ball electrode was used to record any evoked activity from the surface of the exposed spinal cord at various locations (above, 2mm below, and 5mm below lesion). Stimulation was delivered in 200 µs square wave pulses at the maximum amplitude possible before large motor responses were evoked (typically between 600 µA and 800 µA) and at a frequency of 0.75 Hz using a STG 4004 stimulus generator (Multi Channel Systems). Evoked activity was amplified and recorded using an A-M systems differential amplifier, PowerLab and LabChart Pro acquisition and analysis system (AD Instruments). For analysis, 30 traces from each recording site were averaged and the peak to peak amplitude of the evoked potential was quantified.
Statistics, power calculations, group sizes and reproducibility
Statistical evaluations of repeated measures were conducted by one-way ANOVA with post hoc independent pair wise analysis as per Bonferroni, or by Student’s t-test (Prism®, 7.0c, GraphPad, San Diego, CA). For one-way ANOVA statistical evaluations, F-values are also reported in the online source data files in the format F(df1, df2)=X. The degrees of freedom are computed as, df1=k-1, where k is the number of compared treatments and df2=n-k where n is the total number of samples across the treatment groups. For Student’s two-tailed t-test (Prism®, 7.0c, GraphPad, San Diego, CA), t value and degrees of freedom (df) are reported in the format t(df)=X. Power calculations were performed using G*Power Software V 3.1.9.242. For quantification of histologically-derived neuroanatomical outcomes such as numbers of axons or percent of area stained, group sizes were used that were calculated to provide at least 80% power when using the following parameters: probability of type I error (alpha) = .05, a conservative effect size of 0.25, 3-10 treatment groups with multiple measurements obtained per replicate. All graphs show mean values plus or minus standard error of the means (S.E.M.) as well as individual values as dot plots. All bar graphs are overlaid with dot plots where each dot represents the value for one animal to show the distribution of data and the number (n) of animals per group. Files of all individual values are provided as source data. The main experiments testing propriospinal axon regrowth across SCI lesions in animals treated with SCI+AAV-OIC+2D+FGF+EGF+GDNF and the main control groups (SCI+1D-empty, SCI+AAV-OIC+1D-empty, SCI+2D+FGF+EGF+GDNF) were repeated independently three times in different groups of mice and three times in different groups of rats with similar results. Other experiments testing propriospinal axon regrowth across SCI lesions in animals in all other groups were repeated independently at least twice in different groups of mice with similar results. For all photomicrographs of histological tissue, staining experiments were repeated independently with tissue from at least four, and in most cases six, different animals with similar results.
Extended Data
Extended Data Figure 1. Experimental models and timelines.
Mice or rats received different combinations of procedures including adeno-associated virus (AAV) injections, complete crush SCI, injections of one or two depots of hydrogel containing different molecular cargo, and injections of biotinylated dextran amine (BDA) for axonal tract-tracing. AAV injections were made two weeks prior to SCI to allow time for molecular expression and were targeted at propriospinal neurons (PrSp) between one and two segments rostral to planned locations of SCI lesions. AAV were used to deliver either potential axon-growth reactivating molecules, green fluorescent protein (GFP) to identify targeted neurons, or red-fluorescent protein (RFP) as an axonal tract-tracer. Complete crush SCI lesions were placed at the level of spinal segment T10. Two days after SCI, all animals were evaluated for completeness of SCI and only animals with functionally complete SCI were included in subsequent experimental steps. Additional animals with complete SCI were evaluated without hydrogel injections (SCI-only). a, Schematic and timeline of one depot experiments. Two days after complete crush SCI, animals received hydrogel injections targeted to the center of the non-neural lesion core. These depots (D1) contained different molecular cargos as listed in the schematic. Depots without cargo were referred to as 'empty'. b, Schematic and timeline of two depot experiments. Two days after complete crush SCI, animals received a D1 hydrogel injection into the center of the non-neural lesion core to deliver the growth factors FGF+EGF+GDNF. Nine days after SCI, the animals received a second hydrogel injection (D2) targeted to spared neural tissue 1 to 2 mm caudal to the lesion center to deliver GDNF to sequentially chemoattract propriospinal axons that had regrown into the lesion core. BDA injections for axonal tract-tracing were targeted at propriospinal neurons between one and two segments rostral to SCI lesions and were placed at the time of injecting either D1 (a) or D2 (b). Tissue was harvested for evaluation at either two or four weeks after SCI. Electrophysiological evaluations were conducted at four weeks after SCI. For abbreviations, see Extended Data Table 1.
Extended Data Figure 2. AAV targeting, axon tracing and axon quantification.
a, AAV targeting of green fluorescent protein (GFP) to propriospinal neurons. Multi-fluorescent, survey (left) and detail (right, boxed area) confocal images of horizontal section through mouse grey (gm) and white (wm) matter. Essentially all NeuN-positive propriospinal neurons targeted with AAV express GFP. b, Multi-fluorescent, orthogonal 3-dimensional (3D) confocal images show that AAV-targeted propriospinal neurons express GDNFR. c, Multi-fluorescent, survey images show tract-tracing of propriospinal axons using biotinylated dextran amine (BDA) in tiled confocal scans of horizontal section from uninjured mouse. Hatched area indicates densely labeled location of BDA injections. d,e, Multiple channel fluorescent images compare BDA-labeled propriospinal axons and immunohistochemically stained serotonin (5HT) axons in mice after SCI+AAV-OIC+1D+FGF+EGF+GDNF. d, Survey and orthogonal 3-dimensional (3D) confocal detail from an area proximal to the SCI lesion shows a complete lack of overlap of BDA-labeling and 5HT immunohistochemistry, indicating that BDA-tracing did not label 5HT axons of passage. e, Survey images of the same field examined with different filters show BDA-labeled propriospinal axons (bottom image) regrowing robustly past the astrocyte scar proximal border (PB) and through the non-neural lesion core (LC); in contrast, 5HT axons (top and bottom image) did not regrow into or through the LC. f, mean±SEM open field hindlimb locomotor score at various times after SCI assessed using a 6-point scale where 5 is normal walking and 0 is no movement of any kind. (n=6 mice per group). For abbreviations, see Extended Data Table 1.
Extended Data Figure 3. Procedures for quantification of BDA-labelled propriospinal (PrSp) axons after SCI.
a, Schematics show demarcation of SCI lesion center (Cn) and evenly spaced lines beyond the Cn placed by image analysis software (Neurolucida®, Microbrightfield) for quantification of axon intercepts in horizontal tissue sections of mice with SCI and one (D1) or two (D1+D2) hydrogel depots. b, Multi-fluorescent, survey images show BDA-labeled axons and GFAP-labelled astrocytes that demarcate astrocyte scar proximal borders (PB) and distal borders (DB) around the non-neural lesion core (LC) after SCI. The hydrogel of the empty depot (left) was tagged with a blue fluorescent label for visualization. Note the essential absence of axons passing the astrocyte scar (AS) proximal border (PB) to reach the lesion center (Cn) or beyond in the mouse with SCI plus empty depot (left), in striking contrast with the large number of axons that regrew through the lesion core (LC) and passed beyond the distal astrocyte scar border (DB) into spared grey matter (gm) in the mouse with full treatment of stimulatory AAV plus growth factors (right). GFAP staining shows that the SCI lesions are anatomically complete across the entire width of the spinal cord in both cases.
Note that the second depot was placed at 9 days after SCI, by which time the distal astrocyte scar border was essentially formed35. Note also that astrocytes do not migrate into the depots, potentially giving the mistaken impression of cavity formation when looking only at the GFAP channel alone. Nevertheless, examination of other fluorescence channels shows that depot sites clearly contain DAPI-stained stromal cells and BDA-positive axons. c, Large area survey images of BDA-labeled axons in composite mosaic scans of horizontal sections. In a control mouse (top) that received SCI plus empty depot, few axons reach the lesion center, almost none pass beyond, and no axons are present at 3mm. In the a treated mouse (middle) that received stimulatory AAV plus growth factors, many axons regrow through the lesion core and reach or pass 1.5mm beyond the lesion center, which is the equivalent length of a full thoracic spinal segment in mice46. Note also that there are no axons present at 3mm, demonstrating that the SCI lesion was complete and that axons that are found past the lesion center represent axon regrowth after SCI in response to the experimental manipulations. In an uninjured mice (bottom), there are many labeled axons at the distance equivalent to 3mm beyond the location of SCI in injured mice. d, Graph shows mean±SEM numbers of axon intercepts at lesion centers for all experimental groups (dots in graphs show numbers and distribution of individual mice per group). (ns not significant versus SCI-only, #P <0.01 versus SCI-only and ns versus each other, **P <0.01, ***P <0.001 versus all other groups, one-way ANOVA/Bonferroni, F (12, 57) = 22.3).
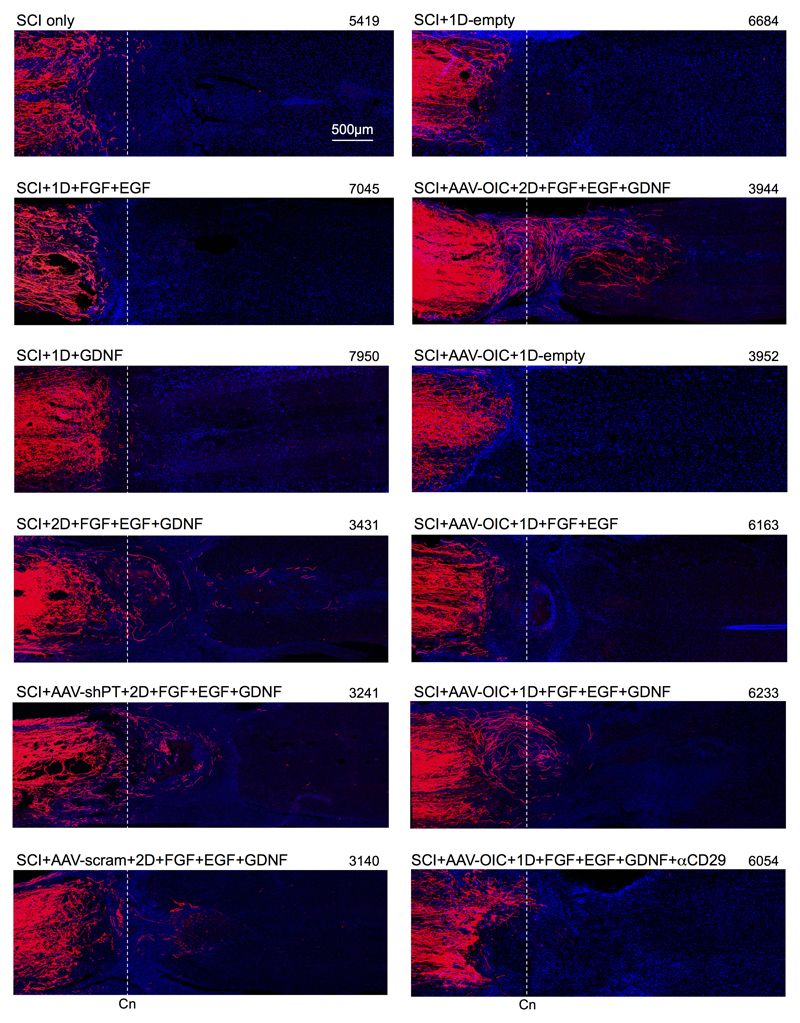
Extended Data Figure 4. BDA tract-tracing of propriospinal axons after SCI and different treatment conditions.
Survey images show tiled mosaic scans of horizontal sections from representative mice of all experimental conditions. Experimental treatment conditions are listed in the upper left of each scan. Mouse identification number is given in the upper right. Scans are oriented with their lesion centers (Cn) aligned along the dashed lines so that axon growth to or past this point can be easily compared. Axon regrowth was quantified by counting axon intercepts with lines drawn through lesion centers and at regular intervals beyond by using image analysis software. For abbreviations, see Extended Data Table 1.
Extended Data Figure 5. Stimulated, supported and chemoattracted murine propriospinal axons regrow through lesion core (LC) in contact with various substrate molecules, including putatively inhibitory CSPGs.
a, Multi-fluorescent, detail images (left) show BDA-labeled axons regrowing along and among surfaces decorated with fibronectin or collagen. Orthogonal 3-dimensional (3D) confocal images of boxed area (right) show direct contact between BDA-labeled axons and fibronectin or collagen. Graphs show quantification of fibronectin or collagen and dot blots (mean±SEM of density, n = 4 mice per group).). (ns non-significant, *P <0.01, one-way ANOVA/Bonferroni, F (3, 12) = 13.0 for Fibronectin dot blot and F (3, 12) = 10.2 for Collagen dot blot). b, Multi-fluorescent, detail images (left) show BDA-labeled axons regrowing along and among surfaces decorated with brevican (BCAN). Orthogonal 3-dimensional (3D) confocal image of boxed area (right) shows direct contact between BDA-labeled axons and BCAN. c, Multi-fluorescent, orthogonal 3-dimensional (3D) confocal images show BDA-labeled axons regrowing along and in direct contact with surfaces decorated with both CSPG4 (also known as NG2) and laminin (arrows).
Extended Data Figure 6. BDA tract-tracing of propriospinal axon regrowth after SCI along and among different cell types.
a, Multiple channel fluorescent images show the same BDA-labelled axon transitioning from contact with GFAP-positive astrocytes in proximal scar border (PB) to contact with CD13-positive stromal cells in lesion core (LC). Numbers and arrows indicate the same locations in images of different combinations of fluorescent markers. 1, axons in contact with astrocyte processes. 2, axons in contact with both astrocyte process and stromal cell. 3, axons in contact with stromal cell. b, Multiple channel fluorescent images show axons regrowing along, and following the trajectory of, stromal cells (S) while circumventing clusters of inflammatory cells (Inf) in lesion core. c, Multiple channel fluorescent images show axons (A) regrowing along the trajectory of blood vessels (bv) in contact with stromal cells (S) that are present on endothelia (E) positive for platelet endothelial cell adhesion molecule (PECAM). d, Multiple channel fluorescent images show BDA-labeled propriospinal axons and cells expressing the combinatorial Schwann cell markers, p75 and SOX10, in lesion core. Also visible are some stromal cells expressing only SOX10 but not p75. Numbers and arrows indicate the same locations in images of different combinations of fluorescent markers: 1, axons in partial contact with cells expressing Schwann cell markers; 2, axons not in detectable contact with Schwann cells. Note that some axons are partially in contact with, and partially not in contact with, Schwann cells in lesion core.
Extended Data Figure 7. Comparison of genomic data from astrocytes and non-astrocyte cells from mice with or without FGF+EGF after SCI.
a, Heat maps showing significantly differentially expressed genes (DEG) derived by RNA-Seq of mRNAs from spinal cord tissue of mice treated with SCI+1D+FGF+EGF (D+GF), and the expression of these genes in mice treated with SCI+1D-empty (D-Em), at two weeks after SCI. Data are shown for mRNAs derived selectively from astrocytes or from all other cell types (non-astrocytes), isolated as previously described19. Red upregulated, green downregulated relative to SCI-only. (n = 3 mice per group. FDR<0.1 for differential expression). b, Total numbers of significant DEGs in astrocytes and non-astrocytes from mice as shown in heatmap in panel a. Red and green numerical values indicate significantly upregulated and downregulated genes, respectively. Relative to SCI-only, over 900 astrocyte genes and over 300 non-astrocyte genes were significantly up- or down-regulated in mice with 12 days of growth factor treatment, which were not significantly altered by treatment with empty depots. c, Top five networks of genes significantly altered by D+GF that were not altered by D–empty after SCI relative to SCI-only, as identified by unbiased analysis (Ingenuity ®). RNAseq data are available at NCBI’s Gene Expression Omnibus repository (GSE111529).
Extended Data Figure 8. Red-fluorescent protein (RFP) tract-tracing of propriospinal (PrSp) axons after SCI and different treatment conditions in rats.
a,b, Large area survey images of RFP-labeled axons in composite mosaic scans of horizontal sections. Tracer-injection sites are denoted by RFP-PrSp. a, Multiple channel fluorescent images showing BDA-labeled axons and GFAP-labelled astrocytes that demarcate astrocyte scar proximal borders (PB) and distal borders (DB) around the non-neural lesion core (LC) after SCI. GFAP-staining shows that SCI lesions were anatomically complete across the entire width of the spinal cord, with large lesion cores in a control rat (left), and in a rat treated with stimulatory AAV plus growth factors (right). In the control rat, few axons reach the lesion center or beyond. In the treated rat, many axons regrow through the lesion core and reach or pass 3mm beyond the lesion center, which is the equivalent length of a full thoracic spinal segment in rats47. b, Completeness of SCI lesions was confirmed in all rats used in qualitative and quantitative evaluations by confirming that no axons were present at 5mm or more past lesion centers, as shown here for control rats (top) and treated rats (middle), whereas in uninjured rats, abundant labeled axons are present at an equivalent distance past the RFP injection site.
Extended Data Figure 9. Growth factor induction of laminin, comparison of propriospinal and serotonin axons, and locomotor evaluations of rats after SCI without and with treatments.
a,b, Survey images show laminin 1 immunohistochemistry (IHC) in tiled mosaic scans of horizontal sections from representative rats. b, Top, mean±SEM quantification of laminin immunohistochemistry in rats as % area per linear µm3, (n = 4 rats per group, dark colored lines = means, lighter colored shaded areas = SEM, colors indicate experimental groups as shown in graph below). Bottom, total laminin in rats summarized as mean±SEM area under the curve as calculated from graph above. (ns non-significant, **P <0.005, one-way ANOVA/Bonferroni, F (2, 9) = 15.04). c, Multiple channel fluorescent images show RFP-labeled propriospinal axons and immunohistochemically stained serotonin (5HT) axons in rats after SCI+AAV-OIC+2D+FGF+EGF+GDNF. The two survey images on left show the same field with different filters. Note in the survey images on the left, and in the higher magnification image in center, that RFP-labeled propriospinal axons regrow robustly past the astrocyte scar proximal border (PB) and through the non-neural lesion core (LC). In contrast, 5HT axons did not regrow into or through the LC. Image on right shows an orthogonal 3-dimensional (3D) confocal detail from an area proximal to the SCI lesion, demonstrating a complete lack of overlap of RFP-labeling and 5HT immunohistochemistry, indicating that RFP-tracing did not label 5HT axons of passage. d, mean±SEM open field hindlimb locomotor score at various times after SCI in rats assessed using a 6-point scale where 5 is normal walking and 0 is no movement of any kind. (n= 6 per rats group).
Extended Data Table 1. Abbreviations.
| 1D | animals receiving 1 hydrogel depot |
| 2D | animals receiving 2 hydrogel depots |
| αCD29 | anti-CD29 function-blocking antibody |
| AAV | adeno-associated virus |
| BCAN | brevican |
| BDA | biotinylated dextran amine (axon tract tracer) |
| CD29 | integrin beta-1 |
| Cn | lesion center |
| CNTF | ciliary-derived neurotrophic factor |
| CSPG | chondroitin sulfate proteoglycan |
| D1 | hydrogel depot in lesion center |
| D2 | hydrogel depot in spared neural tissue |
| EGF | epidermal growth factor |
| FGF2 | fibroblast growth factor 2 (basic) |
| GDNF | glial derived neurotrophic factor |
| GFP | green fluorescent protein |
| IGF | insulin-like growth factor |
| Inf | Inflammatory cells |
| OIC | osteopontin, IGF plus CNTF |
| PECAM | platelet endothelial cell adhesion molecule |
| PrSp | propriospinal neurons |
| PTEN | phosphatase and tensin homolog |
| RFP | red fluorescent protein (axon tract tracer) |
| shPTEN | short hairpin RNA against PTEN |
| S | stromal cells |
| Syn | synaptophysin |
| TP | total protein |
Supplementary Material
Acknowledgements
This work was supported by US National Institutes of Health (NS084030 to M.V.S., F32NS096858 to J.E.B., NS096294 to Z.H., and NS062691 to G.Cop.); Dr. Miriam and Sheldon G. Adelson Medical Foundation (M.V.S., Z.H., T.J.D. and G.Cop.); International Foundation for Research in Paraplegia (146 to M.A.A. and G.Cou.); ALARME Foundation (531066 to M.A.A. and G.Cou.); Association Song Taaba (M.A.A.); Craig H. Neilsen Foundation (381357 to T.M.O’S. and M.V.S); Consolidator Grant from the European Research Council [ERC-2015-CoG HOW2WALKAGAIN 682999] (G.Cou.); Paralyzed Veterans Foundation of America (3080 to J.E.B. and M.V.S.); Swiss National Science Foundation (323530-164220 to S.L.B and G.Cou.); Microscopy Core Resource of UCLA Broad Stem Cell Research Center; Microscopy Core Resource of the Wyss Center for Bio and Neuroengineering; and Wings for Life (M.V.S., J.E.B., and Z.H.).
Footnotes
Data availability statement
Files of source data of individual values for all quantitative figures are provided with the paper. Raw images of dot blots are provided as Supplementary figure 1. RNAseq data are available at NCBI’s Gene Expression Omnibus repository (GSE111529). Other data that support the findings of this study are available on reasonable request from the corresponding authors.
Author contributions M.A.A., T.M.O’S., J.E.B., T.J.D., Z.H., G.Cou., M.V.S. designed experiments; M.A.A., T.M.O’S., J.E.B., Y.A., S.L.B., A.M.B., N.D.J., A.R., A.L.W., C.W. conducted experiments; M.A.A., T.M.O’S, Y.A., J.E.B., N.D.J, J.H.K., B.K., R.K., G.Cop., M.V.S. analyzed data. M.A.A., T.M.O’S, J.E.B., T.J.D., G.Cou., M.V.S. prepared the manuscript.
Author information
The authors declare no competing financial interests.
References
- 1.Tessier-Lavigne M, Goodman CS. The molecular biology of axon guidance. Science. 1996;274:1123–1133. doi: 10.1126/science.274.5290.1123. [DOI] [PubMed] [Google Scholar]
- 2.He Z, Jin Y. Intrinsic Control of Axon Regeneration. Neuron. 2016;90:437–451. doi: 10.1016/j.neuron.2016.04.022. [DOI] [PubMed] [Google Scholar]
- 3.O'Shea TM, Burda JE, Sofroniew MV. Cell biology of spinal cord injury and repair. J Clin Invest. 2017;127:3259–3270. doi: 10.1172/JCI90608. [DOI] [PMC free article] [PubMed] [Google Scholar]
- 4.Sofroniew MV. Disecting spinal cord regeneration. Nature. 2018;557:343–350. doi: 10.1038/s41586-018-0068-4. [DOI] [PubMed] [Google Scholar]
- 5.Goldberg JL, Klassen MP, Hua Y, Barres BA. Amacrine-signaled loss of intrinsic axon growth ability by retinal ganglion cells. Science. 2002;296:1860–1864. doi: 10.1126/science.1068428. [DOI] [PubMed] [Google Scholar]
- 6.Bradke F, Fawcett JW, Spira ME. Assembly of a new growth cone after axotomy: the precursor to axon regeneration. Nat Rev Neurosci. 2012;13:183–193. doi: 10.1038/nrn3176. [DOI] [PubMed] [Google Scholar]
- 7.Tedeschi A, et al. The Calcium Channel Subunit Alpha2delta2 Suppresses Axon Regeneration in the Adult CNS. Neuron. 2016;92:419–434. doi: 10.1016/j.neuron.2016.09.026. [DOI] [PubMed] [Google Scholar]
- 8.Geoffroy CG, Hilton BJ, Tetzlaff W, Zheng B. Evidence for an Age-Dependent Decline in Axon Regeneration in the Adult Mammalian Central Nervous System. Cell reports. 2016;15:238–246. doi: 10.1016/j.celrep.2016.03.028. [DOI] [PMC free article] [PubMed] [Google Scholar]
- 9.Puttagunta R, et al. PCAF-dependent epigenetic changes promote axonal regeneration in the central nervous system. Nature communications. 2014;5 doi: 10.1038/ncomms4527. 3527. [DOI] [PubMed] [Google Scholar]
- 10.Letourneau PC. Cell-to-substratum adhesion and guidance of axonal elongation. Dev Biol. 1975;44:92–101. doi: 10.1016/0012-1606(75)90379-6. [DOI] [PubMed] [Google Scholar]
- 11.Gundersen RW. Response of sensory neurites and growth cones to patterned substrata of laminin and fibronectin in vitro. Dev Biol. 1987;121:423–431. doi: 10.1016/0012-1606(87)90179-5. [DOI] [PubMed] [Google Scholar]
- 12.Sperry RW. Chemoaffinity in the orderly growth of nerve fiber patterns and connections. Proc Natl Acad Sci USA. 1963;50:703–710. doi: 10.1073/pnas.50.4.703. [DOI] [PMC free article] [PubMed] [Google Scholar]
- 13.Campenot RB. Local control of neurite development by nerve growth factor. Proc Natl Acad Sci U S A. 1977;74:4516–4519. doi: 10.1073/pnas.74.10.4516. [DOI] [PMC free article] [PubMed] [Google Scholar]
- 14.Duan X, et al. Subtype-specific regeneration of retinal ganglion cells following axotomy: effects of osteopontin and mTOR signaling. Neuron. 2015;85:1244–1256. doi: 10.1016/j.neuron.2015.02.017. [DOI] [PMC free article] [PubMed] [Google Scholar]
- 15.Bei F, et al. Restoration of Visual Function by Enhancing Conduction in Regenerated Axons. Cell. 2016;164:219–232. doi: 10.1016/j.cell.2015.11.036. [DOI] [PMC free article] [PubMed] [Google Scholar]
- 16.Siebert JR, Middelton FA, Stelzner DJ. Intrinsic response of thoracic propriospinal neurons to axotomy. BMC neuroscience. 2010;11:69. doi: 10.1186/1471-2202-11-69. [DOI] [PMC free article] [PubMed] [Google Scholar]
- 17.Deng LX, et al. A novel growth-promoting pathway formed by GDNF-overexpressing Schwann cells promotes propriospinal axonal regeneration, synapse formation, and partial recovery of function after spinal cord injury. J Neurosci. 2013;33:5655–5667. doi: 10.1523/JNEUROSCI.2973-12.2013. [DOI] [PMC free article] [PubMed] [Google Scholar]
- 18.Nowak AP, et al. Rapidly recovering hydrogel scaffolds from self-assembling diblock copolypeptide amphiphiles. Nature. 2002;417:424–428. doi: 10.1038/417424a. [DOI] [PubMed] [Google Scholar]
- 19.Anderson MA, et al. Astrocyte scar formation aids central nervous system axon regeneration. Nature. 2016;532:195–200. doi: 10.1038/nature17623. [DOI] [PMC free article] [PubMed] [Google Scholar]
- 20.Courtine G, et al. Recovery of supraspinal control of stepping via indirect propriospinal relay connections after spinal cord injury. Nature Med. 2008;14:69–74. doi: 10.1038/nm1682. [DOI] [PMC free article] [PubMed] [Google Scholar]
- 21.van den Brand R, et al. Restoring voluntary control of locomotion after paralyzing spinal cord injury. Science. 2012;336:1182–1185. doi: 10.1126/science.1217416. [DOI] [PubMed] [Google Scholar]
- 22.Jacobi A, et al. FGF22 signaling regulates synapse formation during post-injury remodeling of the spinal cord. The EMBO journal. 2015;34:1231–1243. doi: 10.15252/embj.201490578. [DOI] [PMC free article] [PubMed] [Google Scholar]
- 23.Zukor K, et al. Short hairpin RNA against PTEN enhances regenerative growth of corticospinal tract axons after spinal cord injury. J Neurosci. 2013;33:15350–15361. doi: 10.1523/JNEUROSCI.2510-13.2013. [DOI] [PMC free article] [PubMed] [Google Scholar]
- 24.Plantman S, et al. Integrin-laminin interactions controlling neurite outgrowth from adult DRG neurons in vitro. Mol Cell Neurosci. 2008;39:50–62. doi: 10.1016/j.mcn.2008.05.015. [DOI] [PubMed] [Google Scholar]
- 25.Kashpur O, LaPointe D, Ambady S, Ryder EF, Dominko T. FGF2-induced effects on transcriptome associated with regeneration competence in adult human fibroblasts. BMC Genomics. 2013;14:656. doi: 10.1186/1471-2164-14-656. [DOI] [PMC free article] [PubMed] [Google Scholar]
- 26.White RE, Yin FQ, Jakeman LB. TGF-alpha increases astrocyte invasion and promotes axonal growth into the lesion following spinal cord injury in mice. Exp Neurol. 2008;214:10–24. doi: 10.1016/j.expneurol.2008.06.012. [DOI] [PMC free article] [PubMed] [Google Scholar]
- 27.Tuszynski MH, Steward O. Concepts and methods for the study of axonal regeneration in the CNS. Neuron. 2012;74:777–791. doi: 10.1016/j.neuron.2012.05.006. [DOI] [PMC free article] [PubMed] [Google Scholar]
- 28.Cregg JM, et al. Functional regeneration beyond the glial scar. Exp Neurol. 2014;253:197–207. doi: 10.1016/j.expneurol.2013.12.024. [DOI] [PMC free article] [PubMed] [Google Scholar]
- 29.Tom VJ, Steinmetz MP, Miller JH, Doller CM, Silver J. Studies on the development and behavior of the dystrophic growth cone, the hallmark of regeneration failure, in an in vitro model of the glial scar and after spinal cord injury. J Neurosci. 2004;24:6531–6539. doi: 10.1523/JNEUROSCI.0994-04.2004. [DOI] [PMC free article] [PubMed] [Google Scholar]
- 30.Richardson PM, Issa VM. Peripheral injury enhances central regeneration of primary sensory neurones. Nature. 1984;309:791–793. doi: 10.1038/309791a0. [DOI] [PubMed] [Google Scholar]
- 31.Alto LT, et al. Chemotropic guidance facilitates axonal regeneration and synapse formation after spinal cord injury. Nat Neurosci. 2009;12:1106–1113. doi: 10.1038/nn.2365. [DOI] [PMC free article] [PubMed] [Google Scholar]
- 32.Asboth L, et al. Cortico-reticulo-spinal circuit reorganization enables functional recovery after severe spinal cord contusion. Nat Neurosci. 2018;21:576–588. doi: 10.1038/s41593-018-0093-5. [DOI] [PubMed] [Google Scholar]
- 33.Faulkner JR, et al. Reactive astrocytes protect tissue and preserve function after spinal cord injury. J Neurosci. 2004;24:2143–2155. doi: 10.1523/JNEUROSCI.3547-03.2004. [DOI] [PMC free article] [PubMed] [Google Scholar]
- 34.Herrmann JE, et al. STAT3 is a critical regulator of astrogliosis and scar formation after spinal cord injury. J Neurosci. 2008;28:7231–7243. doi: 10.1523/JNEUROSCI.1709-08.2008. [DOI] [PMC free article] [PubMed] [Google Scholar]
- 35.Wanner IB, et al. Glial scar borders are formed by newly proliferated, elongated astrocytes that interact to corral inflammatory and fibrotic cells via STAT3-dependent mechanisms after spinal cord injury. J Neurosci. 2013;33:12870–12886. doi: 10.1523/JNEUROSCI.2121-13.2013. [DOI] [PMC free article] [PubMed] [Google Scholar]
- 36.Zhang S, et al. Tunable diblock copolypeptide hydrogel depots for local delivery of hydrophobic molecules in healthy and injured central nervous system. Biomaterials. 2014;35:1989–2000. doi: 10.1016/j.biomaterials.2013.11.005. [DOI] [PMC free article] [PubMed] [Google Scholar]
- 37.Yang CY, et al. Biocompatibility of amphiphilic diblock copolypeptide hydrogels in the central nervous system. Biomaterials. 2009;30:2881–2898. doi: 10.1016/j.biomaterials.2009.01.056. [DOI] [PubMed] [Google Scholar]
- 38.Song B, et al. Sustained local delivery of bioactive nerve growth factor in the central nervous system via tunable diblock copolypeptide hydrogel depots. Biomaterials. 2012;33:9105–9116. doi: 10.1016/j.biomaterials.2012.08.060. [DOI] [PubMed] [Google Scholar]
- 39.Bush TG, et al. Leukocyte infiltration, neuronal degeneration and neurite outgrowth after ablation of scar-forming, reactive astrocytes in adult transgenic mice. Neuron. 1999;23:297–308. doi: 10.1016/s0896-6273(00)80781-3. [DOI] [PubMed] [Google Scholar]
- 40.Avnur Z, Geiger B. Immunocytochemical localization of native chondroitin-sulfate in tissues and cultured cells using specific monoclonal antibody. Cell. 1984;38:811–822. doi: 10.1016/0092-8674(84)90276-9. [DOI] [PubMed] [Google Scholar]
- 41.Hughes EG, Kang SH, Fukaya M, Bergles DE. Oligodendrocyte progenitors balance growth with self-repulsion to achieve homeostasis in the adult brain. Nat Neurosci. 2013;16:668–676. doi: 10.1038/nn.3390. [DOI] [PMC free article] [PubMed] [Google Scholar]
- 42.Faul F, Erdfelder E, Lang AG, Buchner A. G*Power 3: a flexible statistical power analysis program for the social, behavioral, and biomedical sciences. Behavior research methods. 2007;39:175–191. doi: 10.3758/bf03193146. [DOI] [PubMed] [Google Scholar]
- 43.Romero-Calvo I, et al. Reversible Ponceau staining as a loading control alternative to actin in Western blots. Analytical biochemistry. 2010;401:318–320. doi: 10.1016/j.ab.2010.02.036. [DOI] [PubMed] [Google Scholar]
- 44.Sanz E, et al. Cell-type-specific isolation of ribosome-associated mRNA from complex tissues. Proc Natl Acad Sci U S A. 2009;106:13939–13944. doi: 10.1073/pnas.0907143106. [DOI] [PMC free article] [PubMed] [Google Scholar]
- 45.James ND, et al. Conduction failure following spinal cord injury: functional and anatomical changes from acute to chronic stages. J Neurosci. 2011;31:18543–18555. doi: 10.1523/JNEUROSCI.4306-11.2011. [DOI] [PMC free article] [PubMed] [Google Scholar]
- 46.Harrison M, et al. Vertebral landmarks for the identification of spinal cord segments in the mouse. NeuroImage. 2013;68:22–29. doi: 10.1016/j.neuroimage.2012.11.048. [DOI] [PubMed] [Google Scholar]
- 47.Watson C, Paxinos G, Kayalioglu G. The Spinal Cord. Elsevier; 2008. [Google Scholar]
Associated Data
This section collects any data citations, data availability statements, or supplementary materials included in this article.


