Abstract
MRI parametric mapping, including T2 mapping, can quantitatively characterize tissue properties and is an important MRI procedure in biomedical research and studies of diseases [1-3]. However, the accuracy, quality, and signal-to-noise ratio (SNR) of MRI parametric mapping may be negatively impacted by Rician noise in multi-contrast MRI data [4]. As such, it is important to develop a post-processing method to minimize the negative impact of Rician noise. In this study, we report a new parametric-contrast-matched principal component analysis (PCM-PCA) denoising method that involves 1) identifying voxels with similar T2 decay characteristics and 2) using the principal component analysis (PCA) to denoise multi-contrast MRI data along the echo time (TE) dimension. We additionally evaluated the effects of integrating Rician bias correction and the new PCM-PCA method. In this study, we mathematically added Rician noise at various levels to human brain MRI data and performed different combinations of denoising and Rician bias correction on the magnitude-valued images. We found that MRI denoising using the PCM-PCA method resulted in improved image quality, SNR, and accuracy of the measured T2 relaxation time constants. Additionally, we found that for data with low SNR (e.g., 1.5 or lower), Rician bias correction further improved image quality and T2 mapping accuracy. In summary, our experimental results demonstrated that the new PCM-PCA denoising method and Rician bias correction adequately improve multi-contrast MRI quality and T2 parametric mapping accuracy.
Keywords: MRI, parametric mapping, T2 mapping, denoising, Rician bias correction
Introduction
Parametric T2 mapping based on multi-TE MRI data is very useful in quantitatively and noninvasively characterizing properties of tissue, such as the gray matter, white matter, and cerebrospinal fluid in the brain. T2 mapping has important clinical applications in studying various diseases, such as Parkinson’s disease [1], epilepsy [2], and multiple sclerosis [3]. While T2 mapping is important clinically, the long scan times needed to obtain multi-TE and multi- contrast MRI data (e.g., multiple sets of spin-echo MRI corresponding to different TE values) is not always feasible for clinical applications [5]. Therefore, there have been significant efforts in developing T2 mapping protocols that require shorter scan time [5-10] and/or faster reconstruction methods [11], making T2 mapping more feasible for clinical diagnosis. However, data obtained with any accelerated acquisition scheme usually have significantly lower SNR, which may negatively impact the quality and accuracy of MRI parametric mapping [4].
Currently, there are several denoising methods, such as kernel smoothing, that could be used to improve the SNR of MRI data. However, these methods do not necessarily preserve anatomical resolvability. Additionally, a simple kernel smoothing procedure may not remove signal bias resulting from Rician noise in MRI data of low SNR [4,12,13].
Inspired by a recently implemented diffusion-matched principal component analysis (DM-PCA) method [14], here we develop a new parametric-contrast-matched principal component analysis denoising method (PCM-PCA) that involves 1) identifying a group of voxels that have similar T2 decay properties and 2) performing PCA based denoising along the echo time (TE) dimension of magnitude-valued multi-contrast MRI data. Additionally, we present the results of integrating Rician bias correction [12] and PCM-PCA processing to further improve the accuracy and quality of MRI parametric mapping.
Methods
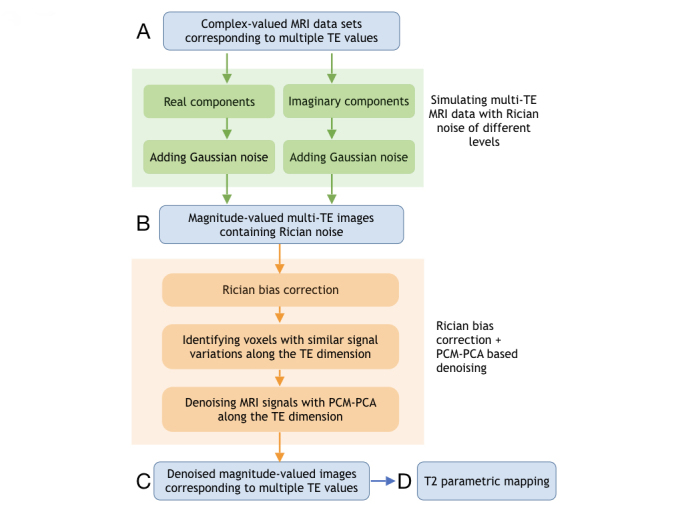
The experimental design, which evaluates our new PCM-PCA and Rician bias correction methods, is schematically illustrated in Figure 1, as described below:
Figure 1.

A schematic diagram showing the process of creating hybrid simulation data with Rician noise (green arrows and green boxes) and correcting Rician bias and noise with PCM-PCA (orange).
Creation of Hybrid Simulation Data
The input of our study are multiple sets of T2-weighted MRI data corresponding to different TE values (10, 15, 20, 25, 35, 40, 60, 80, 100, 120, 140 msec) that were suitable for measuring T2 relaxation time constants for gray-matter and white-matter of the brain (Box A of Figure 1). The multi-TE MRI data were acquired from healthy adult volunteers, at a 3 Tesla GE scanner (General Electric Healthcare, Waukesha, WI, USA), using 8-shot spin-echo echo-planar imaging pulse sequence. Other scan parameters included field of view = 24×24 cm2, matrix size = 192×192, axial-plane slice thickness = 4 mm, slice number = 28, and repetition time = 5 sec.
Hybrid simulation data were created by mathematically adding noise to the experimentally acquired complex-valued multi-contrast MRI data (Box A of Figure 1). Specifically, Gaussian noise were added to both real- and imaginary-components of human brain MRI data. By combining real and imaginary-components with added Gaussian noise, magnitude-valued MRI data affected by Rician noise were simulated (Box B of Figure 1). In this study, five hybrid simulation datasets corresponding to different SNR levels (SNR = 1, 1.25, 1.5, 1.75 and 2: in spin-echo images with TE = 140 msec) were produced.
Rician Bias Correction
It has been shown in previous studies that for MRI data with low SNR, the noise in magnitude-valued MRI images has a Rician distribution [4,12]. At low SNR values (e.g., < 2), this Rician distribution creates a significant signal bias in the magnitude-valued data, which may lead to inaccuracy in MRI parametric mapping.
Based on the approach reported by Miller and Joseph [12], we implemented a Rician bias correction procedure comprising 1) calculating the mean value of Rician noise (measured from a 20×20 voxel region in the background), 2) subtracting the square of the mean Rician noise from the square of the magnitude-valued signals (i.e., the power signals), on a voxel-by-voxel basis, of the entire images, and 3) converting noise-corrected power images to noise-corrected image (with a square-root operation).
Identifying Voxels with Similar Signal Variations in the TE Dimension
A main strength of our novel denoising procedure is that, instead of averaging signals in the nearest neighbors that may have different T2 relaxation time constants, voxels (which may not be necessarily nearest neighboring) with very similar T2 decaying patterns are first identified and then grouped for denoising (see the next section). With this approach, the denoised data will not be undesirably blurred, and the anatomic resolvability will not be compromised.
Specifically, for each targeted voxel to be denoised, we used an L1 norm as a quantitative measure to identify a group of voxels that have the most similar signal variations patterns across different TE values. We chose to denoise signals across 64 parametric-contrast-matched voxels because of the following two reasons. First, this number is comparable to the kernel size in conventional nearest-neighboring smoothing procedures (e.g., 64 is between 3x3x3=27 voxels and 5x5x5=125 voxels, which are typical in conventional kernel smoothing). Second, we found that, in T2-weighted MRI data of human brains, we could reliably identify at least 64 voxels that are homogenous and have similar T2 decay properties.
Denoising MRI signals with PCA Along the TE Dimension
After selecting a group of parametric-contrast-matched voxels (for a specific target voxel to be smoothed), we performed PCA on the matched voxels to identify the signal variation patterns across TEs that best represent the T2 decaying curve for the group of matched voxels. We found that the first two principal components could explain 90 percent to 95 percent of the signal variation across the TE dimension in the matched voxels. Therefore, the first two principal components, which contained the information on T2 decay of matched voxels, were kept in our denoising procedure. Other higher principal components mainly contained random noise, and were truncated in post-processing. The modified PCA signals were then transformed back to the image-domain, and the denoised image-domain signals at multiple TE values for the target voxels were stored. The above-mentioned process was performed for every voxel (as the target voxel to be denoised) in the input data. The output of our data processing is a set of denoised MRI data corresponding to multiple TE values (Box C of Figure 1).
T2 Parametric Mapping
Multi-TE MRI data after Rician bias correction and PCM-PCA denoising (Box C of Figure 1) were processed with an exponential fitting procedure, to quantify the T2 relaxation time constants on a voxel-by-voxel basis.
Evaluating the Performance of the Developed Post-Processing Methods for T2 Quantification
T2 parametric maps derived from the denoised MRI data were then compared with the ground truth T2 maps, which were calculated from MRI data without mathematically added noise (i.e., Box A of Figure 1). To quantify the performance of the developed denoising method, the percent error in T2 measurement of white-matter was calculated on a voxel-by-voxel basis. Voxel-wise percent error was calculated as the absolute value of the difference between T2 values of the ground truth and denoised signals, divided by the T2 value of the ground truth and multiplied by 100 to give a percent.
For comparison, T2 maps derived from 1) noisy MRI data (Box B in Figure 1), 2) Rician bias corrected data (without denoising), and 3) PCM-PCA denoised data (without Rician bias correction) were also compared with the ground truth.
Evaluating the PCM-PCA Method in T2*-weighted MRI Data
To further demonstrate the robustness of the developed method in processing other types of MRI data, the PCM-PCA denoising procedure was also applied to process 3 sets of multi-echo gradient-echo T2*-weighted imaging data obtained from three healthy adult volunteers (with a 3 Tesla GE scanner). Scan parameters included field of view = 25.6×25.6 cm2, matrix size = 256×256, axial-plane slice thickness = 1 mm, slice number = 40, repetition time = 100 msec, and TE (for 7 echoes) = 4.3, 12.1, 19.9, 27.8, 35.6, 43.4 and 51.3 msec.
Implementation of the Post-Processing Methods
The Rician bias correction and PCM-PCA methods were implemented with the Julia language (https://julialang.org/) on a personal computer and the high-performance computer at the University of Arizona (https://it.arizona.edu/service/high-performance-computing) for performing hybrid simulation and processing MRI data.
Results
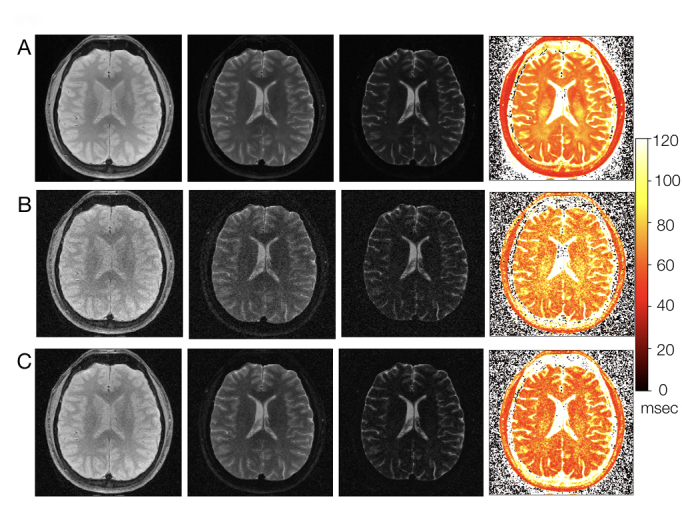
The results of performing Rician bias correction and PCM-PCA denoising on multi-TE MRI data are shown in Figure 2. Figure 2A shows the ground truth magnitude-valued images (the first three panels: at TE = 10, 80, and 120 msec, without mathematically added noise) and the T2 parametric map (the fourth panel: with its display scale shown in the colorbar) derived from ground truth images at 11 TE values. Figure 2B shows the magnitude-valued images with mathematically added Rician noise (i.e., Box B in Figure 1) and the derived T2 parametric map. It can be seen that the Rician noise not only reduces the SNR of multi-contrast MRI data but also results in inaccuracy in the derived T2 map (e.g., higher T2 values in Figure 2B as compared with Figure 2A). After removing Rician bias and denoising with the PCM-PCA method, the produced multi-contrast MRI data have higher SNR (see the first three panels of Figure 2C) as compared with undenoised data (in Figure 2B). Furthermore, it can be seen that the T2 parametric map calculated from Rician-corrected and PCM-PCA-denoised images (the fourth panel of Figure 2C) is closer to the ground truth T2 map (Figure 2A) as compared with the noisy MRI based T2 map (Figure 2B).
Figure 2.

A. Ground truth multi-TE images (panel 1, 2 and 3 with TE = 10, 80, 120 msec, respectively) and T2 map (panel 4: derived from 11 TE sampling between 10 and 140 msec). B. Multi-TE images with mathematically added Rician noise (with SNR = 1.5 in images with TE = 140 msec) and the derived T2 map. C. Multi-TE images processed with Rician bias correction and PCM-PCA denoising (the first three panels) and the derived T2 map (the fourth panel).
Upon further examining the white matter surrounding the lateral ventricles, it can be seen that there is clearly reduced noise and more accurately calculated T2 values after denoising with the proposed denoising method. After adding Rician noise, the values of the T2 map (Figure 2B) in the white matter voxels surrounding the lateral ventricles are much higher than the values of the corresponding voxels in the ground truth T2 map (Figure 2A), which can be seen by the increased yellow coloration in the T2 map of Figure 2B. This is expected since adding noise raises the effective signal value of each voxel. After Rician bias correction and PCM-PCA denoising, the T2 values of the white matter surrounding the lateral ventricles (see Figure 2C) are significantly smaller and tend more toward the T2 values of the ground truth T2 map (Figure 2A), which is apparent in the change in coloration from yellow to orange-red in the T2 map after denoising (Figure 2C).
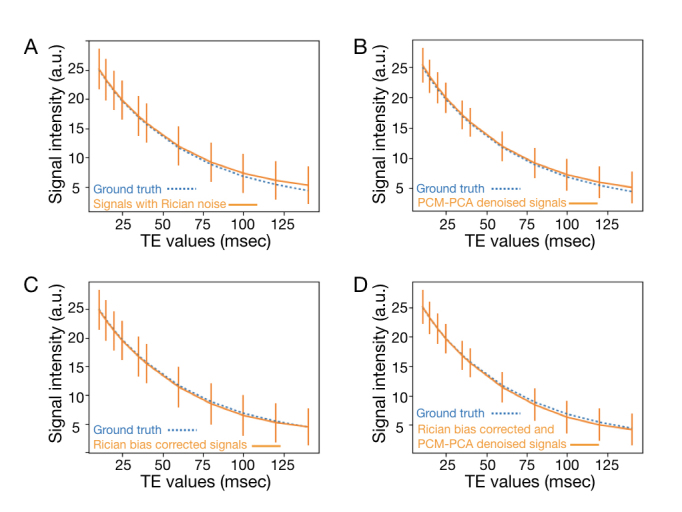
Figure 3A compares the mean signal intensities of white-matter voxels, as functions of TE, of ground truth images (blue dashed curves) and Rician noise containing images (orange solid curves: with SNR = 1.5 in images at TE 140 msec). It can be seen that the Rician noise induced signal bias is more pronounced in images at longer TE (e.g., > 75 msec). The standard deviations of white-matter signals in Rician noise containing images are presented with the orange vertical bars.
Figure 3.

A. Comparison of white-matter signals of Rician noise containing data (orange solid curve) and ground truth images (blue dashed curve) at different TE values. B. Comparison of white-matter signals of PCM-PCA denoised data (orange solid curve) and ground truth (blue dashed curve). C. White-matter signals of Rician bias corrected data (orange solid curve) and ground truth (blue dashed curve). D. White-matter signals of Rician bias corrected and PCM-PCA denoised data (orange solid curve) and ground truth (blue dashed curve).
The orange solid curve and vertical bars of Figure 3B show the means and standard deviations of white-matter signals, as functions of TEs, of MRI data that were denoised with PCM-PCA only (without Rician bias correction). The ground truth signals are shown with the blue dashed curve. It can be seen that the standard deviations of multi-TE MRI data can be reduced by the developed PCM-PCA denoising algorithm (indicated by shorter vertical bars in Figure 3B as compared with that in Figure 3A). However, without performing Rician bias correction, the signal bias remains in PCM-PCA produced data (especially in images with TE > 100 msec).
T2 signal decay of MRI data processed with only Rician bias correction (without PCM-PCA denoising) is shown with the orange solid curve in Figure 3C, in which the Rician noise induced signal bias is minimal. However, without performing PCM-PCA based denoising, the standard deviations of white-matter signals are high (at the similar level as that in Figure 3A).
The orange solid curve in Figure 3D shows the TE-dependent white-matter signals of Rician bias corrected and PCM-PCA denoised images, and the blue dashed curve shows the ground truth signals. It can be seen that both Rician noise and its induced signal bias can be reduced with an integrated post-processing pipeline. We note that the bias corrected and denoised signals (orange solid curve) are slightly lower than the ground truth signals (blue dashed signals) in images with TE = 80, 100, and 120 msec.
Table 1 compares percent errors in white-matter T2 values measured from Rician noise containing data with different SNR levels and post-processing procedures, as compared with the ground truth data. First, as shown in row B of Table 1, PCM-PCA denoising (without Rician bias correction) improves the T2 mapping accuracy for input data of all the tested SNR levels (with SNR measured from images with TE = 140 msec). The reduction in T2 percent error is more pronounced for data with lower SNR (e.g., from 77.98% to 8.40% for input data with the lowest SNR level). Second, comparison of row A and row C shows that the Rician bias correction (without PCM-PCA denoising) reduces the T2 mapping percent error when the SNR of input data (measured in images with TE = 140 msec) is 1.5 or lower. It appears that for input data with SNR of 1.75 or higher, the Rician bias correction may slightly increase the T2 mapping percent error. Row D of Table 1 further shows that, for data with SNR of 1.5 or lower, the T2 mapping percent error can be most effectively reduced after processing data with both Rician bias correction and PCM-PCA denoising. For data with SNR of 1.75 or higher, more accurate T2 mapping can be achieved by processing data with only PCM-PCA denoising but without Rician bias correction. These results agree with findings from previous studies [4,12,13].
Table 1. Percent errors in measurement of white-matter T2 relaxation time constants from data with different SNR levels (measured in images with TE = 140 msec) and post-processing procedures.
| SNR=1 | SNR=1.25 | SNR=1.5 | SNR=1.75 | SNR=2 | |
| A) Without bias correction and denoising | 77.98% | 3.49% | 2.04% | 1.36% | 0.94% |
| B) With only PCM-PCA denoising | 8.40% | 2.83% | 1.75% | 1.21% | 0.86% |
| C) With only Rician bias correction | 64.88% | 3.18% | 1.97% | 1.55% | 1.19% |
| D) With both bias correction and denoising | 8.01% | 2.13% | 1.63% | 1.36% | 1.01% |
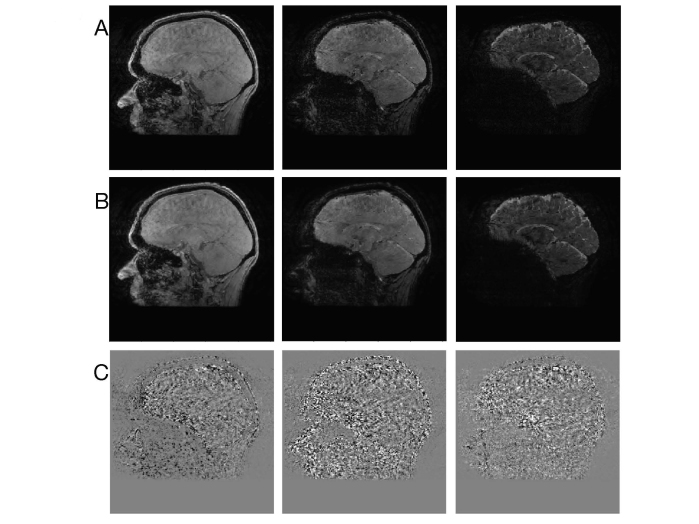
Figure 4A and B compares multi-TE gradient-echo T2*-weighted images (at TE values = 4.3, 19.9, and 51.3 msec) before and after PCM-PCA based denoising, respectively, obtained from one of our healthy volunteers. The difference between images before and after PCM-PCA denoising is shown in Figure 4C. Experimental data show that the developed PCM-PCA method can robustly suppress noise (Figure 4C) in T2*-weighted images.
Figure 4.
A. Gradient-echo T2*-weighted images at different TE values (4.3, 19.9, 51.3 msec, respectively). B. Gradient-echo images after PCM-PCA based denoising. C. The difference between multi-TE images before and after PCM-PCA based denoising.
Discussion
One of the most distinctive contributions of this work is the development of the PCM-PCA denoising method. Our experimental results have demonstrated the advantages of using a voxel-contrast matching process coupled with a PCA denoising algorithm in improving SNR and image quality while maintaining anatomic resolvability, as shown in Figure 2.
Another major contribution of this work is the addition of Rician bias correction to the data processing pipeline. The quantitative measures presented in Table 1 illustrate the benefit of integrating Rician bias correction and PCM-PCA denoising in further reducing T2 mapping error for MRI data with low SNR (e.g., SNR = 1.5 or lower in multi-contrast data at the longest TE).
For multi-contrast MRI data with higher SNR (e.g., SNR = 1.75 or higher in multi-contrast data at the longest TE), a higher T2 mapping accuracy can be achieved with PCM-PCA denoising only (without Rician bias correction).
The new PCM-PCA and the recently reported DM-PCA methods [14] are similar in that 1) both involve an L1-based matching process to find voxels with similar patterns along the contrast dimension before denoising (in contrast to conventional methods that select neighboring voxels to denoise) and 2) both use PCA to perform the denoising in the matched voxels.
However, there are also several important differences between PCM-PCA and DM-PCA. The main differences lie in the fact that 1) these methods operate on completely different types of contrast (T2/T2*/T1 parametric contrasts in the case of PCM-PCA versus diffusion-weighted imaging in the case of DM-PCA), 2) the DM-PCA method needs to utilize complex-valued data by denoising in the real- and imaginary-domains before obtaining a denoised magnitude-valued image, whereas the PCM-PCA method is directly applicable to magnitude-valued data, and 3) Rician bias correction is explicitly performed in our new PCM-PCA method.
For each voxel to be denoised, 64 parametric-contrast-matched voxels were identified based on L1 in our current implementation. However, in clinical MRI data with a small lesion or a small tumor, the number of voxels in the lesion could be smaller than 64; and in this case denoising lesion signals with 64 parametric-contrast-matched voxels might result in undesirable partial volume effect. The performance of the developed PCM-PCA denoising procedure in clinical MRI data (e.g., with tumors of different sizes) should be evaluated in future studies.
Our data processing pipeline required about 5 minutes to perform Rician bias correction, denoise data with the PCM-PCA method, and compute T2 parametric maps for a 4D T2-weighted MRI data set of 192×192×28×11 matrix size using a Julia program on a personal computer (16GB memory; 4-core 2.7 GHz CPU). Data processing time was less than 1 min when being performed in a single node of our high-performance computer (28-core CPU).
In conclusion, we report a novel PCM-PCA denoising method that can adequately improve the SNR, image quality, and accuracy of T2 parametric mapping. The developed PCM-PCA denoising method can be immediately applied to denoise other types of multi-contrast MRI data, such as T1-weighted images obtained with different inversion recovery time for T1 parametric mapping.
Acknowledgments
This research is supported by NIH R01 NS102220 (NKC).
Glossary
- MRI
magnetic resonance imaging
- SNR
signal-to-noise ratio
- PCA
principal component analysis
- PCM-PCA
parametric-contrast-matched principal component analysis
- TE
echo time
Author Contributions
Christa Sonderer developed the post-processing algorithm, implemented the data processing procedure, analyzed MRI data, created figures, and drafted the manuscript. Nan-kuei Chen developed the post-processing algorithm, implemented parts of the reconstruction procedures, acquired MRI data, and edited the manuscript.
References
- Antonini A, Leenders KL, Meier D, Oertel WH, Boesiger P, Anliker M. T2 relaxation time in patients with Parkinson’s disease. Neurology. 1993;43:697–700. [DOI] [PubMed] [Google Scholar]
- Townsend TN, Bernasconi N, Pike GB, Bernasconi A. Quantitative analysis of temporal lobe white matter T2 relaxation time in temporal lobe epilepsy. Neuroimage. 2004;23:318–24. [DOI] [PubMed] [Google Scholar]
- MacKay AL, Vavasour IM, Rauscher A, Kolind SH, Madler B, Moore GR, et al. MR relaxation in multiple sclerosis. Neuroimaging Clin N Am. 2009;19:1–26. [DOI] [PubMed] [Google Scholar]
- Gudbjartsson H, Patz S. The Rician distribution of noisy MRI data. Magn Reson Med. 1995;34:910–4. [DOI] [PMC free article] [PubMed] [Google Scholar]
- Chu ML, Chang HC, Oshio K, Chen NK. Single-Shot T2 Mapping Protocol Based on Echo- Split Gradient-Spin-Echo Acquisition and Parametric Multiplexed Sensitivity Encoding Based on Projection Onto Convex Sets Reconstruction. Magn Reson Med. 2018;79:383–93. [DOI] [PubMed] [Google Scholar]
- Hennig J, Nauerth A, Friedburg H. RARE imaging: a fast imaging method for clinical MR. Magn Reson Med. 1986;3:823–33. [DOI] [PubMed] [Google Scholar]
- Feng L, Otazo R, Jung H, Jensen JH, Ye JC, Sodickson DK, et al. Accelerated cardiac T2 mapping using breath-hold multiecho fast spin-echo pulse sequence with k-t FOCUSS. Magn Reson Med. 2011;65:1661–9. [DOI] [PMC free article] [PubMed] [Google Scholar]
- Petzschner FH, Ponce IP, Blaimer M, Jakob PM, Breuer FA. Fast MR parameter mapping using k-t principal component analysis. Magn Reson Med. 2011;66:706–16. [DOI] [PubMed] [Google Scholar]
- Hennig J. Multiecho imaging sequences with low refocusing flip angles. J Magn Reson. 1988;78:397–407. [Google Scholar]
- Sussman MS, Vidarsson L, Pauly JM, Cheng HL. A technique for rapid single-echo spin- echo T2 mapping. Magn Reson Med. 2010;64:536–45. [DOI] [PubMed] [Google Scholar]
- Doneva M, Bornert P, Eggers H, Stehning C, Senegas J, Mertins A. Compressed sensing reconstruction for magnetic resonance parameter mapping. Magn Reson Med. 2010;64:1114–20. [DOI] [PubMed] [Google Scholar]
- Miller AJ, Joseph PM. The use of power images to perform quantitative analysis on low SNR MR images. Magn Reson Imaging. 1993;11:1051–6. [DOI] [PubMed] [Google Scholar]
- Raya JG, Dietrich O, Horng A, Weber J, Reiser MF, Glaser C. T2 Measurement in Articular Cartilage: Impact of the Fitting Method on Accuracy and Precision at Low SNR. Magn Reson Med. 2010;63:181–93. [DOI] [PubMed] [Google Scholar]
- Chen NK, Chang HC, Bilgin A, Bernstein A, Trouard TP. A diffusion-matched principal component analysis (DM-PCA) based two-channel denoising procedure for high-resolution diffusion-weighted MRI. PLoS One. 2018. April;13(4):e0195952. [DOI] [PMC free article] [PubMed] [Google Scholar]


