



Abstract
Quantitative myocardial blood flow (MBF) estimation by dynamic contrast enhanced cardiac computed tomography (CT) requires multi-frame acquisition of contrast transit through the blood pool and myocardium to inform the arterial input and tissue response functions. Both the input and the tissue response functions for the entire myocardium are sampled with each acquisition. However, the long breath holds and frequent sampling can result in significant motion artifacts and relatively high radiation dose. To address these limitations, we propose and evaluate a new static cardiac and dynamic arterial (SCDA) quantitative MBF approach where 1) the input function is well sampled using either prediction from pre-scan timing bolus data or measured from dynamic thin slice “bolus tracking” acquisitions, and 2) the whole-heart tissue response data is limited to one contrast enhanced CT acquisition. A perfusion model uses the dynamic arterial input function to generate a family of possible myocardial contrast enhancement curves corresponding to a range of MBF values. Combined with the timing of the single whole-heart acquisition, these curves generate a lookup table relating myocardial contrast enhancement to quantitative MBF. We tested the SCDA approach in 28 patients that underwent a full dynamic CT protocol both at rest and vasodilator stress conditions. Using measured input function plus single (enhanced CT only) or plus double (enhanced and contrast free baseline CT’s) myocardial acquisitions yielded MBF estimates with root mean square (RMS) error of 1.2 ml/min/g and 0.35 ml/min/g, and radiation dose reductions of 90% and 83%, respectively. The prediction of the input function based on timing bolus data and the static acquisition had an RMS error compared to the measured input function of 26.0% which led to MBF estimation errors greater than threefold higher than using the measured input function. SCDA presents a new, simplified approach for quantitative perfusion imaging with an acquisition strategy offering substantial radiation dose and computational complexity savings over dynamic CT.
Keywords: Cardiac CT, myocardial perfusion, dynamic contrast enhanced, kinetic modeling, vascular transport
Introduction
Quantitative assessment of myocardial perfusion, in absolute units, provides clinically valuable information about ischemia and infarction [1],[2], and can be measured via a variety of dynamic (multi-acquisition) imaging modes including computed tomography (CT) [3], positron emission tomography (PET) [4], and magnetic resonance imaging (MRI) [5]. Qualitative (single acquisition, non-quantitative) myocardial perfusion assessment is routinely obtained using single photon emission computed tomography (SPECT) or cardiac computed tomography angiography (CTA). The qualitative methods can identify myocardial regions which are differentially perfused, but cannot identify abnormalities in the case of balanced ischemia or global ischemia nor absolute quantitation of myocardial blood flow.
Dynamic CT myocardial perfusion assessment provides temporally resolved contrast enhancement information[6]. Using temporal deconvolution (e.g. [7]) or model fitting [3], quantitative myocardial blood flow (MBF) can be estimated from the dynamic contrast enhancement measured at 1) an arterial, input location (such as the aorta or the left ventricular cavity) and 2) the myocardial wall region. However, dynamic CT myocardial perfusion is challenging, requiring repeated CT scans through time during a breath hold, complicated processing protocols, and a relatively high radiation dose. Optimal processing of dynamic cardiac CT studies requires computationally challenging motion correction, contrast-based beam hardening correction strategies[8], and additional image filtering [9]. In addition, coronary CTA is commonly added for morphologic assessment of coronary artery disease requiring further contrast and radiation.
We sought to simplify and improve quantitative CT perfusion assessment by using only one or two static cardiac gated images and well sampled arterial enhancement data.
To implement this approach, we need to sample the arterial input function of contrast arriving to the myocardium. We propose two approaches, each based on current clinical practices used to determine the correct timing for a CT angiography acquisition. In the first method, a small (typically 10-15 ml) “timing bolus” of contrast agent is injected and a single axial slice containing the ascending aorta and pulmonary artery is dynamically acquired every 1-2 seconds until the peak of the contrast bolus is observed. The timing of the peak aortic enhancement is ordinarily used to estimate the optimal time post-injection for the CTA acquisition. We propose to use a linear systems approach to predict the arterial input function based on the larger contrast bolus used for myocardial acquisition and the cardiovascular transfer function derived from the timing bolus data. This predicted AIF method relies on the assumption that the patient-specific passage of contrast from the venous to arterial blood can be modeled as a shift-invariant linear system while a patient is in same cardiovascular state (cardiac output, blood pressure, etc).
In a second method of sampling the arterial input function, sometimes referred to as a “bolus tracking” approach when used for CTA timing, low-dose, single axial slice acquisitions containing the aorta are obtained every 1-2 seconds after injection of the primary contrast bolus used for myocardial acquisitions. We will refer to this method as the measured AIF method because the aortic AIF is being measured directly.
Whether the predicted or measured AIF approach is used, the result is a temporally well-sampled AIF which can be used to drive a perfusion model and predict how myocardial enhancement would vary as a function of time and MBF. Given myocardial enhancement at a known time, this relationship can potentially be inverted to estimate MBF.
In the first part of this study, we evaluate the predicted AIF method, examining how well predicted arterial input functions compare to measured ones. In the second part, we evaluate our primary hypothesis, that global myocardial blood flow can be uniquely identified from knowledge of patient-specific arterial delivery of contrast and the apparent contrast enhancement of the myocardium acquired at a known time post injection.
Methods
The methods are divided into three sections. The first describes the general proposed methodology associated with predicting the arterial input function from timing bolus data. The second section describes the general proposed SCDA methodology for estimating MBF from an arterial input function and myocardial image data. The third section explains the methodology used to evaluate the proposed methods. An overview of the SCDA method is presented in Figure 1.
Figure 1.

Static Cardiac and Dynamic Arterial (SCDA) MBF Estimation Overview. A dynamic arterial input function is obtained either by direct measurement (the measured AIF method) or prediction via convolution of contrast injection with a timing bolus derived cardiovascular transfer function (the predicted AIF method). This input function is combined with a perfusion model to yield a prediction of the myocardial contrast enhancement over time (myocardial TACs) as a function of MBF. Given the exact timing of the static whole heart myocardial acquisition, an enhancement vs. MBF curve (essentially a lookup table) specific to the patient, injection, and study can be constructed. The measured myocardial enhancement can then be translated to a quantitative MBF estimate using this relationship.
I. Predicted Arterial Input Function Method
Cardiovascular Transfer Function Estimation
The predicted arterial input function (AIF) is determined using a “timing bolus” of 10-15 ml of iodinated intravenous contrast. A dynamic time attenuation curve (TAC) is measured in the ascending aorta for typical post-injection time ranges of 6-25 seconds. A gamma variate curve is then fit to the timing bolus TAC, which serves the dual purpose of smoothing the TAC with a physiologically realistic function and identifying the baseline CT number (measured in Hounsfield Units, HU) for this TAC. In this work, we define the “baseline” CT number as the CT number of the imaged region without contrast enhancement. The baseline-corrected CT number (original CT number minus baseline CT number) is approximately proportional with iodine contrast concentration [10]. Considering that the contrast is delivered under controlled conditions by a power injector, we have exact knowledge of the contrast delivery rate and volume into the venous system. Assuming that the contrast delivery between the injection site and the aorta in a particular physiological state constitutes a shift-invariant linear system (an assumption we will test in our evaluation), deconvolving the venous contrast delivery rate curve out of the baseline-corrected timing bolus aortic attenuation curve yields the cardiovascular transfer function between the injection site and aorta.
Arterial Input Function Estimation
The estimated cardiovascular transfer function is then used to predict the arterial input function from any arbitrary contrast injection protocol. CTA contrast volumes are typically 5-15 times larger than those used for a timing bolus, and are sometimes multiphase (i.e., a volume of undiluted contrast is followed by a mixture of contrast and saline). Convolving the intravenous contrast injection profile for a particular injection protocol with the cardiovascular transfer function will yield a prediction of the aortic arterial input function. In this way, timing bolus data combined with knowledge of CTA contrast injection parameters allows prediction of a patient- and injection-specific dynamic arterial input function.
II. Static Cardiac and Dynamic Arterial (SCDA) MBF Estimation
The SCDA approach uses a mixture of thin slice acquisitions (for timing bolus in the predicted AIF approach or for direct AIF measurement in the measured AIF approach) and one or two whole heart acquisitions (for myocardial contrast enhancement data, and, optionally, for contrast free myocardial baseline measurement). The acquisitions of the SCDA approach are graphically presented in Figure 2. Using the study-specific arterial input function and assigned values for interstitial fluid volume fraction and delay between input and myocardium, a two-compartment perfusion model [3] predicts a family of myocardial enhancement curves corresponding to a range of MBF values (Figure 3). This effectively provides a study-specific lookup table of MBF that is a function of time post-contrast injection and measured myocardial CT enhancement above baseline. The myocardial attenuation is available directly from the CT data, but the baseline CT number for the myocardial tissue needs to be determined.
Figure 2.
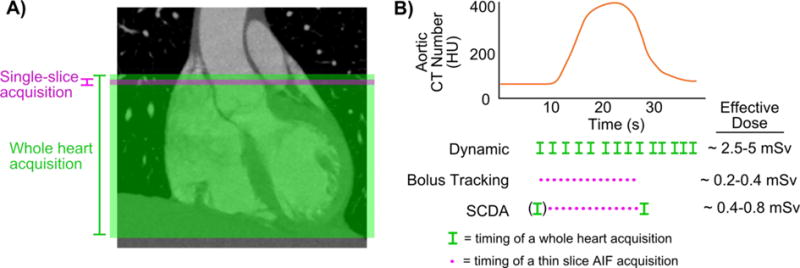
The static cardiac and dynamic arterial (SCDA) acquisition scheme. A) Coronal view of scan ranges for the two SCDA acquisition types. The SCDA approach uses thin slice acquisitions (magenta axial band) for arterial input function (AIF) data and whole heart acquisitions (green axial band) for myocardial response data. B) Comparison of representative acquisition timing and radiation dose levels between a full dynamic CT perfusion protocol, a bolus tracking series, and the SCDA protocol.
Figure 3.

Relationship between myocardial enhancement, MBF, and time. For a given arterial input function and perfusion model, there is an expected relationship between myocardial enhancement and MBF at any given time. Provided that the time is not too early (i.e. before contrast arrival) and not too late (i.e. after enhancement peak), this expected relationship is monotonic, and an observed myocardial enhancement corresponds to a unique MBF value.
We propose and evaluate two methods of myocardial baseline determination. The first approach is simply to apply a fixed baseline for all images. The second approach is to add an additional myocardial CT acquisition before contrast arrival to establish a study-specific myocardial baseline. For both approaches, once the baseline is determined, the myocardial contrast attenuation is the measured myocardial CT number minus the baseline CT number. This baseline-corrected myocardial CT number is the input into the study-specific lookup table, yielding a quantitative estimate of MBF.
III. Evaluation Methodology
This current work performed a substudy of an IRB approved, prospective trial studying the accuracy of dynamic myocardial perfusion CT in patients referred for clinically indicated rest and stress 82Rb myocardial perfusion PET exams. Patients received a research rest and a regadenoson stress dynamic CT perfusion exams along with a resting CTA exam. Of the 28 total enrolled patients, 27 rest studies and 27 stress studies were used for analysis to test hypothesis and method II. One rest study was excluded because a partially occluded IV during the timing bolus led to unusable rest dynamic data. A second patient did not undergo the stress portion of their CT study because of an infiltrated IV site after rest injection. While dynamic CT acquisitions including a timing bolus were acquired for all 28 patients, the precise timing between contrast injection start and the first dynamic frame was recorded only for the 14 most recent patients. Since knowledge of this timing is necessary for rigorous evaluation of the predicted input function, and because timing bolus acquisitions were only acquired at rest, we evaluate the predicted AIF for only these 14 rest studies.
Dynamic CT Acquisition Protocol
For the timing bolus, patients received 10-20 ml of intravenous iodinated contrast (iodixanol) followed by 20 ml of normal saline injected at 5 ml/s. Ungated, 5 mm single slice acquisitions (120 kVp and 20 mAs) were obtained at the level of the pulmonary carina (just superior to the heart) beginning 6 seconds after contrast injection and then every 1.2 seconds for approximately 15 to 24 seconds. A region of interest placed in the ascending aorta was used to generate a time attenuation curve (TAC) from which contrast arrival and peak attenuation could be determined. The timing of the start of the dynamic portion and the CTA exam was based on these timing bolus data. For both rest and stress acquisitions, the patient was instructed to hold their breath at full-inspiration but without Valsalva (to minimize interframe motion and to stabilize heart rates). For the rest study, 50-75 ml of contrast followed by 50 ml of normal saline were injected at 5 mL/s. A low-dose (120 kVp at 18 mAs), multi-frame dynamic CT perfusion acquisition was then performed over 12-18 prospective mid-diastole cardiac gated, whole heart frames (14-16 cm axial range). This required a 26-32 second scan time. During the same dynamic acquisition, a single higher-dose, high-fidelity coronary CTA acquisition (120 kVp at 150-300 mAs) imaged the heart near peak coronary enhancement.
At least 5 minutes after rest acquisition (to allow for contrast washout), the stress portion began. The patient was injected with a unit dose of regadenoson (Astellas, Tokyo) and the dynamic CT stress study was acquired two minutes later. To account for higher cardiac output with regadenoson stress, the first dynamic CT acquisition started 2 seconds earlier post-contrast injection than the rest study. Fifty ml of contrast were injected with 50 ml of normal saline chaser at 5 mL/s with identical CT settings as the rest dynamic study. The high fidelity coronary CTA acquisition was not performed with stress. All CT acquisitions were performed on a Revolution CT scanner (GE Healthcare, Waukesha, WI) with 16 cm chest coverage.
Implementation of Cardiovascular Transfer Function Estimation
In the timing bolus images, a region of interest was drawn in the descending aorta and the mean CT number was recorded for each frame, constructing an aortic timing bolus time attenuation curve (TAC). While an ascending aorta TAC is typically used clinically for CTA timing, we chose to use a descending aorta TAC for transfer function estimation for two reasons: 1) It avoided time-dependent beam-hardening artifacts which were sometimes present in in the ascending aorta due to proximity to very concentrated contrast in the superior vena cava and in the pulmonary artery, and 2) the descending aorta was visible in the dynamic myocardial acquisitions, allowing for a direct comparison of estimated descending aorta TACs to measured descending aorta TACs from the dynamic acquisitions. The injection function into the IV was taken directly from the settings on the power injection; For our data, this was a step function with a constant height dependent on contrast volume and rate. Deconvolution of the injection function from the timing bolus TAC was performed using singular value decomposition and Tikhonov regularization with mild smoothing (lambda=0.1) [11].
Predicted AIF Evaluation
The convolution of the cardiovascular transfer function and the injection function into the IV for the rest dynamic acquisition provided an estimate of the aortic contrast dynamics. Adding the contrast-free baseline attenuation to this yielded a predicted aortic CT number TAC which was directly compared to the dynamically measured aortic TAC. Since the static MBF estimation method requires at least one myocardial acquisition, we also examined the effect of using the single aortic attenuation data point from that acquisition to scale the convolution-predicted curve by a multiplicative scaling factor such that the scaled prediction passes through the single measured attenuation value. (see Figure 3).
The predicted and scaled-predicted aortic CT number curves were evaluated via the following metrics: percent error in area under the TAC as compared to measured dynamic aortic TAC, average CT number deviation between predicted and measured TACs, and average timing deviation between the peak of the predicted and measured aortic TACs.
Dynamic Perfusion Quantification
Myocardial blood flow estimates derived from the full dynamic acquisition were used as the reference standard for the proposed static MBF estimates. Using methodology previously presented, a two-compartment perfusion model with four free parameters (myocardial blood flow, delay between input and myocardial tissue, interstitial fluid volume fraction, and contrast free myocardial attenuation) was optimized to minimize the difference between measured and predicted myocardial TACs, given a study specific arterial input function [3].
SCDA Perfusion Quantification Implementation
Since multiple dynamic frames were available for each exam in the patient trial, there are a number of possible frames that could be used as a single “static” time point for MBF estimation. For the purposes of this work, we seek to determine the performance of SCDA MBF estimation in the best-possible timing conditions. A sensitivity analysis indicated that the average optimal static time would be approximately 2.3 seconds after the peak of the input function to ensure good myocardial enhancement (data not shown), so we selected the first frame (considering our frames have ~2 second spacing) following the maximum value of the input function for analysis. In addition, we also evaluated a suboptimally timed myocardial acquisition using the next frame (~4 seconds after input peak) in order to examine whether an additional short delay (for example to enable a realistic peak detection method and allow a full data acquisition with modified parameters such as table position or collimator position) would significantly degrade performance. For SCDA perfusion quantification, the same two-compartment model was employed as for the dynamic quantification, but the myocardial attenuation at only one (static) time point was used. In addition, the proposed static MBF estimation method relies on too few data points to estimate more than one parameter (MBF), so the others were assigned fixed values. We assigned these parameters based on medians of those measured in the dynamic fits (see Appendix for methodologic details). We evaluated two different approaches for determining the contrast-free myocardial baseline CT number. First, the baseline was assumed to be a fixed value equal to the median baseline of all rest or stress myocardial TACs. Second, the baseline was taken to be the first point of each individual myocardial TAC. Note that implementing this second approach in practice would require a baseline myocardial acquisition in addition to the static myocardial enhanced time point acquisition.
Results
Patient characteristics and radiation dose are presented in Table 1.
Table 1.
Patient Demographics
| Number of subjects | 28 |
| Gender | 21% Female |
| Age | 65 ± 9 yrs |
| BMI | 31 ± 5 kg/m^2 |
| Ischemia present on PET | 68% |
| Infarct present on PET | 21% |
| Mean stress heart rate increase during CT | 20 ± 11 bpm |
| Mean stress systolic blood pressure increase during CT | −8 ± 18 mmHg |
| DLP (for entire dynamic rest, dynamic stress, and CTA sequences) | 600 ± 82 mGy*cm |
| Total Effective Dose (for entire dynamic rest, dynamic stress, and CTA sequences) | 8 ± 1 mSv |
DLP= Dose length product
I. Predicted AIF from Timing Bolus Data
The predicted aortic input function was compared to the measured aortic input function in the 14 patient studies with available precise timing between contrast injection time and first dynamic acquisition. The peak time of the predicted function minus the time of the maximum measured input function post injection was on average 1.05 ± 1.28 s (mean ± s.d). Considering the time between the measured dynamic frames is 2.4 ± 0.7 s (mean ± s.d.), the timing accuracy is approximately half the inter-frame time interval.
Comparing the area under the predicted baseline-corrected curve with the area under the measured baseline-corrected curve up until the static time point indicates that the convolved curve typically underestimates the measured area (12/14 patients, 86%). The overall mean bias in the area under the predicted curve is −33.7% and the RMS % error is 42.6% (Table 2).
Table 2.
Error between measured and predicted aortic input functions
| Predicted Input Function | Predicted Input Function Scaled to Static Input Value | |
|---|---|---|
| Mean % Error in AUC | −34% ± 27% | −7% ± 26% |
| RMS % Error in AUC | 42.6% | 26.0% |
| Error in Peak Timing (mean ± s.d.) | 1.05 ± 1.28 seconds | |
AUC = area under the input function curve above the contrast-free baseline from the time of injection to the myocardial acquisition time point. N=14 patients at rest
With the scaled-predicted aorta input function, the overall mean bias in the area under the scaled predicted curve is −7.5% and the RMS percent error is 26.0%. Seven of 14 patients have an absolute percentage error less than 11% and the other seven have an absolute percentage error greater than 24%.
Figure 4 shows three examples of this process with the data from one case where prediction is relatively good with or without scaling (panel A), one case where prediction is relatively good with scaling but poor without (panel B), and one case where prediction is poor even with scaling (panel C).
Figure 4.
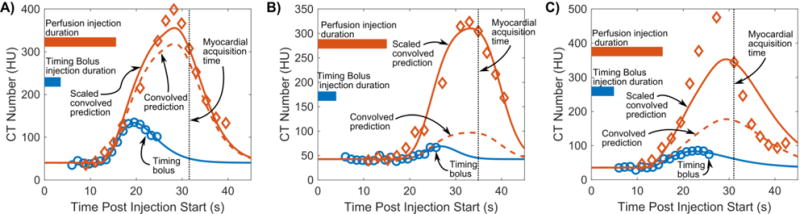
Arterial Input Function prediction from timing bolus and single myocardial acquisition. Timing bolus aortic data (blue circles) are fit with a gamma variate (blue line). Timing bolus injection is deconvolved out of gamma variate to obtain the cardiovascular transfer function between injection site and aorta. This transfer function is convolved with the larger perfusion injection to predict the dynamic input function (prediction is dashed orange line; data is orange diamonds). The convolved prediction is scaled to pass through single whole heart measured aortic attenuation (whole heart acquisition time indicated with vertical dotted line, scaled convolved prediction is solid orange line). Panel A shows one case where prediction works relatively well (−10% error in area under curve without scaling, 1% error with scaling), panel B shows another case where unscaled prediction works poorly (−79% error) but scaled prediction works well (3% error), and panel C shows another case where both unscaled and scaled prediction perform poorly (−66% error and −24% error, respectively).
II. MBF Estimation from SCDA
Dynamic MBF estimates, derived from the full dynamic CT sequence, served as the reference standard. Table 3 summarizes the best fit parameter values from the two-compartment model optimization for these studies.
Table 3.
Dynamic Model Fit Optimized Parameter Values
| MBF (ml/min/g) | Baseline (HU) | Delay (sec) | Visf | |
|---|---|---|---|---|
| Rest (N=27) | 0.80 ± 0.19 | 48.0 ± 3.2 | −0.49 ± 1.52 | 0.10 ± 0.11 |
| Stress (N=27) | 1.55 ± 0.50 | 58.8 ± 5.5 | −1.24 ± 1.80 | 0.11 ± 0.09 |
| All (N=54) | 1.18 ± 0.53 | 53.4 ± 7.0 | −0.86 ±1.69 | 0.11 ± 0.10 |
All parameters are reported as mean ± standard deviation. Delay is the time interval between the measured input function in descending aorta and its arrival in myocardial tissue. Visf is the interstitial fluid volume fraction.
Single Myocardial Acquisition SCDA
The SCDA MBF estimation results using a single whole-heart myocardial acquisition and fixed myocardial baselines are presented in Table 4 (upper part) and Figure 5 (panels A and B). Figure 5 presents the comparison between single myocardial acquisition SCDA and fully dynamic MBF estimates for 54 studies (27 rest and 27 stress in 28 patients). The median SCDA MBF estimate bias is low, 0.019 ml/min/g, and the limits of agreement (±1.45 IQR) are ±0.5 ml/min/g. However, there is one outlier estimate where the stress dynamic MBF estimate is 1.75 ml/min/g and the corresponding static MBF estimate is 9.21 ml/min/g. Examining this outlier more closely, the high SCDA MBF estimate arises primarily from a higher myocardial baseline attenuation [71.7 HU for this study vs. mean 58.8 ± 5.5 HU (mean ± s.d.) for all stress studies] and static enhanced myocardial attenuation (87 HU) possibly explained by slow clearance of the rest perfusion contrast dose. This led to an overestimate of the enhancement due to the stress contrast bolus, leading to overestimated MBF. Table 4 shows the RMS error, bias, and correlation of the SCDA MBF estimates with respect to dynamic MBF estimates. These data are also reported with the outlier removed.
Table 4.
Performance of proposed static MBF estimation compared to dynamic MBF estimation for approach using a single static acquisition, with shared baseline correction value for all rest and for all stress studies, and a double acquisition approach using a baseline acquisition and single contrast enhanced acquisition.
| Single Acquisition | RMSE in SCDA MBF (ml/min/g) | Bias ± SD (ml/min/g) | Correlation Coefficient |
|---|---|---|---|
| Rest (N=27) | 0.15 (0.16) | −0.01 ± 0.15 (−0.00 ± 0.16) | 0.69 (0.69) |
| Stress (N=27) | 1.57 (1.03) | 0.44 ± 1.54 (0.31 ± 1.00) | 0.47 (0.68) |
| All (rest & stress) (N=54) | 1.17 (0.74) | 0.21 ± 1.11 (0.15 ± 0.73) | 0.61 (0.77) |
|
| |||
| Stress (excl. outlier, N=26) | 0.65 (0.89) | 0.17 ± 0.64 (0.21 ± 0.87) | 0.75 (0.72) |
| All (rest & stress excl. outlier) (N=53) | 0.47 (0.63) | 0.08 ± 0.47 (0.10 ± 0.63) | 0.83 (0.79) |
|
| |||
| Double Acquisition | |||
| Rest (N=27) | 0.11 (0.11) | 0.01 ± 0.02 (0.02 ± 0.11) | 0.83 (0.84) |
| Stress (N=27) | 0.48 (0.51) | −0.02 ± 0.49 (−0.04 ± 0.52) | 0.80 (0.84) |
| All (rest & stress) | 0.35 (0.37) | −0.00 ± 0.35 (−0.01 ± 0.37) | 0.85 (0.86) |
RMSE = root mean square error; SD = standard deviation; The values to the left of the parentheses are derived from preferred timing of contrast-enhanced myocardial acquisition (approx. input peak + 2 sec); values in parentheses are derived from a slightly later acquisition (approx. input peak + 4 sec).
Figure 5.
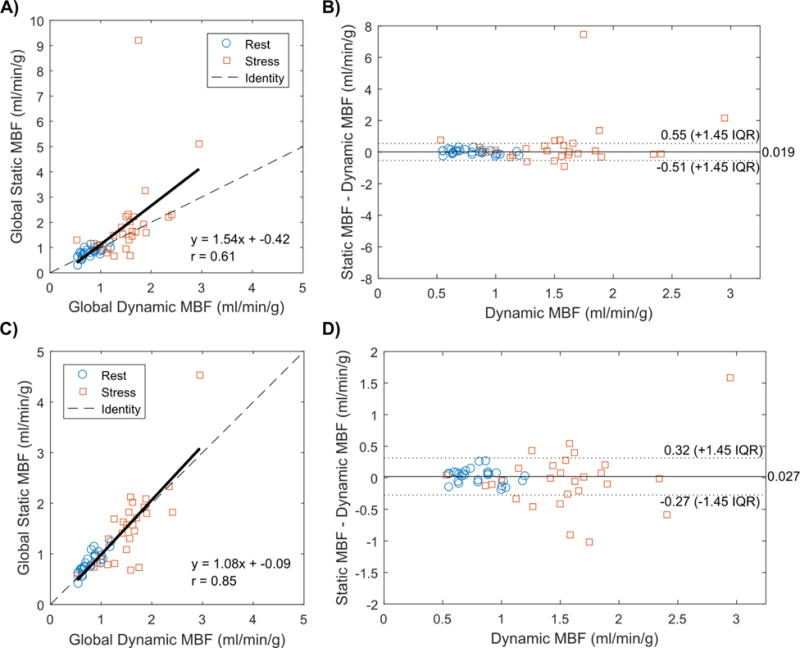
Static MBF Estimation Performance, with fixed myocardial baselines (panels A and B) or with study-specific myocardial baselines (panels C and D). Static MBF estimates for rest (blue circles) and stress (orange squares) are plotted against the reference standard dynamic MBF estimates (left panels). The dashed line is the identity line and the solid line is the line of best fit. The same data is presented in a Bland-Altman plot (right panels). The solid line is the median bias and the dotted lines represent the limits of agreement for non-gaussian data, all numbers in units of ml/min/g.
Comparing suboptimal to optimal timing of the single myocardial acquisition (parenthetical vs non-parenthetical numbers in the first part of Table 4), the performance on rest data is essentially unchanged. On stress data, performance appears to improve, with the RMS error 34% lower for the suboptimal timing. However, this is primarily due to the single outlier data point, which has a static MBF estimate of 4.60 ml/min/g in with the suboptimal timing, rather than 9.21ml/min/g with the optimal timing point. Removing this single point from the analysis, we see instead that performance is generally worse with suboptimal timing, with the RMS error 37% worse on the other 26 stress studies.
Double Myocardial Acquisitions, Baseline and Enhanced
The SCDA MBF estimation results using study-specific baseline measurements are presented in Table 4 (lower part) and Figure 5 (panels C and D). Compared to the single acqusition SCDA, estimation performance improved in all metrics, with a drop in RMSE to 0.35 ml/min/g, an increase in correlation coefficient to 0.85, and a line of best fit which closely approximates the line of identity. The outlier overestimate study in the single acquisition method becomes an underestimate in this method. Performance is very similar between optimally and suboptimally timed myocardial acquisitions.
Predicted AIF to SCDA Perfusion Estimate
In previous sections, we separately evaluated 1) the prediction of the dynamic arterial input function from timing bolus data and 2) the estimation of MBF from static myocardial data and measured dynamic input function data. In this section, we evaluate the end-to-end estimation process for the predicted AIF approach using the 14 patients with accurate timing data. We use the scaled convolved predicted input function and study-specific myocardial baseline approaches (double myocardial acquisition) for this evaluation with results presented in Figure 6 and Table 5. The RMSE, bias, and correlation coefficient for the measured AIF method are numerically improved compared to the predicted AIF method, regardless of whether an outlier value is included or excluded.
Figure 6.
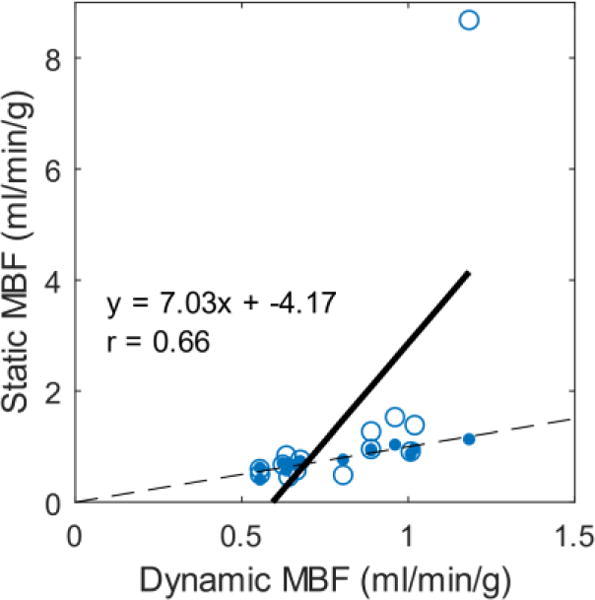
Static MBF estimation performance for resting studies using scaled predicted arterial input function vs dynamic MBF (open circles). For reference, the corresponding static MBF estimates using the measured input functions are also plotted vs dynamic MBF (filled dots). Both sets use the study-specific myocardial baselines. The identity line (dashed) is plotted for reference, and the solid line segment is the line of best fit for the open circles.
Table 5.
Performance of MBF estimation process from predicted vs. measured arterial input functions (AIF) and double cardiac CT acquisition
| RMSE (ml/min/g) | Mean Bias ± S.D. | Correlation Coefficient | |
|---|---|---|---|
| Predicted AIF (with outlier) | 2.02 | 0.61 ± 2.00 | 0.66 |
| Predicted AIF (w/o outlier) | 0.25 | 0.08 ± 0.25 | 0.78 |
| Measured AIF | 0.08 | 0.00 ± 0.08 | 0.84 |
N=14 rest studies
Discussion
Dynamic CT perfusion enables quantitative myocardial blood flow evaluation, although the multiple CT images required to measure time attenuation curves impart a substantial radiation dose and require complex processing such as interframe cardiac motion compensation, 4D image volume manipulation, and 4D kinetic analysis. We demonstrate that the combination of one or two static whole heart CT acquisitions and a dynamically sampled arterial input function can also generate quantitative MBF estimates in absolute units. This static cardiac, dynamic arterial (SCDA) approach requires substantially lower radiation dose than dynamic CT perfusion.
A unique aspect of the SCDA approach work is that while knowledge of the myocardial wall enhancement TAC is limited to one or two frames, the input function TAC is derived from a different acquisition with a higher temporal sampling rate. This approach is similar in nature to approaches applied in nuclear myocardial perfusion imaging where the arterial input function was imaged with a dynamic planar acquisition, providing an estimate of patient-specific delivery of a radiotracer [12],[13]. The myocardial response was imaged with a single late SPECT acquisition. The SPECT approach was challenging considering the dynamic input function acquisition measured a projection of counts in the blood pool (non-quantitative), requiring an unknown, patient-specific correction factor relating the input function and the myocardial measurements. Despite this challenge, investigators have shown positive results of this type of approach compared to flow reserve via [15O]H2O PET [14] and intracoronary Doppler [15]. In contrast, our proposed approach benefits from tomographic acquisitions of the input function with matched units to the myocardial measurements.
In clinical practice, tracking the contrast bolus over time and into the heart is required to time coronary artery acquisition during peak enhancement. Our novel approach leverages this “free” information to derive dynamic arterial input function information that can inform quantitative MBF. Contrast transit and AIF is obtained with either a “bolus tracking” (measured AIF) approach or a “timing bolus” (predicted AIF) approach. In the measured AIF approach, one injection of contrast is given and multiple very low dose acquisitions are acquired until the aortic attenuation reaches a pre-set value to trigger a multislice CT acquisition. The dynamic aortic input function is directly measured in this approach. In the predicted AIF approach, the input function is estimated using our proposed linear system-based method. While we find that the predicted AIF approach predicts the timing of the actual input function peak accurately to within our ability to resolve it, it also underestimates the area under the input function curve by ~33% with a root mean squared percent error of over 40%. This degree of error suggests that a simple shift-invariant linear system assumption is not valid for describing contrast bolus passage from injection site to aorta over separate injections, perhaps because of non-negligible physiological effects of contrast or because of other physiological state changes between the time of timing bolus injection to the time of later injection. While utilizing the single static time point aortic attenuation to derive a multiplicative scaling factor for the predicted input function significantly improves prediction accuracy, reducing average bias to −7%, the root mean squared percentage error still exceeds 25%%. Since bolus tracking and timing bolus based approaches result in similar radiation doses to the patient, the bolus tracking approach appears preferable for static MBF estimation.
SCDA MBF estimation based on a single whole heart acquisition has a root mean squared error of 1.17 ml/min/g relative to the reference standard dynamic MBF. This relatively large error was due to one outlier stress study with an erroneous static MBF estimate of 9.2 ml/min/g. After excluding this outlier, the overall RMSE dropped to 0.47 ml/min/g. Overall static MBF estimation performance was much better for resting studies (0.15 ml/min/g RMSE) than for stress studies (0.65 ml/min/g excluding outlier or 1.57 ml/min/g including outlier). There are several potential causes for this. First, the nonlinear relationship between MBF and myocardial enhancement means that small changes in enhancement correspond to much larger changes in MBF for high enhancement values than for low enhancement values (see insets of all panels in Figure 7). The same is true for the changes in mapping curve shape arising from delay or Visf errors. In this patient study, the resting portion was acquired with on average 75 ml of contrast, while the stress portion was acquired with 50 ml after the resting scan. This lower contrast dose increases the variance in the measurements, also leading to noisier stress MBF estimates.
Figure 7. Sources of error in static MBF estimation.
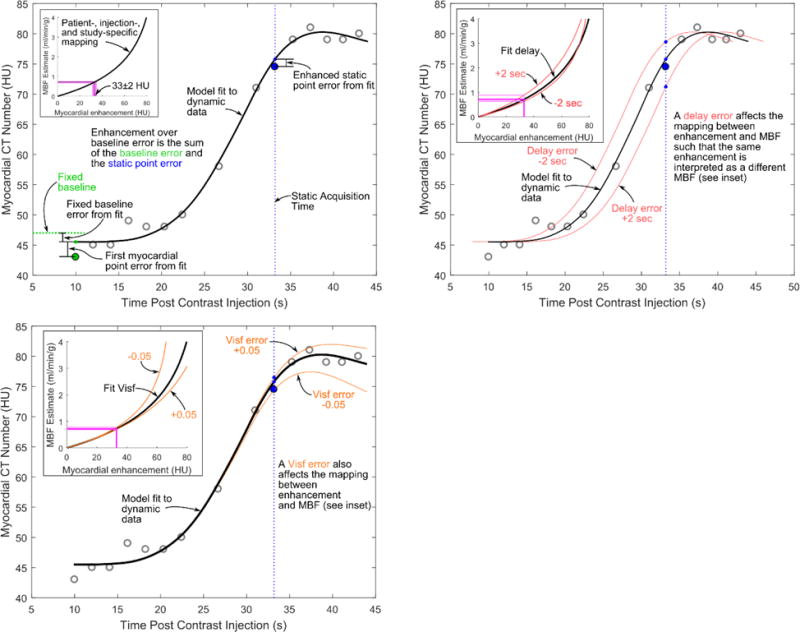
Myocardial Enhancement Error (upper left panel): Myocardial enhancement is the difference between the myocardial CT number at the static acquisition time (vertical blue dotted line) and a baseline myocardial CT number, which can be either a fixed number (horiz. green dotted line) or the myocardial CT number at the first dynamic time point (filled green circle), so enhancement error is the sum of the baseline error and the static point error. Delay Error (upper right panel) and Visf Error (lower panel) affect the location in time (for delay) or shape (for Visf) of the model fit curves, leading to changes in the shape and location of the mapping between myocardial enhancement and static MBF estimate (insets in all panels). Example static MBF estimates for the illustrated data (with a 33 HU myocardial enhancement) are shown in magenta on each inset.
We also examined the SCDA MBF estimation performance using a measured, study-specific baseline point. This additional information resulted in a minor improvement in resting SCDA MBF estimation (0.15 ml/min/g RMSE to 0.11 ml/min/g) and a larger improvement in stress SCDA MBF estimation (0.65 ml/min/g (w/o outlier) or 1.57 ml/min/g (w/outlier) down to 0.48 ml/min/g RMSE (no outlier to include/exclude in study-specific baseline case). Overall performance error of 0.35 ml/min/g is likely within the range of clinical acceptability. Overall, this evaluation suggests that adding an early low dose acquisition to establish a study-specific baseline improved MBF estimation. In clinical practice, this non-contrast baseline image could be obtained as a coronary calcium score scan which may additionally inform patient prognosis [16].
Comparing SCDA MBF estimates which used a sensitivity analysis based optimal timing for the contrast enhanced myocardial acquisition with those based on a later, suboptimal timing, the suboptimal timing degraded performance for the single acquisition approach (37% higher RMS error, slightly increased bias, slightly decreased correlation), but did not degrade performance for the two-acquisition approach. This suggests that the two-acquisition approach is robust to the small delays which might be necessary for the scanner to shift between single slice and whole heart acquisitions.
Importantly, this study demonstrates that quantitative MBF can be obtained at 75-90% lower radiation dose than from dynamic MBF. We used low flux (18 mAs) dynamic whole heart frames in this evaluation, leading to a total effective dose of ~4 mSv for each rest or stress full dynamic exam. From this level, the single whole heart acquisition SCDA approach would represent an average ~90% radiation dose savings to <0.5 mSv. Likewise, the two-acquisition SCDA approach would represent an average ~83% dose savings. For clinical implementation, this SCDA approach could potentially be combined with clinically indicated coronary CTA acquisitions. Since optimal coronary CTA timing is at maximal contrast in the coronary arteries (which is shortly after contrast peaks in the aorta, but before it peaks in the myocardium), and since the maximal perfusion sensitivity is also shortly after the aortic contrast peak, it is likely that a single acquisition or two neighboring temporal acquisitions could be used for both anatomic and functional assessment. Such approaches would save patients both radiation and contrast exposure compared with performing these assessments separately.
If myocardial contrast dynamics are well described by the perfusion model (a bedrock assumption of both dynamic and SCDA MBF estimation approaches), SCDA MBF estimation error can arise from three independent sources: error in contrast enhancement estimation, error in delay estimation, and/or error in assumption of a fixed interstitial fluid volume fraction (See Figure 7). Error in contrast enhancement estimation arises when there is an error in the baseline attenuation estimate, the enhanced static time point attenuation estimate, or both. Overestimating the contrast enhancement leads to overestimation of MBF (see inset of upper left panel of Figure 7), with larger MBF errors at higher MBF values for the same enhancement error. Errors in delay estimation shift the model curve in time relative to the input curve (Figure 7, upper right panel). Depending on where the static time point falls on the model curve relative to the peak, this could increase or decrease the error of the model curve, corresponding to increasing or decreasing the static MBF estimation error. Errors in interstitial fluid volume fraction (Visf) arise in a similar way.
In this initial study, we assess global myocardial flow, a task with demonstrated prognostic value [17]. The high spatial resolution of CT suggests that the same approach could be applied to quantitative MBF estimation in regional, segmental (e.g. AHA 17 segment model), or endocardial vs. epicardial comparisons. The approach is computationally fast, because once the input function is extracted, it takes only a few seconds to generate the patient-specific myocardial enhancement to MBF mapping. This mapping can be used to rapidly provide voxel-by-voxel estimates for the whole 3D myocardium, although it would likely be advisable to apply some smoothing first to moderate image noise.
Philosophically, the range between static and dynamic quantification approaches is a continuum, rather than a dichotomy. We began by examining one myocardial time point (the static time point), and then looked at the benefits of adding one more (as a baseline point). However, there is no reason that 3, 4, or more additional myocardial acquisitions could not be used which could refine MBF estimates. As additional acquisitions are added, it remains unknown at what point additional parameters (such as Visf and delay) can be reliably estimated, and the relative tradeoffs in performance. In previous work, we explored a different range of this tradeoff space, looking at 30 down to 10 frame acquisitions with full to sparse sampling of both the myocardial and arterial input TAC [3]. Additional work is needed to explore tradeoffs in our current proposed context of full sampling of the input TAC and sparse sampling of the myocardium.
Our study has limitations. We do not have access to the true MBF for these patients, and instead rely on previously evaluated dynamic MBF estimation methods [3],[17]–[19] as our reference standard. The proposed SCDA MBF estimation is intended as a lower radiation dose approximation to dynamic MBF estimation, and should not be expected to outperform dynamic MBF estimation. Our evaluation of SCDA is of the reliability of this approximation under different conditions. Since we use one or two points from the 12 to 15 frame dynamic myocardial TACs as our enhanced static time point and (sometimes) baseline point, the SCDA and dynamic MBF estimates are not fully independent. The static MBF estimation method is not capable of estimating additional parameters beyond the MBF; the value of additional parameters such as the interstitial fluid volume must be assumed. Therefore, for patients with unusual values for these parameters, static MBF estimation will likely return erroneous estimates, especially for high MBF values. Other researchers have investigated the effects of adapting the contrast injection bolus profile to achieve increased uniformity for CT angiography [20] or MR angiography [21]. Similar approaches may be able to improve predictability of the arterial input function for MBF estimation. The static frames used for evaluation in this study are of low quality (equal to all the other low flux dynamically acquired frames). Because we assess global myocardial flow using regions of interest encompassing the whole myocardium, the additional noise of the low flux acquisition is likely of relatively little impact. In clinical use, the static perfusion image could be acquired with higher flux considering one would not need to apportion a radiation dose allowance to other dynamic frames.
Conclusion
We propose a new static cardiac and dynamic arterial (SCDA) approach to estimate quantitative myocardial blood flow in absolute units. Our results suggest that the preferred approach is to measure the arterial input function and acquire two myocardial CT acquisitions: one for baseline and one for enhancement information. Using dynamic CT MBF estimates as a reference standard, SCDA MBF estimation from a single myocardial CT acquisition had a RMSE of 1.17 ml/min/g and a bias of 0.21 ± 1.11 ml/min/g in 54 studies on 28 patients. Adding baseline information from one additional myocardial CT acquisition before contrast arrival improved MBF estimation to an RMSE of 0.35 ml/min/g and a bias of −0.00 ± 0.35 ml/min/g. A timing delay of ~2 seconds beyond the optimal SCDA enhanced myocardial acquisition time generally worsened performance in the single myocardial acquisition case, but had very little effect in the two myocardial acquisition case, indicating robustness to minor timing variations. A convolution-based method of predicting the arterial input function from timing bolus data had relatively high error (26% RMS percent error in area under curve), leading to a preference for a direct measurement approach for the arterial input function. This work suggests that utilizing low dose arterial input function data similar to that already routinely acquired to properly time coronary CT angiography acquisitions and two whole heart acquisitions provides clinically important quantitative MBF perfusion information at substantially reduced (83% lower in this study) radiation dose compared to dynamic CT.
Appendix
Two Compartment Model
The perfusion model used for quantification is a two compartment model with vascular and extravascular components connected through a permeable barrier. The measured CT numbers of myocardial voxels (Cmeasured) represent the combination of attenuation due to tissue (Cbaseline) and attenuation due to iodinated contrast (Ccontrast).
Since the contrast agent remains extracellular in both plasma and tissue, the observed contrast agent in the myocardium (Ccontrast) is the sum of its content in blood plasma and in interstitial fluid
where Cp and Cisf are the contrast agent concentrations in plasma and interstitial fluid (in HU) and Vp and Visf are the tissue volume fractions (ml/ml tissue). Plasma and interstitial compartments are considered well-mixed, and governed by two differential equations
where Fp is the plasma perfusion (in ml/min/g), is the arterial input function for plasma arriving in the myocardium, and PS is the permeability surface area product governing exchange across capillary walls. is related to the measured arterial input function Cin by a delay and through the bulk hematocrit
The myocardial perfusion (MBF) is related to the plasma perfusion through the tissue discharge hematocrit
When optimizing full sets of dynamic data, the parameters MBF, Visf, Cbaseline, and tdelay were adjusted until the model curve best fit the data. The remaining model parameters were fixed at the values in Table A1.
Assignment of Additional Model Parameters for SCDA
The proposed SCDA MBF estimation method relies on too few data points to estimate more than one parameter (MBF), so the other three parameters estimated in the full dynamic approach need to be fixed at assumed values. Since interstitial fluid volume fraction (Visf) did not systematically differ between rest and stress, it was assigned the common fixed value of 0.12 (unitless) for static estimation purposes in all rest and stress studies. The myocardial baseline CT number from which enhancement rises (Cbaseline) did vary systematically between rest and stress, likely because the rest study was always performed first and some residual contrast agent persisted through the stress study. Accordingly, we assigned a separate fixed baseline for rest studies (47 HU) and stress studies (57 HU), in each case the median of the first point of corresponding dynamic TACs (to avoid undue influence from potential outliers). Similarly, the delay (tdelay) varied systematically between rest and stress studies, likely directly because of the change in physiological state, with a median delay of −0.69 seconds for rest studies and −1.42 seconds for stress studies. Note that the delay parameter here is negative, indicating that the input function is arriving in the tissue before the time we measure it. This is not problematic, and should even be expected, as we measure the input function in the descending aorta, which is reached about 3.7 seconds after the ascending aorta near the coronary ostia. So, a fit delay of −1.2 seconds would mean that contrast reaches the myocardial tissue on average about 3.7-1.2=2.5 seconds after exiting the aorta, which is reasonable.
Contrast-free timing bolus baseline attenuation ranged from 35 to 47 HU.
Myocardial Segmentation
We developed custom software in MATLAB to segment the aorta and myocardium in 4D dynamic CT image volumes in a semi-automated fashion. The user interactively reoriented a representative transaxial volume into a short axis volume, specified the base and apex, and an initial myocardial segmentation was performed automatically via analysis of profiles along rays emanating radially from the short axis. This automatic segmentation was propagated forward and backward in time and automatically adjusted to better fit each acquisition and correct for interframe motion. The resultant dynamic segmentation was adjusted interactively to correct any errors. Aortic segmentation was manually determined by drawing a volume of interest in the upper descending aorta.
Table A1.
Fixed parameter values for all model fits
| Parameter | Value | Description |
|---|---|---|
| Vp | 0.085 ml/ml tissue | Volume fraction of plasma in tissue |
| PS | 1.45 ml/min/g tissue | Permeability surface area product |
| Hbulk | 0.45 | Bulk hematocrit |
| Hdischarge | 0.45 | Tissue discharge hematocrit |
References
- 1.Hachamovitch R, Berman D, Kiat H. Value of Stress Myocardial Perfusion Single Photon Emission Computed Tomography in Patients With Normal Resting Electrocardiograms: An Evaluation of Incremental Prognostic Value and Cost-Effectiveness. Circulation. 2002 doi: 10.1161/hc0702.103973. [DOI] [PubMed] [Google Scholar]
- 2.Shaw L, Berman D, Maron D. Optimal medical therapy with or without percutaneous coronary intervention to reduce ischemic burden results from the Clinical Outcomes Utilizing Revascularization. Circulation. 2008 doi: 10.1161/CIRCULATIONAHA.107.743963. [DOI] [PubMed] [Google Scholar]
- 3.Bindschadler M, Modgil D, Branch KR, La Riviere PJ, Alessio AM. Comparison of blood flow models and acquisitions for quantitative myocardial perfusion estimation from dynamic CT. Phys Med Biol. 2014;59(7):1533–1556. doi: 10.1088/0031-9155/59/7/1533. [DOI] [PMC free article] [PubMed] [Google Scholar]
- 4.Kaufmann PA, Gnecchi-Ruscone T, Yap JT, Rimoldi O, Camici PG. Assessment of the reproducibility of baseline and hyperemic myocardial blood flow measurements with 15O-labeled water and PET. J Nucl Med. 1999;40(11):1848–1856. [PubMed] [Google Scholar]
- 5.Kroll K, Wilke N, Jerosch-Herold M, Wang Y, Zhang Y, Bache RJ, Bassingthwaighte JB. Modeling regional myocardial flows from residue functions of an intravascular indicator. Am J Physiol Circ Physiol. 1996;271:H1643–H1655. doi: 10.1152/ajpheart.1996.271.4.H1643. [DOI] [PMC free article] [PubMed] [Google Scholar]
- 6.So A, Lee TY. J Cardiovasc Comput Tomogr. 6. Vol. 5. Mosby, Inc; 2011. Quantitative myocardial CT perfusion: a pictorial review and the current state of technology development; pp. 467–481. [DOI] [PubMed] [Google Scholar]
- 7.Lee TY. Functional CT: physiological models. Trends Biotechnol. 2002;20(8):S3–S10. [Google Scholar]
- 8.Levi J, Fahmi R, Eck BL, Fares A, Wu H, Vembar M, Dhanantwari A, Bezerra HG, Wilson DL. Calibration free beam hardening correction for cardiac CT perfusion imaging. Prog Biomed Opt Imaging - Proc SPIE. 2016 Mar;9784 doi: 10.1117/12.2216623. 2016. [DOI] [PMC free article] [PubMed] [Google Scholar]
- 9.Isola AA, Schmitt H, Van Stevendaal U, Begemann PG, Coulon P, Boussel L, Grass M. Image registration and analysis for quantitative myocardial perfusion: Application to dynamic circular cardiac CT. Phys Med Biol. 2011;56(18):5925–5947. doi: 10.1088/0031-9155/56/18/010. [DOI] [PubMed] [Google Scholar]
- 10.Miles KA, Griffiths MR. Perfusion CT: a worthwhile enhancement? Br J Radiol. 2003;76:220–231. doi: 10.1259/bjr/13564625. [DOI] [PubMed] [Google Scholar]
- 11.Fieselmann A, Kowarschik M, Ganguly A, Hornegger J, Fahrig R. Deconvolution-Based CT and MR Brain Perfusion Measurement: Theoretical Model Revisited and Practical Implementation Details. Int J Biomed Imaging. 2011;2011:467563. doi: 10.1155/2011/467563. [DOI] [PMC free article] [PubMed] [Google Scholar]
- 12.Petretta M, Storto G, Pellegrino T, Bonaduce D, Cuocolo A. Prog Cardiovasc Dis. 6. Vol. 57. Elsevier Inc; 2015. Quantitative Assessment of Myocardial Blood Flow with SPECT; pp. 1–8. [DOI] [PubMed] [Google Scholar]
- 13.Sugihara H, Yonekura Y, Kataoka K, Fukai D, Kitamura N, Taniguchi Y. Estimation of coronary flow reserve with the use of dynamic planar and SPECT images of Tc-99m tetrofosmin. J Nucl Cardiol. 2001;8(5):575–579. doi: 10.1067/mnc.2001.115934. [DOI] [PubMed] [Google Scholar]
- 14.Ito Y, Katoh C, Noriyasu K, Kuge Y, Furuyama H, Morita K, Kohya T, Kitabatake A, Tamaki N. Estimation of myocardial blood flow and myocardial flow reserve by 99mTc-sestamibi imaging: comparison with the results of [15O]H2O PET. Eur J Nucl Med Mol Imaging. 2003;30(2):281–287. doi: 10.1007/s00259-002-1031-y. [DOI] [PubMed] [Google Scholar]
- 15.Storto G, Cirillo P, Luciaeufrasiavicario M, Pellegrino T, Sorrentino A, Petretta M, Galasso G, Desanctis V, Piscione F, et al. Estimation of coronary flow reserve by Tc-99m sestamibi imaging in patients with coronary artery disease: Comparison with the results of intracoronary Doppler technique. J Nucl Cardiol. 2004;11:682–688. doi: 10.1016/j.nuclcard.2004.08.007. [DOI] [PubMed] [Google Scholar]
- 16.Kelkar AA, Schultz WM, Khosa F, Schulman-Marcus J, O’Hartaigh BWJ, Gransar H, Blaha MJ, Knapper JT, Berman DS, et al. Long-Term Prognosis after Coronary Artery Calcium Scoring among Low-Intermediate Risk Women and Men. Circ Cardiovasc Imaging. 2016;9(4):1–8. doi: 10.1161/CIRCIMAGING.115.003742. [DOI] [PubMed] [Google Scholar]
- 17.Meinel FG, Ebersberger U, Schoepf UJ, Lo GG, Choe YH, Wang Y, Maivelett JA, Krazinski AW, Marcus RP, et al. Am J Roentgenol. 2. Vol. 203. Elsevier Ltd; 2014. Global quantification of left ventricular myocardial perfusion at dynamic CT: Feasibility in a multicenter patient population; pp. 16–24. [DOI] [PubMed] [Google Scholar]
- 18.So A, Hsieh J, Li JY, Hadway J, Kong HF, Lee TY. Quantitative myocardial perfusion measurement using CT perfusion: a validation study in a porcine model of reperfused acute myocardial infarction. Int J Cardiovasc Imaging. 2012;28(5):1237–1248. doi: 10.1007/s10554-011-9927-x. [DOI] [PubMed] [Google Scholar]
- 19.George RT, Jerosch-Herold M, Silva C, Kitagawa K, Bluemke DA, Lima JAC, Lardo AC. Quantification of myocardial perfusion using dynamic 64-detector computed tomography. Invest Radiol. 2007;42(12):815–822. doi: 10.1097/RLI.0b013e318124a884. [DOI] [PubMed] [Google Scholar]
- 20.Fleischmann D, Rubin GD, Bankier AA, Hittmair K. Improved Uniformity of Aortic Enhancement with Customized Contrast Medium Injection Protocols at CT Angiography. Radiology. 2000;214(2):363–371. doi: 10.1148/radiology.214.2.r00fe18363. [DOI] [PubMed] [Google Scholar]
- 21.Wilson GJ, Maki JH. Evaluation of a tailored injection profile (TIP) algorithm for uniform contrast-enhanced signal intensity profiles in MR angiography. J Magn Reson Imaging. 2016;44(6):1664–1672. doi: 10.1002/jmri.25298. [DOI] [PubMed] [Google Scholar]