

Abstract
Reproducibility is essential to clinical application of positron emission tomography (PET) quantification. Human lapses in data registration and protocol compliance are pervasive sources of intrasite quantification variability. Although rarely assessed or reported, these lapses are ultimately a limitation to harmonization in multicenter clinical trials. A comprehensive account of their possible extent is relayed here.
This is a retrospective audit of errors in manual registration of study parameters and in protocol adherence across a sample of in-center research projects over one year (201 patients, 222 PET/CT scans). Discrepancies in patient height and weight; tracer type; dose; injection; and scan times were listed. Correspondent variances in standardized uptake values (SUVs) normalized by body weight, SUV (BW), and body surface area, SUV (BSA), were assessed.
Manual misregistrations totalled 41.8%. These were mainly small, but with a few large deviations, and most significant in weight (range: -1–100 kg) and dose (-19 to 12 MBq). Errors were more frequent and generally larger in non-routine studies. This also applied to protocol compliance. A 50.7% noncompliance was found with significant deviations in dose (-106 to 208 MBq) and especially in early scan uptake times (-37 to 54 min). Although misregistrations did not overall translate into significant SUV variability, noncompliance did. These errors contributed a factor 0.02 to 1.45 and 0.71 to 3.09 SUV (BW) change, respectively. SUV (BSA) saw a significant 21% to 22% decrease with mistyped height and weight.
Inconsistency was frequent but less prominent in data entry than in protocol compliance. As both caused some substantial SUV variances, intra-site assessments and data checking are required for clinical trials.
Keywords: compliance, error sources, positron emission tomography, protocol, quantitative evaluation, reproducibility of results
1. Introduction
Quantitative disease indices are widely used in positron emission tomography/computed tomography (PET/CT) studies. The prevalent standardized uptake value (SUV), which is known to be afflicted by biases,[1–6] requires assessment of error levels for reliable clinical applications, for example, diagnosis and response monitoring. Although much has been done to estimate various physiological,[7–9] physical,[10–14] and technical [15–18] variabilities, the bias magnitude of human error is hardly reported. Specifically, entry errors in data registers and within-center compliance variance are often ignored yet ubiquitous sources of unreliable SUVs. These errors reduce reproducibility and thus also compromise multi-center standardization.
Lapses in practice seem inevitable, given the numerous steps and diverse protocol procedures, ranging from routine 2-deoxy-2-[18F]-fluoro-D-glucose ([18F]-FDG) examinations to lesser common tracer studies, such as [18F]-sodium fluoride ([18F]-NaF) PET/CT. Frequent error occurrence has also been acknowledged in the literature[5] as an important aspect to consider.[19] Although impactful error in single data entries[20] and compliance across centers[21–26] has been observed, the quantitative extent and impact of everyday practical data miregistrations and variability have not been reported, to the best of our knowledge. Such a collective assessment is provided here for a typical clinical routine setting.
2. Methods
A systematic review of work practices was carried out in our department as a clinical site counting 5 PET/CT scanners, 47 trained technologists, and 7298 PET/CT scans conducted for the year of 2016 with a general yearly throughput of 1000 patients. The retrospective assessment covered PET/CT studies performed at our institution from January 2015 to January 2016 as a representative cross-section. These included 5 different research projects comprising a total of 201 patient studies (222 scans) and both [18F]-FDG-PET/CT of various protocols (single and dual time point scans) and [18F]-NaF-PET/CT for comparison. The projects and protocol details are listed in Table 1. No ethical approval was required for this type of study.
Table 1.
Project type, population sizes and protocol prescriptions.

Although the department has no EU accreditation, all procedures followed the institutional standards mainly based on the European Association of Nuclear Medicine guidelines.[27] As per routine, basic patient information was registered in individual handwritten record forms during patient preparation before tracer injection with the Intego system (MEDRAD, Inc.). Output prints of administered dose readings were included in the patient records. The same data were then typed for DICOM metadata entries at the scanner console before each scan, wherein acquisition commencement times were further noted in the patient record. Data and image quality were not checked by a core laboratory, whereas double reading was employed in diagnostic reporting.
2.1. Data extraction
For the patient studies included in this work, data registrations in the handwritten records were collected regarding basic patient data (weight, height, measured blood sugar level) as well as scan-related parameters: tracer type and dose, injection time (Tinj), and scan time (T). The corresponding typed DICOM metadata entries were looked up in the image files for comparison. Additional recording of variations from protocol prescriptions (Table 1) was carried out where applicable. In subsequent accounts of data entry inconsistencies, any whole number deviations were listed. Those relative to the protocol were further reworked, taking into consideration our institution's guideline-based [28] standard practical allowances of ±10% in dose and ±5 minutes in tracer uptake time (ΔT).
2.2. Quantitation analysis
The impact of differing data entries used in quantitative analyses was evaluated in relation to common SUV calculations. SUVs were given as the tissue activity concentration, C(T) [kBq/mL], normalized by a factor, Ω, which accounts for distribution volume, V, and injected dose, Dinj [MBq], corrected by a decay factor f = e−λ.t with decay constant λ:
 |
where for the FDG distribution volume, patient body weight (BW) is mostly used, V = BW [kg], or alternatively, the body surface area (BSA), calculated as V = BSA1 [m2] = BW [kg]0.425 · H [cm]0.725 ·0.007184 or  ,[29] which includes patient height, H. From Eq. (1), variance estimates in calculated SUVs between deviating parameter entries (a, b) were found in terms of ratios:
 |
which for a given time point scan (uptake ratio UC = 1) amount to separate contributing factors of parameter ratios between discrepant entries of distribution volume, RV, dose, RDose, and uptake time, RΔT, respectively. In variations from protocol target levels, expected deviant concentrations (UC ≠ 1) would further impact SUV variance.
Differences in corresponding data registrations were graphically assessed by Bland-Altman plots. As neither raw nor log-transformed data were generally normally distributed, statistical tests for the null hypothesis were performed where relevant with 2-sided Wilcoxon signed-rank matched-pairs tests of entry differences and log ratios of SUV factors. Here, statistical significance was inferred at P value <.05. All data analyses were carried out in MATLAB 9.0 (MathWorks, Inc.).
3. Results
Three delayed time scans in dual point FDG were not performed for unspecified reasons and were disregarded in the listings. No missing data were otherwise found in the DICOM files, but some scan time entries were omitted in patient records (12/222 ≈ 5.4%). The error listings also excluded the often noncompulsory blood sugar measurements. Total accounts showed errors to be predominantly small, but with a few large discrepancies. In terms of whole number deviation, 41.8% (79/189, excluding missing entries) of the patient studies showed inconsistencies between patient records and DICOM entries. Moreover, 98.0% (197/201) differed from protocol targets, 50.7% (102/201) of which were noncompliant with allowed variations (dose ± 10%, ΔT ± 5 min). Manual misregistrations occurred to a lesser extent in routine FDG–60 minutes (54/150 ≈ 36.0%) than in FDG–dual time (11/20 ≈ 55.0%), NaF–45 minutes (8/10 ≈ 80.0%) or NaF–60 minutes (6/9 ≈ 66.7%) protocol studies. Meanwhile, the missing data entries only appeared in FDG studies.
Of individual entries, tracer dose and scan times were most prone to registration disparity. This was largely seen independently of study and tracer type (Figure 1). Differences tested statistically among all entries or between deviating entries alone yielded the same results. They showed dose discrepancies to be generally significant, whereas uptake times were only so relative to protocol prescriptions (P < .001). DICOM metadata only differed significantly from patient records in weight by (mean ± SD) 25.4 ± 40.3 kg (P ≈ .02) and in dose by 4.1 ± 7.7 MBq (P ≈ .02). Differences for all recorded data entries versus their mean are shown in Figure 2.
Figure 1.

Bar diagrams of percentage inconsistent data registrations (excl. missing entries) between patient records and DICOM metadata for all studies (A) and individual study types (B) in entries of patient height and weight, tracer type and dose, tracer injection time (Tinj) as well as early (T1) and late (T2) scan times.
Figure 2.
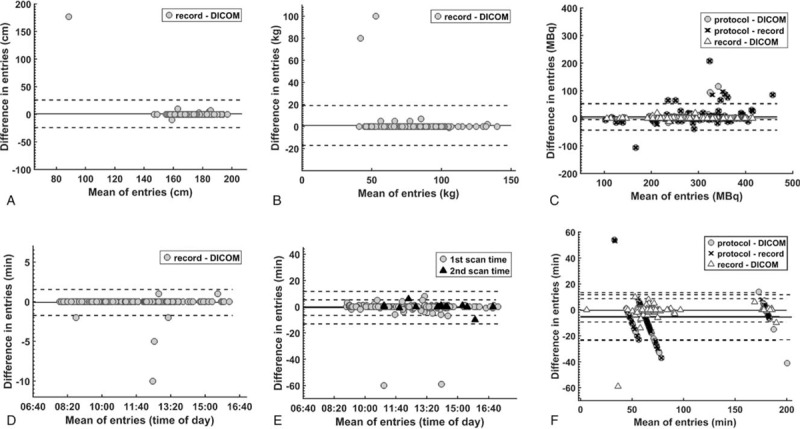
Bland-Altman plots of differences in all registered patient height (A), weight (B), tracer dose (C), injection time (D), scan times (E), and uptake times (F) between data entries in the patient records, image DICOM metadata, and study protocol prescriptions, respectively. Solid and dashed lines indicate mean ± 2SD.
Discordances related to tracer type were not only more frequent but also generally larger in NaF studies than in FDG studies. Patient record and DICOM entry differences in FDG studies averaged in height: 36.4 ± 78.9 cm (P ≈ .44); weight: 28.7 ± 42.3 kg (P ≈ .03); dose: 3.3 ± 7.7 MBq (P ≈ .10); Tinj: −1.0 ± 3.5 minutes (P = 1.0); early scan time T1: −1.1 ± 8.9 minutes (P ≈ .93); delayed scan time T2: −0.3 ± 5.3 minutes (P ≈ .78); and related uptake times ΔT1: −1.3 ± 9.1 minutes (P ≈ .82); ΔT2: −0.7 ± 5.2 minutes (P = 1.0). Corresponding entries in NaF studies had single errors in height and weight and deviations in dose: 6.5 ± 8.4 MBq (P ≈ .13); Tinj: −4.7 ± 4.6 minutes (P = .25); T1: −2.3 ± 3.4 minutes (P ≈ .03); and ΔT1: 0.0 ± 5.8 minutes (P = 1.0).
Departures from protocol prescriptions not only contributed predominantly to disparity counts but were typically also most significant. Figure 3 details the totals and magnitudes of the tallied inconsistencies. These were significant for dose and ΔT1 (P < .001), but not ΔT2 (P ≈ .45). Again, overall smaller practical variations were seen for FDG studies than for NaF studies with deviations in dose: 5.6 ± 17.9 MBq (P < .001); ΔT1: −6.1 ± 9.1 minutes (P < .001); ΔT2: −2.1 ± 9.2 min (P ≈ .45); and dose: 7.6 ± 58.5 MBq (P ≈ .22); ΔT1: −9.4 ± 8.7 minutes (P < .001), respectively.
Figure 3.
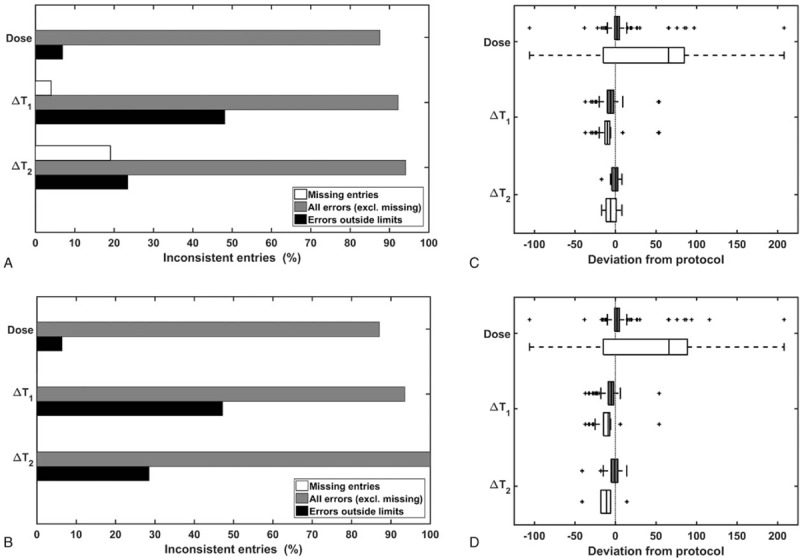
Number of entries noncompliant with protocol prescriptions shown as bar charts for patient record (A) and DICOM metadata (B) registrations, with and without deviations within allowed limits. Corresponding boxplots (C, D) of discrepancies, including (gray) and excluding (white) allowed deviations, display the range of variation in tracer dose [MBq] and uptake times [minutes] at early (ΔT1) and late (ΔT2) scans.
3.1. Quantitative impact
Variations in SUV normalization factors, Ω, calculated for deviant data entries can be seen in Figure 4A and B. For BW-based indices, SUV (BW), discrepant patient record and DICOM entries did not overall translate into significant SUV deviations (P ≈ .4). There, only error contributions RWeight and RDose signified a significant 0.72 ± 0.43 (P ≈ .02) and 1.02 ± 0.03 (P ≈ .02) times change in SUV, respectively.
Figure 4.

Variation in normalization factors, Ω, for SUV (BW) calculations with deviating parameters in FDG (A) and NaF (B) studies as well as (C) between entries most representative of true levels in acquired scans (Ωacq) vs. protocol targets (Ωproc), indicating parameter compliance variance. Similar plots for SUV (BSA) between discrepant patient record (Ωrec) and DICOM (Ωdic) entries of height and/or weight (D). BSA = body surface area, FDG = 2-deoxy-2-fluoro-D-glucose, NaF = sodium fluoride, SUV = standardized uptake value.
Inconsistencies with the prescribed protocol were found to be generally significant (P < .001). This only applied for early T1 but not late T2 time scans when tested separately. Such differences in DICOM (dic) and protocol (prot) entry SUV levels were by a factor RAll = Ωdic/Ωprot of 1.10 ± 0.25 (P < .001) for T1 and 1.03 ± 0.10 (P ≈ .12) for T2 scans. Similar differences were seen for patient record entries (rec) by a factor RAll = Ωrec/Ωprot of 1.10 ± 0.25 (P < .001) and 1.01 ± 0.06 (P ≈ .43). In the extraction of compliance variation, clocked scan time DICOM entries were considered more reliable than those in patient records and inversely so for all other recordings yielding the Ω variances seen in Figure 4C. Mistyped data in DICOM files did not appear to confound actual compliance-related variance, as SUVdic variation overall reflected fluctuations in protocol adherence. Proportional differences were, on the whole, otherwise similar to those of separate FDG studies (Table 2).
Table 2.
SUV (BW) parameter error ratios, R, between listed entries individually and collectively.

For BSA-based measures, height and weight misregistrations seen in about 6.5% (13/201) of all studies amounted to concomitantly significant BSA and SUV (BSA) deviations (Figure 4D). These errors gave DICOM-based SUV(BSA1) levels an average 0.79 ± 0.37 times those with patient record entries (P ≈ .01) and a corresponding factor of 0.78 ± 0.38 (P ≈ .003) in SUV(BSA2). Although the deviations pertaining to FDG studies remained significant (BSA1: 0.75 ± 0.40, P ≈ .02; BSA2: 0.74 ± 0.41, P ≈ .01), those in NaF studies generally did not (BSA1: 0.98 ± 0.03, P = .5; BSA2: 0.98 ± 0.02, P = .5). Between all corresponding DICOM and patient record entries, SUV (BSA) discordances overall, as well as among deviating entries only, were not significant (P ≈ .8) in this sample.
4. Discussion
The present study confirms that data registration errors are somewhat common, as implied in the literature.[5,25] Furthermore, the high frequency of protocol nonconformity seen is also in line with other studies.[25,26,30,31] However, we found manual misregistrations to be predominantly minor, with few significant discrepancies. Although no similar studies have been found to verify the generality of this finding, there is support in the literature. For instance, 0.8% to 7.4% of weight entries in patient reports deviated from actual values by >±10% in one study.[20] In the present study, this level of error was seen in 1.0% of the deviations between DICOM entries and measured weights noted in patient records. In contrast, mistyped dose in DICOM entries appears widely undocumented. The 8.0% occurrence we observed (all errors were <10%) was also low relative to reported weight error rates. Although manual scan time misrecordings, having the highest observed rate, also lack reporting, one study did note misregistered times between transmittal forms and DICOM data from 11 sites, giving 31.4% discrepant uptake times (>1 min, max. difference 1 hour 4 minutes).[25] In our listings, the analogous error count would total 10.5% (max. difference 59 minutes).
Our single-center error recordings thus appear generally lower than reported levels. Still, comparison with reports is limited and primarily involves intersite rather than intrasite accounts. Protocol adherence evaluation is likewise primarily reported in cross-center longitudinal variability [22,25,26] and test-retest repeatability [21,30] studies. These have typically small per-site sample sizes (n ≲ 20). No direct account is thus given of in-center compliance variation across any study population, as is provided here.
Our finding from our audit of practical procedures over a year that non-compliance was the most generally significant of errors is in line with reports of low protocol adherence[25] and high practical variability.[30] Especially uptake time variation is acknowledged as an enduring problem in oncological PET,[32] with considerable deviations noted in one single-center study.[30] Yet, our account of a 52.7% and 71.4% compliance (within ΔT ± 5 minutes) for early and late scans, respectively, was comparatively better than reported multisite compliances of 31.4%[25] and 35.0% [26] (both for ΔT ± 5 minutes). Higher-dose compliance of 93.0% (within dose ± 10%) was also seen, compared to a reported 79% to 86% for FDG dose ±25% and [18F]-deoxythymidine (FLT) dose ±10%.[22]
The above might suggest a perhaps expected higher variability in multicenter than in single-center settings. It also would imply highly variable intracenter error rates, which in some sites can be greater than what we found. The generally seen higher compliance in dose rather than uptake times is likely because of a reduction in error resulting from widely replacing manual with automated tracer administration.[33] However, retrospective compliance evaluation like this relies on correct parameter recordings without validation against true values. A prospective study would better assess this.
As SUV calculation with commercial analysis software generally uses parameters extracted from DICOM metadata, we evaluated variation in DICOM based SUVdic against patient record-based SUVrec as a ground truth proxy. Although entry errors caused largely insignificant SUV variability, instances of a −98% to 45% factor different SUVdic can be consequential in clinical applications. Variability naturally becomes more broadly significant in measures additionally reliant on height entries, as seen in SUV (BSA) as an example. Moreover, the translation of noncompliant dose and ΔT1 into overall significant SUV error factors can compromise comparability. The generally greatest ΔT1 error contribution is also reported by others.[21]
Thus frequent data entry inconsistencies can indeed cause sizeable errors in quantitative analyses. This warrants parameter checks as part of data processing. Overlooked errors can affect patient management and SUV variability weakens the power of clinical trials.[34] Data loss from lacking parameter registration further reduces statistical power. Whereas missing DICOM entries were not among our findings, a 5.4% to 32% loss has been reported.[20,26,31] Also, noncompliance has caused high data decimation in multicenter settings.[21,25,26] Our observations substantiate a general significance of such parameter inconsistency. Hence, protocol standardization alone does not suffice for reliable translational trials. Intracenter quantification variability by human error in data registration and compliance is an underlying limiting factor to intercenter harmonization. It must be integrally assessed for any such case. A greater transparency regarding reports of such variances is equally called for.
This first evaluation hence revealed a potentially significant clinical impact of data entry inconsistency and particularly non-conform practices. Moving forward, ongoing work-flow optimization beyond staff training is therefore needed. Besides persistent emphasis on correct data registration generally, data checks, for example, peer-based, should be worked into practices. Greater awareness of protocol adherence is imperative. Special reminders and attention are required for less common protocols, as errors were often linked to nonroutine practices, independent of the time of day, wherein especially changed ΔT targets (NaF vs. FDG studies) increased SUV variability. Prospective quality control[21] and developments to automate procedures can also promote reproducibility in clinical studies.
Author contributions
Conceptualization: Tram Nguyen.
Data curation: Christina Baun.
Formal analysis: Tram Nguyen.
Writing – original draft: Tram Nguyen.
Writing – review & editing: Christina Baun, Poul Flemming Høilund-Carlsen.
Footnotes
Abbreviations: BSA = body surface area, BW = body weight, DICOM = digital imaging and communications in medicine, FDG = 2-deoxy-2-fluoro-D-glucose, NaF = sodium fluoride, PET/CT = positron emission tomography/computed tomography, SUV = standardized uptake value.
The author(s) report no conflicts of interest.
References
- [1].Thie JA. Understanding the standardized uptake value, its methods, and implications for usage. J Nucl Med 2004;45:1431–4. [PubMed] [Google Scholar]
- [2].Shankar LK, Hoffman JM, Bacharach S, et al. Consensus recommendations for the use of 18F-FDG PET as an indicator of therapeutic response in patients in National Cancer Institute trials. J Nucl Med 2006;47:1059–66. [PubMed] [Google Scholar]
- [3].Boellaard R. Standards for PET image acquisition and quantitative data analysis. J Nucl Med 2009;50:11S–20S. [DOI] [PubMed] [Google Scholar]
- [4].Adams MC, Turkington TG, Wilson JM, et al. A systematic review of the factors affecting accuracy of SUV measurements. Am J Roentgenol 2010;195:310–20. [DOI] [PubMed] [Google Scholar]
- [5].Kinahan PE, Fletcher JW. PET/CT standardized uptake values (SUVs) in clinical practice and assessing response to therapy. Semin Ultrasound CT MR 2010;31:496–505. [DOI] [PMC free article] [PubMed] [Google Scholar]
- [6].Doot RK, Pierce LA, II, Byrd D, et al. Biases in multicenter longitudinal PET standardized uptake value measurements. Transl Oncol 2014;7:48–54. [DOI] [PMC free article] [PubMed] [Google Scholar]
- [7].Erdi YE, Nehmeh SA, Pan T, et al. The CT motion quantitation of lung lesions and its impact on PET measured SUVs. J Nucl Med 2004;45:1287–92. [PubMed] [Google Scholar]
- [8].Gorospe L, Raman S, Echeveste J, et al. Whole-body PET/CT: spectrum of physiological variants, artifacts and interpretative pitfalls in cancer patients. Nucl Med Commun 2005;26:671–87. [DOI] [PubMed] [Google Scholar]
- [9].Nahmias C, Wahl LM. Reproducibility of standardized uptake value measurements determined by 18F-FDG PET in malignant tumors. J Nucl Med 2008;49:1804–8. [DOI] [PubMed] [Google Scholar]
- [10].Geworski L, Knoop BO, de Wit M, et al. Multicenter comparison of calibration and cross calibration of PET scanners. J Nucl Med 2002;43:635–9. [PubMed] [Google Scholar]
- [11].Scheuermann JS, Saffer JR, Karp JS, et al. Qualification of PET scanners for use in multicenter cancer clinical trials: The American College of Radiology Imaging Network experience. J Nucl Med 2009;50:1187–93. [DOI] [PMC free article] [PubMed] [Google Scholar]
- [12].Doot RK, Scheuermann JS, Christian PE, et al. Instrumentation factors affecting variance and bias of quantifying tracer uptake with PET/CT. Med Phys 2010;37:6035–46. [DOI] [PMC free article] [PubMed] [Google Scholar]
- [13].Lodge MA, Chaudhry MA, Wahl RL. Noise considerations for PET quantification using maximum and peak standardized uptake value. J Nucl Med 2012;53:1041–7. [DOI] [PMC free article] [PubMed] [Google Scholar]
- [14].Akamatsu G, Ikari Y, Nishida H, et al. Influence of statistical fluctuation on reproducibility and accuracy of SUVmax and SUVpeak: a phantom study. J Nucl Med Technol 2015;43:222–6. [DOI] [PubMed] [Google Scholar]
- [15].Westerterp M, Pruim J, Oyen W, et al. Quantification of FDG PET studies using standardised uptake values in multi-centre trials: effects of image reconstruction, resolution and ROI definition parameters. Eur J Nucl Med Mol Imaging 2007;34:392–404. [DOI] [PubMed] [Google Scholar]
- [16].Bunyaviroch T, Turkington T, Wong T, et al. Quantitative effects of contrast enhanced CT attenuation correction on PET SUV measurements. Mol Imaging Biol 2008;10:107–13. [DOI] [PubMed] [Google Scholar]
- [17].Lockhart CM, MacDonald LR, Alessio AM, et al. Quantifying and reducing the effect of calibration error on variability of PET/CT standardized uptake value measurements. J Nucl Med 2011;52:218–24. [DOI] [PMC free article] [PubMed] [Google Scholar]
- [18].Kuhnert G, Boellaard R, Sterzer S, et al. Impact of PET/CT image reconstruction methods and liver uptake normalization strategies on quantitative image analysis. Eur J Nucl Med Mol Imaging 2016;43:249–58. [DOI] [PubMed] [Google Scholar]
- [19].International Atomic Energy Agency. PET/CT atlas on quality control and image artifacts. IAEA Human Health Series No. 27. Vienna: IAEA; 2014. [Google Scholar]
- [20].Lasnon C, Houdu B, Kammerer E, et al. Patients weight: a neglected cause of variability in SUV measurements? A survey from an EARL accredited PET centre in 513 patients. Eur J Nucl Med Mol Imaging 2016;43:197–9. [DOI] [PubMed] [Google Scholar]
- [21].Velasquez LM, Boellaard R, Kollia G, et al. Repeatability of 18F-FDG PET in a multicenter phase I study of patients with advanced gastrointestinal malignancies. J Nucl Med 2009;50:1646–54. [DOI] [PubMed] [Google Scholar]
- [22].Binns DS, Pirzkall A, Yu W, et al. Compliance with PET acquisition protocols for therapeutic monitoring of erlotinib therapy in an international trial for patients with non-small cell lung cancer. Eur J Nucl Med Mol Imaging 2011;38:642–50. [DOI] [PubMed] [Google Scholar]
- [23].Beyer T, Czernin J, Freudenberg LS. Variations in clinical PET/CT operations: results of an international survey of active PET/CT users. J Nucl Med 2011;52:303–10. [DOI] [PubMed] [Google Scholar]
- [24].Rausch I, Bergmann H, Geist B, et al. Variation of system performance, quality control standards and adherence to international FDG-PET/CT imaging guidelines. Nuklearmedizin 2014;53:242–8. [DOI] [PubMed] [Google Scholar]
- [25].Hristova I, Boellaard R, Vogel W, et al. Retrospective quality control review of FDG scans in the imaging sub-study of PALETTE EORTC 62072/VEG110727: a randomized, double-blind, placebo-controlled phase III trial. Eur J Nucl Med Mol Imaging 2015;42:848–57. [DOI] [PMC free article] [PubMed] [Google Scholar]
- [26].de Jong EEC, van Elmpt W, Hoekstra OS, et al. Quality assessment of positron emission tomography scans: recommendations for future multicentre trials. Acta Oncol 2017;22:1–6. [DOI] [PubMed] [Google Scholar]
- [27].Boellaard R, O’Doherty MJ, Weber WA, et al. FDG PET and PET/CT: EANM procedure guidelines for tumour PET imaging: version 1.0. Eur J Nucl Med Mol Imaging 2010;37:181–200. [DOI] [PMC free article] [PubMed] [Google Scholar]
- [28].Boellaard R, Oyen WJ, Hoekstra CJ, et al. The Netherlands protocol for standardisation and quantification of FDG whole body PET studies in multi-centre trials. Eur J Nucl Med Mol Imaging 2008;35:2320–33. [DOI] [PubMed] [Google Scholar]
- [29].Mosteller RD. Simplified calculation of body-surface area. N Engl J Med 1987;317:1098. [DOI] [PubMed] [Google Scholar]
- [30].Kumar V, Nath K, Berman CG, et al. Variance of standardized uptake values for FDG-PET/CT greater in clinical practice than under ideal study settings. Clin Nucl Med 2013;38:175–82. [DOI] [PMC free article] [PubMed] [Google Scholar]
- [31].Tahari AK, Wahl RL. Quantitative FDG PET/CT in the community: Experience from interpretation of outside oncologic PET/CT exams in referred cancer patients. J Med Imaging Radiat Oncol 2014;58:183–8. [DOI] [PMC free article] [PubMed] [Google Scholar]
- [32].van den Hoff J, Lougovski A, Schramm G, et al. Correction of scan time dependence of standard uptake values in oncological PET. EJNMMI Res 2014;4:18–31. [DOI] [PMC free article] [PubMed] [Google Scholar]
- [33].Lecchi M, Lucignani G, Maioli C, et al. Validation of a new protocol for 18F-FDG infusion using an automatic combined dispenser and injector system. Eur J Nucl Med Mol Imaging 2012;39:1720–9. [DOI] [PubMed] [Google Scholar]
- [34].Kinahan PE, Doot RK, Wanner-Roybal M, et al. PET/CT assessment of response to therapy: tumor change measurement, truth data, and error. Transl Oncol 2009;2:223–30. [DOI] [PMC free article] [PubMed] [Google Scholar]