

Abstract
Upper airway muscle activity is reportedly elevated during slow-wave sleep (SWS) when compared with lighter sleep stages. To uncover the possible mechanisms underlying this elevation, we explored the correlation between different indices of central and reflex inspiratory drive, such as the changes in airway pressure and end-expiratory CO2 and the changes in the genioglossus (GG) and tensor palatini (TP) muscle activity accompanying transitions from the lighter N2 to the deeper N3 stage of non-rapid eye movement (NREM) sleep in healthy young adult men. Forty-six GG and 38 TP continuous electromyographic recordings were obtained from 16 men [age: 20 ± 2.5 (SD) yr; body mass index: 22.5 ± 1.8 kg/m2] during 32 transitions from NREM stages N2 to N3. GG but not TP activity increased following transition into N3 sleep, and the increase was positively correlated with more negative airway pressure, increased end-tidal CO2, increased peak inspiratory flow, and increased minute ventilation. None of these correlations was statistically significant for TP. Complementary GG and TP single motor unit analysis revealed a mild recruitment of GG units and derecruitment of TP units during the N2 to N3 transitions. These findings suggest that, in healthy individuals, the increased GG activity during SWS is driven primarily by reflex stimulation of airway mechanoreceptors and central chemoreceptors.
NEW & NOTEWORTHY The characteristic increase in the activity of the upper airway dilator muscle genioglossus during slow-wave sleep (SWS) in young healthy individuals was found to be related to increased stimulation of airway mechanoreceptors and central chemoreceptors. No evidence was found for the presence of a central SWS-specific drive stimulating genioglossus activity in young healthy individuals. However, it remains to be determined whether a central drive exists in obstructive sleep apnea patients.
Keywords: slow-wave sleep, upper airway muscles, genioglossus, tensor palatini, non-rapid eye movement sleep
obstructive sleep apnea (OSA) is a prevalent disorder with associated cardiometabolic, behavioral, and cognitive consequences (8, 9, 19, 31). Continuous positive airway pressure is an effective treatment (8), but it is not consistently well tolerated, and adherence rates are not satisfactory (14), which motivates the search for new treatment modalities. An improved understanding of physiological mechanisms that can protect the upper airway against collapse may lead to development of alternative treatments for OSA.
In OSA patients, the frequency of airway occlusions during non-rapid eye movement (NREM) sleep is often lower during the deeper stage N3 [slow-wave sleep (SWS)] than during the lighter stage N2 (7, 25, 42). Consistent with these observations, the compound activity [multiunit integrated electromyogram (EMG)] of the upper airway muscle genioglossus (GG) has been reported to be elevated during stage N3 in healthy individuals (3) and OSA patients (13), and the activity of individual inspiratory-modulated GG motor units is higher during stage N3 than during the adjacent stage N2 epochs of NREM sleep (21). These observations have led to studies designed to increase stage N3 sleep (28, 37).
The increased upper airway muscle tone during stage N3 could be driven by reflex activation due to more negative upper airway pressure (negative pressure reflex) and the resulting stronger stimulation of upper airway mechanoreceptors, by an increased chemical drive for breathing due to increased CO2 (CO2 reflex drive), or by a central sleep-related drive specific for the state of SWS (central SWS-specific drive). Each of these mechanisms has been proposed to be functional in upper airway control during sleep and wakefulness in both basic animal models (15, 30) and human subjects (4, 5, 11, 16, 17, 20, 29, 34, 38). With regard to mechanoreceptor reflexes, in healthy persons GG has a stronger relationship with upper airway negative pressure than tensor palatini (TP) (18), although both have reduced responsiveness to upper airway negative pressure during NREM sleep when compared with quiet wakefulness (11, 38, 39). However, a direct comparison of the magnitude of these reflexes between stages N2 and N3 of NREM sleep has not been conducted. Also, importantly, in the studies reporting an improved airway patency and increased upper airway muscle tone during deep SWS when compared with lighter stages of NREM sleep (3, 7, 13, 21, 25), no definitive conclusions were reached as to the underlying mechanisms relating the changes in upper airway muscle activity to the changes in such key mechanical and chemical stimuli as upper airway pressure, tidal volume, or systemic CO2.
In the current study, we quantified the activity of two upper airway muscles, GG and TP, during adjacent epochs of stage N2 and N3 of NREM sleep and related their changes between the two states to the changes in upper airway pressure and end-tidal CO2. We elected to study GG and TP concurrently because, in humans, activities of these two muscles differ in the contribution of inspiratory drive to their overall activity. Specifically, whereas GG typically exhibits both tonic activity and a prominent inspiratory modulation, the TP is predominantly tonic with a relatively weak inspiratory component (32, 33). We hypothesized that this difference between the two muscles would be associated with a stronger correlation between changes in upper airway muscle activity and changes in reflex respiratory stimuli during N2 to N3 state transitions for GG than for TP. This finding, in turn, we hypothesized, would help identify distinct contributions of central and/or reflex respiratory drives to the control of upper airway muscle activity during deep NREM sleep.
METHODS
Subjects.
Subjects were recruited via advertisements around the University of Melbourne and by word of mouth. Male subjects were used, as an earlier study had demonstrated greater between-subject variability in airway resistance during sleep in males when compared with females, facilitating correlation analyses (35). All subjects completed a screening questionnaire that assessed basic demographic and health information and were excluded if they had medical conditions that would have made it inappropriate for them to participate or were likely to affect the results. Sleep-related respiratory disorders were not screened for, although the age and body weight of the group were not consistent with OSA, and only mild flow limitation was observed in some subjects during the study (see further comment below). The 49 subjects who completed the study had a mean age of 20.7 ± 2.5 yr (SD) and a mean body mass index of 22.5 ± 1.8. (kg/m2) The study conformed to the Declaration of Helsinki and was approved by the Human Research Ethics Committee of the University of Melbourne. All subjects provided written informed consent and were paid $100 (Australian) for each recording session. Other data from a subset of nine subjects (23) and from all 49 subjects (36) have been published previously.
Data collection environment.
Data were collected in the Sleep Laboratory at the School of Psychological Sciences, University of Melbourne, during one or two nighttime experimental sessions. Subjects were requested to refrain from consuming alcohol or caffeine for the day and evening immediately before experimental sessions and from consuming food for 4 h before coming to the laboratory. Subjects arrived at the laboratory at ~2100, the recording devices were attached, and recording commenced at ~2300 and continued for approximately 5 h. Subjects were studied in the supine position, which was effectively maintained by the constraints of the equipment.
Two electroencephalograms (EEG; C3 to A2 and O1 to A2), left and right electrooculograms (EOGs), and submental EMGs were recorded to identify sleep and its stages according to the standard criteria (12). The subjects wore full face masks (type 431; Fisher & Paykel, Auckland, New Zealand) equipped with two-way breathing valves (2600 medium; Hans Rudolph, Kansas City, MO), and a calibrated pneumotachograph (series 3710; Hans Rudolph) was placed between the mask and the valve. When attached, the mask, valve, and flow transducer had a combined dead space of ~163 ml. Airway pressure was monitored in the mask with an open-ended catheter attached to a pressure transducer and also in the airway at the level of the epiglottis using a pressure-tipped catheter (MPC-500; Millar, Houston, TX) inserted via one nostril. End-tidal CO2 ()was measured by sampling air in the mask (Ametek CO2 analyzer CD-3A; Ametek, Berwyn, PA). The pressure, flow, and signals were recorded as DC signals with a 15-Hz low-pass filter and amplified using carrier amplifier-demodulators (Validyne, Northridge, CA, or Grass Telefactor, West Warwick, RI). Tidal volume was computed online by integrating the airflow signal. Upper airway muscle activity was recorded using custom-made monopolar, intramuscular, stainless-steel, Teflon coated, fine-wire hook electrodes (no. 790600; AM Systems). Electrode diameter was 50.8 µm bare and 114.3 µm coated, with 0.5 mm of the tip exposed. Intramuscular electrodes were referenced to a surface electrode positioned over the bony mandible. The signals were digitized and acquired using a Cambridge Electronics 1401 interface and Spike-2 software (Cambridge Electronics Design, Cambridge, UK). All pressure, flow, and volume signals as well as EEG and EOG signals were digitized at the rate of 100 Hz. EMG recordings were filtered at 0.03–3 kHz and digitized at 10 kHz.
Two electrodes were inserted bilaterally (1 left and 1 right) into TP via a 25-gauge hypodermic needle. The needle was bent in the middle at an angle of ~30°. To insert the electrode, the tip of the pterygoid hamulus was located via palpation at the junction of the hard and soft palate and the tissue topically anesthetized (lidocaine HCl gel). The needle was then inserted at a 45° angle along the lateral surface of the medial pterygoid plate to a depth of 10–15 mm into the soft palate.
The procedures used to record GG EMG activity followed those of Eastwood et al. (6). Two wire electrodes were inserted using 25-gauge hypodermic needles to a depth of 2.4 cm from the surface of the skin, using a percutaneous approach. Previous studies using ultrasound to identify the location of the GG indicated that at this depth the electrode consistently entered the muscle (6, 26, 40). For each subject, either left anterior and right posterior or right anterior and left posterior positions were used for the two electrodes, with electrodes placed ~3 mm lateral on each side of the midline and ~10 and ~20 mm from the inferior margin of the mandible. Locations of the electrodes were confirmed by a number of respiratory maneuvers (sniffs, swallows, pressure of the tongue on the back of the teeth, and deep breaths) (27, 32).
Selection of stage N2 and N3 recording epochs for analysis.
The selection of N2 and N3 epochs is illustrated in Fig. 1. For pairwise comparisons, 30-s-long segments (epochs) of recordings representing N2 and N3 stages of NREM sleep were selected from the second minute of stage N2 and from the sixth min of the following stage N3 of NREM sleep. If the N3 duration was less than 6 min the last 30 s epoch was used for analysis. It was required that stage N2 and N3 epochs along with the sleep in-between were free of movement artefacts, microarousals, brief awakenings, and any other discontinuities that could be reflected in unstable sleep or respiration or potentially result in a movement of the recording electrodes within the muscles. Thus, sleep at the beginning (stage N2), during, or at the end (stage N3) of the transition was highly stable, with the exception of the development of EEG δ-activity, which defined SWS (stage N3). Recordings were also excluded as not technically valid if the epiglottic pressure, airflow, or CO2 recordings were distorted or discontinuous during or between the compared segments of recording. Furthermore, all breaths in which there was visual evidence of distorted air flow in the recording were removed from the analysis. However, stage N2 and N3 epochs showing mild and stable inspiratory flow limitation (IFL) were not discarded, and as such IFLs were considered to reflect normal sleep-related airway closure and thus to be pertinent to our hypotheses. Out of 32 transitions, four showed mild IFL during both stage N2 and N3 epochs, whereas six developed IFL in stage N3. Figure 1 illustrates the recordings used to analyze respiratory and EMG activities during a transition from N2 to N3 stage of NREM sleep. The trace also illustrates that even the most severe IFL observed in the study was quite minimal.
Fig. 1.

Top: transition from stage N2 of non-rapid eye movement (NREM) sleep (segment A) to stage N3 (segment B). Bottom: segments A and B enlarged. To allow for visually adequate expansion, the highlighted segments are ~20 s rather than the 30-s-long epochs that were used for analysis in this study. The signals shown are as follows: lead C3 to A2 of the electroencephalogram (EEG), CO2, epiglottic pressure (PEPI) – epiglottic pressure, flow – airway air flow, and the raw electromyograms (EMGs) recorded from the genioglossus (GG) and tensor palatini (TP). In this subject, there was evidence of flow limitation whose magnitude was larger than in other subjects enrolled in this study and thus represents a “worst case scenario.”
Postacquisition signal processing and analysis.
Respiratory parameters, such as the airway pressures, flow, and volume, were measured within the selected N2 and N3 epochs using a custom-made script running in Spike-2 software. The decisions of the respiratory cycle detection algorithm were visually checked and edited where necessary. Breath-by-breath values for a range of respiratory measures, as listed in Table 1, were calculated and then averaged within each epoch.
Table 1.
Means for respiratory variables as a function of sleep stage
| Stage N2 | Stage N3 | P Value | |
|---|---|---|---|
| Nadir PEPI, cmH2O | −4.75 (2.09) | −6.79 (3.59) | 0.002 |
| , mmHg | 39.9 (3.30) | 40.8 (3.88) | 0.02 |
| PEPI200, cmH2O | −1.91 (0.56) | −2.10 (0.52) | 0.06 |
| Rua200, cmH2O·l·s | 4.45 (2.61) | 5.31 (2.37) | 0.11 |
| PIF, l/min | 21.9 (2.50) | 21.0 (2.06) | 0.14 |
| Vt, liters | 0.51 (0.06) | 0.49 (0.07) | 0.29 |
| Vi, l/min | 7.00 (0.94) | 6.95 (0.85) | 0.80 |
| Ti, s | 1.96 (0.26) | 2.08 (0.36) | 0.06 |
| Te, s | 2.36 (0.50) | 2.40 (0.62) | 0.82 |
| Ttot, s | 4.41 (0.71) | 4.47 (0.83) | 0.69 |
N2 and N3 values are means (SD) and were initially averaged within subjects (average of 2 transitions/subject) and then across subjects (n = 16); N2 and N3 are stages 2 and 3 of non-rapid eye movement (NREM) sleep, respectively. Nadir PEPI, most negative epiglottic pressure; , partial end-tidal CO2; PEPI200, epiglottic pressure at the flow rate of 200 ml/s; Rua200, airway resistance at the flow rate of 200 ml/s; PIF, peak inspiratory flow; Vt, tidal volume; Vi, minute ventilation; Ti, inspiratory duration; Te, expiratory duration; Ttot, total respiratory cycle duration. P values are significance levels (based on paired comparisons). When variables were not normally distributed, statistical analysis was conducted on log-transformed data sets, although the table shows raw values.
For each N2 and N3 epoch, the overall level of muscle activity was quantified as the average EMG action potential (spike) frequency, which was measured as the frequency of those spikes in the EMG trace that exceeded a preset threshold voltage (this measurement assesses multiunit activity and is referred to here as the compound spike density to distinguish it from the discharge frequency of single motor units). The threshold was set at twice the voltage level of background noise; across all analyzed records it averaged 68.3 ± 26.5 µV (SD). Thresholds established for the N2 epoch remained the same for the subsequent N3 epoch in the analyzed pair of epochs. Mean compound spike densities were separately calculated for inspiration, expiration, total respiratory cycle, and the difference between inspiration and expiration. Transitions in which no suprathreshold EMG activity was present during both N2 and N3 epochs were not analyzed.
Recordings from the epochs selected for analysis of compound spike density were inspected to identify those containing one or more single motor units whose spikes could be isolated (decomposed) by means of an amplitude and pattern discrimination script available in Spike-2 software. Secondary software was then used to inspect and edit the initial classification of spikes on a spike-by-spike basis (software courtesy of Neuroscience Research Australia, Sydney, NSW, Australia). For a final verification that the spikes had been appropriately sorted, large (±40%) breath-by-breath changes in the instantaneous spike frequency of a sorted motor unit were identified. Such changes typically occur as a result of an incorrect inclusion or omission of a spike in a motor unit spike train. If >5% of these events could not be satisfactorily accounted for, the motor unit was excluded from the analysis (41).
The classification of motor units into different discharge patterns was determined through visual inspection of the instantaneous discharge frequency for each single motor unit relative to the airway pressure and flow signals. To ensure that motor units identified in each N2–N3 pair of epochs selected for analysis represented the same motor unit, each motor unit was visually tracked over the entire interval between the analyzed N2 and N3 epochs. Three of the previously reported discharge patterns (22, 26) were identified and analyzed: inspiratory phasic (IP) units that showed peak activity during inspiration and had a minimum firing frequency of < 2.0 Hz during expiration (i.e., were silent for > 500 ms), inspiratory tonic (IT) units that showed peak activity during inspiration and maintained a discharge rate >2.0 Hz throughout the respiratory cycle, and tonic (TT) units that were fired throughout the respiratory cycle, with no evidence of respiratory modulation.
Statistical analyses.
Four sets of analyses were conducted. First, changes in respiratory parameters associated with the transitions from N2 to N3 epochs were assessed by paired t-tests. N2 and N3 values were averaged over all analyzed transitions within subjects, with subjects being used as replications.
Second, compound spike density values for inspiration, expiration, total respiratory cycle, and the inspiratory/expiratory difference were calculated for each N2 and N3 epoch. When satisfactory EMG recordings were available for an N2–N3 transition for both electrodes placed in the same muscle (e.g., both GG electrodes), values for the two recordings were averaged and then averaged again over multiple N2 to N3 transitions within a subject. In this analysis, subjects were used as replications. Values were statistically assessed using a two (respiratory phase: inspiration vs. expiration) by two (sleep stage: N2 vs. N3) by two (muscle: GG vs. TP) ANOVA with muscle activities treated as independent variables and respiratory phase and sleep stage as repeated measures. In addition, the change from N2 to N3 was separately assessed for GG and TP at each respiratory phase by paired t-tests. For statistical analyses, because N2 inspiratory spike density values were not normally distributed, they were normalized using a natural log transformation.
In the third set of analyses, the magnitude of difference in each muscle’s activity (compound spike density) between stages N2 and N3 was correlated with the magnitude of the difference in respiratory parameters detected during each transition. When two EMG recordings were available for a muscle within a transition, their values were averaged before being entered into analyses. Because hypotheses referred to the relationship between changes in respiratory and muscle activity over transitions, transitions were treated as separate replications. However, because this could be interpreted as inflating the degrees of freedom, analyses were also conducted using subjects as replications.
Finally, the N2 to N3 changes in the discharge rates for the single motor units that were active in both sleep states were compared using paired t-tests.
RESULTS
Of the 49 subjects, 16 achieved N3 sleep and generated a total of 32 N2 to N3 transitions, which met our inclusion criteria (average of 2.0 transitions/subject). The two GG electrodes inserted into each subject provided 46 valid GG recordings (46 out of a potential 64), with all subjects having at least one valid recording (average of 2.9/subject). The two TP electrodes provided 38 valid TP recordings (38 out of a potential 64), with 14 subjects having at least one valid recording (average of 2.4/subject). Thus, 14 subjects provided both GG and TP data, whereas two provided only GG data; removal of the data from the latter two subjects did not change the results.
Respiratory parameters during stages N2 and N3 of NREM sleep.
As indicated in Table 1, stage N3 was associated with a greater nadir of epiglottic negative (inspiratory) airway pressure (PEPI) than N2. was significantly higher in stage N3 than in N2. Negative airway pressure and instantaneous airway resistance measured at a flow rate of 200 ml/s exhibited a similar trend, but the mean N2 to N3 differences were not statistically significant. No other respiratory parameters were significantly different between the two sleep stages.
Compound GG and TP spike density during stages N2 and N3 of NREM sleep.
The average compound spike density values for GG and TP during inspiration and expiration, across the entire respiratory cycle, and for the inspiratory/expiratory difference across all subjects are presented in Table 2. For all available GG and TP measurements combined, muscle activity was higher during inspiration than expiration [significant main effect of respiratory phase, F(1,28) = 21.9, P < 0.001], with a tendency for the difference to be greater for GG than TP [2-way interaction effect between muscle type and respiratory phase approached significance, F(1,28) = 4.13, P = 0.052]. For both muscles combined, activity did not differ between sleep stages [nonsignificant main effect of sleep stage, F(1,28) = 0.06, P = 0.831]. However, spike density was greater during N3 than N2 for GG, but not for TP, as indicated by a significant two-way interaction between muscle type and sleep stage [F(1,28) = 4.37, P = 0.046]; indeed spike density values for TP decreased slightly (Table 2). The effect of sleep stage did not differ as a function of respiratory phase [nonsignificant 2-way interaction effect between sleep stage and respiratory phase, F(1,28) = 1.15, P = 0.294]. Finally, the nonsignificant main effect of muscle type indicated that overall GG activity did not differ from TP [F(1,28) = 3.37, P = 0.077], nor was there a significant three-way interaction effect [F(1,28) = 0.47, P = 0.500].
Table 2.
Compound spike density values (spikes/s) for the GG and tensor TP muscles as a function of sleep stage and respiratory phase
| GG (n = 16) |
TP (n = 14) |
|||||
|---|---|---|---|---|---|---|
| Respiratory phase | N2 | N3 | P value | N2 | N3 | P value |
| Inspiration | 56.9 (34.6) | 77.7 (37.0) | 0.03 | 36.2 (22.7) | 34.3 (29.3) | 0.27 |
| Expiration | 34.9 (26.1) | 45.8 (33.0) | 0.04 | 30.1 (21.6) | 26.3 (23.7) | 0.24 |
| Total breath | 45.9 (29.8) | 61.8 (34.1) | 0.03 | 33.2 (21.9) | 30.3 (26.4) | 0.31 |
| Inspiration/expiration | 22.0 (14.0) | 31.9 (16.7) | 0.01 | 6.1 (6.9) | 8.0 (8.0) | 0.41 |
N2 and N3 values are means (SD) and were averaged over transitions within subjects and then across subjects. GG, genioglossus; TP, palatini. P values correspond to paired comparisons between N2 and N3 stages of NREM sleep within each muscle. Significant main and interaction effects are described in the text. When variables were not normally distributed, statistical analysis was conducted on log-transformed data sets, although the table shows raw values.
Correlation between changes in upper airway muscle activity and respiratory parameters during transitions from stage N2 to N3 of NREM sleep.
The correlation coefficients showing the relationship between N2 to N3 changes in compound muscle activities and the corresponding changes in respiratory parameters for the 32 GG transitions and 16 subjects and 22 TP transitions and 14 subjects are presented in Table 3. For GG, increases in negative airway pressure (nadir PEPI), , peak inspiratory flow (PIF), and minute ventilation (Vi) were positively correlated with increases in inspiratory GG activity over transitions (negative correlation for nadir PEPI). Of interest is that the fall in nadir PEPI remained significantly correlated with the rise in GG when the 10 transitions with IFL during N3 were removed (r = 0.51, P < 0.05). Although correlation values increased for nadir PEPI, , and PIF when analyses were based on subjects, due to the reduced degrees of freedom, only nadir PEPI remained significant, whereas was close to being significant (r = 0.48, P = 0.0505). It is of note that Vi and PIF were positively correlated with GG activity over transitions despite there not being a change in their mean values during transitions, suggesting that Vi and PIF tended to increase with large increases in GG but decrease with small increases in GG and thus did not have a significant change in mean value (Table 1). For GG activity during expiration, only changes in the nadir of PEPI over transitions showed a significant relationship with changes in GG activity. The scatter plots showing the relationships between changes in inspiratory GG compound spike density during N2 to N3 transitions and both PEPI and are illustrated in Fig. 2, A and B, respectively. Although it might appear that the presence of significant correlations was strongly influenced by one data point located far to the right in these two plots, when this data point was removed, the correlation coefficient for the nadir of PEPI increased from −0.49 to −0.60, whereas that for was essentially unchanged (0.39 rather than 0.40).
Table 3.
Correlation coefficients between changes in respiratory parameters and compound spike density between stages N2 and N3 of NREM sleep determined separately for GG and TP activities during inspiration and expiration
| GG |
TP |
|||||||
|---|---|---|---|---|---|---|---|---|
| Transitions |
Subjects |
Transitions |
Subjects |
|||||
| Inspiration | Expiration | Inspiration | Expiration | Inspiration | Expiration | Inspiration | Expiration | |
| Nadir PEPI | −0.49** | −0.48** | −0.55* | −0.30 | −0.20 | −0.14 | −0.22 | −0.15 |
| 0.40* | 0.22 | 0.48 | 0.33 | −0.07 | −0.09 | −019 | −0.24 | |
| PEPI200 | 0.18 | 0.10 | 0.34 | 0.32 | 0.24 | 0.19 | 0.24 | 0.19 |
| Rua200 | −0.20 | −0.13 | −0.34 | −0.32 | −0.24 | −0.18 | −0.23 | −0.17 |
| PIF | 0.39* | 0.31 | 0.44 | 0.34 | 0.35 | 0.28 | 0.27 | 0.21 |
| Vt | 0.30 | 0.14 | 0.23 | 0.09 | −0.08 | −0.11 | −0.22 | −0.24 |
| Vi | 0.44* | 0.30 | 0.37 | 0.21 | −0.16 | −0.22 | 0.37 | 0.21 |
| Ti | −0.18 | −0.09 | −0.10 | 0.03 | −0.01 | −0.03 | −0.10 | 0.03 |
| Te | −0.33 | −0.23 | −0.37 | −0.28 | 0.15 | −0.17 | −0.37 | −0.28 |
| Ttot | −0.25 | −0.26 | −0.32 | −0.26 | 0.28 | 0.33 | −0.32 | −0.26 |
P < 0.05 and
P < 0.01, significant correlations between respiratory parameters and compound muscle electromyogram.
Fig. 2.
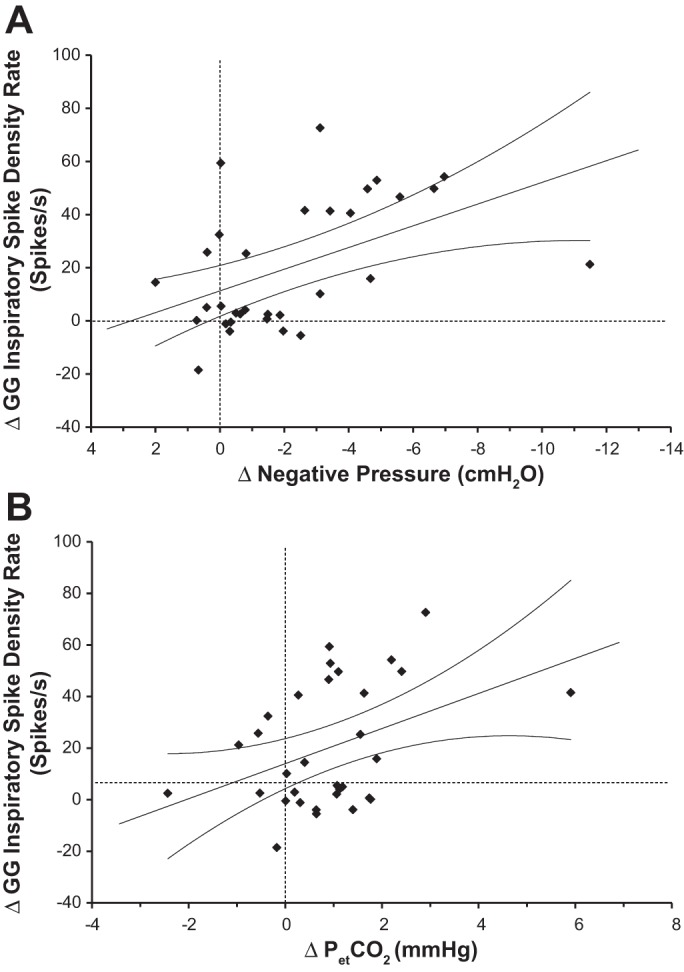
Scatter plots showing the relationship between the change from stage N2 to stage N3 of NREM sleep in the mean GG compound spike density during inspiration and the concurrent changes in the nadir of airway pressure (A) or end-tidal CO2 (; B). Data points represent paired differences between stage N3 and stage N2 values. Dashed lines indicate the levels of no difference between the 2 stages; straight lines represent the linear regression for all data points in the plots, whereas curvilinear lines indicate the 95% confidence intervals.
In contrast to GG, changes in TP activity associated with stage N2 to N3 transitions were not significantly correlated with any of the respiratory parameters (Table 3).
Multiple regression analyses of the transition-based data, in which variables were entered according to the strength of their correlation coefficients, indicated that for GG inspiratory activity, both Vi and significantly increased the amount of variance accounted for by PEPI (P = 0.023 and P = 0.037, respectively, accounting for 46% of the variance). In contrast, for changes in GG expiratory and TP inspiratory and expiratory activities, the addition of these variables had no effect.
The scatter plots showing the relationships between the nadir of PEPI and on the one hand and Vi and on the other hand are shown in Fig. 3, A and B, respectively. Neither of these relationships was significant.
Fig. 3.
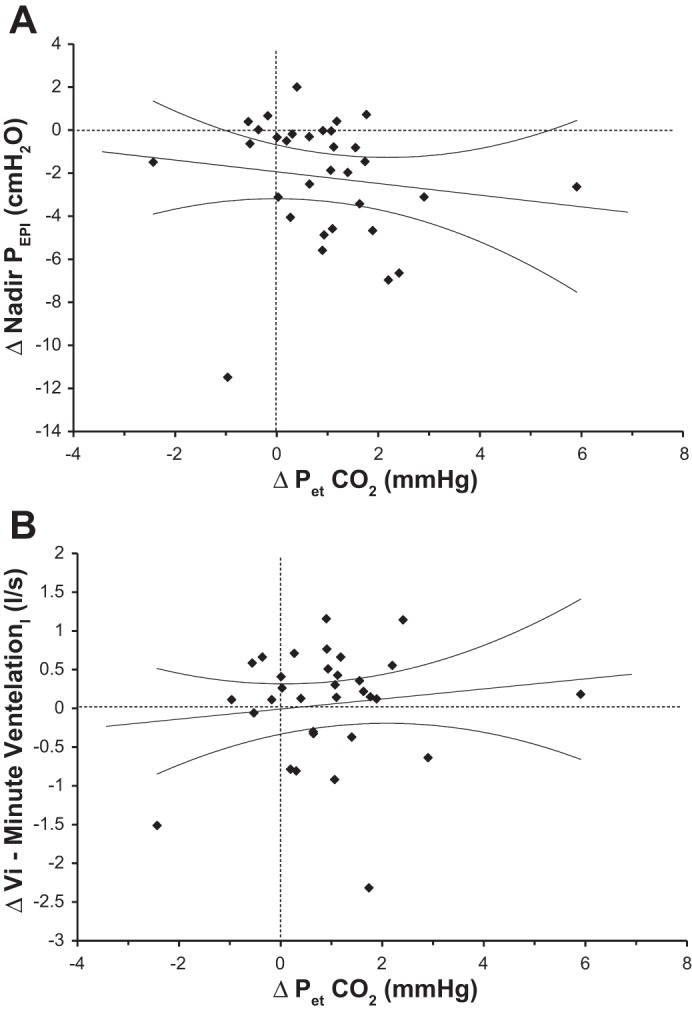
Scatter plots showing the relationship between the change from stage N2 to stage N3 of NREM sleep in the mean and the concurrent changes in the nadir of epiglottic pressure (PEPI; A) and minute ventilation (Vi; B). Data points represent paired differences between stage N3 and stage N2 values. Dashed lines indicate the levels of no difference between the two stages; straight lines represent the linear regression for all data points in the plots, whereas curvilinear lines indicate the 95% confidence intervals.
Single motor unit activity.
Twenty-nine GG and 11 TP single motor units were active during both the N2 and N3 stages and were available for analysis of changes in their activity during the N2 to N3 transitions. For GG, nine were IP, 19 were IT, and one was tonic. For TP, the corresponding counts were two, seven, and two, respectively. The discharge rate characteristics for all inspiratory-modulated units recorded from both muscles are presented in Table 4. Although there was a tendency for discharge rates to be higher during stage N3 than N2 for IP units in both muscles, the differences were not significant within any one muscle. Similarly, the N2 to N3 difference in activity was not significant when the tonic and phasic discharge patterns were combined within a muscle or when single motor unit data from both muscles were combined (all P > 0.05).
Table 4.
Mean GG and TP single motor unit discharge rates for IP and IT units during stage N2 and the subsequent stage N3 of NREM sleep
| Discharge Rates, Hz |
||||||
|---|---|---|---|---|---|---|
| Peak |
Variable mean |
Tonic |
||||
| N2 | N3 | N2 | N3 | N2 | N3 | |
| Muscle and discharge pattern | ||||||
| GG | ||||||
| IP (n = 9) | 28.2 (3.3) | 30.5 (4.5) | 22.0 (1.8) | 25.3 (7.9) | ||
| IT (n = 19) | 27.5 (4.5) | 27.0 (4.9) | 20.8 (3.5) | 20.3 (4.6) | 13.4 (4.5) | 12.4 (4.6) |
| TP | ||||||
| IP (n = 2) | 20.3 (2.0) | 21.3 (0.4) | 15.6 (1.3) | 16.1 (1.0) | ||
| IT (n = 7) | 22.5 (7.3) | 23.4 (6.9) | 19.2 (7.4) | 20.1 (6.9) | 14.7 (6.4) | 15.2 (5.4) |
Values are means (SD). IP, inspiratory phasic; IT, inspiratory tonic. Tonic firing rates represent the means calculated during expiration. See text for the definitions of different measures of motor unit activity.
Six additional GG motor units that were silent during stage N2 were recruited during the N2 to N3 transitions, and one unit that was active during N2 became silent before entry into stage N3 (derecruitment). In contrast, five TP motor units active during N2 were derecruited before stage N3, and only one was recruited. Chi-square analyses indicated that the difference in the distribution of recruited vs. derecruited units between the two muscles was significant (6 vs. 1 compared with 1 vs. 5, P < 0.01). However, the number of active units during N2 compared with N3 for each muscle did not change significantly for either muscle [30 (N2) vs. 35 (N3) for GG and 12 vs. 7 for TP, P > 0.05].
DISCUSSION
We evaluated the relationship between changes in the activity of two upper airway muscles, GG and TP, and changes in respiratory parameters during the transition from stage N2 to stage N3 of NREM sleep in healthy, young, male sleepers. Our aim was to test the hypothesis that upper airway muscle activity is elevated during N3 sleep independently of an increase in reflex drives for breathing derived from airway mechanoreceptors and/or chemoreceptors, thus supporting the presence of a central SWS-specific drive to the muscles. To address this issue, we assessed concurrently occurring changes in the respiratory parameters , PIF, PEPI, epiglottic pressure at the flow rate of 200 ml/s, airway resistance at the flow rate of 200 ml/s, tidal volume, minute ventilation, inspiratory duration, expiratory duration, and total respiratory cycle duration and in GG and TP muscle activities. When analyzing changes within transitions, we found significantly higher negative peak inspiratory epiglottic pressure and during stage N3 than stage N2. We also found positive relationships between increases in peak negative inspiratory epiglottic pressure, , Vi, and PIF and increases in inspiratory GG activity. Furthermore, Vi and significantly added to the variance accounted for by negative airway pressure, with the three variables accounting for 46% of the variance. When analyses were repeated using subjects as replications, each of these relationships tended to account for more of the variance, although due to the reduced number of replications only nadir PEPI was significant.
These findings are consistent with the increase in upper airway dilatory activity of the GG being caused during N3 by increased reflex inspiratory drive, particularly drive from negative airway pressure. However, the contribution of CO2 in activating GG was less compelling. This may have been because the increase in from stage N2 to stage N3 was small. Nevertheless, the magnitude of the change was consistent with the increase observed by McSharry et al. (21) and was broadly consistent with other studies that have shown a positive effect of CO2 on GG during sleep in the supine position (17). Although increases in only correlated significantly with increases in GG when transitions were used as replications, the correlation over subjects showed a very strong trend and accounted for a greater proportion of the variance than the correlation over transitions.
Although the correlation analysis showed a strong positive relationship between respiratory stimuli, particularly negative airway pressure, the analysis also indicated that 54% of the variance was unaccounted for. Thus, the present finding does not exclude the existence of a separate central, state-dependent, excitatory or inhibitory drive that could be concurrently activated during the state of deep SWS, particularly in other populations such as OSA patients, or under different experimental conditions. However, our present data suggest that in this sample of healthy subjects, the magnitude of such a hypothetical central drive acting on GG muscle output, if present, was overridden by effects that are likely reflexes in nature. Consistent with this interpretation, our concurrent measurements of the changes in activity of the TP muscle did not reveal any distinct activating effect of stage N3 when compared with stage N2 of NREM sleep and correlation analysis did not yield any significant relationships between any of the respiratory parameters and changes in TP activity. Hence, the excitatory drive that we detected during N3 stage of NREM sleep and found positively correlated with other measures of inspiratory drive was detected only in the upper airway muscle, which is known for its relatively strong dependence on inspiratory drive (32, 33).
In addition to the correlational data, compound spike density decreased slightly in TP, whereas GG activity increased, and TP single motor units tended to derecruit over the N2 to N3 transition, whereas GG motor units were recruited. Thus, collectively, our data suggest that, whereas GG activity increases as NREM sleep progresses, TP activity does not. This difference can be explained on the basis of different magnitudes of central inspiratory drives that control these two muscles (32, 33). The fact that TP activity tended to decrease during the transition from stage N2 to N3 suggests that the reduction in excitatory influences on TP that are prominent at sleep onset continue into deep SWS, and this effect was not reflexively reversed by increased upper airway negative pressure and the small increases in that occurred during transitions from stage N2 to N3 in the present study. Thus, a possible suppressant effect of deep SWS on TP activity was not observed in GG because it was masked by relatively larger reflex influences that act in the opposite direction.
Our present findings and their interpretation are different from the suggestions of McSharry et al. (21) who, in the absence of a measure of airway pressure, tentatively attributed increases in GG activity during N2 to N3 transitions to a central excitatory drive specific to stage N3 of NREM sleep. In the context of earlier demonstrations that respiratory drive directed to the GG muscle has a more prominent respiratory component than that in the TP muscle (32, 33), our present comparison of the effects of N2 to N3 transition on GG and TP activities is consistent with a respiratory reflex origin of the N3 state-related increase in the inspiratory activity of GG activity.
Because both negative airway pressure and tended to increase during the N2 to N3 transitions, it might have been anticipated that changes in the two variables would be positively correlated, although a similar change in the mean sleep stage values for two variables does not require that the individual transition changes for the two variables will be correlated. Indeed, the multiple regression analysis indicated they made independent contributions to the change in GG muscle activity.
Given that changes in respiratory parameters and upper airway muscle activity were studied over relatively graded and modest changes in state occurring within the state of NREM sleep, the changes in both respiratory effort and muscle activity, as presented in Tables 1 and 2, respectively, are of moderate magnitude and within the range anticipated from a sample of young healthy men (35). Furthermore, although the current data are correlational, it is reasonable to interpret our GG data as reflective of changes in reflexively driven central respiratory drive on GG activity. In support of this interpretation, the literature indicates that negative airway pressure in particular and CO2 to a lesser extent stimulate GG upper airway muscle activity in healthy human subjects during sleep (1, 11, 17, 24). Accordingly, our finding that the increase in GG activity during stage N3 was more marked during inspiration points to the GG activation as being predominantly dependent on changes in reflex inspiratory drive.
It might be argued that airway narrowing, as indicated by increased negative pressure, despite an increase in GG activity, reflected the observation that airway narrowing occurs in the retropalatal airway, an area that is possibly more influenced by TP than GG. However, although the current data indicate that GG activity increases in response to respiratory stimuli, we do not argue that GG is the sole protector of airway patency. Indeed data suggest that muscles of the upper airway need to be coactivated to protect the airway against collapse (10).
Consistent with the previous report by McSharry et al. (21), we observed an increase in GG activity on transition from N2 to N3 sleep stages. The increase was reflected in two measures: the compound spike density, particularly during inspiration, and recruitment of previously silent GG motor units. Additionally, McSharry et al. (21) identified an increase in the discharge rate of single GG motor units, an effect that was not significant in the current study. The reason for this difference may relate to subtle differences in motor unit samples identified in the two studies. The study by McSharry at al. (21) identified more IP units (15 of 26 units, 58%), whereas in the current study only nine of 29 units (31%) were of the IP type. In the current study, the IP units showed a moderate increase similar in magnitude to the McSharry et al. (21) data, but with the small sample size the increase was not significant. A similar difference between changes in the discharge rate of active motor units and recruitment of new units has also been noted in the responses of upper airway single motor units to hypercapnia (2).
One difference between this and the earlier study (21) was that subjects’ mouths were taped shut in the earlier study, whereas they were unconstrained in this study. However, subjects typically sleep with their mouths closed, and we consider it unlikely that the presence of a SWS-specific drive to GG would be dependent on nasal breathing or on subjects’ mouths being taped shut.
The hypothesis of a state-dependent central excitatory drive related to the state of SWS proposed by McSharry et al. (21) was based on their single GG motor unit studies and was consistent with the observation that the frequency of obstructions in OSA patients was lower during SWS than during stage N2 sleep (7, 25, 42). However, the data of McSharry et al. (21) did not allow for a direct correlation between GG activity and respiratory parameters during transitions from stage N2 to N3. As reasoned above, the current study suggests that elevated GG activity during stage N3 is due at least in part to elevated reflex inspiratory drive during this stage of NREM sleep. Thus overall, our current results do not provide evidence for the presence of a distinct state-dependent drive related specifically to the state of deep NREM sleep (SWS), but they do not definitely exclude this possibility. Indeed, it is possible that a deep NREM sleep-related excitatory drive is included in what we detected in the current study as a drive whose magnitude was separately correlated with the combined magnitudes of changes in minute ventilation, , and nadir PEPI, and the hypothetical, distinct state-dependent component could not be uncovered due to the lack of an appropriate reference variable. In support of this possibility, in rats, whose upper airways do not have a propensity for collapse during sleep, enhancement of inspiratory activation of the GG occurs as the animals progress into deeper stages of SWS (30). This enhancement was not associated with respiratory rate changes, which would point to an increased respiratory drive but was associated with reduced EEG power in the β-frequency range. These findings suggested that a more detailed analysis of EEG changes during NREM sleep in humans may help uncover how different substages of NREM sleep correlate with the magnitude of the motor output to different upper airway muscles. Such an analysis may reveal additional state-dependent influences on upper airway muscle activity in humans that the present study was not designed to address.
The current study was conducted on healthy young men. Men were chosen because they are known to have greater between-subject variability in sleep-related airway resistance (35), a considerable advantage for a study based on correlational analyses. Healthy men, rather than OSA patients, were chosen because obstructions raise the problem of electrode movements that may disrupt the continuity of the records. It is possible that there are sex- and OSA-related differences in the nature of central and reflex respiratory drives affecting upper airway muscle activity during different stages of NREM sleep that our study was not able to uncover.
Conclusions.
The current study has shown that, when compared with the N2 stage of NREM sleep, increases in GG muscle activity during stage N3 sleep are associated with increased reflex respiratory drives secondary to reduced ventilation. In these young healthy subjects we have not found evidence for the presence in GG activity of an additional excitatory drive distinctly related to the state of deep SWS. Furthermore, the activity of TP, which is known to be relatively insensitive to respiratory drive, was unaffected as N3 sleep developed despite the concurrent mild changes in respiratory parameters that pointed to enhanced reflex inspiratory drive. We speculate that the incidence of upper airway obstructions is reduced during stage N3 sleep in OSA patients because of the enhancement of GG dilatory activity reflexively mediated by the respiratory system. Due to the major role of GG in protecting the airway against collapse, its activation may at times be sufficient to oppose the airway-collapsing forces effectively, even in the absence of significant coactivation of other airway dilators whose activity is less dependent on respiratory drive.
GRANTS
This work was supported by the Australian Research Council (grant no. DP120101343).
DISCLOSURES
No conflicts of interest, financial or otherwise, are declared by the authors.
AUTHOR CONTRIBUTIONS
A.H., J.M.C., A.S.J., L.K., and J.A.T. analyzed data; A.H., A.S.J., C.L.N., L.K., J.G.S., A.M., and J.A.T. interpreted results of experiments; A.H., J.M.C., A.S.J., C.L.N., L.K., J.G.S., A.M., D.G.P.M., and J.A.T. edited and revised manuscript; A.H., J.M.C., A.S.J., C.L.N., L.K., J.G.S., A.M., D.G.P.M., and J.A.T. approved final version of manuscript; A.S.J., C.L.N., and J.A.T. performed experiments; A.S.J., C.L.N., and J.A.T. drafted manuscript; C.L.N. and J.A.T. prepared figures; J.A.T. conceived and designed research.
REFERENCES
- 1.Akahoshi T, White DP, Edwards JK, Beauregard J, Shea SA. Phasic mechanoreceptor stimuli can induce phasic activation of upper airway muscles in humans. J Physiol : 677–691, 2001. doi: 10.1111/j.1469-7793.2001.0677h.x. [DOI] [PMC free article] [PubMed] [Google Scholar]
- 2.Bailey EF. Activities of human genioglossus motor units. Respir Physiol Neurobiol : 14–22, 2011. doi: 10.1016/j.resp.2011.04.018. [DOI] [PMC free article] [PubMed] [Google Scholar]
- 3.Basner RC, Ringler J, Schwartzstein RM, Weinberger SE, Weiss JW. Phasic electromyographic activity of the genioglossus increases in normals during slow-wave sleep. Respir Physiol : 189–200, 1991. doi: 10.1016/0034-5687(91)90028-H. [DOI] [PubMed] [Google Scholar]
- 4.DeWeese EL, Sullivan TY. Effects of upper airway anesthesia on pharyngeal patency during sleep. J Appl Physiol (1985) : 1346–1353, 1988. [DOI] [PubMed] [Google Scholar]
- 5.Doherty LS, Nolan P, McNicholas WT. Effects of topical anesthesia on upper airway resistance during wake-sleep transitions. J Appl Physiol (1985) : 549–555, 2005. doi: 10.1152/japplphysiol.01221.2004. [DOI] [PubMed] [Google Scholar]
- 6.Eastwood PR, Allison GT, Shepherd KL, Szollosi I, Hillman DR. Heterogeneous activity of the human genioglossus muscle assessed by multiple bipolar fine-wire electrodes. J Appl Physiol (1985) : 1849–1858, 2003. doi: 10.1152/japplphysiol.01017.2002. [DOI] [PubMed] [Google Scholar]
- 7.Eckert DJ, Malhotra A, Jordan AS. Mechanisms of apnea. Prog Cardiovasc Dis : 313–323, 2009. doi: 10.1016/j.pcad.2008.02.003. [DOI] [PMC free article] [PubMed] [Google Scholar]
- 8.Epstein LJ, Kristo D, Strollo PJ Jr, Friedman N, Malhotra A, Patil SP, Ramar K, Rogers R, Schwab RJ, Weaver EM, Weinstein MD; Adult Obstructive Sleep Apnea Task Force of the American Academy of Sleep Medicine . Clinical guideline for the evaluation, management and long-term care of obstructive sleep apnea in adults. J Clin Sleep Med : 263–276, 2009. [PMC free article] [PubMed] [Google Scholar]
- 9.Gottlieb DJ, Yenokyan G, Newman AB, O’Connor GT, Punjabi NM, Quan SF, Redline S, Resnick HE, Tong EK, Diener-West M, Shahar E. Prospective study of obstructive sleep apnea and incident coronary heart disease and heart failure: the sleep heart health study. Circulation : 352–360, 2010. doi: 10.1161/CIRCULATIONAHA.109.901801. [DOI] [PMC free article] [PubMed] [Google Scholar]
- 10.Huang Y, White DP, Malhotra A. The impact of anatomic manipulations on pharyngeal collapse: results from a computational model of the normal human upper airway. Chest : 1324–1330, 2005. doi: 10.1378/chest.128.3.1324. [DOI] [PMC free article] [PubMed] [Google Scholar]
- 11.Horner RL, Innes JA, Morrell MJ, Shea SA, Guz A. The effect of sleep on reflex genioglossus muscle activation by stimuli of negative airway pressure in humans. J Physiol : 141–151, 1994. doi: 10.1113/jphysiol.1994.sp020118. [DOI] [PMC free article] [PubMed] [Google Scholar]
- 12.Iber C, Ancoli-Israel S, Chessonn A, Quan SF; American Academy of Sleep Medicine . The AASM manual for the scoring of sleep and associated events: rules terminology and technical specifications. Westchester, IL: American Academy of Sleep Medicine, 2007. [Google Scholar]
- 13.Jordan AS, White DP, Lo YL, Wellman A, Eckert DJ, Yim-Yeh S, Eikermann M, Smith SA, Stevenson KE, Malhotra A. Airway dilator muscle activity and lung volume during stable breathing in obstructive sleep apnea. Sleep : 361–368, 2009. [DOI] [PMC free article] [PubMed] [Google Scholar]
- 14.Kohler M, Smith D, Tippett V, Stradling JR. Predictors of long-term compliance with continuous positive airway pressure. Thorax : 829–832, 2010. doi: 10.1136/thx.2010.135848. [DOI] [PubMed] [Google Scholar]
- 15.Kuna ST, Sant’Ambrogio G. Pathophysiology of upper airway closure during sleep. JAMA : 1384–1389, 1991. doi: 10.1001/jama.1991.03470100076036. [DOI] [PubMed] [Google Scholar]
- 16.Kuna ST, Smickley J. Response of genioglossus muscle activity to nasal airway occlusion in normal sleeping adults. J Appl Physiol (1985) : 347–353, 1988. [DOI] [PubMed] [Google Scholar]
- 17.Lo YL, Jordan AS, Malhotra A, Wellman A, Heinzer RC, Schory K, Dover L, Fogel RB, White DP. Genioglossal muscle response to CO2 stimulation during NREM sleep. Sleep : 470–477, 2006. [DOI] [PMC free article] [PubMed] [Google Scholar]
- 18.Malhotra A, Pillar G, Fogel RB, Beauregard J, Edwards JK, Slamowitz DI, Shea SA, White DP. Genioglossal but not palatal muscle activity relates closely to pharyngeal pressure. Am J Respir Crit Care Med : 1058–1062, 2000. doi: 10.1164/ajrccm.162.3.9912067. [DOI] [PubMed] [Google Scholar]
- 19.Lojander J, Kajaste S, Maasilta P, Partinen M. Cognitive function and treatment of obstructive sleep apnea syndrome. J Sleep Res : 71–76, 1999. doi: 10.1046/j.1365-2869.1999.00141.x. [DOI] [PubMed] [Google Scholar]
- 20.Mateika JH, Millrood DL, Kim J, Rodriguez HP, Samara GJ. Response of human tongue protrudor and retractors to hypoxia and hypercapnia. Am J Respir Crit Care Med : 1976–1982, 1999. doi: 10.1164/ajrccm.160.6.9903001. [DOI] [PubMed] [Google Scholar]
- 21.McSharry DG, Saboisky JP, Deyoung P, Matteis P, Jordan AS, Trinder J, Smales E, Hess L, Guo M, Malhotra A. A mechanism for upper airway stability during slow wave sleep. Sleep : 555–563, 2013. [DOI] [PMC free article] [PubMed] [Google Scholar]
- 22.Nicholas CL, Bei B, Worsnop C, Malhotra A, Jordan AS, Saboisky JP, Chan JK, Duckworth E, White DP, Trinder J. Motor unit recruitment in human genioglossus muscle in response to hypercapnia. Sleep : 1529–1538, 2010. doi: 10.1093/sleep/33.5.1529. [DOI] [PMC free article] [PubMed] [Google Scholar]
- 23.Nicholas CL, Jordan AS, Heckel L, Worsnop C, Bei B, Saboisky JP, Eckert DJ, White DP, Malhotra A, Trinder J. Discharge patterns of human tensor palatini motor units during sleep onset. Sleep : 699–707, 2012. doi: 10.5665/sleep.1834. [DOI] [PMC free article] [PubMed] [Google Scholar]
- 24.Onal E, Lopata M, O’Connor TD. Diaphragmatic and genioglossal electromyogram responses to isocapnic hypoxia in humans. Am Rev Respir Dis : 215–217, 1981. doi: 10.1164/arrd.1981.124.3.215. [DOI] [PubMed] [Google Scholar]
- 25.Ratnavadivel R, Chau N, Stadler D, Yeo A, McEvoy RD, Catcheside PG. Marked reduction in obstructive sleep apnea severity in slow wave sleep. J Clin Sleep Med : 519–524, 2009. [PMC free article] [PubMed] [Google Scholar]
- 26.Saboisky JP, Butler JE, Fogel RB, Taylor JL, Trinder JA, White DP, Gandevia SC. Tonic and phasic respiratory drives to human genioglossus motoneurons during breathing. J Neurophysiol : 2213–2221, 2006. doi: 10.1152/jn.00940.2005. [DOI] [PubMed] [Google Scholar]
- 27.Sauerland EK, Mitchell SP. Electromyographic activity of the human Genioglossus muscle in response to respiration and to positional changes of the head. Bull Los Angeles Neurol Soc : 69–73, 1970. [PubMed] [Google Scholar]
- 28.Sériès F, Sériès I, Cormier Y. Effects of enhancing slow-wave sleep by gamma-hydroxybutyrate on obstructive sleep apnea. Am Rev Respir Dis : 1378–1383, 1992. doi: 10.1164/ajrccm/145.6.1378. [DOI] [PubMed] [Google Scholar]
- 29.Stanchina ML, Malhotra A, Fogel RB, Ayas N, Edwards JK, Schory K, White DP. Genioglossus muscle responsiveness to chemical and mechanical stimuli during non-rapid eye movement sleep. Am J Respir Crit Care Med : 945–949, 2002. doi: 10.1164/ajrccm.165.7.2108076. [DOI] [PubMed] [Google Scholar]
- 30.Stettner GM, Rukhadze I, Mann GL, Lei Y, Kubin L. Respiratory modulation of lingual muscle activity across sleep-wake states in rats. Respir Physiol Neurobiol : 308–317, 2013. doi: 10.1016/j.resp.2013.05.033. [DOI] [PMC free article] [PubMed] [Google Scholar]
- 31.Swanson LM, Arnedt JT, Rosekind MR, Belenky G, Balkin TJ, Drake C. Sleep disorders and work performance: findings from the 2008 National Sleep Foundation Sleep in America poll. J Sleep Res : 487–494, 2011. doi: 10.1111/j.1365-2869.2010.00890.x. [DOI] [PubMed] [Google Scholar]
- 32.Tangel DJ, Mezzanotte WS, Sandberg EJ, White DP. Influences of NREM sleep on the activity of tonic vs. inspiratory phasic muscles in normal men. J Appl Physiol (1985) : 1058–1066, 1992. [DOI] [PubMed] [Google Scholar]
- 33.Tangel DJ, Mezzanotte WS, White DP. Influence of sleep on tensor palatini EMG and upper airway resistance in normal men. J Appl Physiol (1985) : 2574–2581, 1991. [DOI] [PubMed] [Google Scholar]
- 34.Tantucci C, Mehiri S, Duguet A, Similowski T, Arnulf I, Zelter M, Derenne J-P, Milic-Emili J. Application of negative expiratory pressure during expiration and activity of genioglossus in humans. J Appl Physiol (1985) : 1076–1082, 1998. [DOI] [PubMed] [Google Scholar]
- 35.Trinder J, Kay A, Kleiman J, Dunai J. Gender differences in airway resistance during sleep. J Appl Physiol (1985) : 1986–1997, 1997. [DOI] [PubMed] [Google Scholar]
- 36.Trinder J, Woods M, Nicholas CL, Chan JK, Jordan AS, Semmler JG. Motor unit activity in upper airway muscles genioglossus and tensor palatini. Respir Physiol Neurobiol : 362–369, 2013. doi: 10.1016/j.resp.2013.06.011. [DOI] [PubMed] [Google Scholar]
- 37.Veasey SC, Fenik P, Panckeri K, Pack AI, Hendricks JC. The effects of trazodone with L-tryptophan on sleep-disordered breathing in the English bulldog. Am J Respir Crit Care Med : 1659–1667, 1999. doi: 10.1164/ajrccm.160.5.9812007. [DOI] [PubMed] [Google Scholar]
- 38.Wheatley JR, Mezzanotte WS, Tangel DJ, White DP. Influence of sleep on genioglossus muscle activation by negative pressure in normal men. Am Rev Respir Dis : 597–605, 1993. doi: 10.1164/ajrccm/148.3.597. [DOI] [PubMed] [Google Scholar]
- 39.Wheatley JR, Tangel DJ, Mezzanotte WS, White DP. Influence of sleep on response to negative airway pressure of tensor palatini muscle and retropalatal airway. J Appl Physiol (1985) : 2117–2124, 1993. [DOI] [PubMed] [Google Scholar]
- 40.Wilkinson V, Malhotra A, Nicholas CL, Worsnop C, Jordan AS, Butler JE, Saboisky JP, Gandevia SC, White DP, Trinder J. Discharge patterns of human genioglossus motor units during sleep onset. Sleep : 525–533, 2008. [DOI] [PMC free article] [PubMed] [Google Scholar]
- 41.Wilkinson V, Malhotra A, Nicholas CL, Worsnop C, Jordan AS, Butler JE, Saboisky JP, Gandevia SC, White DP, Trinder J. Discharge patterns of human genioglossus motor units during arousal from sleep. Sleep : 379–387, 2010. [DOI] [PMC free article] [PubMed] [Google Scholar]
- 42.Younes M, Loewen AHS, Ostrowski M, Laprairie J, Maturino F, Hanly PJ. Genioglossus activity available via non-arousal mechanisms vs. that required for opening the airway in obstructive apnea patients. J Appl Physiol (1985) : 249–258, 2012. doi: 10.1152/japplphysiol.00312.2011. [DOI] [PubMed] [Google Scholar]