Abstract
Cancer driver mutations are clinically significant biomarkers. In precision medicine, accurate detection of these oncogenic changes in patients would enable early diagnostics of cancer, individually tailored targeted therapy, and precise monitoring of treatment response. Here we investigated a novel nanolock−nanopore method for single-molecule detection of a serine/threonine protein kinase gene BRAF V600E mutation in tumor tissues of thyroid cancer patients. The method lies in a noncovalent, mutation sequence-specific nanolock. We found that the nanolock formed on the mutant allele/probe duplex can separate the duplex dehybridization procedure into two sequential steps in the nanopore. Remarkably, this stepwise unzipping kinetics can produce a unique nanopore electric marker, with which a single DNA molecule of the cancer mutant allele can be unmistakably identified in various backgrounds of the normal wild-type allele. The single-molecule sensitivity for mutant allele enables both binary diagnostics and quantitative analysis of mutation occurrence. In the current configuration, the method can detect the BRAF V600E mutant DNA lower than 1% in the tumor tissues. The nanolock−nanopore method can be adapted to detect a broad spectrum of both transversion and transition DNA mutations, with applications from diagnostics to targeted therapy.
Keywords: single nucleotide polymorphism (SNP), driver mutation, BRAF, nanolock, nanopore, single molecule detection, diagnostics, precision medicine
Graphical Abstract
Oncogenic gene alterations, or driver mutations, are hallmarks of genetic determinants in cancer initiation and progression.1 As such, these genetic changes, most of which are point mutations (single nucleotide substitutions), are cancer diagnostic biomarkers and therapy targets. Detection of driver mutation is critical to precision oncology, allowing cancer patients to receive individually tailored treatments.2 Although real-time PCR (RT-PCR) and sequencing remain the main methods for quantitative driver mutation detection,3,4 both diagnosis and prognosis still need accurate approaches to quantifiably determine these genetic alterations.5−7 Nanopores provide a sensitive single-molecule detection platform for genetic,8−12 epigenetic,13−16 and proteomic17−19 detection, and biomolecular mechanism exploration.20 In particular, the single-nucleotide sensitivity21−23 makes the nanopore suitable for driver mutation detection. However, in spite of these efforts, the nanopore has not shown feasibility for driver mutation detection in the clinical setting (e.g., liquid biopsy samples). The main roadblock is that the nanopore single-molecule signatures are not accurate enough for mutation identification in complex patient samples. Recently, the nanopore gene sequencing technology has been rapidly advanced24−28 toward clinical detection, but the current sequencing accuracy remains impractical for detecting driver mutation.29 which requires a sequencing accuracy of 99.99%.29
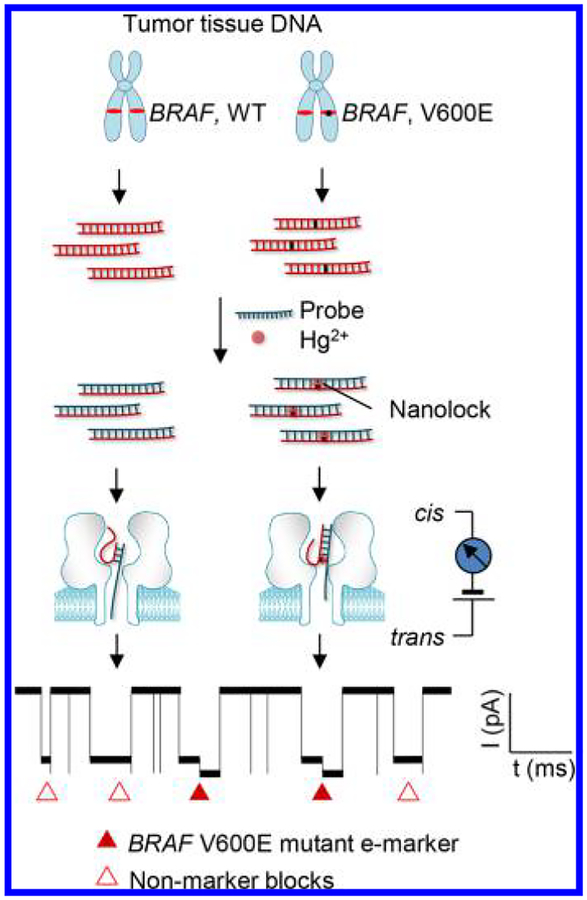
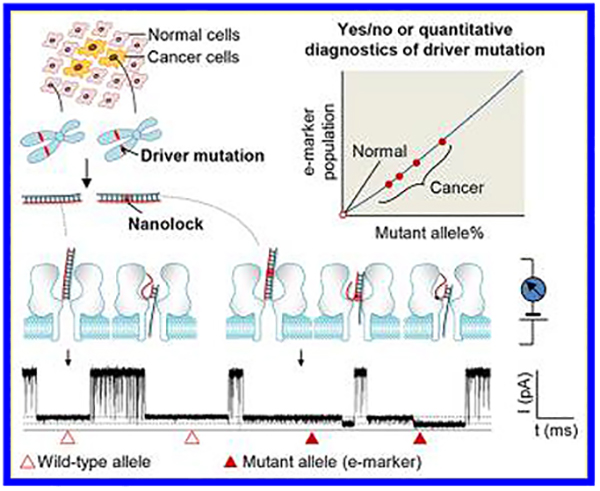
Here we developed a simple nanolock−nanopore approach capable of unmistakably discriminating single DNA molecules of mutant allele in the wild-type background, and for the first time utilized this approach for sensitive and quantitative drive mutation detection in cancer patient tumor tissues (Figure 1). Nanolock refers to a sort of nucleic acid motifs that can be formed by binding of ligands such as metal ions30−34 and designed compounds35−37 to specific base pairs for stabilization. The sequence specificity of these ligand-bound structures suggests their potential for site-specific detection of genetic alteration. Previous studies including our work have shown that a DNA duplex carrying a nanolock can be detected in the nanopore as it takes a prolonged time for dehybridization (unzipping) due to nanolock’s stabilization effect.32,33 However, the dehybridization time-based nanolock identification has a problem. If the unzipping time distributions for DNAs with and without nanolock are partially overlaid on each other, their DNA identities (whether carrying a nanolock or not) in the overlay region are indeterminable. The resulting false-positive and false-negative mutant allele identifications would cause inaccurate mutation diagnostics and quantification. To overcome this challenge, we explored a new molecular property of the nanolock in the nanopore. We found that the nanolock installed on the mutant allele/probe duplex can separate the duplex unzipping process into two sequential steps. Remarkably, such stepwise unzipping kinetics produces a unique “fingerprint” for unmistakable discrimination of the mutant allele (carrying a nanolock) from the wild-type allele, therefore enabling accurate, quantitative, and interference-free detection of drive mutations in patient samples.
Figure 1.
Nanolock-nanopore detection of the BRAF V600E mutation in tumor DNAs. The target fragments including the mutation site obtained from the patient tumor DNA are hybridized with the probe. The mutant allele/probe duplex can form a mutation sequence-specific nanolock with Hg2+. The stepwise unzipping of the duplex carrying a nanolock can produce a unique e-marker signal (solid triangles) that is distinguished from nonmarker blocks (empty triangles) produced by duplexes without nanolock formation. The e-marker can be used to identify the presence of the specific mutation at an extremely high sensitivity and accurately quantify the mutation percentage in a given sample.
We used the BRAF V600E mutation as the test-bed to investigate this approach. BRAF is a serine/threonine protein kinase. Its oncogenic variant V600E is a clinically significant driver mutation with high prevalence in several cancers38 (Supporting Information S1). Various BRAF kinase inhibitors, such as vemurafenib, dabrafenib, and trametinib, have been successfully used to target BRAF V600E positive cancers with remarkable efficacy.38 Overall, BRAF V600E is a biomarker with significant diagnostic and therapeutic implications.
MATERIALS AND METHODS
DNA Extraction from Tumor Tissues of Thyroid Cancer Patients.
Patient tumor tissue samples were collected according to the University of Texas Health Science Center at San Antonio institutional review board guidelines (No. 20150206N). Tumor percentage is determined based on morphological evaluation. For each case, the H&E (hematoxylin and eosin) stained slide was reviewed by the anatomical pathologist, and the percentage of tumor cells in the slide was evaluated and estimated microscopically. Genomic DNA was extracted by the EZ1 DNA Tissue Kit and BioRobot EZ1 workstation (Qiagen, Valencia, CA) according to the manufacturer’s instructions. Briefly, two to five 10-μm-thick formalin fixed paraffin embedded (FFPE) sections were collected, and the FFPE tissue was first deparaffinized in Citrisolv (Thermo Fisher Scientific, Waltham, MA) and washed in 70% ethanol. Obtained tissue was then processed using Qiagen “purification of DNA from paraffin-embedded tissue” protocol, and DNA was eluted in 50 μL of elution buffer. The concentration of extracted tumor DNA was determined with a NanoDrop ND-1000 spectrophotometer (Thermo Fisher Scientific, Waltham, MA).
Obtaining Target Fragments from Tumor Tissue DNAs and Probe−Target Hybridization.
A conventional PCR step was used to obtain a 224-bp amplicon of the BRAF gene in Chromosome 7, which includes the V600E mutation site in the middle of the sequence (Table S1 for the amplicon and primer sequences). All synthetic DNAs including primers were obtained from Integrated DNA Technologies Inc. Note that the two primers bind on both sides of but do not overlap the V600E mutation site. For tumor DNA detection, 100 ng of extracted tumor DNA (20−150 ng/μL) as template was mixed with GoTag Green Master Mix (Promega Inc.) to 40 μL. For the synthetic amplicon experiment, 2 μL of total amplicon DNAs (10 nM, the mixture of the wild-type and mutant amplicons) was used as the template. The PCR program setting was (1) 95 °C for initial 5 min; (2) 40 thermal cycles at 95 °C for 40 s, 58 °C for 40 s, and 72 °C for 40 s; (3) 72 °C for 5 min for fully extension. After purification using the QIAquick PCR purification column (Qiagen), the PCR amplicon (30−40 μL) was digested by BfaI and TaqI (10 ×, New England Biolabs) for 2 h to generate the target fragment (40−50 μL). The solution containing digestion products was distributed into 10 μL each. Each sample was mixed with 20 μL probe solution (100 μM), followed by a heating (95 °C)−slow cooling process, for the probe hybridization with the targets. 10−20 μL of the resulting solution was released to the cis solution (see below) in the presence of HgCl2 (100 μM) for nanolock formation and nanopore detection.
Nanopore Single-Molecule Detection.
As described previously,15 the lipid bilayer membrane (1,2-diphytanoyl-sn-glycero-3-phosphocholine, Avanti Polar Lipids) was formed on a ~150 μm orifice in a Teflon film partition sealed between two chambers, cis and trans. A Ag/AgCl electrode was put in each chamber to connect the chamber to a pico-Ampere current amplifier Axopatch 200B (Molecular Devices), which applies a transmembrane voltage and records the nanopore ion current. After obtaining a qualified membrane (capacitance: 100−200 pF, resistance: 100 GΩ), 1−2 μL stock solution of α-hemolysin (synthesized using the in vitro Transcription and Translation system, Promega) was released into the cis solution. Single protein pores can be spontaneously formed in the membrane when stirring.
The recording solution contained 1 M KCl and 10 mM Tris (pH 7.2). DNA samples were presented in the cis solution. The transmembrane voltage was applied from the trans solution (cis grounded) to drive DNA into the pore. The nanopore ion current was recorded and filtered by the amplifier with a built-in 4-pole low-pass Bessel Filter at 5 kHz before acquisition into the computer using a DigiData 1440A A/D converter (Molecular Devices) at a sampling rate of 20 kHz. The current data was recorded through a Clampex program and analyzed using a Clampfit software (Molecular Devices). Blocks shorter than 1 ms for ssDNA translocation were excluded from event counting. The block duration was obtained by exponential fitting of the duration distribution in the histogram. The residual current of each blocking level was obtained by Gaussian fitting of the current amplitude distribution in the histogram. The result was presented as mean ± standard deviation (n ≥ 3). Experiments were performed at 22 ± 1 °C.
RESULTS
Single-Step versus Multistep DNA Unzipping in the Nanopore.
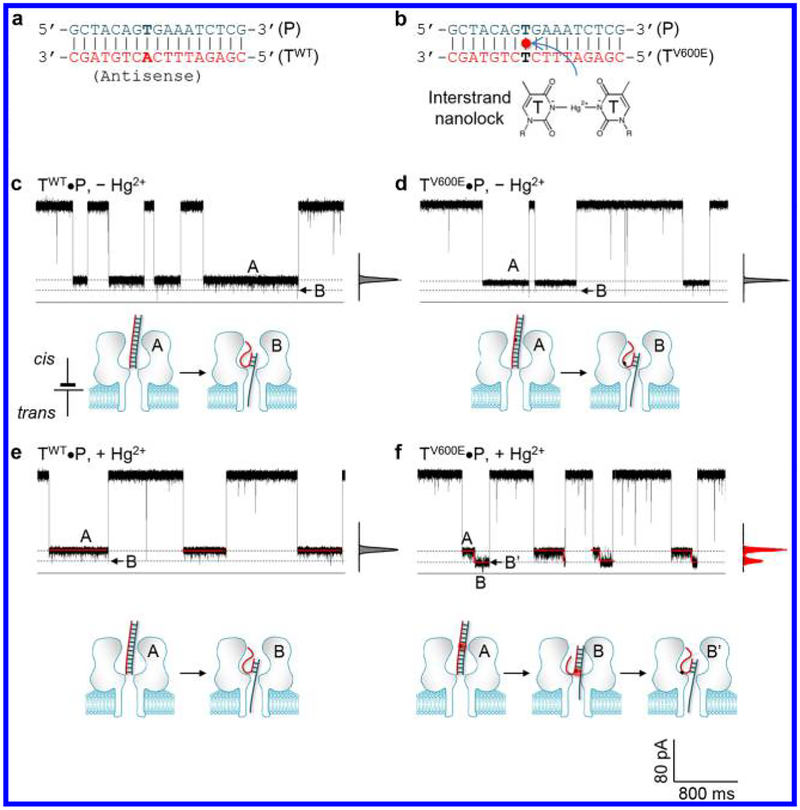
Our target is a 17-nt antisense fragment of the BRAF gene (Figure 2a,b, Table S1). The V600E mutation site is located in the middle of the sequence, which is adenine (A) in the wild-type target (TWT) and thymine (T) in the mutant target (TV600E). The target-specific probe (P) contains a thymine (T) at the mutation site. Upon hybridization of the probe with the target, the mutation site should form an A-T base pair in the TWT•P duplex (Figure 2a) and a T-T mismatched base pair in the TV600E•P duplex (Figure 2b). Based on previous studies,30−33 divalent mercuric ion (Hg2+) can bind to T-T in the TV600E•P duplex to form a T-Hg-T motif. We added the mixture of the probe (1 μM) and synthetic TWT or TV600E DNA (1 μM) in the cis solution of the α-hemolysin pore. A transmembrane voltage (+180 mV) was applied from the trans side, with the cis side grounded, to capture the TWT•P or TV600E•P duplexes from the cis entrance. Under this configuration, we investigated the nanopore block patterns for the TWT•P and TV600E•P duplexes without and with Hg2+ (Figure 2c−f). The blocks were characterized by duration (τ) and relative conductance (I/I0, where I and I0 are current amplitudes of the blocked and the empty pore).
Figure 2.
Nanopore single-molecule discrimination of the BRAF V600E mutant allele/probe duplex containing a nanolock. (a,b) Sequences of the wild-type target/probe (TWT•P, a) and the V600E mutant/probe (TV600E•P, b) duplexes. The TV600E•P duplex can form an interstrand nanolock on the T-T mismatch in the presence of Hg2+ (b); (c,d) Similar current block patterns and model cartoons for one-step unzipping of TWT•P (c) and TV600E•P (d) in the absence of Hg2+; (e,f) Distinct current block patterns and model cartoons for one-step unzipping of TWT•P (e) and stepwise unzipping of TV600E•P carrying a nanolock (f) in the presence of Hg2+.
In the absence of Hg2+, the TWT•P and TV600E•P duplexes produced similar block patterns (Figure 2c,d): a long Level A stage terminated with a downward Level B spike. For TWT•P, Level A’s relative conductance I/I0 was 23 ± 2% and the duration τ was 500 ± 60 ms. For TV600E•P, Level A’s I/I0 was 24 ± 2% and τ was 210 ± 50 ms (Figure S1 for duration histograms). The terminal spike in both blocks further reduced the conductance to 12 ± 2% with a short duration of 0.37 ± 0.08 ms. Figure 2e shows that the addition of Hg2+ did not change the TWT•P block pattern: long Level A (I/I0 = 24 ± 1%, τ = 320 ± 80 ms) with a terminal spike (I/I0 = 12 ± 1%, τ = 0.22 ± 0.05 ms). However, Figure 2f shows that the TV600E•P duplex in Hg2+ produced a distinct stepwise block pattern. The block (τ = 410 ± 50 ms) was split into two sequential long stages, with a transition from Level A (I/I0 = 24 ± 2%, τ = 380 ± 50 ms) to lower conductance Level B (I/I0 = 11 ± 1%, τ = 33 ± 4 ms) in the middle of the block. When using the probe P′ that is fully matched with TV600E, the TV600E•P′ duplex did not generate any stepwise block in the absence and in the presence of Hg2+ (Figure S2), supporting that the stepwise block by the TV600E•P duplex is due to the interaction of Hg2+ to the T-T base pair in the duplex.
The TWT•P and TV600E•P block patterns in the absence of Hg2+ (Figure 2c,d) can be explained as a one-step unzipping process.15,39 The duplex is captured and resides in the wide nanocavity of the pore throughout Level A. Because the narrow stem (β-barrel) of the pore in this configuration is unoccupied, the conductance of Level 1 (I/I0 ~ 20%) is higher compared to the DNA translocation blocks with the pore stem occupied (I/I ~ 10%).15,39 Driven by the voltage, the captured duplex is finally unzipped at the end of the block. As the unzipping occurs, the released ssDNA simultaneously enters and trans-locates through the pore stem, and the occupation of the pore stem results in the terminal spike with lower conductance (Level B). The extremely short duration of the terminal spike is consistent with that the unzipping of this duplex is a one-step cooperative process with all the base pairs dehybridized transiently.39 As Hg2+ does not form nanolock with TWT•P due to no T-T base-pair in the duplex, its unzipping procedure is not significantly affected by Hg2+ (Figure 2e). However, Hg2+ can bind to the TV600E•P duplex at the T-T base pair (mutation site). The formation of the T-Hg-T motif can modulate TV600E•P’s unzipping kinetics (model in Figure 2f). Specifically, driven by the voltage, the unzipping starts from the terminal of the duplex trapped in the nanopore nanocavity. Due to the stabilization effect, the unzipping is halted when reaching the THg-T motif to form a “partial unzipping” conformation. During partial unzipping, the released single strand is trapped into the narrow nanopore stem, leading to the long Level B segment in the block. At the end of the block, the T-Hg-T structure is forced to dissociate (marked by B′), triggering the unzipping of the remaining duplex domain. The unzipping during Level B stage was supported by the observation that the Level B duration was shortened as voltage increased (Figures S3−S4). Overall, specific binding of Hg2+ to the TV600E•P duplex can produce a stepwise unzipping kinetics, whereas the TWT•P duplex without Hg2+ binding remains a one-step unzipping kinetics.
Identifying BRAF V600E Mutation in Wild-Type Background.
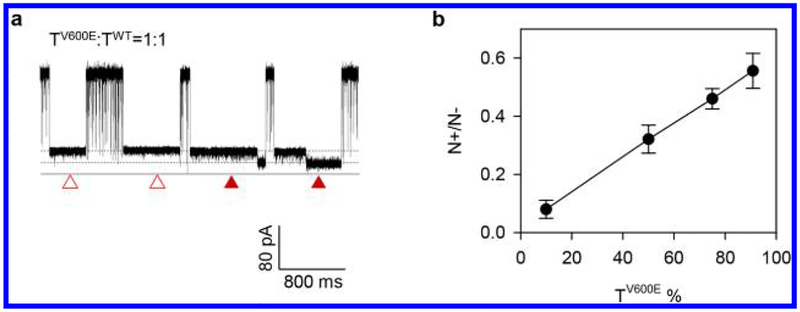
The TV600E•P stepwise unzipping kinetics produces the unique block pattern (Figure 2f), which can be used as an electric marker (e-marker) to visually distinguish the TV600E•P duplex from the TWT•P duplex. To explore whether the TV600E•P e-marker can be used to detect TV600E in the presence of TWT, we mixed the TV600E and TWT DNAs (1 μM in total), and varied the TV600E percentage (in molar concentration) from 10% to 90%. The target mixture was further hybridized with the probe (1 μM) in the presence of Hg2+ (10 μM). Indeed, we identified both the e-marker blocks and nonmarker blocks for each TV600E percentage (Figure 3a). Each e-marker observed was generated by a TV600E•P duplex carrying a nanolock, representing the identity of a TV600E molecule. The nonmarker blocks were similar to that observed in Figure 2e, should be generated by the TWT•P duplex, which cannot form the nanolock, and free TV600E•P duplex without nanolock formation. In addition, we also observed short spikes in the 100 μs time scale for translocation of unhybridized ssDNA. To quantify TV600E, for each TV600E percentage, we counted both the e-marker (N+) and nonmarker blocks (N−) and calculated their ratio (N+/N−). Blocks shorter than 1 ms, which were mainly caused by ssDNA translocation, were excluded from the event counting. We found that N+/N− demonstrates a monotonic increase with the TV600E percentage (Figure 3b), suggesting that the TV600E•P e-marker can be used to both identify and quantify TV600E in the mixture with TWT.
Figure 3.
Detection of the BRAF V600E mutant target TV600E in the mixture with the TWT•P duplex. (a) Current traces showing the e-marker signals for the TV600E•P with a nanolock (solid triangles) and nonmarker blocks for the TWT•P duplex and free TV600E•P duplex without nanolock (empty triangles); (b) Increase of the frequency ratio of e-marker versus nonmarker blocks (N+/N−) as a function of the TV600E percentage in the mixture.
The above result for the mutant/wild-type target mixture suggests that it is possible to detect the mutant allele in a given clinical samples through e-marker analysis, provided that the target (TV600E and TWT) can be obtained from patient tumor DNAs. To investigate this possibility, we designed a long dsDNA to simulate tumor DNA to obtain the target fragments. This DNA is a 224-bp amplicon of the BRAF gene. The V600E mutation site is located in the middle of the sequence (Table S1). We mixed the wild-type and mutant amplicon DNAs, and the mutant percentage (MT%) in the mixture varied from 0% to 100%. Both amplicons include the TaqI and BfaI cleaving sites on both sides of the mutation site. By digestion with both endonucleases (Table S1), we obtained the target fragments TWT and TV600E. The solution containing the target fragments were hybridized with excessive amount of the probe to form the TV600E•P and TWT•P duplexes. Subsequent addition of Hg2+ allowed formation of nanolock on the TV600E•P duplex.
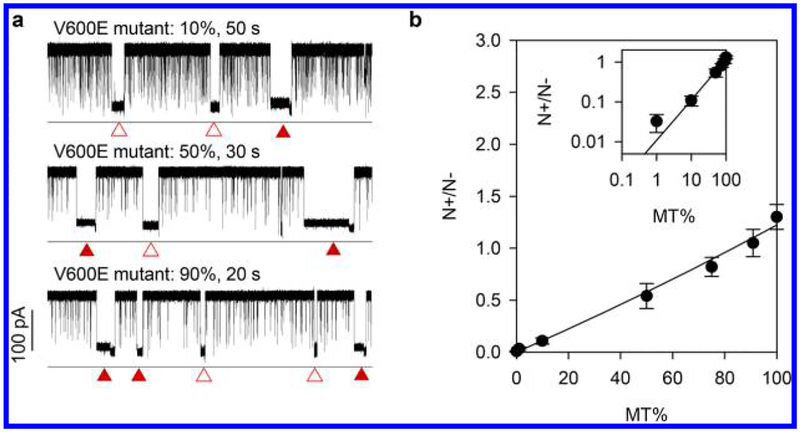
Figure 4a illustrates the current traces for mutant percentages of 10%, 50%, and 90%, showing both the e-marker blocks for the TV600E•P duplex carrying a nanolock and nonmarker blocks for duplexes without nanolock formation. The e-marker was not observed in the absence of Hg2+. Figure 4b shows that the frequency ratio of the e-marker versus nonmarker blocks (N +/N−) was consistently increased as MT% increased. The relation of MT% versus N+/N− can be expressed as N+/N− = A·MT%/(1 − A · MT%), where A is the fraction of the TV600E•P duplex that forms a nanolock (Supporting Information S2). This result suggests that (1) the BRAF V600E mutation in the sample can be determined by identifying the e-marker in the nanopore current trace; (2) mutation at 1% can be detected (the limit of detection is much lower than 1%, see Discussion); (3) the MT% − N+/N− correlation (Figure 4b) can be used to calibrate the sensor for quantifying mutant allele frequency in a given sample; and (4) N+/N− is a qualified parameter for mutation percentage evaluation, because this parameter is only sensitive to the mutation percentage, and is independent to the absolute the DNA concentration.
Figure 4.
Detection of the BRAF V600E mutation using the synthetic amplicon as the template. Synthetic wild-type and mutant amplicons (224-bp) were mixed at various mutant percentages (MT%). (a) Current races showing the TV600E•P nanolock e-markers (solid triangles) and nonmarker blocks (empty triangles) for the BRAF V600E mutant 224-amplicon at percentages (MT%) of 10%, 50%, and 90%; (b) Variation of the frequency ratio of e-marker/nonmarker block (N+/N−) as the function of MT%. The data was fitted using eq S1 (Supporting Information S2).
Detection of BRAF V600E Mutation in Tumor Tissue DNAs.
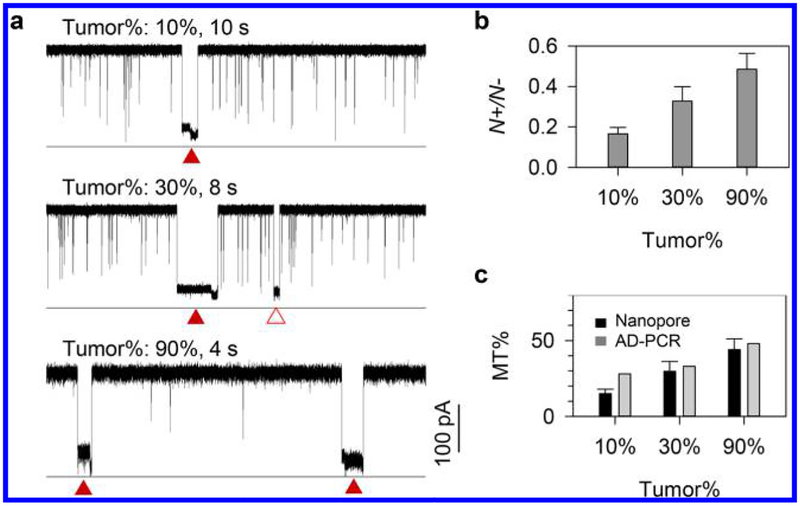
To prove the concept, we investigated the use of the nanolock−nanopore sensor for BRAF V600E mutation detection in patient tumor tissue DNAs. The tumor tissue samples of papillary thyroid carcinomas patients were collected according to the University of Texas Health Science Center at San Antonio Institutional Review Board guidelines (No. 20150206N). The tumor percentage (Tumor%) in each tissue sample has been evaluated microscopically (Table S2 for sample information). For each FFPE sample, DNA was extracted and the concentration was determined with the range of 20−150 ng/μL. The presence of the BRAF V600E mutation in tumor samples has been verified by Sanger sequencing (data not shown). To promote the DNA capture efficiency and enhance the sensitivity of the current nanopore system, we added a PCR step prior to nanopore detection to obtain the 224-bp amplicon from the extracted tumor DNA. In this PCR, two primers were designed to bind on both sides of, but not overlap, the mutation site. This design allows both mutant and wild-type amplicons to be amplified with the same efficiency, therefore enabling accurate evaluation of the mutation percentage. After digestion of the amplicons with TaqI and BfaI, a 17-nt target fragment (TWT and TV600E) was generated. By hybridization of the target with excessive amount of the probe, both TV600E•P and TWT•P duplexes were formed in the solution. As only the TV600E•P duplex can form the nanolock in the presence of Hg2+ and produce an e-marker in the nanopore, the observation of an e-marker should suggest the presence of mutation in the sample, while the ratio of the e-marker versus nonmarker blocks would be equivalent to the mutant percentage.
In the current traces for all tumor DNA samples, we identified both the characteristic e-marker blocks (N+) for the TV600E•P duplex carrying a nanolock and nonmarker blocks (N−) for DNAs including the TWT•P and TV600E•P duplexes without nanolock formation (Figure 5a). The ratio N+/N− for each sample of different tumor cell percentage was determined (Figure 5b), and the BRAF V600E mutation percentage (MT %) was evaluated (Figure 5c) based on the MT% − N+/N− correlation curve (Figure 4b). The tumor cell percentages in three tissue samples have been microscopically evaluated to be 10%, 30%, and 90%. Their BRAF V600E MT% evaluated by the nanopore sensor was 15%, 29%, and 44% (Figure 5c), respectively. The mutation percentages of three samples were further measured by the allele-discrimination PCR (AD-PCR) (Supporting Information S3). The AD-PCR-measured mutation percentages for the three samples were 28%, 33%, and 48%, respectively (Figure 5c), consistent with the nanopore result.27
Figure 5.
Detection of the BRAF V600E mutant allele in tumor DNAs from thyroid cancer patients. Information of papillary thyroid carcinomas patient tumor tissues was given in Table S2. The tumor percentage (Tumor %) of the three samples were 10%, 30%, and 90%. (a) Current traces for three tumor DNAs, showing the e-markers generated by the TV600E•P duplex containing a nanolock (solid triangles) and nonmarker blocks (empty triangles) produced by the TV600E•P and TWT•P duplexes without nanolock formation. (b) The ratio of e-marker versus nonmarker block frequency (N+/N−) for three tumor DNAs. (c) The mutant percentage (MT%) for three tumor DNAs evaluated by the nanolock nanopore method based on MT% − N+/N− relation in Figure 4b and allele-specific PCR.
DISCUSSION
To the best of our knowledge, this is the first nanopore method capable of detecting point mutation in tumor DNAs from cancer patients. The work owes a great deal to the finding of a mutation sequence-specific, nanolock-generated nanopore e-marker. The e-marker-based nanopore sensing mechanism is superior to the traditional unzipping time-based methods for single-nucleotide discrimination. As the unzipping time of individual DNA duplexes is randomly distributed, it cannot report the identity of a mutant DNA molecule. In contrast, with the mutation site-specific nanolock and its e-marker in the nanopore, single mutant DNA molecules can be accurately recognized. As both mutant and wild-type allele DNAs are detected simultaneously in the nanopore, the false-positive result can be minimized and the frequency of cancer mutations can be quantitatively analyzed. Ideally, observation of just one mutant DNA e-marker in a given time would immediately suggest the presence of that specific mutation in the sample. Therefore, the method can be sensitive enough to perform binary (Y/N) diagnostics of cancer mutation in the given sample. For detection of 1% mutation (Figure 4b), we have totally recorded 39 e-marker blocks (N+) in 2 h. Under this condition, we expect to be able to capture one mutant DNA molecule within an hour for a 0.05% mutation sample, greatly lowering the limit of detection (LOD). This LOD is superior to the 1−5% for commercial BRAF V600E mutation detection methods, and the 10−20% for Sanger and the pyrosequencing approaches (Supporting Information S4). With the extreme sensitivity, this method may be used to detect circulating cell-free tumor DNA in liquid biopsy specimens.40
The nanolock−nanopore approach can be adapted to detect various driver mutations. The current T-Hg-T motif is suitable to the detection of nucleotide substitutions to T or A (complementary base is T), for example, the epidermal growth factor receptor (EGFR) variant T790 M (2369C > T) for lung cancer with acquired resistance to erlotinib/gefitinib therapy. For detection of nucleotide substitutions to C or G, such as the EGFR lung cancer-derived mutation L858R (2573T > G), it is possible to choose the C- or G-involved nanolocks such as the C−Ag−C motif.34 Recently we have studied C−Ag−C and its application in epigenetic detection in the nanopore.16 Furthermore, a variety of compounds have been constructed to bind a specific base pair or a group of base pairs.35 For example, naphthyridine derivatives 2-animo-5,6,7-trimethyl-1,8-naphthyridine (ATMND) can bind to the C−C mismatch,36 and special metallointercalators can target single-base mismatches with 1000-fold selectivity over the Watson−Crick base pairs.37 Overall, these sequence-specific small molecule−nucleic acid interactions can build a nanolock toolbox, which ultimately enables the nanopore to detect a broad spectrum of both transversion and transition mutations, with applications from diagnostics to targeted therapy.
Supplementary Material
ACKNOWLEDGMENTS
We are grateful to the Coulter Translation Program at University of Missouri and National Institutes of Health for support of this work through initial R01-GM079613 (L.Q.G.) and current R01-GM114204 (L.Q.G.),
ASSOCIATED CONTENT
Supporting Information
The Supporting Information is available free of charge on the ACS Publications website at DOI: 10.1021/acssensors.7b00235.
All DNA sequences. Case information on thyroid cancer patients. Histograms of block duration for various DNA duplexes. Voltage dependence of block duration. Electro-phoretic illustration of PCR/digestion products of tumor DNAs. Oncogenic driver mutation, BRAF V600E mutation, and current detection methods. Quantification of the BRAF V600E mutation percentage in tumor DNAs. BRAF V600E mutation detection by allele-discrimination PCR (AD-PCR). Low detection limit (LDL) of commonly used methods for detection of the BRAF V600E mutation. (PDF)
The authors declare no competing financial interest.
REFERENCES
- (1).Vogelstein B; Papadopoulos N; Velculescu VE; Zhou S; Diaz LA Jr.; Kinzler KW Cancer genome landscapes. Science 2013, 339, 1546–1558. [DOI] [PMC free article] [PubMed] [Google Scholar]
- (2).Bollag G; Tsai J; Zhang J; Zhang C; Ibrahim P; Nolop K; Hirth P Vemurafenib: the first drug approved for BRAF-mutant cancer. Nat. Rev. Drug Discovery 2012, 11, 873–886. [DOI] [PubMed] [Google Scholar]
- (3).Halait H; DeMartin K; Shah S; Soviero S; Langland R; Cheng S; Hillman G; Wu L; Lawrence HJ Analytical Performance of a Real-time PCR-based Assay for V600 Mutations in the BRAF Gene, Used as the Companion Diagnostic Test for the Novel BRAF Inhibitor Vemurafenib in Metastatic Melanoma. Diagn. Mol. Pathol 2012, 21, 1–8. [DOI] [PubMed] [Google Scholar]
- (4).Sapio MR; Posca D; Troncone G; Pettinato G; Palombini L; Rossi G; Fenzi G; Vitale M Detection of BRAF mutation in thyroid papillary carcinomas by mutant allele-specific PCR amplification (MASA). Eur. J. Endocrinol 2006, 154, 341–348. [DOI] [PubMed] [Google Scholar]
- (5).Wu CC; Ko FH; Yang YS; Hsia DL; Lee BS; Su TS Label-free biosensing of a gene mutation using a silicon nanowire field-effect transistor. Biosens. Bioelectron 2009, 25, 820–825. [DOI] [PubMed] [Google Scholar]
- (6).Fang Z; Kelley SO Direct electrocatalytic mRNA detection using PNA-nanowire sensors. Anal. Chem 2009, 81, 612–617. [DOI] [PubMed] [Google Scholar]
- (7).Huber F; Lang HP; Backmann N; Rimoldi D; Gerber C Direct detection of a BRAF mutation in total RNA from melanoma cells using cantilever arrays. Nat. Nanotechnol 2013, 8, 125–129. [DOI] [PubMed] [Google Scholar]
- (8).Cherf GM; Lieberman KR; Rashid H; Lam CE; Karplus K; Akeson M Automated forward and reverse ratcheting of DNA in a nanopore at 5-A precision. Nat. Biotechnol 2012, 30, 344–348. [DOI] [PMC free article] [PubMed] [Google Scholar]
- (9).Kasianowicz JJ; Brandin E; Branton D; Deamer DW Characterization of individual polynucleotide molecules using a membrane channel. Proc. Natl. Acad. Sci. U. S. A 1996, 93, 13770–13773. [DOI] [PMC free article] [PubMed] [Google Scholar]
- (10).Manrao EA; Derrington IM; Laszlo AH; Langford KW; Hopper MK; Gillgren N; Pavlenok M; Niederweis M; Gundlach JH Reading DNA at single-nucleotide resolution with a mutant MspA nanopore and phi29 DNA polymerase. Nat. Biotechnol 2012, 30, 349–U174. [DOI] [PMC free article] [PubMed] [Google Scholar]
- (11).An N; Fleming AM; Middleton EG; Burrows CJ Single-molecule investigation of G-quadruplex folds of the human telomere sequence in a protein nanocavity. Proc. Natl. Acad. Sci. U. S. A 2014, 111, 14325–14331. [DOI] [PMC free article] [PubMed] [Google Scholar]
- (12).Cao C; Ying YL; Hu ZL; Liao DF; Tian H; Long YT Discrimination of oligonucleotides of different lengths with a wild-type aerolysin nanopore. Nat. Nanotechnol 2016, 11, 713–718. [DOI] [PubMed] [Google Scholar]
- (13).An N; Fleming AM; White HS; Burrows CJ Crown ether-electrolyte interactions permit nanopore detection of individual DNA abasic sites in single molecules. Proc. Natl. Acad. Sci. U. S. A 2012, 109, 11504–11509. [DOI] [PMC free article] [PubMed] [Google Scholar]
- (14).Wallace EV; Stoddart D; Heron AJ; Mikhailova E; Maglia G; Donohoe TJ; Bayley H Identification of epigenetic DNA modifications with a protein nanopore. Chem. Commun. (Cambridge, U. K.) 2009, 46, 8195–8197. [DOI] [PMC free article] [PubMed] [Google Scholar]
- (15).Wang Y; Zheng D; Tan Q; Wang MX; Gu LQ Nanopore-based detection of circulating microRNAs in lung cancer patients. Nat. Nanotechnol 2011, 6, 668–674. [DOI] [PMC free article] [PubMed] [Google Scholar]
- (16).Wang Y; Luan BQ; Yang Z; Zhang X; Ritzo B; Gates K; Gu LQ Single molecule investigation of Ag+ interactions with single cytosine-, methylcytosine- and hydroxymethylcytosine-cytosine mismatches in a nanopore. Sci. Rep 2015, 4, 5883. [DOI] [PMC free article] [PubMed] [Google Scholar]
- (17).Rosen CB; Rodriguez-Larrea D; Bayley H Single-molecule site-specific detection of protein phosphorylation with a nanopore. Nat. Biotechnol 2014, 32, 179–181. [DOI] [PMC free article] [PubMed] [Google Scholar]
- (18).Wolfe AJ; Mohammad MM; Cheley S; Bayley H; Movileanu L Catalyzing the translocation of polypeptides through attractive interactions. J. Am. Chem. Soc 2007, 129, 14034–14041. [DOI] [PubMed] [Google Scholar]
- (19).Wang S; Haque F; Rychahou PG; Evers BM; Guo P Engineered nanopore of Phi29 DNA-packaging motor for real-time detection of single colon cancer specific antibody in serum. ACS Nano 2013, 7, 9814–9822. [DOI] [PMC free article] [PubMed] [Google Scholar]
- (20).Hornblower B; Coombs A; Whitaker RD; Kolomeisky A; Picone SJ; Meller A; Akeson M Single-molecule analysis of DNA-protein complexes using nanopores. Nat. Methods 2007, 4, 315–317. [DOI] [PubMed] [Google Scholar]
- (21).Purnell RF; Schmidt JJ Discrimination of single base substitutions in a DNA strand immobilized in a biological nanopore. ACS Nano 2009, 3, 2533–2538. [DOI] [PubMed] [Google Scholar]
- (22).Kong J; Zhu J; Keyser UF Single molecule based SNP detection using designed DNA carriers and solid-state nanopores. Chem. Commun. (Cambridge, U. K.) 2017, 53, 436–439. [DOI] [PubMed] [Google Scholar]
- (23).Vercoutere W; Winters-Hilt S; Olsen H; Deamer D; Haussler D; Akeson M Rapid discrimination among individual DNA hairpin molecules at single-nucleotide resolution using an ion channel. Nat. Biotechnol 2001, 19, 248–252. [DOI] [PubMed] [Google Scholar]
- (24).Ashton PM; Nair S; Dallman T; Rubino S; Rabsch W; Mwaigwisya S; Wain J; O’Grady J MinION nanopore sequencing identifies the position and structure of a bacterial antibiotic resistance island. Nat. Biotechnol 2014, 33, 296–300. [DOI] [PubMed] [Google Scholar]
- (25).Laszlo AH; Derrington IM; Ross BC; Brinkerhoff H; Adey A; Nova IC; Craig JM; Langford KW; Samson JM; Daza R; Doering K; Shendure J; Gundlach JH Decoding long nanopore sequencing reads of natural DNA. Nat. Biotechnol 2014, 32, 829–833. [DOI] [PMC free article] [PubMed] [Google Scholar]
- (26).Schmidt K; Mwaigwisya S; Crossman LC; Doumith M; Munroe D; Pires C; Khan AM; Woodford N; Saunders NJ; Wain J; O’Grady J; Livermore DM Identification of bacterial pathogens and antimicrobial resistance directly from clinical urines by nanopore-based metagenomic sequencing. J. Antimicrob. Chemother 2017, 72, 104–114. [DOI] [PubMed] [Google Scholar]
- (27).Greninger AL; Naccache SN; Federman S; Yu G; Mbala P; Bres V; Stryke D; Bouquet J; Somasekar S; Linnen JM; Dodd R; Mulembakani P; Schneider BS; Muyembe-Tamfum JJ; Stramer SL; Chiu CY Rapid metagenomic identification of viral pathogens in clinical samples by real-time nanopore sequencing analysis. Genome Med. 2015, 7, 99. [DOI] [PMC free article] [PubMed] [Google Scholar]
- (28).Cornelis S; Gansemans Y; Deleye L; Deforce D; Van Nieuwerburgh F Forensic SNP Genotyping using Nanopore MinION Sequencing. Sci. Rep 2017, 7, 41759. [DOI] [PMC free article] [PubMed] [Google Scholar]
- (29).Jain M; Olsen HE; Paten B; Akeson M The Oxford Nanopore MinION: delivery of nanopore sequencing to the genomics community. Genome Biol. 2016, 17, 239. [DOI] [PMC free article] [PubMed] [Google Scholar]
- (30).Miyake Y; Togashi H; Tashiro M; Yamaguchi H; Oda S; Kudo M; Tanaka Y; Kondo Y; Sawa R; Fujimoto T; Machinami T; Ono A MercuryII-mediated formation of thymine-HgII-thymine base pairs in DNA duplexes. J. Am. Chem. Soc 2006, 128, 2172–2173. [DOI] [PubMed] [Google Scholar]
- (31).Ono A; Torigoe H; Tanaka Y; Okamoto I Binding of metal ions by pyrimidine base pairs in DNA duplexes. Chem. Soc. Rev 2011, 40, 5855–5866. [DOI] [PubMed] [Google Scholar]
- (32).Wen S; Zeng T; Liu L; Zhao K; Zhao Y; Liu X; Wu HC Highly sensitive and selective DNA-based detection of mercury(II) with alpha-hemolysin nanopore. J. Am. Chem. Soc 2011, 133, 18312–18317. [DOI] [PubMed] [Google Scholar]
- (33).Wang G; Zhao Q; Kang X; Guan X Probing mercury(II)-DNA interactions by nanopore stochastic sensing. J. Phys. Chem. B 2013, 117, 4763–4769. [DOI] [PMC free article] [PubMed] [Google Scholar]
- (34).Torigoe H; Miyakawa Y; Ono A; Kozasa T Thermodynamic properties of the specific binding between Ag+ ions and C:C mismatched base pairs in duplex DNA. Nucleosides, Nucleotides Nucleic Acids 2011, 30, 149–167. [DOI] [PubMed] [Google Scholar]
- (35).Granzhan A; Kotera N; Teulade-Fichou MP Finding needles in a basestack: recognition of mismatched base pairs in DNA by small molecules. Chem. Soc. Rev 2014, 43, 3630–3665. [DOI] [PubMed] [Google Scholar]
- (36).Sato Y; Honjo A; Ishikawa D; Nishizawa S; Teramae N Fluorescent trimethyl-substituted naphthyridine as a ligand for C-C mismatch detection in CCG trinucleotide repeats. Chem. Commun. (Cambridge, U. K.) 2011, 47, 5885–5887. [DOI] [PubMed] [Google Scholar]
- (37).Zeglis BM; Barton JK DNA base mismatch detection with bulky rhodium intercalators: synthesis and applications. Nat. Protoc 2007, 2, 357–371. [DOI] [PMC free article] [PubMed] [Google Scholar]
- (38).Villanueva MT Melanoma: blocking BRAF to the BRIM. Nat. Rev. Clin. Oncol 2014, 11, 179. [DOI] [PubMed] [Google Scholar]
- (39).Wang Y; Tian K; Hunter LL; Ritzo B; Gu LQ Probing molecular pathways for DNA orientational trapping, unzipping and translocation in nanopores by using a tunable overhang sensor. Nanoscale 2014, 6, 11372–11379. [DOI] [PMC free article] [PubMed] [Google Scholar]
- (40).Speicher MR; Pantel K Tumor signatures in the blood. Nat. Biotechnol 2014, 32, 441–443. [DOI] [PubMed] [Google Scholar]
Associated Data
This section collects any data citations, data availability statements, or supplementary materials included in this article.


