Abstract
Genipin is a naturally derived small molecule that crosslinks compounds containing primary amines including many natural biopolymers. A diffusion-reaction model to predict the rates of delivery and incorporation of genipin into fibrin networks is presented. Genipin crosslink formation within fibrin hydrogels is a multi-step process that requires genipin diffusion and reaction with primary amines in hydrated networks. The reaction rate of genipin into fibrin gels was measured via spectroscopy while the rate of marginal crosslink formation was measured by rheology. Covalent coupling between genipin and primary amines in fibrin gels obeys second-order kinetics in genipin concentration with an effective activation energy of −71.9 ± 3.2 kJ-mol−1. Genipin diffusion-reaction within fibrin gels exhibits Thiele moduli between 0.02–0.28, which suggests that the systems studied herein are reaction-limited. Genipin-crosslinked fibrin clots are resistant to fibrinolytic degradation as measured by rheology. Finally, active genipin can be delivered from poly(D,L-lactide-co-glycolide) matrices to gels at rates that are comparable to the characteristic rate of incorporation in fibrin networks. Taken together, this work establishes a quantitative framework to engineer controlled release systems for genipin delivery into protein-based hydrogel networks.
1. INTRODUCTION
Fibrin gels form through a cascade of enzymatic reactions between fibrinogen and thrombin1, 2. Fibrin gel formation concludes the blood-clotting cascade and is an integral aspect of wound healing1–4. Fibrin is a natural biopolymer featured in many biomedical applications such as haemostatic glues5, matrices for controlled release of bioactive molecules and cells6–10, and scaffold materials for both acellular and cell-based strategies in regenerative medicine1, 7, 11, 12. Fibrin gels undergo enzymatic degradation through fibrinolysis3, 4, 13. The transient nature of fibrin gel is advantageous for natural wound healing, but presents a challenge in some biomedical applications that require stable clots such as embolization treatments. Fibrin clots with enhanced chemical and mechanical stability could improve the performance of haemostatic materials for minimally invasive occlusion of brain aneurysms or embolization of solid tumors14, 15. Protein-based gels can be chemically stabilized by adding secondary covalent networks. Fibrin clots can benefit by engineering application-specific stabilization time scales. For embolization treatments, the time frame of stabilization is desired to be comparable to the fibrinolysis rate. The kinetics of enzymatically catalyzed fibrinolysis has been modeled by previous researchers16, 17 to reveal an apparent rate constant of 0.5 s−1 and a diffusion coefficient of 2×10⁻⁷ cm2-s−1 for highly compacted clots16. Difunctional small molecules such as glutaraldehyde, diisocyanates, or carbodiimides can form amide bonds with amine-bearing amino acids to form crosslinks18–20. Small molecule crosslinking agents include glutaraldehyde, polyepoxides, and isocyanates. Many of these compounds are potentially cytotoxic21, 22 and therefore face hurdles to clinical translation23.
Genipin is a non-toxic naturally occurring small molecule crosslinking agent22, 24–27 that is extracted from the Gardenia jasminoides28, 29. Genipin is 10,000 times less cytotoxic than glutaraldehyde when used in applications such as tissue fixation, controlled release systems, and peripheral nerve regeneration24, 25, 27, 30. Two genipin molecules react with free primary amines through a series of reactions to form covalent crosslinks25–28, 31–33. Genipin-based covalent crosslinks are resistant to enzymatic degradation and reduce the effective molecular weight between crosslinks thereby increasing the mechanical modulus of protein gels such as fibrin clots22, 27, 34, 35. Fibrin gels stabilized with genipin crosslinks are used as materials to repair intervertebral disc annulus36. Despite the numerous potential applications, the reaction mechanism and genipin crosslinking kinetics with free primary amines are not well-characterized29, 37–39. The precise reaction mechanism of genipin with primary amines is not fully elucidated at present and remains an active area of research29, 40. A quantitative understanding of genipin incorporation into protein networks could accelerate the design of interventional therapies that use genipin for applications in clot stabilization. This work describes a diffusion-reaction model to identify the rate-limiting step of genipin incorporation into fibrin gels.
2. EXPERIMENTAL
2. 1. Reaction kinetics of genipin with free primary amines
All materials were acquired from Sigma-Aldrich (Milwaukee, WI) and used as received unless otherwise stated. Genipin (Enzo Life Sciences, Farmingdale, NY) and ethylenediamine were dissolved in 0.01 M phosphate buffer solution (PBS) at the appropriate concentrations. Reaction mixtures were prepared with the following molar ratios of genipin:ethylenediamine on a 0.22 mM genipin basis: 1:10, 1:20, 1:40, and 1:80. Reactions were conducted at temperatures ranging from 27—67 °C. The reactants and produces were sampled and analyzed with UV-vis spectroscopy between λAbs = 200 and λAbs = 800 nm (UV-2600, Shimadzhu, Kyoto, Japan). Genipin conversion was calculated by measuring the peak absorbance at λAbs = 240 nm relative to the maximum absorbance at this wavelength at t = ∞ for reactions using excess free primary amines.
The instantaneous rate of genipin consumption is given by Eqn. 1
| (Eqn. 1) |
where [G] and [A] are the concentration of genipin and free primary amine in mol-L−1, k is the reaction rate constant, n and m are the reaction orders. In the case of excess primary amine, the effective reaction depends only on [G] via the following relationship
| (Eqn. 2) |
where the effective rate constant keff is given by
| (Eqn. 3) |
Experimental data were fit to the reaction model (FindFit function, Mathematica, Champaign, IL). The effective rate constant (keff) was determined by linear fit using integrated version of Eqn. 2 as a function of free primary amine concentrations with 95% confidence interval. The relationship in Eqn. 3 was then used to determine m and thus the reaction rate constant k. The activation energy of genipin reactions with ethylenediamine was measured using the following Arrhenius relationship
| (Eqn. 4) |
where the reaction rate constant and temperature are given by k and T, respectively.
The activation energy (Ea) for reactions between genipin and ethylenediamine is estimated as the slope of ln(k) versus T−1. All values are reported as mean ± s.d. unless otherwise noted.
2. 2. Fibrin gel preparation
Fibrinogen and thrombin extracted from bovine plasma were dissolved in PBS buffer at concentrations of 20 mg-mL−1 and 10 U-mL−1 respectively. Fibrin gel arrays were prepared in 24-well plates, each with a nominal diameter of 15.9 mm and a thickness of 9.4 mm. Wells were pre-coated with polydimethylsiloxane (PDMS) substrates approximately 1 mm in thickness to facilitate sample handling. Briefly, Sylgard 184 Silicone Elastomer (Dow Corning, Midland, MI) was mixed in a 10:1 ratio and cured at 60 °C for 24 hr. Crosslinked fibrin gels were prepared by combining 0.4 mL of fibrinogen solution with 0.1 mL of thrombin solution. Solutions were incubated at 37 °C on a rotary shaker for 30 min until fibrin crosslinking was completed.
2.3. Measuring free primary amine concentrations in fibrin gel networks
The concentration of free primary amines within fibrin gels was determined using a ninhydrin assay41. Briefly, ninhydrin reagent was dissolved in ethanol (2 w%) and fibrin gels (n = 3) were dehydrated at 60 °C in vacuum for 24 hr. Fibrin gels were incubated in 2 mL of ninhydrin solution at 80 °C for 20 min and then cooled down to 22 °C over 30 min. Transparent free primary amine-containing solutions turn purple (λAbs = 570 nm) upon reaction with the ninhydrin reagent. The absorption was measured using UV-vis spectroscopy and calibrated to tyramine standards.
2. 4. Rheological characterization of cross-linked fibrin gel networks
Aqueous solutions of genipin (0.4 mL) in PBS were added drop wise to swollen hydrated fibrin gel networks. Fibrin gels were incubated in genipin solutions for 24 hr at 37 °C with the following molar ratios of genipin:free primary amine in the reaction system: 1:10, 1:20, 1:40, and 1:80. Fibrin gels incubated with genipin were characterized by rheology at prescribed time points. Briefly, samples were transferred to a Peltier plate of a rheometer operating in parallel plate configuration (TA Instruments DHR-3, New Castle, DE, USA). Frequency sweeps were conducted from ω = 0.1—10 rad-s−1 using a strain amplitude of γ = 2%. Amplitude sweeps were also performed with strain amplitudes ranging from γ = 0.1—10%. The swelling ratio of crosslinked networks was measured by gravimetry. Briefly, excess water was removed from the surface and the mass of the samples was recorded (Ws). Samples were dehydrated for 60 °C at 5 Pa for 24 hr and the mass of each sample was recorded (Wd). The swelling ratio (Q) is defined as .
2. 5. Controlled release of genipin from PLGA polymer matrices
Poly(D,L-lactide-co-glycolide) (PLGA; 50:50 lactide:glycolide ratio; ; 50 mg; Sigma) was dissolved in acetone with prescribed amounts of genipin. PLGA-genipin solutions (approximately 0.2 mL) were drop cast on substrates (n = 3) and dried for 8 hr in ambient conditions to create films 30 µm in thickness. Genipin release kinetics was measured by UV-vis spectroscopy for up to 15 d by incubating genipin-loaded PLGA films in 5 mL 0.01 M PBS. The normalized amount of released genipin is defined as with mgenipin−PLGA,t∞ as the total amount of genipin released. Values for the diffusivity of genipin in PLGA were calculated by fitting the values of with values predicted from controlled release of small molecules from a thin slab42, 43. The latter is given by the following relationship:
| (Eqn. 5) |
with Dgenipin-PLGA as the diffusion coefficient of genipin in PLGA polymer matrix, and lPLGA as the film thickness (30 µm). Dgenipin-PLGA was determined by fitting experimental data to Eqn. 6 using constrained nonlinear optimization (Matlab fmincon)44, 45.
2.6 Fibrin clot stability assay
Genipin-crosslinked fibrin gel networks were prepared as previously mentioned. The integrity of the hydrogel was assessed by rheology in response to enzymatic activity. Fibrin gels were synthesized by combining 0.1 mL of 10 U-mL−1 thrombin solution with 0.4 mL of 20 mg-mL−1 fibrinogen. Gels were incubated at 37 °C for 12 hr on a rotary shaker prior to the addition of genipin. Genipin solutions (concentrations of 1, 3.5, 5, 10, and 25 mg-mL−1) were added to hydrated fibrin gel networks and incubated for 24 hr at 37 °C. Streptokinase C from β-hemolytic Streptococcus (Sigma-Aldrich, St. Louis, MO, USA) was prepared at concentrations of 10, 25, 50, and 100 U-mL−1 in PBS. Crosslinked fibrin gels were incubated in Streptokinase solutions at 37°C. The storage modulus was measured using a rheometer in a parallel plate configuration as previously described.
2.7 Scanning electron microscopy
Crosslinked fibrin gels and pristine fibrin gels were prepared as previously mentioned. Samples were dehydrated at 25°C in graded ethanol solutions (25–100 % v/v) in DI water for five minute intervals. The crosslinked and pristine fibrin gel samples were incubated with hexamethyldisilazane (HDMS) and dehydrated for 18 hr. Samples were mounted on stubs with double-sided tape and sputter-coated with a 2 nm layer of Pt. The microstructure of the gel networks was examined with scanning electron microscopy (SEM) at a voltage of 2.5 kV and a working distance of 15 mm (Philips XL30 Scanning Electron Microscope).
3. RESULTS AND DISCUSSION
3. 1. Diffusion of genipin within fibrin gel networks
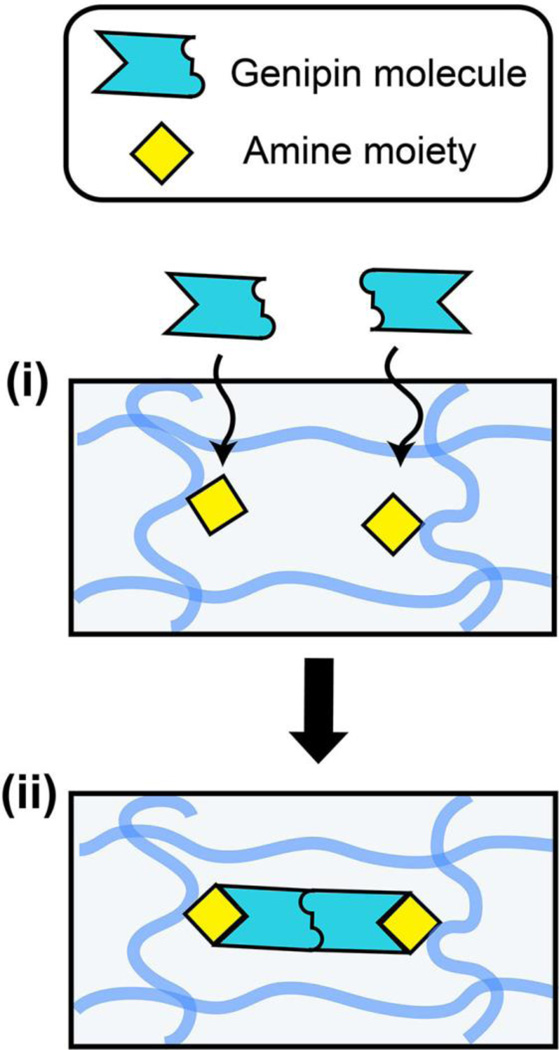
The observed rate of genipin crosslinking in fibrin gels is governed by one of two processes: genipin diffusion into the fibrin gel or the rate of incorporation of genipin with free primary amines (Figure 1). Comparing the relative rates of diffusion-reaction of genipin within fibrin gels can give insight into the rate-limiting step of clot stabilization through genipin crosslink formation. The relative rates of genipin diffusion through fibrin gels and the rate of covalent genipin incorporation and crosslinking with fibrin gels can be predicted by calculating the Thiele modulus. The diffusion coefficient of a small molecule in fibrin gel composed of fibers (Dgenipin-fibrin) is a function of the obstruction factor of diffusion paths, represented by the hydraulic permeability of fibrin gel (κ), and a hydrodynamic factor between the molecule (rg) and the fiber network (rf)46. The ratio of Dgenipin-fibrin to the diffusion coefficient of genipin in water (D0) can be estimated from the modified Brinkman model47–49 via the following relationship:
| (Eqn. 6) |
The diffusion coefficient of genipin in hydrated swollen fibrin gels is estimated to be 2.2 × 10⁻¹⁰ (m2-s−1) using values that are summarized in Table 1. Nauman et al. observe that the ratio is approximately unity due to the high swelling ratio of fibrin gel (33.4 13.6)46.
Figure 1.
Schematic of diffusion-reaction model of genipin crosslinking in fibrin gels. The overall rate of crosslinks formation is governed by (i) the diffusion of genipin in fibrin gel, and (ii) the rate of crosslinking reaction between genipin and free primary amine moieties. The shaded blue lines represent individual fibrin macromolecules within the hydrogel network.
Table 1.
Values of parameters used to calculate the diffusivity of genipin in fibrin gels via Eqn. 6.
3. 2. Reaction kinetics of genipin and ethylenediamine
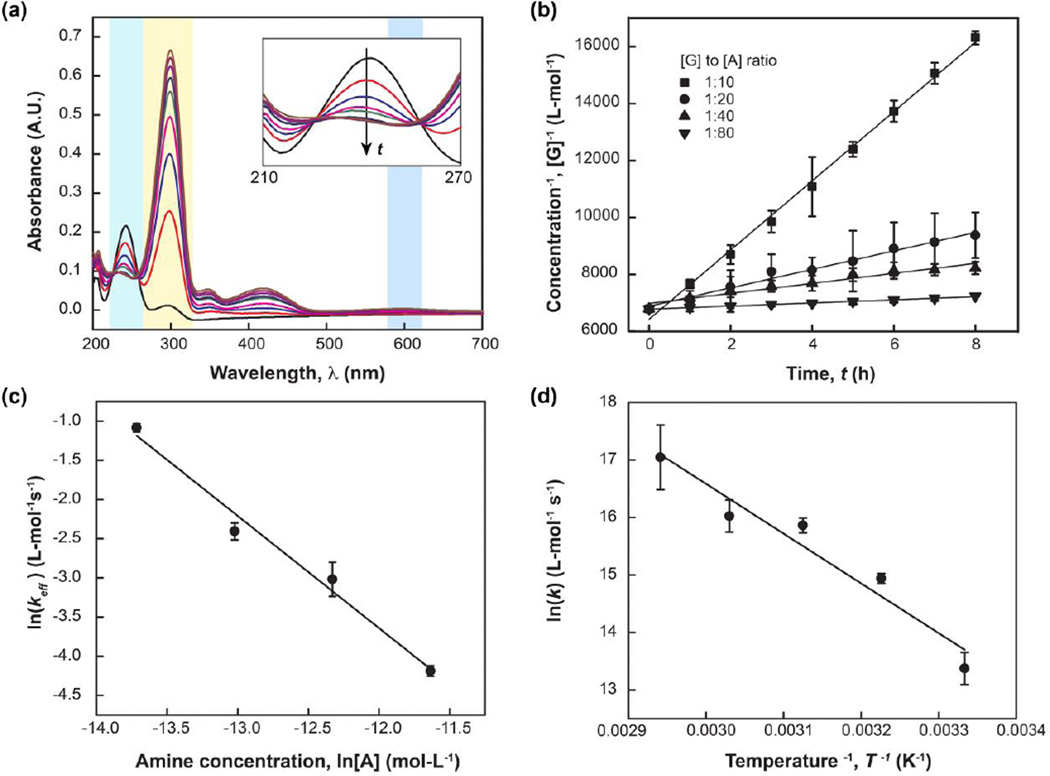
Genipin exhibits a strong characteristic absorption peak at λAbs = 240 nm while ethylenediamine does not possess aromatic rings that absorb in this band. The rate of genipin consumption can therefore be measured using UV-vis spectroscopy (Figure 2). Absorption intensities of genipin peaks centered about λAbs = 240 nm decrease, while the peak centered at λAbs = 290 nm, corresponding to intermediates, increases50–52. Intermediate compounds are formed during ring-opening of dihydropyran in genipin and the formation of a heterocylic amine compounds50, 51. Genipin consumption is a second order reaction when free primary amines are in excess resulting in a value of n = 2 (See Eqn. 2). This calculation is confirmed for the integral expression of Eqn. 2, which produces a linear plot of [G]−1 with time (Figure 2b). The effective rate constant (keff) for different amine concentrations was determined from the linear fit (Figure 4), and is shown in Table 2. Fitting experimental data to Eqn. 2 and Eqn. 3 produces the following overall rate expression (Figure 2c):
| (Eqn. 7) |
The temperature dependence of k is shown in the Arrhenius plot (Figure 2d). The activation energy of genipin reactions with ethylenediamine is −71.9 ± 3.2 kJ-mol−1. This value lies in close agreement with the previously reported value of −75.8 kJ-mol−153. The negative value of activation energy indicates that the reaction rate decreases with increasing temperature, a phenomenon that is also observed in protein folding54.
Figure 2.
Kinetics parameters of genipin reacting with ethylenediamine in aqueous solution were characterized using UV-vis. (a) The direction of the arrow indicates UV-vis spectra recorded with increasing reaction time. The maximum intensity of the peak centered at λAbs = 240 nm decreased over time, which corresponds to genipin consumption. (b) The effective rate constant (keff) was determined from integration of Eqn. 2. The observed reaction rate is second order with respect to [G]. (c) Dependence of the reaction rate on [A] (m) was determined as 1.4 ± 0.5 from Eqn. 3. The overall rate constant is 3.10 × 10⁻¹⁰ ± 6.01 × 10⁻¹³ L2-mol−2 s−1 (See Text). (d) The temperature dependence of k is plotted using an Arrhenius relationship. The apparent activation energy of genipin reaction with ethylenediamine is calculated to be −71.9 ± 3.2 kJ-mol−1 (See Text).
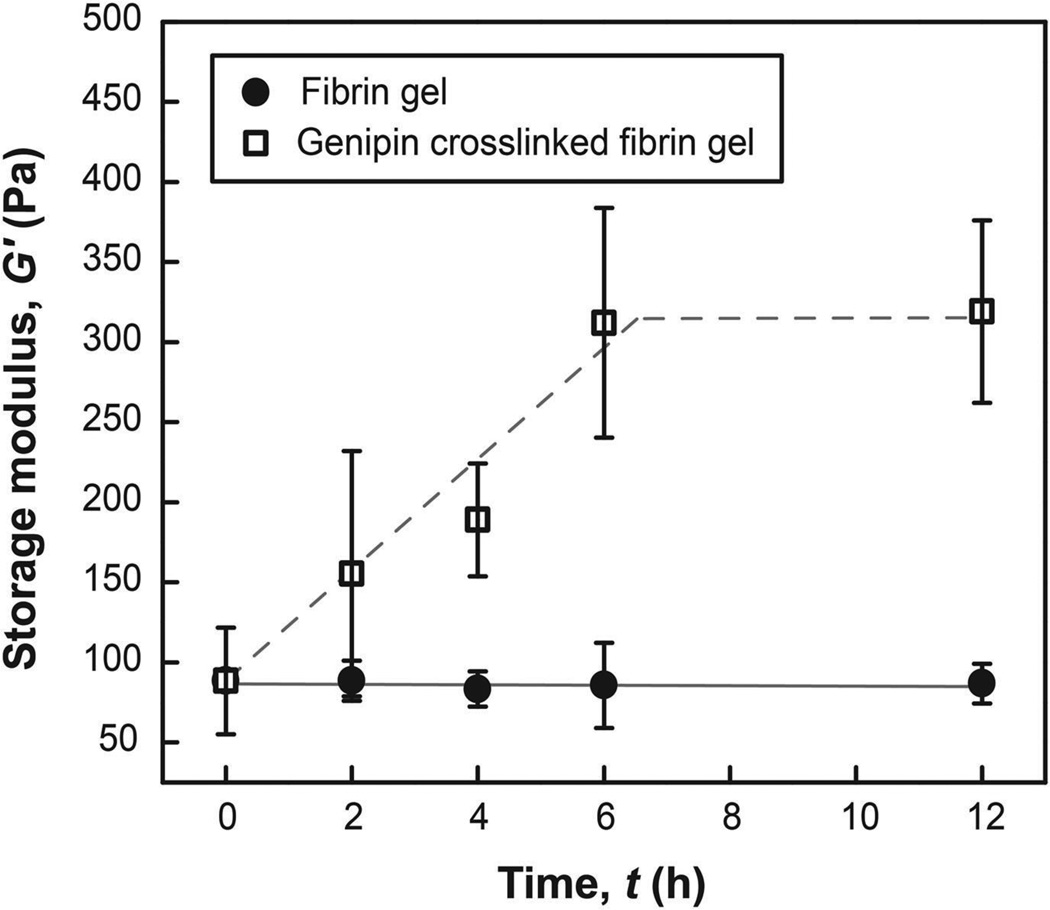
Figure 4.
Temporal evolution of G’ over time of pristine fibrin gel and fibrin gel incubated in genipin solution (1:10 molar ratios of genipin:free primary amine). The storage modulus of genipin crosslinked fibrin gel reaches a maximum value after 6 hr. Pristine fibrin hydrogel networks were mostly disintegrated in PBS buffer after 24 hr, while fibrin hydrogel networks crosslinked with genipin retained their mechanical properties (313.3 ± 64.8 Pa).
Table 2.
Values for reaction rate constants for different free primary amine concentrations determined from linear fit of inverse genipin concentration [G]−1 versus time with 95% confidence interval.
| [A] (mol-L−1) | [G]:[A] ratio | keff (L-mol−1 s−1) |
| 3.68 × 10−07 | 1:10 | 0.337 ± 0.017 |
| 7.36 × 10−07 | 1:20 | 0.090 ± 0.009 |
| 1.47 × 10−06 | 1:40 | 0.048 ± 0.010 |
| 2.94 × 10−06 | 1:80 | 0.022 ± 0.0007 |
3. 3. Comparing diffusion and reaction processes in fibrin gel networks
The concentration of amino acids in fibrin gels is 1.99 ± 0.03 µM as measured by ninhydrin assays41. The rates of diffusion and reaction were compared through calculation of the Thiele modulus55. The Thiele modulus (θ) for a second-order reaction in a one-dimensional slab of thickness lfibrin is given by56:
| (Eqn. 8) |
Systems are diffusion (reaction) limited when the Thiele modulus is much larger (smaller) than unity56. The Thiele moduli calculated for genipin in fibrin gels across a range of values for [G] is shown in Table 3. These values suggest that genipin diffusion in fibrin gels is relatively more rapid compared to the rate of covalent incorporation. The rate of crosslink formation is therefore limited by the rate of genipin consumption within fibrin gels.
Table 3.
The Thiele modulus (θ) was calculated for a range of genipin concentrations. θ increases with increasing concentration of genipin. The Thiele moduli (<1) indicate that the overall rate of crosslink formation within fibrin hydrogel networks is controlled by the reaction rate (See Text). The physical properties of pristine fibrin gels and fibrin gels crosslinked with genipin are shown for at a range of genipin concentrations.
| [A]:[G] ratio | Thiele modulus, θ | Storage modulus, G’ (Pa) | Swelling ratio, Q |
| 1:0 | --- | 88 ± 15 | 33.4 ± 13.5 |
| 80:1 | 0.02 | 89 ± 13 | 33.2 ± 18.1 |
| 40:1 | 0.05 | 101 ± 38 | 34.5 ± 22.5 |
| 20:1 | 0.10 | 151 ± 10 | 33.9 ± 23.8 |
| 10:1 | 0.28 | 307 ± 3 | 30.8 ± 13.1 |
3.4. Enzymatic stability and nanostructure of genipin-crosslinked fibrin clots
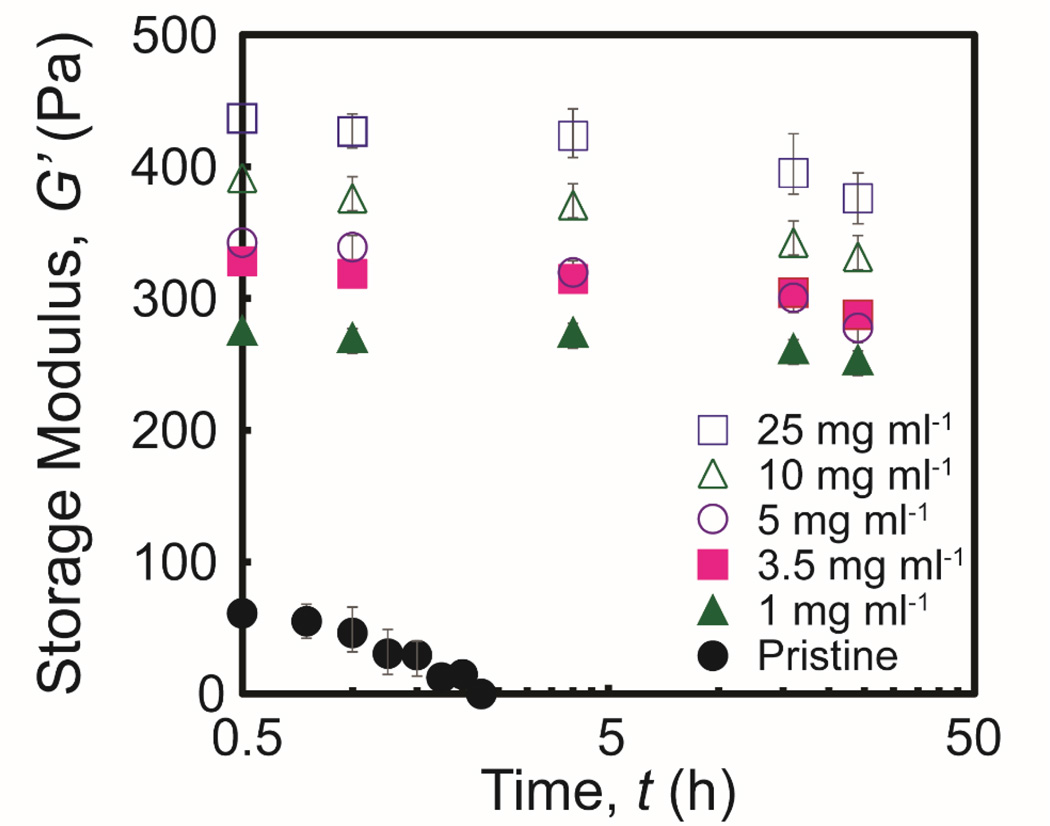
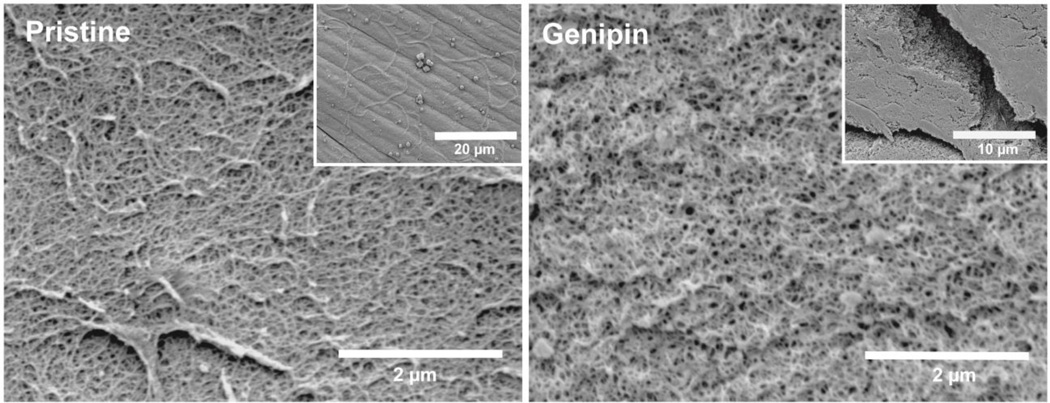
The enzymatic stability of the genipin-crosslinked fibrin clots was assessed by the addition of streptokinase under controlled conditions. The degradation kinetics were determined through evaluation of the integrity of the clots throughout the incubation time. Pristine fibrin gels degraded completely within 3 hr as determined by a storage modulus near zero at this time. The storage modulus of genipin-crosslinked fibrin networks was relatively constant with a reduction of approximately 10% after 24 hr (Figure 5). These data suggest that genipin-crosslinked fibrin clots are highly resistant against fibrinolytic degradation. Thus, the stabilized clots have increased potential to improve the performance of embolization treatments. Pristine fibrin gels and fibrin gels crosslinked with genipin exhibit comparable nanoscale morphologies (Figure 6). Both sets of fibrin gels show a homogenous porous structure with distinct fibers. Genipin-crosslinked fibrin gels exhibit slightly more bundling and larger pore sizes compared to pristine fibrin gel counterparts.
Figure 5.
The storage modulus of pristine and genipin-crosslinked fibrin gels is plotted as a function of incubation time in streptokinase solution. The storage modulus of genipin-crosslinked fibrin networks exhibits a graduate decrease over time (less than 12 % in 24 hr) while the storage modulus of pristine fibrin gel networks decreases to nearly zero after 3 hr.
Figure 6.
Microstructure of genipin-crosslinked fibrin clots compared to pristine fibrin clots.
3. 5. Controlled release of genipin from PLGA thin films
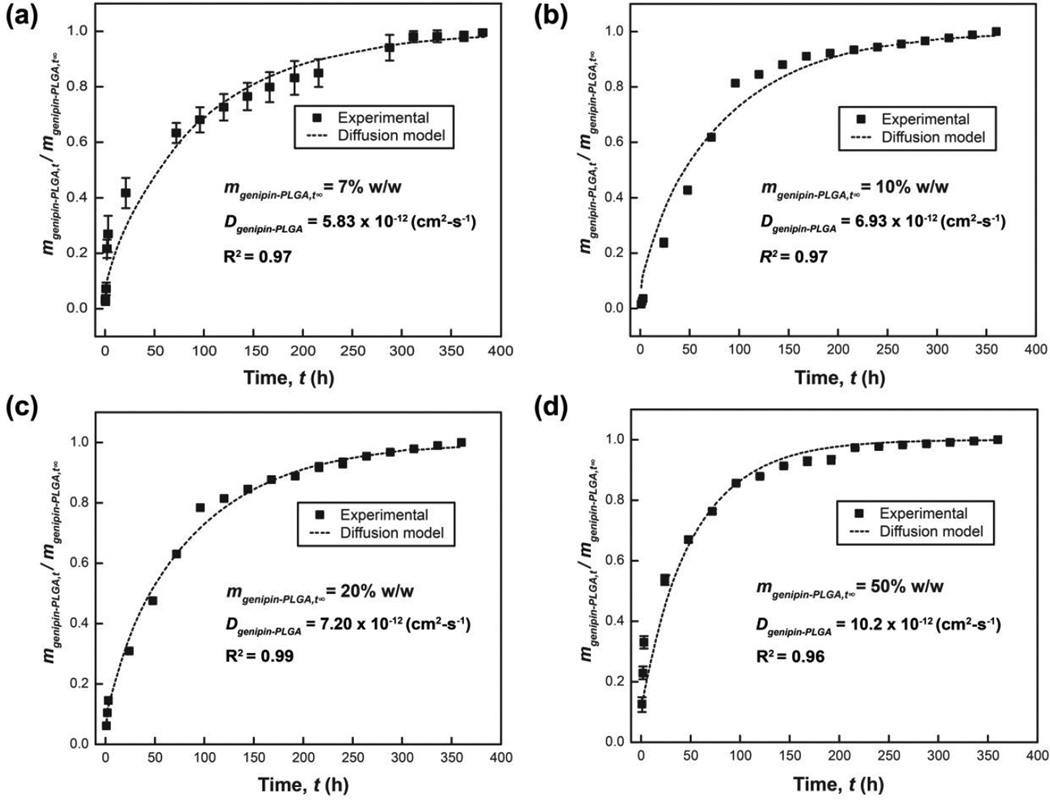
Controlled release strategies are compatible with genipin owing to the small molecular weight and orthogonal reactivity with many polymers that are used as controlled release matrices57–59. Controlled release of genipin may be useful in applications that require spatiotemporal control of genipin concentrations to match the rate-limiting step for network incorporation. PLGA was chosen as the matrix for this study because PLGA has been widely utilized for controlled release of many biologics including small molecules, proteins, and nucleic acids59–62. The absence of free primary amines in PLGA suggests that this polymer is suitable for controlled release of genipin. Genipin-loaded PLGA films achieve controlled release of genipin over 15 d. The relative rate of genipin release from PLGA matrices increases proportionally with higher genipin loading (Figure 7). Genipin diffusivities in genipin-loaded PLGA matrices Dgenipin-PLGA were calculated to be 5.83 ± 1.12, 6.93 ± 0.10, 7.20 ± 0.08, and 10.2 ± 0.4 × 10⁻¹² cm2-s−1 for films prepared from the following genipin concentrations 7, 10, 20, and 50% w/w (genipin:PLGA ratio) respectively. The model described in Eqn. 5 exhibits good agreement with experimental data (Figure 7).
Figure 7.
Genipin release kinetics from PLGA (50 mg-mL−1) thin films with genipin loading of (a) 7, (b) 10, (c) 20, and (d) 50% w/w (genipin:PLGA). All genipin is released from PLGA matrices within 15 days for all genipin loading. The normalized release rate increases with higher loading of genipin in the PLGA matrix. The release profile of genipin from PLGA matrices lies in good agreement with diffusion-controlled models given by Eqn. 5. The effective diffusion coefficients were determined using Matlab function fmincon (See Experimental Details).
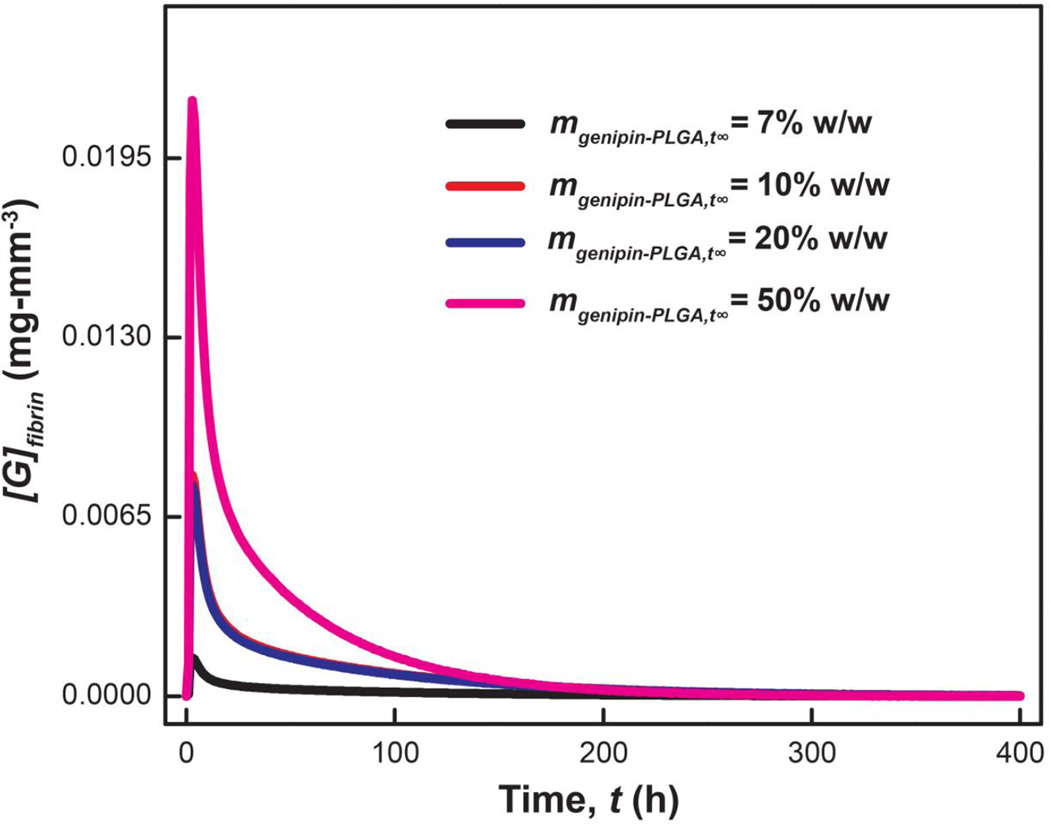
The kinetics and diffusion parameters established herein can predict the time-varying genipin concentration within the fibrin clot. The genipin concentration within hypothetical fibrin networks (mgenipin,fibrin) is predicted for different ratios of genipin:PLGA loading (mgenipin−PLGA,t∞; Figure 7). The concentration of genipin supplied to the fibrin gel was interpolated from Eqn. 5 using Dgenipin-PLGA fitted from experimental data. The concentration of genipin consumed was predicted from the reaction kinetics (Eqn. 7). Taken together, the diffusion and kinetics parameters established in this study can predict the time-varying genipin concentration within fibrin networks (Figure 8, Supporting Information). The genipin concentration increases and reaches maximum within 3 hr. The genipin concentration decreases rapidly after the initial burst release. This model predicts that genipin will be consumed in fibrin networks within 250 hr. Accurate predictions of the temporal evolution of genipin can inform the design of diffusion-controlled release systems for genipin delivery in vivo.
Figure 8.
Predicted time profile of genipin within hypothetical fibrin networks. The rate of genipin supply is interpolated from controlled release of genipin from PLGA matrices via Eqn. 5 at the following loadings: 7, 10, 20, and 50% (w/w). Genipin consumption is inferred from experimentally determined reaction kinetics using Eqn. 7 (Supporting Information).
4. CONCLUSIONS
The relative rates diffusion-reaction of genipin through fibril gels were measured by spectroscopy and rheology in vitro. Anisotropic nanostructures and high swelling ratios observed in fibrin gels ensure rapid diffusion of genipin through these natural biopolymer networks. The rate of genipin consumption is second order in genipin concentration because crosslink formation requires dimerization. The observed rates of genipin crosslinking formation are corroborated by measuring the marginal increase in storage modulus via rheology. Genipin crosslinks impart increased mechanical stability and attenuate enzyme-mediate disintegration in vitro. These observations suggest that genipin could serve as a biologic to improve minimally invasive embolic treatments for use in various indications. The reaction-diffusion parameters established herein can inform drug delivery systems to match the rate of genipin supply with the rate of genipin consumption. Crosslinking fibrin gels using genipin is also a potentially effective strategy to stabilize fibrin gel against enzymatic degradation. Knowledge about the relative rates of diffusion-reaction of genipin in fibrillar hydrogel networks can advance the use of this small molecule biologic in various biomedical technologies.
Supplementary Material
Figure 3.
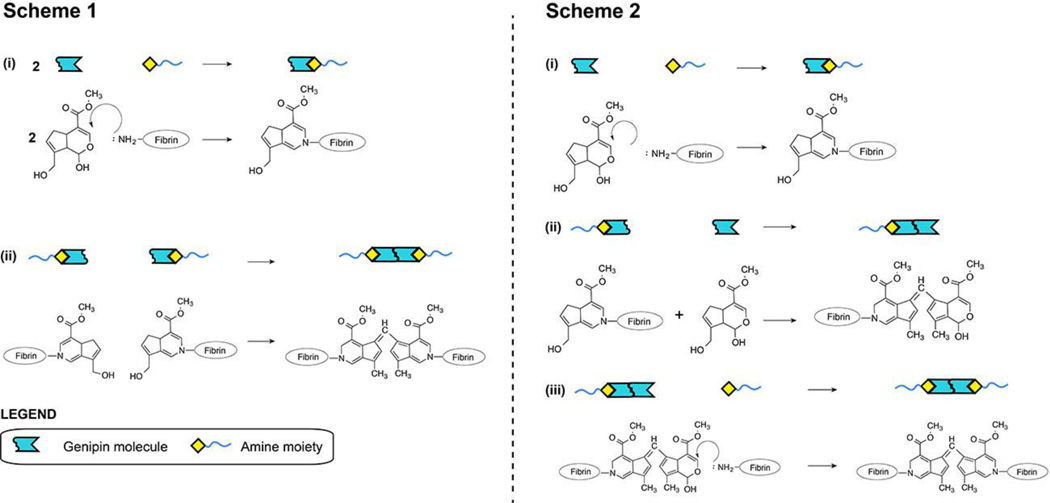
Proposed reaction sequences involved in genipin crosslink formation within fibrin gels. Covalent crosslinks are formed via capping reactions of genipin with free primary amines followed by genipin dimerization. This process will covalently crosslink individual fibrin macromolecules (shown in blue lines) within the clot. The final product can be formed through at least two possible pathways. Scheme 1 shows two separate capping reactions followed by genipin dimerization. Scheme 2 shows a capping reaction followed by genipin dimerization. This product then reacts with a second free primary amine to form a covalent crosslink. The rate of genipin consumption in both possible schemes is described by Eqn. 7.
Acknowledgements
Funding provided by the following organizations: the National Institutes of Health (NIH; R21EB015165); the American Heart Association (AHA 12SDG12050297). Thermal and mechanical characterization was performed at the Carnegie Mellon University Thermomechanical Characterization Suite within the Materials Science Department within the College of Engineering.
REFERENCES
- 1.Janmey PA, Winer JP, Weisel JW. Journal of The Royal Society Interface. 2009;6:1–10. doi: 10.1098/rsif.2008.0327. [DOI] [PMC free article] [PubMed] [Google Scholar]
- 2.Wolberg AS. Blood Reviews. 2007;21:131–142. doi: 10.1016/j.blre.2006.11.001. [DOI] [PubMed] [Google Scholar]
- 3.Doolittle RF. eLS. John Wiley & Sons, Ltd; 2001. Editon edn. [Google Scholar]
- 4.Furie B, Furie BC. Cell. 1988;53:505–518. doi: 10.1016/0092-8674(88)90567-3. [DOI] [PubMed] [Google Scholar]
- 5.Tawes RL, Jr, Sydorak GR, DuVall TB. The American Journal of Surgery. 1994;168:120–122. doi: 10.1016/s0002-9610(94)80049-9. [DOI] [PubMed] [Google Scholar]
- 6.Spicer PP, Mikos AG. Journal of Controlled Release. 2010;148:49–55. doi: 10.1016/j.jconrel.2010.06.025. [DOI] [PMC free article] [PubMed] [Google Scholar]
- 7.Bensaïd W, Triffitt JT, Blanchat C, Oudina K, Sedel L, Petite H. Biomaterials. 2003;24:2497–2502. doi: 10.1016/s0142-9612(02)00618-x. [DOI] [PubMed] [Google Scholar]
- 8.Bhang SH, Jeon O, Choi CY, Kwon YHK, Kim B-S. Journal of Biomedical Materials Research Part A. 2007;80A:998–1002. doi: 10.1002/jbm.a.31050. [DOI] [PubMed] [Google Scholar]
- 9.Lei P, Padmashali RM, Andreadis ST. Biomaterials. 2009;30:3790–3799. doi: 10.1016/j.biomaterials.2009.03.049. [DOI] [PMC free article] [PubMed] [Google Scholar]
- 10.Zhou W, Zhao M, Zhao Y, Mou Y. J Mater Sci: Mater Med. 2011;22:1221–1230. doi: 10.1007/s10856-011-4304-9. [DOI] [PubMed] [Google Scholar]
- 11.Briganti E, Spiller D, Mirtelli C, Kull S, Counoupas C, Losi P, Senesi S, Di Stefano R, Soldani G. Journal of Controlled Release. 2010;142:14–21. doi: 10.1016/j.jconrel.2009.09.029. [DOI] [PubMed] [Google Scholar]
- 12.Ahmed TA, Dare EV, Hincke M. Tissue Engineering Part B: Reviews. 2008;14:199–215. doi: 10.1089/ten.teb.2007.0435. [DOI] [PubMed] [Google Scholar]
- 13.Collen D, Lijnen H. Blood. 1991;78:3114–3124. [PubMed] [Google Scholar]
- 14.Smith SA, Morrissey JH. Polyphosphate enhances fibrin clot structure. 2008 doi: 10.1182/blood-2008-03-145755. [DOI] [PMC free article] [PubMed] [Google Scholar]
- 15.Rousou JA, Engelman RM, Breyer RH. The Annals of Thoracic Surgery. 1984;38:409–410. doi: 10.1016/s0003-4975(10)62297-7. [DOI] [PubMed] [Google Scholar]
- 16.Diamond SL. Annual Review of Biomedical Engineering. 1999;1:427–461. doi: 10.1146/annurev.bioeng.1.1.427. [DOI] [PubMed] [Google Scholar]
- 17.Kolev K, Tenekedjiev K, Komorowicz Eb, Machovich R. Journal of Biological Chemistry. 1997;272:13666–13675. doi: 10.1074/jbc.272.21.13666. [DOI] [PubMed] [Google Scholar]
- 18.Avrameas S, Ternynck T. Immunochemistry. 1969;6:53–66. doi: 10.1016/0019-2791(69)90178-5. [DOI] [PubMed] [Google Scholar]
- 19.Richards FM, Knowles JR. Journal of Molecular Biology. 1968;37:231–233. doi: 10.1016/0022-2836(68)90086-7. [DOI] [PubMed] [Google Scholar]
- 20.Tronci G, Neffe AT, Pierce BF, Lendlein A. Journal of Materials Chemistry. 2010;20:8875–8884. [Google Scholar]
- 21.Balakrishnan B, Jayakrishnan A. Biomaterials. 2005;26:3941–3951. doi: 10.1016/j.biomaterials.2004.10.005. [DOI] [PubMed] [Google Scholar]
- 22.Bigi A, Cojazzi G, Panzavolta S, Roveri N, Rubini K. Biomaterials. 2002;23:4827–4832. doi: 10.1016/s0142-9612(02)00235-1. [DOI] [PubMed] [Google Scholar]
- 23.Gough JE, Scotchford CA, Downes S. Journal of Biomedical Materials Research. 2002;61:121–130. doi: 10.1002/jbm.10145. [DOI] [PubMed] [Google Scholar]
- 24.Chang C-J. Journal of Biomedical Materials Research Part A. 2009;91A:586–596. doi: 10.1002/jbm.a.32252. [DOI] [PubMed] [Google Scholar]
- 25.Liang H-C, Chang W-H, Lin K-J, Sung H-W. Journal of Biomedical Materials Research Part A. 2003;65A:271–282. doi: 10.1002/jbm.a.10476. [DOI] [PubMed] [Google Scholar]
- 26.Muzzarelli RAA. Carbohydrate Polymers. 2009;77:1–9. [Google Scholar]
- 27.Sung H-W, Liang IL, Chen C-N, Huang R-N, Liang H-F. Journal of Biomedical Materials Research. 2001;55:538–546. doi: 10.1002/1097-4636(20010615)55:4<538::aid-jbm1047>3.0.co;2-2. [DOI] [PubMed] [Google Scholar]
- 28.Sung HW, Huang RN, Huang LL, Tsai CC. J Biomater Sci Polym Ed. 1999;10:63–78. doi: 10.1163/156856299x00289. [DOI] [PubMed] [Google Scholar]
- 29.Touyama R, Inoue K, Takeda Y, Yatsuzuka M, Ikumoto T, Moritome N, Shingu T, Yokoi T, Inouye H. Chemical and pharmaceutical bulletin. 1994;42:1571–1578. [Google Scholar]
- 30.Sung H-W, Huang R-N, Huang LLH, Tsai C-C, Chiu C-T. Journal of Biomedical Materials Research. 1998;42:560–567. doi: 10.1002/(sici)1097-4636(19981215)42:4<560::aid-jbm12>3.0.co;2-i. [DOI] [PubMed] [Google Scholar]
- 31.Chen S-C, Wu Y-C, Mi F-L, Lin Y-H, Yu L-C, Sung H-W. Journal of Controlled Release. 2004;96:285–300. doi: 10.1016/j.jconrel.2004.02.002. [DOI] [PubMed] [Google Scholar]
- 32.Yuan Y, Chesnutt BM, Utturkar G, Haggard WO, Yang Y, Ong JL, Bumgardner JD. Carbohydrate Polymers. 2007;68:561–567. [Google Scholar]
- 33.Madhavan K, Belchenko D, Motta A, Tan W. Acta Biomaterialia. 2010;6:1413–1422. doi: 10.1016/j.actbio.2009.09.028. [DOI] [PubMed] [Google Scholar]
- 34.Schek R, Michalek A, Iatridis J. Eur Cell Mater. 2011;21:373. doi: 10.22203/ecm.v021a28. [DOI] [PMC free article] [PubMed] [Google Scholar]
- 35.Gamboa-Martínez TC, Luque-Guillén V, González-García C, Gómez Ribelles JL, Gallego-Ferrer G. Journal of Biomedical Materials Research Part A. 2015;103:614–621. doi: 10.1002/jbm.a.35210. [DOI] [PubMed] [Google Scholar]
- 36.Purmessur D, Schek RM, Abbott RD, Ballif BA, Godburn KE, Iatridis JC. Arthritis Res Ther. 2011;13:R81. doi: 10.1186/ar3344. [DOI] [PMC free article] [PubMed] [Google Scholar]
- 37.Butler MF, Ng Y-F, Pudney PDA. Journal of Polymer Science Part A: Polymer Chemistry. 2003;41:3941–3953. [Google Scholar]
- 38.Lee S-W, Lim J-M, Bhoo S-H, Paik Y-S, Hahn T-R. Analytica Chimica Acta. 2003;480:267–274. [Google Scholar]
- 39.Paik Y-S, Lee C-M, Cho M-H, Hahn T-R. Journal of Agricultural and Food Chemistry. 2000;49:430–432. doi: 10.1021/jf000978f. [DOI] [PubMed] [Google Scholar]
- 40.Qi PX, Nuñez A, Wickham ED. Journal of Agricultural and Food Chemistry. 2012;60:4327–4335. doi: 10.1021/jf300311k. [DOI] [PubMed] [Google Scholar]
- 41.Starcher B. Analytical Biochemistry. 2001;292:125–129. doi: 10.1006/abio.2001.5050. [DOI] [PubMed] [Google Scholar]
- 42.Crank J. London: Oxford Univ. Press; 1959. p. 347. [Google Scholar]
- 43.Lao LL, Venkatraman SS, Peppas NA. European Journal of Pharmaceutics and Biopharmaceutics. 2008;70:796–803. doi: 10.1016/j.ejpb.2008.05.024. [DOI] [PubMed] [Google Scholar]
- 44.Rao SS, Rao S. Engineering optimization: theory and practice. John Wiley & Sons; 2009. [Google Scholar]
- 45.Ringrose T, Forth S. Compstat. 2002 [Google Scholar]
- 46.Nauman JV, Campbell PG, Lanni F, Anderson JL. Biophysical Journal. 2007;92:4444–4450. doi: 10.1529/biophysj.106.102699. [DOI] [PMC free article] [PubMed] [Google Scholar]
- 47.Tong J, Anderson JL. Biophysical Journal. 1996;70:1505–1513. doi: 10.1016/S0006-3495(96)79712-6. [DOI] [PMC free article] [PubMed] [Google Scholar]
- 48.Johnson EM, Berk DA, Jain RK, Deen WM. Biophysical Journal. 1996;70:1017–1023. doi: 10.1016/S0006-3495(96)79645-5. [DOI] [PMC free article] [PubMed] [Google Scholar]
- 49.Solomentsev YE, Anderson JL. Physics of Fluids (1994-present) 1996;8:1119–1121. [Google Scholar]
- 50.Park J-E, Lee J-Y, Kim H-G, Hahn T-R, Paik Y-S. Journal of Agricultural and Food Chemistry. 2002;50:6511–6514. doi: 10.1021/jf020499b. [DOI] [PubMed] [Google Scholar]
- 51.Di Tommaso S, David H, Gomar J, Leroy F, Adamo C. RSC Advances. 2014;4:11029–11038. [Google Scholar]
- 52.Mi F-L, Shyu S-S, Peng C-K. Journal of Polymer Science Part A: Polymer Chemistry. 2005;43:1985–2000. [Google Scholar]
- 53.Nickerson MT, Patel J, Heyd DV, Rousseau D, Paulson AT. International Journal of Biological Macromolecules. 2006;39:298–302. doi: 10.1016/j.ijbiomac.2006.04.010. [DOI] [PubMed] [Google Scholar]
- 54.Oliveberg M, Tan YJ, Fersht AR. Proceedings of the National Academy of Sciences. 1995;92:8926–8929. doi: 10.1073/pnas.92.19.8926. [DOI] [PMC free article] [PubMed] [Google Scholar]
- 55.Thiele EW. Industrial & Engineering Chemistry. 1939;31:916–920. [Google Scholar]
- 56.Mehta BN, Aris R. Chemical Engineering Science. 1971;26:1699–1712. [Google Scholar]
- 57.Chasin M, Langer RS. Biodegradable polymers as drug delivery systems. New York: M. Dekker; 1990. [Google Scholar]
- 58.Langer RS, Wise DL. Medical applications of controlled release. CRC Press; Boca Raton, Fla.: 1984. [Google Scholar]
- 59.Makadia HK, Siegel SJ. Polymers (Basel) 2011;3:1377–1397. doi: 10.3390/polym3031377. [DOI] [PMC free article] [PubMed] [Google Scholar]
- 60.Uhrich KE, Cannizzaro SM, Langer RS, Shakesheff KM. Chemical Reviews. 1999;99:3181–3198. doi: 10.1021/cr940351u. [DOI] [PubMed] [Google Scholar]
- 61.Cohen S, Yoshioka T, Lucarelli M, Hwang L, Langer R. Pharm Res. 1991;8:713–720. doi: 10.1023/a:1015841715384. [DOI] [PubMed] [Google Scholar]
- 62.Jain RA. Biomaterials. 2000;21:2475–2490. doi: 10.1016/s0142-9612(00)00115-0. [DOI] [PubMed] [Google Scholar]
Associated Data
This section collects any data citations, data availability statements, or supplementary materials included in this article.


