

Abstract
Understanding neurological diseases requires tractable genetic systems. Engineered 3D neural tissues are an attractive choice, but how the cellular transcriptomic profiles in these tissues are affected by the encapsulating materials and are related to the human-brain transcriptome is not well understood. Here, we report the characterization of the effects of culturing conditions on the transcriptomic profiles of induced neuronal cells, as well as a method for the rapid generation of 3D co-cultures of neuronal and astrocytic cells from the same pool of human embryonic stem cells. By comparing the gene-expression profiles of neuronal cells in culture conditions relevant to the developing human brain, we found that modifying the degree of crosslinking of composite hydrogels can tune expression patterns so they correlate with those of specific brain regions and developmental stages. Moreover, by using single-cell sequencing, we show that our engineered tissues recapitulate transcriptional patterns of cell types in the human brain. The analysis of culturing conditions will inform the development of 3D neural tissues for use as tractable models of brain diseases.
There is increasing evidence that some neurological diseases have a genetic component1-3 as evidenced by the growing catalogs of gene variants involved in these diseases generated by next-generation sequencing 2,4,5. Understanding the mechanistic outcomes of these mutations, however, has been difficult because we lack tractable genetic models in which to systematically interrogate them. One promising approach has been to engineer 3D neural tissues6-9 that can provide a system for rapid genetic manipulation in a brain-like environment. To be effective, such tissues should closely reflect the extracellular matrix (ECM), gene expression profiles, and cell composition of the human brain. In addition, they should be rapid and simple to generate and allow for controllable numbers of brain-related cell types with an isogenic background within a tunable environment.
A number of approaches have been taken to develop such neural tissues in vitro, focusing on differentiating human embryonic stem cells (hESCs) and induced pluripotent stem cells (iPSCs) into brain-related cell types, such as neurons and glia, on two-dimensional (2D) surfaces as well as 3D matrices10-16. Typically, the brain-like properties of these tissues are assessed by performing electrophysiological assays and immunostainings for neural markers. However, these broad approaches may not accurately reflect the cellular state, and more comprehensive analysis, like RNA-seq, could improve assessment of these tissues. A previous study compared the transcriptomic profile of cerebral organoids to the human fetal brain17, however it has not been reported how the global transcriptome of neural cells in engineered tissues relates to the human brain and how the gene expression profiles of these cells respond to various culturing conditions.
To generate a system that can serve as a proxy for studying the genetics of the human brain, we compared a number of different conditions used for generating 3D neural tissues from induced neuronal (iN) cells from hESCs and develop a method for rapid generation of 3D co-cultures of iN and astrocytic cells derived from the same population of hESCs. iN cells can be efficiently produced directly from hESCs using ectopic expression of transcription factors18-22 and have been used to model neurological diseases by culturing them on 2D surfaces23,24. This approach has also been used to produce 3D neural tissues on an electrospun scaffold for transplantation25. We extended these approaches to create a 3D culture of iN cells within Matrigel, a basement membrane matrix that includes components that closely reflect brain ECM6,26. We optimized these tissues by exploring the effects of the addition of hyaluronic acid (HA) as well as the formation of a composite hydrogel of Matrigel and alginate with varying crosslinking density and volume. We compared the transcriptome of these iNs to a panel of human brain transcriptomic data and showed that the gene expression of iN cells can be tuned to correlate with specific developmental time points and brain regions by modulating the composition of the 3D matrix. Single-cell sequencing of cells co-cultured in 3D tissues confirmed their transcriptomic correlations to cell types found in the human brain. Finally, we used gene editing tools to create gene knock-outs in our 3D tissues of genes implicated in neurodegenerative diseases, demonstrating the feasibility of combining these technologies.
Results
Development and optimization of 3D neural tissues from hESCs
To create a robust, genetically tractable 3D neural tissue system, we used a transcriptional activation approach to differentiate iN cells from hESCs and encapsulate them in a Matrigel matrix (Fig. 1a). We initially tested whether encapsulated hESCs transduced with NGN1 and NGN2 overexpression constructs could be directly differentiated in a Matrigel 3D matrix, but this approach resulted in aggregation of encapsulated cells within 5 days (Supplementary Fig. 1a), preventing efficient differentiation. To circumvent aggregation, hESCs were first seeded on 2D plates and then induced to form neuronal cells, which were subsequently detached and then encapsulated in Matrigel (Supplementary Fig. 1b). Although this led to less aggregation, over time, aggregates continued to form, with spheroids present at day-30 (Supplementary Fig. 1c, d). Further improvements were made by increasing selection for NGN1/2 constructs and introducing a proliferation inhibitor, 1-β-D-Arabinofuranosylcytosine (Ara-C), to suppress proliferation of undifferentiated stem cells. This resulted in 3D pure human neural tissues without cell aggregates (Supplementary Fig. 1e, Supplementary video 1-3). For comparison, we also generated 2D cultures of iN cells (Fig. 1a) (see methods).
Figure 1.
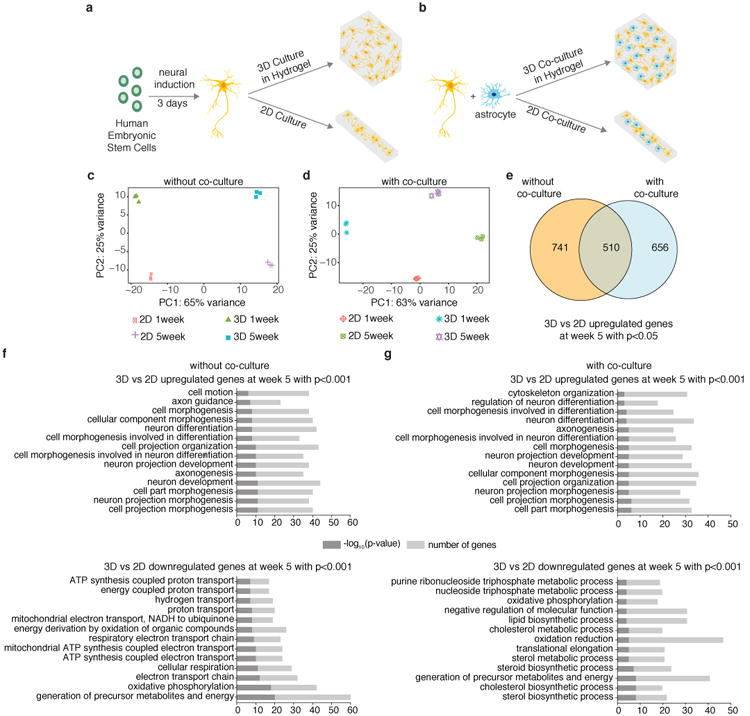
3D cultures and co-cultures of hESC-derived human iN cells within Matrigel show enriched neuronal processes compared to 2D cultures and co-cultures. Schematic for generation of (a) 3D and 2D neuronal cultures of human iN cells derived directly from hESCs by transcriptional activation (see also Supplementary Fig. 1 and Methods for details) and (b) 3D and 2D neuronal co-cultures of human iN cells and mouse astrocytes. (c) PCA of gene expression values derived from whole transcriptome sequencing data of 3D and 2D cultured iN cells at 1 week and 5 weeks (n=3 for each condition). For 3D cultures, human iN cells (at a concentration of 10×106 cells/ml) were encapsulated in Matrigel (4.6 mg/ml). (d) PCA of gene expression values derived from whole transcriptome sequencing data of 3D and 2D co-cultured iN cells at 1 week and 5 weeks (n=3 for each condition). For 3D co-cultures, human iN cells and mouse astrocytes (at a concentration of 20×106 cells/ml) were encapsulated in Matrigel (4.6 mg/ml). (e) Venn diagram showing number of differentially upregulated genes with p<0.05 for 3D vs 2D cultures and co-cultures and overlap of genes at week 5 (adjusted p value is 0.05). (f)Gene ontology (GO) analysis for differentially upregulated and downregulated genes with p<0.001 for 3D vs 2D cultures and (g) co-cultures (adjusted p value is 0.05).
Characterization of 3D cultures
To characterize the differences between 2D and 3D cultures of iN cells, we performed global transcriptome analysis and observed clear differences between these cultures at both the 1-week and 5-week time points (Fig. 1c, Supplementary Table 1,2). Maintaining healthy neural tissues for an extended amount of time promotes neuronal maturity13,22, and we therefore focused our analysis on tissues at the 5-week time point. Gene set enrichment analysis (GSEA) showed more enriched neurological processes present in 3D cultured iN cells than in 2D ones at five weeks, whereas 2D cultures were enriched for apoptosis and oxidative stress, indicative of their poor health (Supplementary Fig. 2a). We validated a subset of these genes by qPCR (Supplementary Fig. 2b). This is supported by gene ontology (GO) analysis for up- and down-regulated genes with p<0.001 (Fig. 1f). This trend was not significantly affected by batch-to-batch variation in Matrigel (Supplementary Fig. 3a-c). Given this trend, we next tested whether increasing the concentration of Matrigel would further enhance for neurological processes, and we found an incremental improvement (Supplementary Fig. 3d, e). The ability to study the electrophysiological properties in a 3D culture system is desirably for downstream genetic studies, and we therefore analyzed the expression of genes involved in channel activity and the electrophysiological properties of these tissues. The 3D cultures of iN cells showed increased expression of a number of genes involved in channel activity, and we found that these cells, unlike their 2D counterparts, were capable of firing repetitive action potentials and displayed spontaneous excitatory postsynaptic currents (sEPSCs) (Supplementary Fig. 4). To further develop the cellular composition of our 3D cultures, we co-cultured iN cells with mouse astrocytes, which support neuronal processes and functions18,19,27(Fig. 1b) and performed bulk RNA-seq (reads from mouse astrocytes were filtered out, see Supplementary Fig. 5a and methods). We observed global transcriptome differences between 2D and 3D co-cultures of iN cells at both the 1-week and 5-week time points (Fig. 1d, Supplementary Table 3), and a substantial number of the significantly upregulated genes in 3D co-culture conditions were also upregulated in iN cells cultured in 3D without mouse astrocytes (Fig. 1e). Although cells in both 3D and 2D co-cultures at longer time points are electrophysiologically active (Supplementary Fig. 6), GO analysis of significantly up-and down regulated genes (p<0.001) at five weeks revealed more enriched neurological processes present in iN cells co-cultured in 3D versus 2D (Fig. 1g). The co-cultured 3D tissues showed clear transcriptional differences from pure iN 3D cultures and upregulation of genes involved in neurological processes (Supplementary Fig. 5b, c). We therefore used co-cultured 3D tissues for further analysis.
Influence of HA on transcriptome of 3D co-cultured iN cells
Previous neural tissue engineering approaches have incorporated HA, a non-sulfated glycosaminoglycan, into the matrix to mimic biological conditions26,28-31, but the influence of HA has not been characterized by genome-wide profiling before. We incorporated a high molecular weight (∼1.5–1.8×10⁶ Da) HA at two different concentrations in our tissue system (Fig. 2a) and then performed bulk RNA-seq at 5 weeks. The presence of HA resulted in significant differences in the transcriptome of iN cells (Fig. 2b). GSEA and GO analysis showed that cells cultured in the absence of HA were more enriched for neurological processes, whereas the presence of HA lead to enrichment in non-neuronal biological processes (Fig. 2c, Supplementary Fig. 7a, Supplementary Table 4). Given previous reports of increased transcription of some neuronal genes in the presence of HA29, we specifically looked at the expression of genes involved in neuron development, forebrain development, central nervous system development, and channel activity. We find expression of some genes, including DLG4, NEUROD4, and CLU, do show elevated expression in the presence of HA (Supplementary Fig. 7b). To gain a global view of the effect of HA on gene expression, we compared the transcriptome of our engineered tissues with and without HA to the human brain transcriptome of four different subregions (V1C: primary visual cortex (striate cortex, area V1/17); DFC: dorsolateral prefrontal cortex; A1C: primary auditory cortex (core); M1C: primary motor cortex (area M1, area 4)) at four fetal developmental stages (12 post-conceptual weeks (pcw), 16 pcw, 19 pcw and 37 pcw). We found that the presence of HA broadly decreased the correlation between the transcriptome of 3D co-cultured iN cells to the human brain developmental transcriptome, although correlations to 37 pcw did not fit this trend (Fig. 2d).
Figure 2.
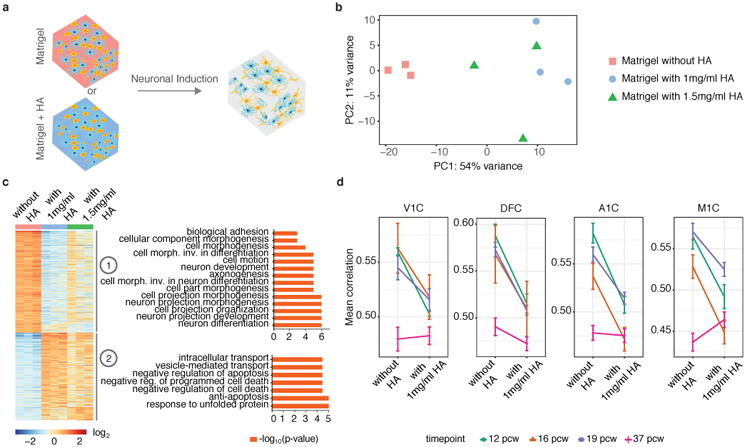
Incorporating HA within Matrigel leads to enriched non-neuronal biological processes in 3D co-cultured human iN cells and decreases gene expression correlation to the human brain developmental transcriptome. (a) Schematic showing human iN cells and mouse astrocytes (at a concentration of 30×106 cells/ml) encapsulated in Matrigel with or without HA trapped within the Matrigel. (b) PCA of gene expression values derived from whole transcriptome sequencing data of 3D co-cultured iN cells in Matrigel with or without HA at week 5 of culture (n=3 for each condition). (c) Gene expression clusters for iN cells co-cultured in Matrigel with or without HA. GO terms for genes in each cluster are shown. Differentially expressed genes with p < 0.01 and log2 (fold change) < -1 or log2 (fold change) > 1 were used. (d) Pearson's correlation between RNA-sequencing data of iN cells with/without HA at 5 weeks and human brain transcriptome data of 4 different subregions at 4 fetal developmental stages from the BrainSpan database (http://www.brainspan.org). V1C: primary visual cortex (striate cortex, area V1/17); DFC: dorsolateral prefrontal cortex; A1C: primary auditory cortex (core);M1C: primary motor cortex (area M1, area 4). pcw: post-conceptual weeks. Bars show mean correlation ± SEM.
Transcriptome profiles can be tuned by using composite hydrogels
Differentiation of cells in 3D tissues and their gene expression profiles can be affected by the mechanical stiffness of the matrix29,32-35, providing an avenue for creation of tunable engineered tissues. As increasing the concentration of Matrigel had minimal effect, we explored how a composite hydrogel (CH) consisting of alginate and Matrigel affected gene expression profiles (Fig. 3a). Alginate networks can be created in the Matrigel through addition of a crosslinker (calcium), the concentration of which can be increased to produce a stiffer matrix33 (Supplementary Fig. 8a). We performed bulk RNA-seq on co-cultured iN cells at week 5 in Matrigel and in CH with increasing amounts of crosslinker. PCA showed clear transcriptomic differences in the CH relative to Matrigel alone, although the global gene expression profiles with intermediate levels of crosslinker were not strongly separated from each other (Fig. 3b). Global differential expression analysis between the transcriptome of iN cells in CHs versus in Matrigel hydrogel showed four distinct clusters of genes with different patterns of expression, containing a number of genes relevant to human neurological disease such as amyotrophic lateral sclerosis (ALS) (e.g., SOD1) and autism spectrum disorder (ASD) (e.g., ADSL) (Fig. 3c, Supplementary Fig. 9, Supplementary Table 5). We also looked at the differential expression of genes involved in forebrain development, axon guidance, and neuron development biological processes (Fig 3c, Supplementary Fig. 8b-d). To analyze the effect of increasing crosslinker concentration in CHs on the gene expression profile of iN cells, we performed differential expression analysis of our RNA-seq data relative to CH with the lowest level of crosslinker, focusing on differentially expressed genes involved in forebrain development, axon guidance, and neuron development biological processes (Fig. 4a, Supplementary Fig. 10). Neuronal transcripts such as DLG4, NFIB, and UNC5C are less expressed in iN cells co-cultured in CH with high levels of crosslinker than in iN cells co-cultured in other CHs (Fig. 4a, Supplementary Fig. 10). Although raising crosslinker concentration in CHs increased expression of ARHGEF12, GSK3B, SLC4A7, and GPM6A, neuronal genes such as ID4 and BAD are more highly expressed in iN cells co-cultured in CHs with intermediate levels of crosslinker than in iN cells co-cultured in CH with low or high levels crosslinker (Fig. 4a, Supplementary Fig. 10).
Figure 3.
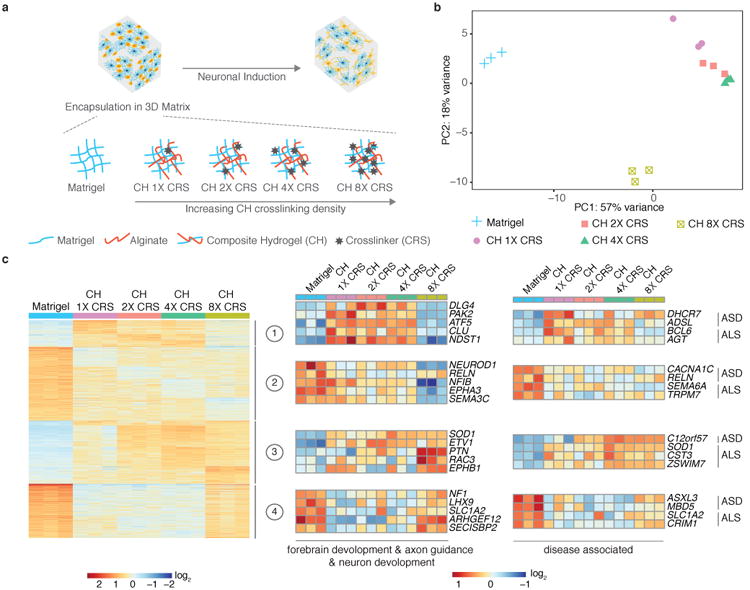
Composite hydrogels (CHs) modulate the expression levels of individual neuronal genes in 3D co-cultured human iN cells. (a) Schematic showing human iN cells and mouse astrocytes (at a concentration of 20×106 cells/ml) encapsulated in Matrigel (4.6 mg/ml) or in a CH of Matrigel (4.6 mg/ml) and alginate (5 mg/ml) with varying amounts of the crosslinker (CRS) CaCl2 (1×: 3.125 mM; 2×: 6.25 mM; 4×: 12.5 mM; 8×: 25 mM). (b) PCA based on whole-transcriptome data of co-cultured iN cells at week 5 of culture (n=3 for each condition). (c) Gene expression clusters for iN cells co-cultured for 5 weeks in Matrigel and CH. Heatmaps show selected neuronal genes in each cluster involved in forebrain development, axon guidance, and neuron development, and genes in each cluster associated with neurological diseases (ASD, autism spectrum disorder; ALS, amyotrophic lateral sclerosis), and their relative expression among 3D hydrogel conditions (see also Supplementary Fig. 8,9). Differential expression was performed between co-cultures in CH and co-culture in Matrigel with p < 0.01 and log2 (fold change) < -1 or log2 (fold change) > 1 used as cut-offs.
Figure 4.
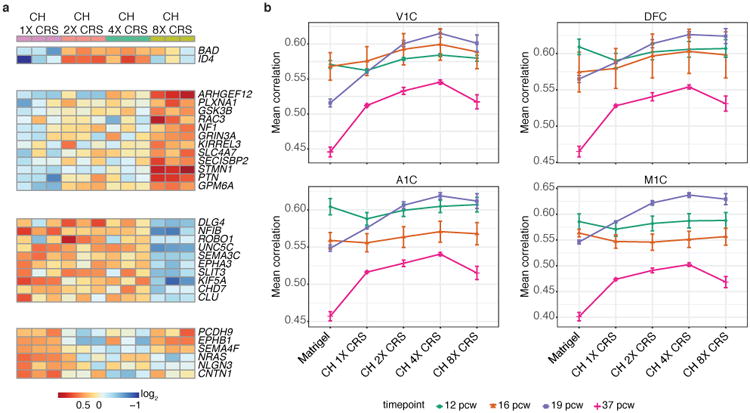
Composite hydrogels (CHs) alter the correlation of gene expression profiles in 3D co-cultured human iN cells to the human brain developmental transcriptome and tune the expression levels of individual neuronal genes with varying amounts of crosslinker (CRS). (a) Relative expression of neuronal genes across increasing amounts of the CRS CaCl2 (1×: 3.125 mM; 2×: 6.25 mM; 4×: 12.5 mM; 8×: 25 mM)in CH (see also Supplementary Fig. 10). Differential expression was performed between co-cultures in CH with 2×, 4× and 8× CRS and co-culture in CH with 1× CRS with p < 0.05 and log2 (fold change) < -0.75 or log2 (fold change) > 0.75 used as cut-offs. (b) Pearson's correlation analysis of RNA-sequencing data of co-cultured human iN cells in Matrigel and CH with varying amounts of CRS compared to human brain transcriptome data of 4 different subregions at 4 fetal developmental stages. V1C: primary visual cortex (striate cortex, area V1/17); DFC: dorsolateral prefrontal cortex; A1C: primary auditory cortex (core); M1C: primary motor cortex (area M1, area 4); pcw: post-conceptual weeks. Bars show mean correlation ± SEM.
We further examined the influence of co-culturing iN cells in Matrigel hydrogel and CHs for five weeks by comparing their transcriptome to a panel of human brain transcriptome samples. For all four subregions tested, we observed a positive trend in the correlation between the transcriptome of co-cultured iN cells to the human brain transcriptome at later developmental time points (19 pcw and 37 pcw) when moving from Matrigel to CH with increasing levels of crosslinker (Fig. 4b). Although there are some exceptions to this trend, in most cases, CH was an improvement over Matrigel alone. At the earliest developmental time point (12 pcw), gene expression of iN cells co-cultured in Matrigel alone correlates more closely with the human data. To determine genes driving increased correlation to human brain transcriptome at later developmental time points (19 pcw and 37 pcw) moving from Matrigel to CH 4× crosslinker, we scored each gene (see Methods) and generated rank lists for each time point (19 pcw and 37 pcw) and brain region (V1C, DFC, A1C and M1C), where high scoring genes have similar expression levels in human brain developmental transcriptome and CH 4× crosslinker condition, and different expression levels in human brain developmental transcriptome and Matrigel condition (Supplementary Table 6-13). GO analysis for high scoring genes (rank score > 3) for each brain region at 19 pcw showed enrichment for neuronal-related processes, while high scoring genes (rank score > 3) for each brain region at 37 pcw demonstrated enrichment for extracellular matrix-related processes (Supplementary Table 6-13). Additionally, we investigated how the presence of HA and increased cell density in CH impacts gene expression profiles. In agreement with our previous findings, adding HA to the CH decreased the correlation between the transcriptome of co-cultured iN cells to the human brain transcriptome, whereas increasing cell density lead to similar trends (Supplementary Fig. 11). We also investigated the effect of varying the volume of CH with or without HA on the gene expression profile of co-cultured iN cells and found that decreasing the volume improved the enrichment of neurological processes while marginally decreasing the correlation to the human brain transcriptome (Supplementary Fig. 12).
To compare broadly across all conditions tested, we performed differential expression analysis of all conditions relative to stem cells. In agreement with our previous results, we find that stem cells are enriched for cell cycle and cell divisions processes and depleted for neurogenesis and neuronal developmental processes. 2D cultures show marginal differences, whereas 3D cultures, with the exception of the HA condition, show the opposite pattern, with enrichment for neuronal-related processes and reduced expression of cell cycle and cell division genes (Supplementary Fig. 13, Supplementary Table 14).
We next compared the transcriptomes of the 3D tissues under all conditions using PCA, which showed transcriptomic differences among various conditions (Fig. 5a). We also compared the mechanical properties of encapsulating hydrogels, which displayed storage modulus differences among various hydrogels used (Fig. 5b, Supplementary Fig. 14). We profiled the mean correlation between the transcriptome of the 3D tissues to the human brain transcriptome (Fig. 5c, Supplementary Fig. 15a). Moving from Matrigel conditions to CH conditions increased the correlation to four subregions at later developmental time points (19 pcw and 37 pcw) while decreasing the difference between the correlations at the early developmental time point (12 pcw) and late developmental time point (37 pcw). Addition of HA to CHs broadly decreased the correlation to four subregions at three developmental time points (12 pcw, 19 pcw and 37 pcw) relative to their corresponding CHs without HA. We observed the highest correlations to four subregions at 19 pcw and 37 pcw developmental time points with CH with 4× crosslinker. In addition, expression levels of a number of genes associated with neurological diseases varied across 3D conditions (Fig. 5d, Supplementary Fig. 15b). These results suggest that 3D tissues could serve as substrates for studying various neurological diseases while providing transcriptomic correlation to the human brain subregions at different developmental time points.
Figure 5.
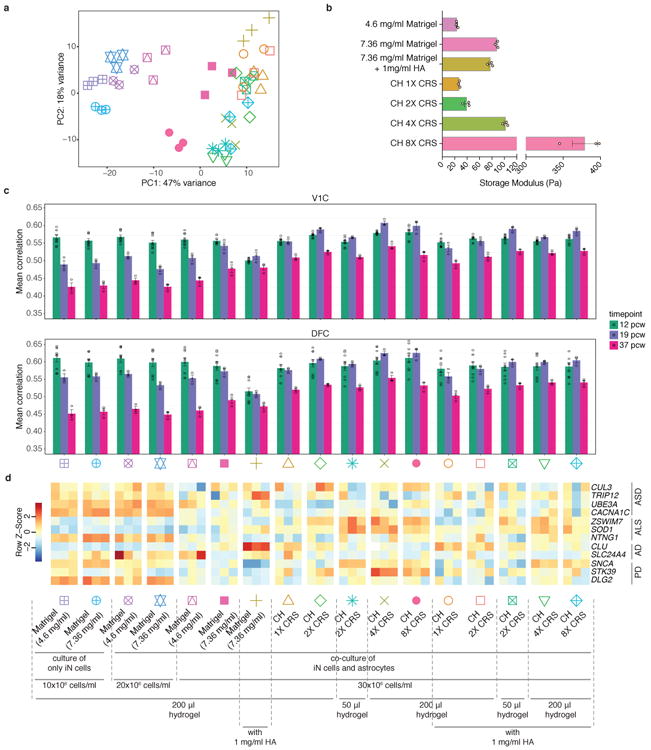
Global comparison of effects of culture conditions on human iN cells and mechanical properties of encapsulating hydrogels. (a) PCA based on whole-transcriptome data of iN cells cultured/co-cultured in a variety of 3D conditions at 5 weeks (symbols are shown at the bottom of the figure) (n=3 for each condition). (b) Storage modulus at 0.5 Hz of different encapsulating hydrogels (n=3 for each condition) (see also Supplementary Fig. 14). Dots represent storage modulus values for each hydrogel condition. Bars show mean ± SEM. (c) Pearson's correlations between RNA-sequencing data of human iN cells cultured/co-cultured in different 3D conditions at 5 weeks and human brain transcriptome data of 2 different subregions at 3 fetal developmental stages. V1C: primary visual cortex (striate cortex, area V1/17); DFC: dorsolateral prefrontal cortex; pcw: post-conceptual weeks (see also Supplementary Fig. 15a). Dots represent correlation values between a 3D condition and a brainspan sample. Each brainspan timepoint-region pair has 1 sample except for 12 pcw, which had 3 samples available for each subregion. Bars show mean correlation ± SEM. (d) Expression levels of selected disease-related genes across various 3D conditions encapsulating human iN cells (ASD, autism spectrum disorder; ALS, amyotrophic lateral sclerosis; AD, Alzheimer's disease; PD, Parkinson's disease) (see also Supplementary Fig. 15b). Color schemes are based on z-score distribution.
Generation of 3D neural tissues with human cell components
To better represent the cell composition of the human brain in our 3D tissues, we developed a method to derive human astrocytic cells directly from hESCs and used this to engineer 3D tissues of co-cultured human iN and astrocytic cells. It was previously reported that overexpression of NGN1/2 in stem cells leads to a transient neural progenitor state before the cells turn into iN cells18, which we hypothesized could be exploited to derive human astrocytic cells. We developed a method to induce formation of astrocytic cells by terminating NGN1/2 overexpression and adding a morphogen, ciliary neurotrophic factor (cntf), at day 2, followed by passaging cells at day 20 to eliminate neuron-like cells (Supplementary Fig. 16a, 17). The majority of the cells thus derived were GFAP+, S100β+, and Vimentin+ at day 35, comparable to mouse astrocytes (Supplementary Fig. 18a). We also analyzed the expression of GFAP, S100B, VIM, and ALDH1L1 by qPCR for cells exposed to derivation protocols without any passaging at days 5, 15, and 30 using undifferentiated hESCs, hESCs only exposed to morphogen, and human primary astrocytes as controls (Supplementary Fig. 16b, Supplementary Fig. 18b). GFAP expression was not detectable in undifferentiated hESCs and in hESCs only exposed to morphogen but when morphogen was added following transcriptional activation, GFAP levels increased. Similarly, expression of S100B, VIM, and ALDH1L1 also gradually increased from day 5 to day 30 during the differentiation protocol (Supplementary Fig. 16b, Supplementary Fig. 18b). The addition of fetal bovine serum (fbs), which is frequently used to derive astrocytes36,37, decreased, but did not abolish, the expression of all genes tested (Supplementary Fig. 18b). However, fbs aided in the passaging steps of these cells for further expansion and was therefore included in the differentiation protocol. We also performed bulk RNA-seq throughout the course of astrocytic cell differentiation and observed that expression levels of a number of astrocyte marker genes gradually increased starting from day 15 and by day 30 reached levels similar to that of human primary astrocytes. Moreover, these expression levels were still high at day 67 and day 114 in conditions combining transcription activation, morphogen, and fbs, whereas undifferentiated hESCs and hESCs only exposed to morphogen lacked high expression levels for the majority of astrocyte marker genes (Fig. 6a, Supplementary Fig. 18c). Consistent with our qPCR results, addition of fbs decreased expression levels of astrocyte marker genes at day 30, whereas expression levels of these marker genes was high at day 67 and day 114 for the same condition (Fig. 6a, Supplementary Fig. 18c). Comparison to single-cell RNA-seq (scRNA-seq) datasets of fetal human cortex38,39 and single-nuclei RNA-seq dataset of adult human brain40 showed similar trends: gradually increasing correlations to astrocytes in adult human brain (Supplementary Fig. 19a) and fetal human cortex (Supplementary Fig. 19c) from day 15 to day 30, particularly for conditions with transcription activation and morphogen. Addition of fbs decreased this trend (Supplementary Fig. 19a). We also analyzed expression levels of marker genes of other cell types, such as radial glia (RG), intermediate progenitor cells (IPC), excitatory neurons, and inhibitory neurons, among the samples throughout the course of astrocytic cell differentiation (Fig. 6a, Supplementary Fig. 18c), and derived transcriptomic correlations between these samples and corresponding cell types in fetal human cortex and adult human brain (Supplementary Fig. 19a-c). Although these comparisons suggest there is some heterogeneity in the populations of cells arising from the astrocytic cell differentiation protocols at the transcriptomic level, immunostaining, qPCR and RNA-seq profiles of marker genes support the identity of these cells as astrocytic, and we therefore co-cultured them in 3D tissues with iN cells for further experiments (Fig. 6b).
Figure 6.
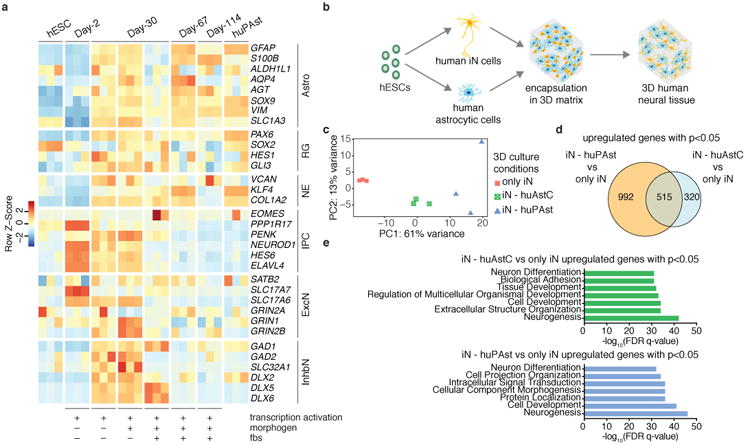
Generation of 3D neural tissues composed of human iN and astrocytic cells. (a) Astrocytic cells were derived from hESCs using a combination of transcription factors used for neural induction (NGN1 and NGN2), a morphogen (cntf, ciliary neurotrophic factor), and fetal bovine serum (fbs). Expression levels of marker genes for a variety of cell types across different conditions of differentiation protocols at different time points. Undifferentiated hESCs were used as a negative control and human primary astrocytes (huPAst) were used as positive control. Astro: Astrocyte marker genes; RG: Radial Glia marker genes; NE: Neuroepithelial cells marker genes; IPC: Intermediate Progenitor Cells marker genes; ExcN: Excitatory Neurons marker genes; InhbN: Inhibitory Neurons marker genes. Color schemes are based on z-score distribution. (n=3 for all conditions). (see also Supplementary Fig. 16, 17, 18, 19a,b,c). (b) Schematic showing generation of 3D human neural tissues composed of human iN cells and human astrocytic cells both directly derived from hESCs. (c) PCA based on whole-transcriptome data of iN cells cultured alone or co-cultured with either human primary astrocytes (iN - huPAst) or human astrocytic cells (iN - huAstC) in Matrigel (7.36 mg/ml) at 5 weeks. (n=3 for each condition, 103 iN cells were sorted from each replicate for each condition)(see also Supplementary Fig. 19d,e). (d) Venn diagram showing number of differentially upregulated genes with p<0.05 for iN - huPAst vs only iN and iN - huAstC vs only iN and overlap of genes at week 5 (adjusted p value is 0.05). (e) GO analysis for differentially upregulated genes with p<0.05 for iN - huPAst vs only iN and iN - huAstC vs only iN. FDR: False Discovery Rate.
To examine the impact of astrocytic cells on iN cells, we compared the gene expression profiles of iN cells co-cultured with differentiated astrocytic cells, human primary astrocytes, or cultured without any astrocytic cells. We performed fluorescent-activated cell sorting (FACS) of iN cells from all cultures at week 5 with minimal cell contamination from astrocytic cells or human primary astrocytes (Supplementary Fig. 19d,e). Gene expression profiling showed that astrocytic cells cause gene expression differences in iN cells close to that caused by human primary astrocytes (Fig. 6c-e), further supporting the astrocytic-like cell fate arising from our differentiation protocol.
To further explore the cell fates and transcriptional profiles of the cells in our tissues, we performed single-cell sequencing on 3D co-cultures of human iN cells with mouse astrocytes and with human astrocytic cells in CH 4× crosslinker at week 5. We performed clustering on scRNA-seq profiles of human cells in both 3D co-cultures and identified 12 clusters (Fig. 7a, Supplementary Fig. 20a), and using various cell type marker genes (Supplementary Fig. 20b-d) we classified 5 main clusters of cell types: neurons, astrocytes, inhibitory neurons, RG, and neuroepithelial (Fig. 7b). iN cells co-cultured with mouse astrocytes contained only neuron cells (only reads aligning to the human genome were analyzed), whereas iN cells co-cultured with human astrocytic cells contained cells from clusters of neurons, astrocytes, inhibitory neurons, RG, and neuroepithelial (Fig. 7c), suggesting that the astrocytic cell differentiation protocol generates other transcriptionally distinct cell types in addition to astrocytes, which was also observed in bulk RNA-seq (Fig. 6a, Supplementary Fig. 18c, Supplementary Fig. 19a-c).
Figure 7.
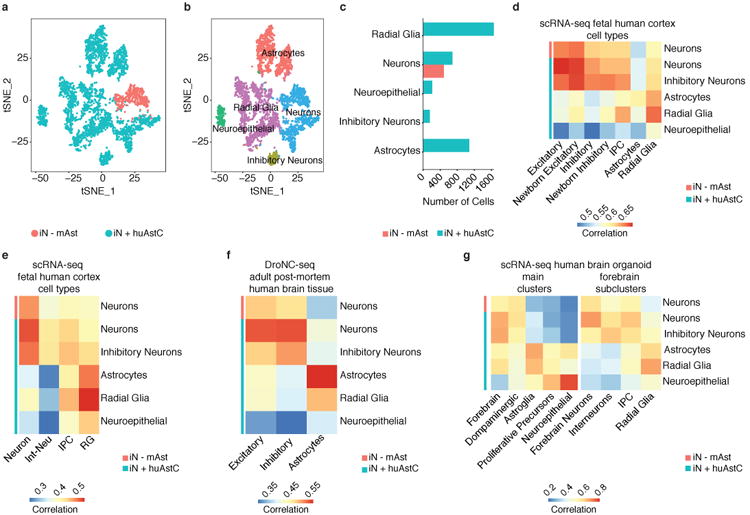
Single-cell RNA sequencing (scRNA-seq) revealed that the cells in 3D neural tissues reflect their counterparts in the human brain and human brain organoids. (a) A t-distributed stochastic embedding (tSNE) plot of scRNA-seq profiles from iN cells co-cultured with mouse astrocytes (iN – mAst) and from co-culture of iN cells and human astrocytic cells (iN + huAstC). Cells are colored by condition membership. Both cultures were performed in CH 4× CRS. (n=3 for each condition). (b) A tSNE plot showing identified clusters of distinct cell types with cells colored by cluster membership and (c) number of cells in each cell type for each condition for scRNA-seq profiles shown in (a)(see also Supplementary Fig. 20). (d) Pearson's correlations between the average gene expression in cell type clusters shown in (b) for each condition (rows) and cell types defined by scRNA-seq in the human fetal cortex39 (columns) (see also Supplementary Fig. 21a,b). Excitatory: Excitatory Neurons; Newborn Excitatory: Newborn Excitatory Neurons; Inhibitory: Inhibitory Neurons; Newborn Inhibitory: Newborn Inhibitory Neurons;IPC: Intermediate Progenitor Cells. (e) Pearson's correlations between the average gene expression in cell type clusters shown in (b) for each condition (rows) and cell types defined by scRNA-seq in the human fetal cortex38 (columns)(see also Supplementary Fig. 20e). Int-Neu: Interneurons; IPC: Intermediate Progenitor Cells; RG: Radial Glia cells. (f) Pearson's correlations between the average gene expression in cell type clusters shown in (b) for each condition (rows) and cell types (Excitatory Neurons, Inhibitory Neurons, and Astrocytes) defined by DroNC-seq (single-nucleus RNA sequencing with droplet technology) in the adult post-mortem human brain tissue40 (columns)(see also Supplementary Fig. 20f). (g) Pearson's correlations between the average gene expression in cell type clusters shown in (b) for each condition (rows) and main clusters and forebrain subclusters defined by scRNA-seq in six-month-old human brain organoids16 (columns) (see also Supplementary Fig. 20g). Forebrain subclusters were derived from forebrain cluster shown in main clusters. IPC: Intermediate Progenitor Cells.
We next examined whether cell type clusters we identified in our 3D tissues transcriptionally resemble their counterparts in human brain by comparing our data to scRNA-seq datasets of fetal human cortex38,39 and single-nuclei RNA-seq datasets of adult human brain40. Although we see some expression of marker genes for IPCs, the transcriptomic correlation of our neurons cluster to neurons in the fetal human cortex is higher than its correlation to IPCs in fetal human cortex (Fig. 7d,e, Supplementary Fig. 20e, Supplementary Fig. 21a,b). Moreover, our neurons cluster showed a high transcriptomic correlation to different types of excitatory neurons in the fetal human cortex data, such as early and late born excitatory neurons in the primary visual cortex (EN-V1-2) and prefrontal cortex (EN-PFC2), and in the adult human brain (Fig. 7d,f, Supplementary Fig. 20f, Supplementary Fig. 21a,b). In addition, the gene expression profile of our RG cluster correlates more with RG cells in the fetal human cortex, such as early RG (RG-early), dividing RG (RG-div2), and medial ganglionic eminence RG (MGE-RG2), which can give rise to inhibitory neurons39 (Fig. 7d,e, Supplementary Fig. 20e, Supplementary Fig. 21a,b). Although our inhibitory neurons cluster transcriptionally correlates with both inhibitory neuron types (such as IN-CTX-MGE1; MGE-derived cortex inhibitory neurons) and excitatory neuron types identified in the fetal human cortex (Fig. 7d, Supplementary Fig. 21a,b), in the adult human brain, it correlates most highly with inhibitory neurons (Fig. 7f, Supplementary Fig. 20f). Similarly, although our astrocyte cluster correlates more highly with RG cells than with astrocytes in the fetal human cortex (Fig. 7d, Supplementary Fig. 21a,b), its transcriptome correlation with astrocytes in the adult human brain is higher than its correlation to other cell types (Fig. 7f, Supplementary Fig. 20f). This trend is also observed in comparisons between scRNA-seq data from six-month-old human brain organoids16 and scRNA-seq data from the fetal human cortex39 (Supplementary Fig. 21c). To explore this further, we performed differential expression analysis between astrocytes and RG cells in the scRNA-seq dataset of the human fetal cortex39 and identified the top 9 astrocyte-specific genes and top 9 RG-specific genes based on log fold change (Supplementary Fig. 21d). The average expression levels of these genes in the astrocyte and RG clusters in our 3D tissue and in data from the six-month-old human brain organoids varies between these cell types (Supplementary Fig. 21e,f), indicating that in both our 3D tissues and the human brain organoids, astrocytic-like cells are present, but they are not transcriptionally homogenous. Taken together, these results demonstrated that cell types in our 3D tissue transcriptionally resemble their analogues in fetal human cortex and adult human brain. Finally, comparison between scRNA-seq profiles of our 3D tissues and scRNA-seq dataset of six-month-old human brain organoids16 revealed that our cell type clusters show transcriptome correlation with their counterparts in six-month-old human brain organoids (Fig. 7g, Supplementary Fig. 20g).
As a proof-of-concept, we tested the feasibility of performing CRISPR-mediated genome editing in our engineered 3D neural tissues in a disease context. Using Cpf1-mediated genome editing via AAV-based gene delivery41,42, we targeted SOD1, TARDBP and TBK1, genes implicated in ALS and frontotemporal dementia (FTD)43-46. We identified indels in three independently targeted loci and found ∼5%, ∼14%, and ∼6% indel formation in SOD1, TARDBP, and TBK1, respectively (see Supplementary Text, Supplementary Fig. 22,23). These results show that our 3D human neural tissue system can be combined with genome-engineering and gene-delivery tools to perturb genes implicated in neurodegenerative diseases.
Discussion
3D neural tissues have the potential to be tractable models for studying the human brain and neurological disorders, but to achieve this potential, they must closely reflect the cell composition, ECM, and gene expression profiles of the human brain. Here we analyzed how the transcriptome of iN cells in 3D tissues relates to the human brain transcriptome and is affected by a number of tissue engineering variables. Furthermore, we developed an approach to generate co-cultured iN and astrocytic cells derived from hESCs in a 3D matrix that could be tuned to reflect different transcriptomic states of the human developing brain transcriptome, which will be helpful for the rapid generation of complex neurological disease models.
To gain a global view of the brain-like properties of these engineered tissues, we compared the transcriptomes of cells cultured in 3D versus 2D and found more enriched neuronal biological processes in iN cells cultured in 3D Matrigel than 2D cultured cells (Fig. 1f), which was not affected by batch-to-batch variation in Matrigel (Supplementary Fig. 3a-c). In addition, transcriptome profiling showed enriched apoptotic and oxidative stress biological processes in 2D cultures compared to 3D cultures and 3D cultures enabled electrophysiological measurements (Supplementary Fig. 2,4), both suggesting that iN cells in 3D cultures were healthier than cells in 2D cultures, although we did not directly test cell viability. In addition, we co-cultured iN cells with mouse astrocytes both in 3D and on 2D. Although iN cells in both co-cultures were electrophysiologically active at later timepoints, the transcriptome of 3D co-cultured iN cells was more enriched in neuronal biologically processes than that of iN cells on 2D, indicating 3D tissues offer a closer approximation to the biology than 2D tissues. Varying cell seeding densities or independent components of the encapsulating matrix (e.g., laminin, collagens, or synthetic hydrogels) may lead to different characteristics of the iN cells, avenues which could be explored in future functional studies.
Engineered neural tissues can be made more brain-like by adding other ECM components, such as HA, which has been shown to promote better replication of the brain microenvironment29-31. Under the conditions we tested, however, incorporation of HA in our 3D Matrigel co-cultures of iN cells did not strongly improve the correlation with the transcriptome of the human developing brain, although some individual neuronal transcripts as well as genes associated with neurological diseases were upregulated (Supplementary Fig. 7b and Fig. 5d). We chose to use a high-molecular weight HA and incorporated it in a high concentration of Matrigel (which showed a storage modulus closed to Matrigel without HA due to the uncrosslinked state of HA in Matrigel) to minimize its diffusion from the hydrogel structures while maintaining its natural state26,28. However, other variables (such as chemical modifications, concentration, and the source of HA47,48) or shorter culture times (such as 1 week) that were not tested may have a greater impact on gene expression. Given that high-molecular weight HA is thought to inhibit remyelination following central nervous system (CNS) injury26,49, introducing HA into hydrogels could impede expression of genes involved in neuronal development.
Matrix stiffness in engineered tissues can also impact cellular properties and can be increased in a pure Matrigel hydrogel simply by increasing the concentration of Matrigel33,50. Alternatively, in a CH, stiffness can be increased by increasing the amount of crosslinker while holding the concentration of alginate and Matrigel constant33. We therefore investigated whether developing 3D co-cultures of iN cells within CHs of Matrigel and alginate improved the transcriptomic correlation to human brain samples. Alginate is a naturally occurred polysaccharide, composed of mannuronic acid and guluronic acid with no cell adhesion ligands, that can be crosslinked to form a network within Matrigel through addition of divalent cations such as calcium (Ca+2)33. We demonstrated that increasing the crosslinking of the alginate network in CHs (which lead to an increase in storage modulus) can tune the correlation of the transcriptome of 3D co-cultured iN cells to the transcriptome of particular sub-regions of the human brain at specific developmental stages. Furthermore, modulating the amount of crosslinker and/or the volume of the CH led to gene expression changes in specific neuronal transcripts, including DLG4, GRIN3A, and SOD1 as well as changes in expression levels of genes associated with neurological diseases (Fig. 3c and Fig. 5d). As HA was previously integrated in crosslinked alginate hydrogels51, we incorporated HA in CHs of Matrigel and alginate and, in agreement with our other results, found it had little effect. It will be informative to analyze the effects of changing the hydrogel volume or removing the Matrigel on cellular state to better understand how these parameters impact gene expression.
To better model cell composition in human brain within our 3D tissues, we first developed a method to derive human astrocytic cells directly from hESCs. We exploited a previously reported transient neural progenitor state of stem cells induced by overexpression of neurogenins18 to differentiate cells towards an astrocytic phenotype. Immunostaining, qPCR, and bulk RNA-seq showed that the derived astrocytic cells express astrocyte markers and that this expression increases over time. By day 15, we could detect the expression of marker genes for astrocytic cells, inhibitory neurons, and RG, offering the potential to rapidly create 3D tissues with controlled composition of these cell types by generating reporter cell lines using these markers. Using single-cell RNA sequencing, we evaluated the gene expression profiles of the cells arising from our differentiation protocols and compared these to published transcriptional datasets of fetal and adult human brain as well as human brain organoids. We found that the cells present in our 3D co-cultured tissues broadly reflect their counterparts in the human brain, and we observed interesting similarities between the gene expression profiles in our system and in human brain organoids as they relate to the human brain data. Overall, these results suggest that we were able to generate relevant cell types, but further functional studies are required to fully characterize these astrocytic cells and inhibitory neurons in our system and it will be informative to test additional differentiation protocols (such as use of other transcription factors or small molecules) to further expand the cells types that can be studied in this system.
Our method of deriving both iN and astrocytic cells from the same pool of hESCs allows for the rapid creation of engineered tissues with an isogenic background. These 3D tissues composed of iN cells (at day 35) and astrocytic cells (at day 118) exhibit transcriptional profiles that correlate with relevant cell types in the human brain as well as with six-month-old human brain organoids, suggesting this system may be a faster alternative to organoids. To show the potential for studying the genetics of neurodegenerative diseases in our 3D neural tissues, we perturbed three genes implicated in ALS and FTD using Cpf152 directly in iN cells, and observed at least 5% indel formation rates for each gene. Directly injecting AAV mixtures within 3D tissues instead of mixing with culture medium could be tested in future studies to improve indel rates. This approach could be extended by independently targeting astrocytic cells within 3D tissues by using the GFAP promoter in gene editing constructs.
Despite the potential for this approach as a scalable method for interrogating the genetics of brain disorders, there are a number of limitations and challenges. All 3D tissue models are limited in their ability to recapitulate complex environmental features, such as the interplay between the immune system and the central nervous system, vasculature and the signals that are distributed through this network, and aging. Nevertheless, as the technology and our understanding of the brain advances, it should be possible to develop increasingly complex tissues that contain multiple cell types that develop over time.
Outlook
By varying the parameters of the 3D neural matrix (e.g., adjusting the composition), we have shown that our engineered tissues can be tuned to have different expression levels of neuronal transcripts as well as genes associated with neurological diseases and to reflect specific stages of the human brain developmental transcriptome. Single-cell sequencing revealed that our 3D tissues contain cell types that transcriptionally resemble their analogues in the human brain, further supporting the utility of this system. In combination with genome editing tools, which can be used to precisely disrupt specific genes in a cell-type specific manner, these tissues offer an adaptable and genetically tractable system for studying neurological disorders. In particular, the ability to rapidly model polygenic diseases such as ALS, Alzheimer's and Parkinson's, in a controllable environment will be particularly beneficial to unraveling these complex diseases. This may be achieved by either independently targeting gene function in neuronal and astrocytic cells or developing 3D tissues directly from hESCs carrying the desired mutations and utilizing single cell53,54 or single nuclei40 RNA-seq methodologies in combination with functional studies. The analysis described in this study as well as continued interrogation of 3D culture systems will further aid the development of more effective models for brain diseases.
Methods
Human embryonic stem cell culture
Human Embryonic Stem Cell (hESC) line (HUES66) was obtained from the Harvard Stem Cell Institute. Stem cells were cultured in 10 cm tissue culture dishes coated with 5 ml of geltrex (Thermo-Fisher Scientific) diluted in DMEM (Thermo-Fisher Scientific) with 1:100 ratio for 30 min at 37 °C. Stem cell culture medium contained mTeSR (Stemcell Technologies) with provided supplement and normocin (InvivoGen). Stem cells were passaged by detaching with accutase (Stemcell Technologies) diluted in DPBS (Thermo-Fisher Scientific) at 1:3. After each splitting of stem cells, 10μM Rho-associated kinase (ROCK) inhibitor (EMD Millipore) was added in medium of re-plated cells. Stem cell culture medium was replaced daily.
Generation of iN cells from hESCs
To produce iN cells, hESCs were infected with lentiviral vectors. These vectors provided constitutive expression of rtTA3 driven by human EF1α promoter, and doxycycline inducible expression of human NGN1 and NGN2 driven by TRE promoter. The Puromycin resistant gene was linked with NGN1 and NGN2 by a P2A linker to enable selection. Lentiviral infected hESCs were plated at ∼15×103 cells/cm2 in 15 cm tissue culture dishes pre-coated with 10 ml of Growth Factor Reduced (GFR) Matrigel (Corning) (at 8.5 mg/ml - 10 mg/ml concentration) diluted in DMEM at 1:100 for 30 min at 37 °C. Day 0 medium of plated stem cells contained stem cell culture medium and 2 μg/ml doxycycline (Sigma) to initiate expression of NGN1/2. Whole medium at Day 1 was replaced by a medium containing 3 volumes of stem cell culture medium and 1 volume of neural culture medium along with 2 μg/ml doxycycline and 1 μg/ml puromycin. Neural culture medium was prepared by mixing 500 ml of neurobasal medium (Thermo-Fisher Scientific), 10 ml of B27 supplement (Thermo-Fisher Scientific), 5 ml of penicillin-streptomycin (Thermo-Fisher Scientific), and 5 ml of Glutamax (Thermo-Fisher Scientific). On Day 2, whole medium replaced by a medium made of 1:1 mixture of stem cell culture medium and neural culture medium, and 2 μg/ml doxycycline and 2 μg/ml puromycin were added into culture medium. On Day 3, iN cells were ready for detachment and further culture on 2D or in 3D conditions.
Primary mouse glia culture
Mouse glial cells were isolated from cortex of newborn C57 mice in procedures carried out in accordance with Animal Care and Use regulations at the Broad Institute with protocol (0008-06-14) approved by the Broad Institute's Institutional Animal Care and Use Committee (IACUC). Cortices of newborn mice were dissected and digested by using papain for 30 min and applying agitation. Dissociated cells were plated in tissue culture dishes in DMEM supplemented with 10% FBS. Glial cells were passaged by trypsinizing and replating at lower density more than eight times to remove potential low amounts of mouse neurons in culture before their use in 2D and 3D co-cultures with iN cells.
2D cultures and co-cultures of iN cells
For 2D cultures of iN cells, 5 glass coverslips (Corning-Biocoat) were inserted per well of a 6-well plate. Then, each well with coverslips was coated with 1.5 ml of GFR Matrigel diluted in DMEM at 1:100 for 30 min at 37 °C. The coating solution was aspirated from each well before cell seeding. iN cells generated within 3 days as described were detached from culture plates with accutase diluted in DPBS at 1:3. iN cells were seeded on each pre-coated well with coverslips at 50×103 cells/cm2 in 3 ml medium made of 1:3 mixture of stem cell culture medium and neural culture medium (hereafter 1:3 culture medium) with 2 μg/ml doxycycline. One day later, whole medium of each well was replaced with 3 ml neural culture medium with 2 μg/ml doxycycline. On the second day of seeding, 1 ml neural culture medium with doxycycline and 1-β-D-Arabinofuranosylcytosine (Ara-C) was added in each well, keeping the final concentration of doxycycline in each well at 2 μg/ml and final concentration of Ara-C in each well at 0.5-1 μM. One third of the whole culture medium in each well was replaced every 3-4 days. For 2D co-cultures of iN cells with mouse glia, 6-well plates with coverslips were prepared as described above. Mouse astrocytes were detached from culture plates by using trypsin. iN cells and mouse glia were mixed 1:1 and seeded on each pre-coated well with coverslips at 100×103 cells/cm2 in 3 ml 1:3 culture medium with 2 μg/ml doxycycline. For the rest of the culture, the protocol was as described above, except the final concentration of Ara-C in each well was at 2-5 μM, which was added with the neural culture medium in each well on the second day of seeding.
3D cultures and co-cultures of iN cells
Three-dimensional cultures and co-cultures of iN cells were performed by encapsulating them within hydrogels. These hydrogels were made of pure GFR Matrigel or GFR Matrigel and hyaluronic acid (HA) or GFR Matrigel and alginate or GFR Matrigel, alginate and HA. Before encapsulation experiments, the following preparations were done: GFR Matrigel was kept on ice, sodium alginate (PRONOVA UP VLVG, NovaMatrix) was first reconstituted at 4% (40 mg/ml) in a medium made of 1:3 mixture of mTeSR and neurobasal medium (without supplements) with 150 mM sodium chloride (NaCl) (Sigma) and this solution was then incubated for 6 hours at 37 °C for further dissolution of alginate. This alginate stock solution was passed through a 0.22 μm filter (EMD Millipore) and kept on ice. Calcium chloride (CaCl2) solution (1M in water, Sigma) was diluted in a medium made of 1:3 mixture of mTeSR and neurobasal medium (without supplements) at concentrations of 25 mM, 12.5 mM, 6.25 mM and 3.125 mM. These CaCl2 solutions were individually passed through 0.22 μm filters and kept on ice. HA sodium salt (Sigma, #53747) was dissolved at 1% (10 mg/ml) concentration under sterile conditions in a medium made of 1:3 mixture of mTeSR and neurobasal medium (without supplements) and then incubated for 6 hours at 37 °C for further dissolution of HA and frequently vortexed. This HA stock solution was kept on ice. A sheet of Parafilm and a microcentrifuge tube rack were sprayed with 70 % Ethanol and kept in a biohood under UV light for 30 min. Parafilm dimples were formed by placing a sheet of Parafilm on the microcentrifuge tube rack and pressing gently on Parafilm. Serum-free DMEM was kept on ice.
Three-dimensional cultures of iN cells were performed by encapsulating them within 200 μl hydrogels of Matrigel at 10×106 cells/ml. iN cells generated within 3 days were detached as previously described and filtered through a 40 μm cell strainer (Corning), and pelleted at desired amount. The final concentration of encapsulating Matrigel was either 4.6 mg/ml or 7.36 mg/ml. As the Matrigel stock concentration varied from batch to batch (8.5 mg/ml -10 mg/ml), different amounts of 1:3 culture medium were used to adjust the final concentration of Matrigel in hydrogels and kept on ice until used. A desired amount of Matrigel stock was placed in a 1.5 ml centrifuge tube and kept on ice. A pipette tip was chilled by pipetting cold serum-free DMEM. This pipette tip was then used to resuspend iN cell pellet in pre-chilled 1:3 culture medium. These resuspended iN cells were then mixed with the Matrigel in the 1.5 ml centrifuge tube. The final concentration of iN cells in this cell-gel solution was 10×106 cells/ml and the final concentration of Matrigel in this solution was either 4.6 mg/ml or 7.36 mg/ml. The cell-gel solution was vortexed for 10 s and then kept on ice while chilling a pipette tip by pipetting cold serum-free DMEM. This pipette tip was then used to place 200 μl droplets of cell-gel solution one by one on Parafilm dimples. These droplets were then placed at 37 °C for 1 hour to allow gelling of Matrigel. Each droplet was subsequently placed in one well of a 6-well plate by gently pipetting from Parafilm with 1 ml of 1:3 culture medium with 6 μg/ml doxycycline. After placing all droplets, 2 ml of same culture medium was added to each well. At day-1, whole medium of each well was substituted with 3 ml neural culture medium containing 6 μg/ml doxycycline. On the second day of encapsulation, 1 ml neural culture medium with doxycycline and Ara-C was added in each well by keeping final concentration of doxycycline in each well at 6 μg/ml and final concentration of Ara-C in each well at 0.5-1μM. One third of the whole culture medium in each well was renewed every 3-4 days.
3D co-cultures of iN cells with mouse astrocytes were carried out by encapsulating them within 200 μl hydrogels made of either Matrigel (either 4.6 mg/ml or 7.36 mg/ml) or Matrigel and HA (7.36 mg/ml Matrigel and 1 mg/ml or 1.5 mg/ml final HA concentration) or composite hydrogels (CH) (4.6 mg/ml Matrigel and 0.5% final concentration of Alginate, with and without HA). iN cells were prepared as described above. Mouse astrocytes were detached by trypsinizing and filtered through a 40 μm cell strainer, and pelleted at desired amount. All hydrogels contained 1:1 mixture of iN cells and mouse astrocytes. For pure Matrigel hydrogels, the cell concentration was either 20×106 cells/ml or 30×106 cells/ml. For hydrogels of Matrigel and HA, the cell concentration was 30×106 cells/ml Different amounts of 1:3 culture medium were used to adjust the final concentration of Matrigel and HA in hydrogels and kept on ice until use. Tissues were prepared as above with the following additions: For hydrogels of Matrigel and HA, a desired volume from 1% HA stock was pipetted in Matrigel in the tube to a final concentration of HA at either 1 mg/ml or 1.5 mg/ml. Cell suspensions were then mixed either with pure Matrigel or with mixture of Matrigel and HA in the centrifuge tube. For CH, the cell concentration within hydrogels was either 20×106 cells/ml or 30×106 cells/ml. For CH containing HA, the cell concentration was 30×106 cells/ml. Calcium chloride was used to crosslink Alginate in CH. Each 200 μl CH was made by mixing 150 μl cell-gel solution with 50 μl calcium chloride solution on a Parafilm dimple. Cell-gel solution was prepared accordingly so that in each 200 μl CH the final concentration of Matrigel was 4.6 mg/ml and that of Alginate was 0.5%. For each 200 μl CH containing HA, the final HA concentration was either 1 mg/ml or 1.5 mg/ml. To prepare gel solutions, a desired volume of Matrigel was placed within a centrifuge tube with a pre-chilled pipette tip and then the desired volume of 4% Alginate was mixed with Matrigel in the centrifuge tube with a pre-chilled pipette tip, vortexed for 10 s, and kept on ice. For CHs containing HA, a desired volume of 10 mg/ml HA was mixed with Matrigel and Alginate solution, vortexed for 10 s, and kept on ice. A volume of 1:3 culture medium required to adjust the concentration of components in gel solution was used to resuspend 1:1 mixture of iN cells and mouse astrocytes. These resuspended cells were then mixed with gel solutions and vortexed for 10 s. Each 200 μl droplet of CH was made by first placing 50 μl calcium chloride solution (at concentrations of 25 mM, 12.5 mM, 6.25 mM, and 3.125 mM) on a Parafilm dimple and then rapidly mixing 150 μl cell-gel solution with this calcium chloride solution on a Parafilm dimple with a pre-chilled pipette tip without generating bubbles. 50 μl droplets of CHs were generated in the same manner by adjusting volumes. To allow Matrigel gelling, all droplets were then placed at 37 °C for 1 hour. After forming hydrogels, the same protocol as previously described was followed for the remaining of the experiment, except the final concentration of Ara-C in each well was at 2-5 μM, which was added with the neural culture medium in each well on the second day of encapsulation.
3D and 2D cultures of iN cells with two different batches of Matrigel
For 2D cultures of iN cells, independent wells of 6-well plate with coverslips were coated with two different batches of Matrigel and iN cells were seeded on each pre-coated well with coverslips at 50×103 cells/cm2. Three-dimensional cultures of iN cells were performed by encapsulating them within independent 200 μl hydrogels of 4.6 mg/ml Matrigel from two different batches at 10×106 cells/ml. Protocols for 3D and 2D cultures of iN cells described above were followed afterwards.
Rheolological measurements
Hydrogels at 100 μl volume without cells were formed as described above. Mechanical properties of the hydrogels were characterized using TA Instruments AR 2000 rheometer fitted with a Peltier stage set to 37 °C. Oscillatory frequency sweep measurements were conducted at a 0.5% strain amplitude. All measurements were performed using a 8 mm 4° cone and 200 μm gap size for triplacate hydrogels, and analyzed using TA instruments TRIOS software.
Derivation of human astrocytic cells
Each well of 6-well plates was coated with 1.5 ml of Growth Factor Reduced Matrigel diluted in DMEM with 1:100 ratio for 30 min at 37 °C. Lentivirus infected hESCs containing inducible expression of NGN2 and NGN1 were plated at ∼15×103 cells/cm2 in pre-coated wells. Expansion medium was prepared by mixing 500 ml of DMEM, 10 ml of N2 supplement (Thermo-Fisher Scientific), 5 ml of penicillin-streptomycin, and 5 ml of Glutamax. Day 0 medium of plated stem cells contained stem cell culture medium (as previously described), 2 μg/ml doxycycline to initiate expression of NGN2 and NGN1, and 10 μM ROCK inhibitor. At day 1, whole medium was replaced by a medium containing 3 volumes of stem cell culture medium and 1 volume of expansion medium along with 2 μg/ml doxycycline and 2 μg/ml puromycin. At day 2, for the sample termed “unconditioned” (Supplementary Fig. 16a), whole medium was replaced by expansion medium, and for the sample termed “morphogen”, whole medium was replaced by expansion medium with 15 ng/ml cntf. At day 4, half of the medium in each well for both conditions was renewed with their corresponding culture medium. At day 5, for “unconditioned”, one third of the whole culture medium was replaced with expansion medium, for “morphogen”, one third of the whole culture medium was replaced with expansion medium with 15 ng/ml cntf, and for the sample termed “morphogen + fbs”, one third of the whole culture medium was replaced with expansion medium with 1% fbs and 15 ng/ml cntf. One third of the whole culture medium of all conditions was replaced with their corresponding medium every 4-5 days.
At day 20, cells in all conditions were passaged and seeded back in wells pre-coated as described before. “Morphogen + fbs” cells were expanded for further use in generating 3D human neural tissues by co-culturing them with iN cells in a matrix. “Morphogen + fbs” cells at day 35 were used for immunostainings.
For control experiments, lentivirus infected hESCs were seeded as previously described and treated by using the “morphogen” protocol for 30 days without including doxycycline and puromycin application. In addition, lentivirus infected hESCs were cultured in stem cell culture medium without any differentiation protocol and used as a control. Human primary astrocytes (ScienCell) were cultured in expansion medium with 2% fbs and used as a control. For RT-qPCR experiments for astrocytic cells, the protocol for all conditions was continued without passaging cells, except human primary astrocytes, which were in passage 3. For RNA-seq experiments for astrocytic cells, the protocol for all conditions was continued without passaging cells, except for “morphogen + fbs” condition, samples at day 67 were in passage 3 and samples at day 114 were in passage 6, and human primary astrocytes were in passage 3. RNA lysis buffer (Zymo Research) was used to lyse cells in each well for all conditions.
3D co-cultures of iN cells with human astrocytic cells and with human primary astrocytes
Astrocytic cells derived following the protocol termed “moprhogen + fbs” cultured until day 52 (passage 5) and day 61 (passage 7) were detached from culture plates with accutase and pooled for 3D cultures and co-cultures with iN cells. For 3D co-cultures of iN cells with human astrocytic cells, a 1:1 mixture at a final cell concentration of 20×106cells/ml were encapsulated in 100 μl hydrogels (7.36 mg/ml Matrigel). 3D co-cultures of iN cells with human primary astrocytes (passage 5) were carried out by encapsulating their 1:1 mixture (at a final cell concentration of 20×106 cells/ml) within 100 μl hydrogels (7.36 mg/ml Matrigel). 3D culture of iN cells alone and 3D culture of human astrocytic cells alone were performed by encapsulating them (at a final cell concentration of 10×106 cells/ml) within independent 100 μl hydrogels (7.36 mg/ml Matrigel). After encapsulations, culture protocols as described above were followed, with the following changes: the culture mediums did not contain doxycycline and the final concentration of Ara-C in each culture well was 1 μM. 6 days after forming 3D cultures and co-cultures, 3D cultures and co-cultures of iN cells were infected with AAV U6-hSyn1-mCherry-KASH-hGH vectors encoding non-targeting sgRNA to enable fluorescent-activated cell sorting (FACS) of iN cells. At week 5 of culture, 3D cultures and co-cultures of iN cells were disassociated by first individually immersing 3D tissues in accutase, incubating at 37 °C for ∼8 min, and then the 3D matrix was disrupted by pipetting in accutase. Each disassociated tissue was resuspended in neural culture medium and centrifuged at 200g for 5 min. Each pellet was then resuspended in DPBS and passed through a 30 μm filter (Sysmex) to remove potential cell clumps and hydrogel residues before cell sorting. Cell suspensions were sorted using a Beckman Coulter MoFlo Astrios EQ cell sorter (Broad Institute Flow Cytometry Core). Each 3D culture/co-culture had triplicates and a population of 1×10³ mCherry+ iN cells was collected from each disassociated 3D tissue into DNA/RNA Shield (Zymo Research). 3D cultures of human astrocytic cells were individually immersed in DNA/RNA Shield without cell sorting.
RNA isolation
For 2D cultures of iN cells and their 2D co-cultures with mouse astrocytes and for 2D cultures of only mouse astrocytes, 2D cultured hESCs, day-3 iN cells, 300 μl of RNA lysis buffer (Zymo Research) was used to lyse cells in each well of a 6-well plate. Each lysate was then transferred to a 1.5 ml centrifuge tube. For 3D cultures of iN cells and their 3D co-cultures with mouse astrocytes, each hydrogel was transferred with an RNase-free spatula (Corning) from a culture well to a 1.5 ml centrifuge tube and immersed in 300 μl of RNA lysis buffer. All centrifuge tubes were placed on dry ice for rapid freezing and then stored at -80 °C. Total RNA isolation was performed using a Zymo RNA QuickPrep Mini kit (Zymo Research) following the manufacturer's protocol with the following modifications. 3D culture hydrogels were homogenized using a hand-held pestle (Fisher Scientific) in a 1.5 ml Eppendorf tube containing 300 μl lysis buffer with a few strikes to break down the large pieces. Lysates were transferred to a ZR BashingBead Lysis Tube (Zymo Research) and bead bashed on a D2400 Homogenizer (BenchMarker) for 45 seconds at full speed 7. After 1 minute of centrifugation at 14,000g, supernatant was recovered and used for the standard RNA isolation procedure. For CH 3D cultures, another purification step was performed on the eluted RNA samples using 1.8× volumes of RNAClean SPRI beads (Agencourt). For conditions involved in derivation of astrocytic cells, conditions in 3D cultures/co-cultures of iN cells with human astrocytic cells and with human primary astrocytes, and 3D cultures of human astrocytic cells, a Zymo RNA QuickPrep Mini kit (Zymo Research) was used to isolate the total RNA by following the manufacturer's recommended protocol.
RNA-Seq
RNA-Seq libraries were prepared following the Smart-seq2 protocol55 with the following modifications: 1 ng of total RNA was used in place of a single cell lysate. For 2D and 3D cultures of iN cells, and 3D co-cultures of iN cells with mouse astrocytes, 2D cultured hESCs, day-3 iN cells, 12 cycles of PCR were used to amplify the cDNA, and 0.25 ng amplified cDNA was used in each NexteraXT (Illumina) reaction. For 2D co-cultures of iN cells with mouse astrocytes, 2D cultures of mouse astrocytes, samples in astrocytic cell differentiation protocols, iN cells 3D co-cultured with differentiated astrocytic cells and with human primary astrocytes, and iN cells 3D cultured without any astrocytic cells, 12 cycles of PCR were used to amplify the cDNA, and 0.075 ng amplified cDNA was used in each NexteraXT (Illumina) reaction. For samples in matrigel batch test, 15 cycles of PCR were used to amplify the cDNA, and 0.075 ng amplified cDNA was used in each NexteraXT (Illumina) reaction. Pooled libraries were sequenced on a NextSeq 500 instrument (Illumina) with 50 bases for read1 and 25 bases for read2.
Transcriptome analyses
RSEM v1.356 was run on fastq files of cultures of iN cells and their co-cultures with mouse astrocytes using a joint human (hg19 annotation from UCSC) and mouse (mm10 annotation from UCSC) transcriptome and STAR v2.5.257, with the options --star --star-gzipped-read-file --paired-end. The count data output by RSEM was used to quantify the percentage mouse reads vs percentage human reads. The STAR bams output by RSEM were used to filter the original fastq files with seqtk (https://github.com/lh3/seqtk). In particular, all reads that mapped to the mouse transcriptome were removed, as were all unmapped reads. These filtered fastq files were run through RSEM with default parameters using human hg19 UCSC genome to estimate gene expression values, which were then used to create an un-normalized count matrix. This count matrix was used for further analysis involving co-culture conditions of iN cells with mouse astrocytes. For data analysis between culture conditions of iN cells without mouse astrocytes, RSEM with default parameters was run on fastq files of cultures of iN cells using human hg19 UCSC genome to estimate gene expression values, used to form an un-normalized count matrix. Similarly, RSEM with default parameters was run on sequencing reads of conditions involved in derivation of astrocytic cells using human hg19 UCSC genome to estimate gene expression values, which was then used to generate an un-normalized count matrix.
Further bulk RNA-seq data analysis was performed using DESeq2 package 58 and R v3.2. Following DESeq2 protocols 58, significant genes in differential expression analysis were identified by using DESeq2's own two-sided statistical test and taking the False Discovery Rate (FDR) adjusted p-value cutoff of 0.05 for all analyses in this study. As previously described58, DESeq2 relies on the negative binomial distribution and utilizes Benjamini-Hochberg adjustment. Principal component analysis (PCA) was carried out using DESeq2 package and R. Database for Annotation, Visualization and Integrated Discovery v6.7 and v6.8 and the Molecular Signatures Database (MSigDB)were used to reveal enriched biological processes for differentially expressed genes (either upregulated or downregulated in one condition). Gene Set Enrichment Analysis (GSEA) was performed using GSEA software59 v2.2.3 using default parameters to find enriched biological processes in Gene Ontology (GO) and enriched Kyoto Encyclopedia of Genes and Genomes (KEGG) pathways in compared conditions. The k-means function in R was used to cluster groups of genes. Groups were generated by first performing differential expression analysis between a reference condition and other conditions and then filtering resulting differentially expressed genes by setting log2(fold change) and p-value cut-offs.
To compare the transcriptomes of 3D cultures of iN cells to the human brain developmental transcriptome, gene-level expression values were obtained from the BrainSpan database (http://www.brainspan.org/static/download.html). To our knowledge, raw data for the BrainSpan transcriptome profiling dataset, in the form of fastq or BAM files are not available for download. Therefore, in an effort to minimize technical differences between the experimental and reference datasets, RNA-seq data of 3D cultures of iN cells was reprocessed to more closely match that of BrainSpan following the alignment and gene quantification protocol described. Briefly, filtered fastq files of RNA-seq samples were realigned with Tophat v.2.0.14, using Bowtie v.0.12.9 and samtools v.0.1.9. To further match the BrainSpan dataset, the data were processed using Gencode v10. RSEQtools, which was utilized by the BrainSpan group, to obtain gene-level expression values. This included converting the reprocessed BAM files into MRF files, and using the mrfQuantifier function to obtain the final gene expression matrix. The BrainSpan region expression matrix between developmental stages of 8 post-conceptual week (pcw) and 1 year old was filtered to maximize the proportion of genes with high expression (RPKM >5) and variance (>1). Pearson correlations based on these 11,972 genes were obtained for each 3D culture condition of iN cells and developmental brain region-time point pair. All plots represent the mean correlation (± SEM) of 3 replicates of 3D culture conditions of iN cells with a specific developmental brain region and time point.
For profiling expression levels of disease-associated genes in iN cells cultured in 3D conditions, ASD-associated genes were obtained from https://gene.sfari.org/autdb/GSGeneList.do?c=S, ALS-associated genes were obtained from ALS Online Database (ALSoD)60 (http://alsod.iop.kcl.ac.uk/misc/dataDownload.aspx#C1) and ALS Gene Database61 (http://www.alsgene.org/top_results), AD-associated genes were obtained from a published study62, and PD-associated genes were obtained from PD Gene Database63 (http://www.pdgene.org/top_results). To determine which genes are driving the increased correlation in expression with BrainSpan data in iN cells co-cultured in CH 4× crosslinker compared to iN cells co-cultured in Matrigel, for each gene we calculated both the squared log fold change between iN cells co-cultured in Matrigeland BrainSpan data and the squared log fold change between iN cells co-cultured in CH 4× crosslinker and BrainSpan data (using RPKM normalized data), and took the difference between the two values to get our final score.
Single-cell RNA-Seq
3D co-cultures of iN cells with mouse astrocytes and with human astrocytic cells were generated in 200 μl CHs made by using 12.5 mM calcium chloride solution. A 1:1 mixture of iN cells and mouse astrocytes was encapsulated (at a final cell concentration of 30×106 cells/ml) in corresponding CHs and cultured as described above. Astrocytic cells derived following the protocol termed “moprhogen + fbs” cultured until day 83 in passage 5 and in passage 6 were detached from culture plates with accutase and pooled. A 1:1 mixture of iN cells and astrocytic cells was encapsulated (at a final cell concentration of 30×106 cells/ml) in corresponding CHs and cultured as described above, with the following change: the culture mediums did not contain doxycycline. At week 5 of culture, cell disassociation from 3D tissues was performed utilizing a previously described protocol16 with the following modifications. Briefly, each 3D tissue was cut into small pieces with a blade and immersed in 1 ml of 20:1 mix of papain solution (PAP2, Worthington) and DNase solution (D2, Worthington) in a 15ml tube, which was then incubated at 37 °C for 20 min and shaken by hand every 5 min. After 20 min, pieces of 3D tissues in this solution were pipetted for further dissociation, and then incubated at 37 °C for 10 min. 1 ml Earle's balanced salt solution (EBSS, Worthington) was mixed with the solution of dissociated tissue. The cloudy cell suspension from this mix was transferred to a new 15 ml tube and mixed with 1.9 ml inhibitor solution (OI.BSA, Worthington). This final solution was then centrifuged at 300g for 5 min. Cell pellets from three biological replicates of each 3D co-culture condition (iN cells with mouse astrocytes and iN cells with human astrocytic cells) were pooled by resuspending cell pellets in ice-cold DPBS with 0.2%BSA (Sigma), which was then passed through a 30 μm filter (Sysmex). Cell suspensions for each condition, 3D co-cultures of iN cells with mouse astrocytes and 3D co-cultures of iN cells with human astrocytic cells, were loaded onto the 10× Chromium Instrument (10× Genomics) through two independent channels to generate single-cell GEMs (Gel bead in EMulsion). Single-cell RNA-Seq libraries were constructed using 10× Chromium 3′ Solution (10× Genomics) following the manufacturer's protocol and sequenced on a NextSeq 500 instrument (Illumina) with 26 bases for read1 and 57 bases for read2.
Single-cell data analysis
Cellranger54 was used to map fastq files to the joint hg19 and mm10 transcriptome, with the option --force-cells=10,000. The cell by gene (hg19 genes only, mm10 genes were explored separately for QC purposes) count matrix was loaded into R using Seurat v1.364. The data was normalized to be log counts per million, and we removed all cells expressing less than 1000 human genes or more than 300 mouse genes. MeanVarPlot was used to find variable genes (with x.low.cutoff=1). The number of genes and percent mitochondrial RNA were regressed out with the RegressOut function, and PCA was performed using PCAFast. Rtsne was applied to the PCA matrix using the top 13 PCs. Clustering was performed as previously described65, using the top 13 PCs and a 100 shared nearest neighbor graph. Cell types of clusters were identified using known marker genes. Note that the clusters identified as neurons express many IPC markers at high levels, but comparison with outside datasets38,39 (see below) suggests these clusters are more similar to neurons than IPCs (see Results).
We loaded numerous outside single cell datasets of human fetal cortex38,39 and a single-nuclei dataset of adult post-mortem human brain tissue40, and a single cell dataset of six-month-old human brain organoids16 into R with Seurat. All data were normalized to be log counts per million, and we removed all cells with less than 500 genes. MeanVarPlot was used to find variable genes (with x.low.cutoff=1). For each dataset, we used the clustering available from their respective papers, and identified cell types based on marker genes. In addition, we extracted the forebrain cluster from the six-month-old human brain organoid16 dataset, and subclustered it using the same pipeline as was used for our single-cell dataset, except we did not regress out percent mitochondria, and used 12 PCs and 50 shared nearest neighbors for clustering.
Correlation heatmaps comparing clusters in our single-cell dataset to clusters in published single-cell16,38,39 and single-nuclei40 datasets were generated as follows: for each dataset, the Seurat function AverageCluster was used to generate the average expression profiles of clusters in that dataset. Variable genes from the published single-cell16,38,39 or single-nuclei40 dataset were identified by MeanVarPlot and then used to calculate the correlation between these average transcript profiles. For comparison between bulk RNA-Seq of conditions involved in our astrocyte differentiation protocol and single cell and single-nuclei datasets of the human brain, a similar procedure as above was used to calculate the average expression of each cell type in the single cell or single-nuclei data. These average profiles were then compared to the expression profiles from the bulk data (measured in log TPM) using Pearson correlation.
Code availability
Codes are available in Github at https://github.com/3D-Neural-NBME.
Data availability
All data supporting the findings of this study are available within the paper and its Supplementary Information. RNA-seq data generated in this study are available through the Gene Expression Omnibus, with accession code GSE111831. Human brain transcriptome data is available through the BrainSpan database (http://www.brainspan.org). Mouse reads filtered un-normalized count matrix and TPM matrix used for bulk RNA-seq analysis are available in Gibhub at https://github.com/3D-Neural-NBME/Bulk-RNA-seq-analysis. The gene-expression matrix used for BrainSpan analysis is available in Github at https://github.com/3D-Neural-NBME/BrainSpan-analysis.
Supplementary Material
Acknowledgments
We thank R. Macrae for critical reading of the manuscript and R. Belliveau for lab support. We thank R. Langer for input during preparation of the manuscript and the entire Zhang Laboratory for assistance in the lab and helpful discussions. F.Z. is a New York Stem Cell Foundation–Robertson Investigator. F.Z. is supported by the NIH grants (1R01-HG009761, 1R01-MH110049, and 1DP1-HL141201); the Howard Hughes Medical Institute; the New York Stem Cell, Simons, Paul G. Allen Family, and Vallee Foundations; and J. and P. Poitras, R. Metcalfe, and D. Cheng. J.Z.L and J.Q.P. are supported by The Stanley Center for Psychiatric Research at the Broad Institute. We thank the Klarman Cell Observatory for supporting experiments using the 10× Chromium Instrument. Reagents are available through Addgene and codes can be accessed via GitHub.
Footnotes
Author Contributions: H.T. and F.Z. conceived the study. H.T. designed the experiments, developed 3D and 2D cultures and 3D co-cultures of iN cells and the method to derive astrocytic cells, analyzed the RNA-seq data, performed qPCR, immunostaining and imaging. S.S. filtered mouse reads from bulk RNA-seq data of iN cells co-cultured with mouse astrocytes. B.C. and H.T. performed and interpreted the comparisons between the transcriptome of 3D cultures and co-cultures of iN cells and the human brain developmental transcriptome. X.A., C.H. and J.Z.L. constructed bulk RNA-seq libraries and performed sequencing. D.D. constructed scRNA-seq libraries and C.H. performed sequencing. J.Z.L aligned the scRNA-seq data to reference genomes. S.S. and H.T. analyzed and interpreted the scRNA-seq data. L.G., S.R.C. and M.H. cloned DNA constructs. L.G. and H.T. tested gRNAs in HEK cells. S.R.C. performed AAV production. H.T. developed 3D tissues of iN cells and astrocytic cells, performed AAV infection of iN cells in 3D tissues and isolation of targeted iN cells by FACS. L.G. performed NGS and indel analysis. A.G. and J.Q.P. performed electrophysiology experiments. V.D. and H.T. performed mechanical characterization of hydrogels. N.E.S. and X.S. developed hESCs with inducible expression of NGN1/2. C.L. isolated and expanded mouse glia. H.T. wrote the paper with input from all authors.
Competing Interests: H.T. and F.Z. are co-inventors in a patent application, relating to work in this manuscript. The reminding authors declare no competing interests.
References
- 1.Bulik-Sullivan B, et al. An atlas of genetic correlations across human diseases and traits. Nature Genetics. 2015;47:1236–+. doi: 10.1038/ng.3406. [DOI] [PMC free article] [PubMed] [Google Scholar]
- 2.Quadrato G, Brown J, Arlotta P. The promises and challenges of human brain organoids as models of neuropsychiatric disease. Nature Medicine. 2016;22:1220–1228. doi: 10.1038/nm.4214. [DOI] [PubMed] [Google Scholar]
- 3.Lambert JC, et al. Meta-analysis of 74,046 individuals identifies 11 new susceptibility loci for Alzheimer's disease. Nature Genetics. 2013;45:1452–U1206. doi: 10.1038/ng.2802. [DOI] [PMC free article] [PubMed] [Google Scholar]
- 4.McCarro SA, Feng GP, Hyman SE. Genome-scale neurogenetics: methodology and meaning. Nature Neuroscience. 2014;17:756–763. doi: 10.1038/nn.3716. [DOI] [PMC free article] [PubMed] [Google Scholar]
- 5.Gandhi S, Wood NW. Genome-wide association studies: the key to unlocking neurodegeneration? Nature Neuroscience. 2010;13:789–794. doi: 10.1038/nn.2584. [DOI] [PubMed] [Google Scholar]
- 6.Choi SH, et al. A three-dimensional human neural cell culture model of Alzheimer's disease. Nature. 2014;515:274–U293. doi: 10.1038/nature13800. [DOI] [PMC free article] [PubMed] [Google Scholar]
- 7.Tang-Schomer MD, et al. Bioengineered functional brain-like cortical tissue. Proceedings of the National Academy of Sciences of the United States of America. 2014;111:13811–13816. doi: 10.1073/pnas.1324214111. [DOI] [PMC free article] [PubMed] [Google Scholar]
- 8.Schwartz MP, et al. Human pluripotent stem cell-derived neural constructs for predicting neural toxicity. Proceedings of the National Academy of Sciences of the United States of America. 2015;112:12516–12521. doi: 10.1073/pnas.1516645112. [DOI] [PMC free article] [PubMed] [Google Scholar]
- 9.Kim SH, et al. Anisotropically organized three-dimensional culture platform for reconstruction of a hippocampal neural network. Nature Communications. 2017;8 doi: 10.1038/ncomms14346. [DOI] [PMC free article] [PubMed] [Google Scholar]
- 10.Grealish S, et al. Human ESC-Derived Dopamine Neurons Show Similar Preclinical Efficacy and Potency to Fetal Neurons when Grafted in a Rat Model of Parkinson's Disease. Cell Stem Cell. 2014;15:653–665. doi: 10.1016/j.stem.2014.09.017. [DOI] [PMC free article] [PubMed] [Google Scholar]
- 11.Dimos JT, et al. Induced pluripotent stem cells generated from patients with ALS can be differentiated into motor neurons. Science. 2008;321:1218–1221. doi: 10.1126/science.1158799. [DOI] [PubMed] [Google Scholar]
- 12.Pasca AM, et al. Functional cortical neurons and astrocytes from human pluripotent stem cells in 3D culture. Nature Methods. 2015;12:671–+. doi: 10.1038/nmeth.3415. [DOI] [PMC free article] [PubMed] [Google Scholar]
- 13.Lancaster MA, et al. Cerebral organoids model human brain development and microcephaly. Nature. 2013;501:373–+. doi: 10.1038/nature12517. [DOI] [PMC free article] [PubMed] [Google Scholar]
- 14.Qian XY, et al. Brain-Region-Specific Organoids Using Mini-bioreactors for Modeling ZIKV Exposure. Cell. 2016;165:1238–1254. doi: 10.1016/j.cell.2016.04.032. [DOI] [PMC free article] [PubMed] [Google Scholar]
- 15.Kraehenbuehl TP, Langer R, Ferreira LS. Three-dimensional biomaterials for the study of human pluripotent stem cells. Nature Methods. 2011;8:731–736. doi: 10.1038/nmeth.1671. [DOI] [PubMed] [Google Scholar]
- 16.Quadrato G, et al. Cell diversity and network dynamics in photosensitive human brain organoids. Nature. 2017;545:48–+. doi: 10.1038/nature22047. [DOI] [PMC free article] [PubMed] [Google Scholar]
- 17.Camp JG, et al. Human cerebral organoids recapitulate gene expression programs of fetal neocortex development. Proceedings of the National Academy of Sciences of the United States of America. 2015;112:15672–15677. doi: 10.1073/pnas.1520760112. [DOI] [PMC free article] [PubMed] [Google Scholar]
- 18.Busskamp V, et al. Rapid neurogenesis through transcriptional activation in human stem cells. Molecular Systems Biology. 2014;10 doi: 10.15252/msb.20145508. [DOI] [PMC free article] [PubMed] [Google Scholar]
- 19.Zhang YS, et al. Rapid Single-Step Induction of Functional Neurons from Human Pluripotent Stem Cells. Neuron. 2013;78:785–798. doi: 10.1016/j.neuron.2013.05.029. [DOI] [PMC free article] [PubMed] [Google Scholar]
- 20.Pang ZPP, et al. Induction of human neuronal cells by defined transcription factors. Nature. 2011;476:220–U122. doi: 10.1038/nature10202. [DOI] [PMC free article] [PubMed] [Google Scholar]
- 21.Chanda S, et al. Generation of Induced Neuronal Cells by the Single Reprogramming Factor ASCL1. Stem Cell Reports. 2014;3:282–296. doi: 10.1016/j.stemcr.2014.05.020. [DOI] [PMC free article] [PubMed] [Google Scholar]
- 22.Lam RS, Topfer FM, Wood PG, Busskamp V, Bamberg E. Functional Maturation of Human Stem Cell-Derived Neurons in Long-Term Cultures. Plos One. 2017;12 doi: 10.1371/journal.pone.0169506. [DOI] [PMC free article] [PubMed] [Google Scholar]
- 23.Yi F, et al. Autism-associated SHANK3 haploinsufficiency causes I-h channelopathy in human neurons. Science. 2016;352 doi: 10.1126/science.aaf2669. [DOI] [PMC free article] [PubMed] [Google Scholar]
- 24.Huang YWA, Zhou B, Wernig M, Südhof TC. ApoE2, ApoE3, and ApoE4 Differentially Stimulate APP Transcription and Aβ Secretion. Cell. 2017;168:427–441.e421. doi: 10.1016/j.cell.2016.12.044. [DOI] [PMC free article] [PubMed] [Google Scholar]
- 25.Carlson AL, et al. Generation and transplantation of reprogrammed human neurons in the brain using 3D microtopographic scaffolds. Nature Communications. 2016;7 doi: 10.1038/ncomms10862. [DOI] [PMC free article] [PubMed] [Google Scholar]
- 26.Lau LW, Cua R, Keough MB, Haylock-Jacobs S, Yong VW. OPINION Pathophysiology of the brain extracellular matrix: a new target for remyelination. Nature Reviews Neuroscience. 2013;14:722–729. doi: 10.1038/nrn3550. [DOI] [PubMed] [Google Scholar]
- 27.Tang X, et al. Astroglial cells regulate the developmental timeline of human neurons differentiated from induced pluripotent stem cells. Stem Cell Research. 2013;11:743–757. doi: 10.1016/j.scr.2013.05.002. [DOI] [PMC free article] [PubMed] [Google Scholar]
- 28.Margolis RU, Margolis RK, Chang LB, Preti C. Glycosaminoglycans of brain during development. Biochemistry. 1975;14:85–88. doi: 10.1021/bi00672a014. [DOI] [PubMed] [Google Scholar]
- 29.Bozza A, et al. Neural differentiation of pluripotent cells in 3D alginate-based cultures. Biomaterials. 2014;35:4636–4645. doi: 10.1016/j.biomaterials.2014.02.039. [DOI] [PubMed] [Google Scholar]
- 30.Brannvall K, et al. Enhanced neuronal differentiation in a three-dimensional collagen-hyaluronan matrix. Journal of Neuroscience Research. 2007;85:2138–2146. doi: 10.1002/jnr.21358. [DOI] [PubMed] [Google Scholar]
- 31.Seidlits SK, et al. The effects of hyaluronic acid hydrogels with tunable mechanical properties on neural progenitor cell differentiation. Biomaterials. 2010;31:3930–3940. doi: 10.1016/j.biomaterials.2010.01.125. [DOI] [PubMed] [Google Scholar]
- 32.Khetan S, et al. Degradation-mediated cellular traction directs stem cell fate in covalently crosslinked three-dimensional hydrogels. Nature Materials. 2013;12:458–465. doi: 10.1038/nmat3586. [DOI] [PMC free article] [PubMed] [Google Scholar]
- 33.Chaudhuri O, et al. Extracellular matrix stiffness and composition jointly regulate the induction of malignant phenotypes in mammary epithelium. Nature Materials. 2014;13:970–978. doi: 10.1038/nmat4009. [DOI] [PubMed] [Google Scholar]
- 34.Chaudhuri O, et al. Hydrogels with tunable stress relaxation regulate stem cell fate and activity. Nature Materials. 2016;15:326–+. doi: 10.1038/nmat4489. [DOI] [PMC free article] [PubMed] [Google Scholar]
- 35.Huebsch N, et al. Harnessing traction-mediated manipulation of the cell/matrix interface to control stem-cell fate. Nature Materials. 2010;9:518–526. doi: 10.1038/nmat2732. [DOI] [PMC free article] [PubMed] [Google Scholar]
- 36.Shaltouki A, Peng J, Liu QY, Rao MS, Zeng XM. Efficient Generation of Astrocytes from Human Pluripotent Stem Cells in Defined Conditions. Stem Cells. 2013;31:941–952. doi: 10.1002/stem.1334. [DOI] [PubMed] [Google Scholar]
- 37.Chojnacki A, Weiss S. Production of neurons, astrocytes and oligodendrocytes from mammalian CNS stem cells. Nature Protocols. 2008;3:935–940. doi: 10.1038/nprot.2008.55. [DOI] [PubMed] [Google Scholar]
- 38.Pollen AA, et al. Molecular Identity of Human Outer Radial Glia during Cortical Development. Cell. 2015;163:55–67. doi: 10.1016/j.cell.2015.09.004. [DOI] [PMC free article] [PubMed] [Google Scholar]
- 39.Nowakowski TJ, et al. Spatiotemporal gene expression trajectories reveal developmental hierarchies of the human cortex. Science. 2017;358:1318–1323. doi: 10.1126/science.aap8809. [DOI] [PMC free article] [PubMed] [Google Scholar]
- 40.Habib N, et al. Massively parallel single-nucleus RNA-seq with DroNc-seq. Nature Methods. 2017;14:955–+. doi: 10.1038/nmeth.4407. [DOI] [PMC free article] [PubMed] [Google Scholar]
- 41.Zetsche B, et al. Multiplex gene editing by CRISPR-Cpf1 using a single crRNA array. Nature Biotechnology. 2017;35:31–34. doi: 10.1038/nbt.3737. [DOI] [PMC free article] [PubMed] [Google Scholar]
- 42.Zetsche B, et al. Cpf1 Is a Single RNA-Guided Endonuclease of a Class 2 CRISPR-Cas System. Cell. 2015;163:759–771. doi: 10.1016/j.cell.2015.09.038. [DOI] [PMC free article] [PubMed] [Google Scholar]
- 43.Renton AE, Chio A, Traynor BJ. State of play in amyotrophic lateral sclerosis genetics. Nature Neuroscience. 2014;17:17–23. doi: 10.1038/nn.3584. [DOI] [PMC free article] [PubMed] [Google Scholar]
- 44.Katz JS, Katzberg HD, Woolley SC, Marklund SL, Andersen PM. Combined fulminant frontotemporal dementia and amyotrophic lateral sclerosis associated with an I113T SOD1 mutation. Amyotrophic Lateral Sclerosis. 2012;13:567–569. doi: 10.3109/17482968.2012.678365. [DOI] [PubMed] [Google Scholar]
- 45.Mackenzie IRA, Rademakers R, Neumann M. TDP-43 and FUS in amyotrophic lateral sclerosis and frontotemporal dementia. Lancet Neurology. 2010;9:995–1007. doi: 10.1016/s1474-4422(10)70195-2. [DOI] [PubMed] [Google Scholar]
- 46.Freischmidt A, et al. Haploinsufficiency of TBK1 causes familial ALS and fronto-temporal dementia. Nature Neuroscience. 2015;18:631–+. doi: 10.1038/nn.4000. [DOI] [PubMed] [Google Scholar]
- 47.Burdick JA, Prestwich GD. Hyaluronic Acid Hdydrogels for Biomedical Applications. Advanced Materials. 2011;23:H41–H56. doi: 10.1002/adma.201003963. [DOI] [PMC free article] [PubMed] [Google Scholar]
- 48.Brigham MD, et al. Mechanically Robust and Bioadhesive Collagen and Photocrosslinkable Hyaluronic Acid Semi-Interpenetrating Networks. Tissue Engineering Part A. 2009;15:1645–1653. doi: 10.1089/ten.tea.2008.0441. [DOI] [PMC free article] [PubMed] [Google Scholar]
- 49.Back SA, et al. Hyaluronan accumulates in demyelinated lesions and inhibits oligodendrocyte progenitor maturation. Nature Medicine. 2005;11:966–972. doi: 10.1038/nm1279. [DOI] [PubMed] [Google Scholar]
- 50.Zaman MH, et al. Migration of tumor cells in 3D matrices is governed by matrix stiffness along with cell-matrix adhesion and proteolysis. Proceedings of the National Academy of Sciences of the United States of America. 2006;103:10889–10894. doi: 10.1073/pnas.0604460103. [DOI] [PMC free article] [PubMed] [Google Scholar]
- 51.Catanzano O, et al. Alginate-hyaluronan composite hydrogels accelerate wound healing process. Carbohydrate Polymers. 2015;131:407–414. doi: 10.1016/j.carbpol.2015.06.081. [DOI] [PubMed] [Google Scholar]
- 52.Gao LY, et al. Engineered Cpf1 variants with altered PAM specificities. Nature Biotechnology. 2017;35:789–792. doi: 10.1038/nbt.3900. [DOI] [PMC free article] [PubMed] [Google Scholar]
- 53.Patel AP, et al. Single-cell RNA-seq highlights intratumoral heterogeneity in primary glioblastoma. Science. 2014;344:1396–1401. doi: 10.1126/science.1254257. [DOI] [PMC free article] [PubMed] [Google Scholar]
- 54.Zheng GXY, et al. Massively parallel digital transcriptional profiling of single cells. Nature Communications. 2017;8 doi: 10.1038/ncomms14049. [DOI] [PMC free article] [PubMed] [Google Scholar]
- 55.Picelli S, et al. Full-length RNA-seq from single cells using Smart-seq2. Nature Protocols. 2014;9:171–181. doi: 10.1038/nprot.2014.006. [DOI] [PubMed] [Google Scholar]
- 56.Li B, Dewey CN. RSEM : accurate transcript quantification from RNA-Seq data with or without a reference genome. Bmc Bioinformatics. 2011;12 doi: 10.1186/1471-2105-12-323. [DOI] [PMC free article] [PubMed] [Google Scholar]
- 57.Dobin A, et al. STAR: ultrafast universal RNA-seq aligner. Bioinformatics. 2013;29:15–21. doi: 10.1093/bioinformatics/bts635. [DOI] [PMC free article] [PubMed] [Google Scholar]
- 58.Love MI, Huber W, Anders S. Moderated estimation of fold change and dispersion for RNA-seq data with DESeq2. Genome Biology. 2014;15 doi: 10.1186/s13059-014-0550-8. [DOI] [PMC free article] [PubMed] [Google Scholar]
- 59.Subramanian A, Kuehn H, Gould J, Tamayo P, Mesirov JP. GSEA-P: A desktop application for Gene Set Enrichment Analysis. Bioinformatics. 2007;23:3251–3253. doi: 10.1093/bioinformatics/btm369. [DOI] [PubMed] [Google Scholar]
- 60.Abel O, Powell JF, Andersen PM, Al-Chalabi A. ALSoD: A user-friendly online bioinformatics tool for amyotrophic lateral sclerosis genetics. Human Mutation. 2012;33:1345–1351. doi: 10.1002/humu.22157. [DOI] [PubMed] [Google Scholar]
- 61.Lill CM, Abel O, Bertram L, Al-Chalabi A. Keeping up with genetic discoveries in amyotrophic lateral sclerosis: The ALSoD and ALSGene databases. Amyotrophic Lateral Sclerosis. 2011;12:238–249. doi: 10.3109/17482968.2011.584629. [DOI] [PubMed] [Google Scholar]
- 62.Van Cauwenberghe C, Van Broeckhoven C, Sleegers K. The genetic landscape of Alzheimer disease: clinical implications and perspectives. Genetics in Medicine. 2016;18:421–430. doi: 10.1038/gim.2015.117. [DOI] [PMC free article] [PubMed] [Google Scholar]
- 63.Nalls MA, et al. Large-scale meta-analysis of genome-wide association data identifies six new risk loci for Parkinson's disease. Nature Genetics. 2014;46:989–+. doi: 10.1038/ng.3043. [DOI] [PMC free article] [PubMed] [Google Scholar]
- 64.Satija R, Farrell JA, Gennert D, Schier AF, Regev A. Spatial reconstruction of single-cell gene expression data. Nature Biotechnology. 2015;33:495–U206. doi: 10.1038/nbt.3192. [DOI] [PMC free article] [PubMed] [Google Scholar]
- 65.Shekhar K, et al. Comprehensive Classification of Retinal Bipolar Neurons by Single-Cell Transcriptomics. Cell. 2016;166:1308–+. doi: 10.1016/j.cell.2016.07.054. [DOI] [PMC free article] [PubMed] [Google Scholar]
Associated Data
This section collects any data citations, data availability statements, or supplementary materials included in this article.
Supplementary Materials
Data Availability Statement
All data supporting the findings of this study are available within the paper and its Supplementary Information. RNA-seq data generated in this study are available through the Gene Expression Omnibus, with accession code GSE111831. Human brain transcriptome data is available through the BrainSpan database (http://www.brainspan.org). Mouse reads filtered un-normalized count matrix and TPM matrix used for bulk RNA-seq analysis are available in Gibhub at https://github.com/3D-Neural-NBME/Bulk-RNA-seq-analysis. The gene-expression matrix used for BrainSpan analysis is available in Github at https://github.com/3D-Neural-NBME/BrainSpan-analysis.