

Summary:
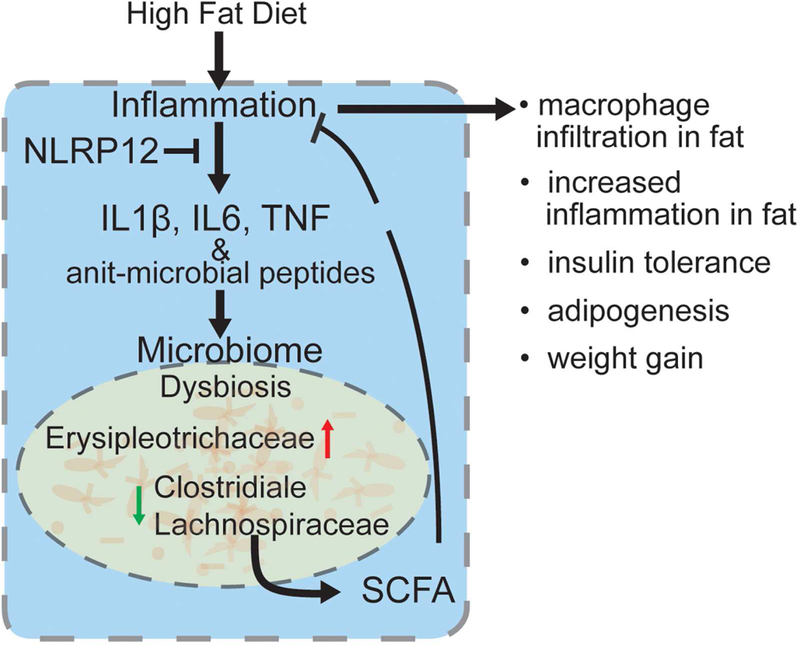
In addition to high-fat diet (HFD) and inactivity, inflammation and microbiota composition contribute to obesity. Inhibitory immune receptors, such as NLRP12, dampen inflammation and are important for resolving inflammation, but their role in obesity is unknown. We show that obesity in humans correlates with reduced expression of adipose tissue NLRP12. Similarly, Nlrp12-/- mice show increased weightgain, adipose deposition, blood glucose, NF-κB/MAPK activation and M1-macrophage polarization. Additionally, NLRP12 is required to mitigate HFD-induced inflammasome activation. Co-housing with wild-type animals, antibiotic treatment or germ-free condition was sufficient to restrain inflammation, obesity and insulin-tolerance in Nlrp12-/- mice, implicating the microbiota. HFD-fed Nlrp12-/- mice display dysbiosis marked by increased obesity-associated Erysipelotrichaceae, but reduced Lachnospiraceae family and the associated enzymes required for short-chain fatty acid (SCFA) synthesis. Lachnospiraceae or SCFA administration attenuates obesity, inflammation and dysbiosis. These findings reveal that Nlrp12 reduces HFD-induced obesity by maintaining beneficial microbiota.
eTOC blurb
Truax et al. show that myeloid-expressed NLRP12 restrains high-fat diet-induced obesity and type 2 diabetes by attenuating TNF, IL-6, NF-kB, MAPK, M1 macrophage polarization and inflammasome activation in adipose tissue. This protective function of NLRP12 is microbiota dependent, and is associated with Lachnospiraceae and their metabolites, which mitigate obesity.
INTRODUCTION:
Obesity is a global health concern afflicting ~30% of the world’s population (Flegal et al., 2012) and contributes to cardiovascular disease, hypertension, diabetes mellitus and cancer (Hensrud and Klein, 2006). While obesity is driven by energy intake and expenditure (e.g., diet and lack of exercise), inflammation is increasingly recognized as an important contributing factor to obesity and obesity-related diseases. Adipose tissues from obese patients and animals given high-fat diet (HFD) display elevated activation of NF-κB and increased TNF, IL1β and IL6 (Olefsky and Glass, 2010; Shoelson et al., 2003). Infiltrating immune cells are predominant sources of cytokines in adipose tissue, with adipose tissue macrophages (ATMs) comprising 40% of total cells in this tissue (Weisberg et al., 2003). Skewing of ATMs into M1 macrophages is associated with obesity-induced inflammation and pro-inflammatory cytokines (Ouchi et al., 2011).
Obesity is also affected by the gut microbiota. Imbalance of gut microbiota (dysbiosis) is linked to gut inflammation (Sartor and Wu, 2017), and innate immune receptors including TLR5 (Vijay-Kumar et al., 2010) and the inflammasome adaptor, ASC (apoptotic speck-containing protein with a CARD) (Henao-Mejia et al., 2012), have been implicated in obesity-associated dysbiosis (Bouter et al., 2017), although their roles in obesity remain controversial (Chassaing et al., 2014; Zhang et al., 2016). While some found that Inflammasome-activating NOD-like receptor (NLR) proteins, NLRP3 and NLRP6, exacerbated obesity-induced inflammation (Stienstra et al., 2010; Stienstra et al., 2011; Vandanmagsar et al., 2011), others showed that the co-housing of wildtype (WT) mice with inflammasome-deficient mice caused WT to gain weight (Henao-Mejia et al., 2012).
In contrast to pro-inflammatory immune receptors, NLR proteins that dampen inflammation are important for the resolution of inflammation, yet their roles in obesity is completely unknown. NLRP12 is identified as a potent mitigator of inflammation. It is primarily expressed by dendritic cells, granulocytes and macrophages where it inhibits both canonical and non-canonical NF-κB and ERK activation. Nlrp12-deficient mice are highly susceptible to experimental models of colitis, colitis-associated colon cancer (CAC) (Allen et al., 2012b; Zaki et al., 2011) and multiple sclerosis (Gharagozloo et al., 2015; Lukens et al., 2015) and they exhibit increased basal colonic inflammation and dysbiosis (Chen et al., 2017). This work shows that NLRP12 is a checkpoint of obesity, restrains HFD-induced inflammation and maintains commensals that produce shortchain fatty acids (SCFA).
RESULTS:
Nlrp12-/- mice gained more weight than control animals
We analyzed adipose tissues isolated from healthy and obese individuals (Ballak et al., 2014) and found that human NLRP12 expression is significantly lowered in the obese population (Figure 1A). Its expression is negatively correlated with body mass index (BMI), body weight, crown-like structures in the adipose tissue and serum ferritin, but not with waist to hip ratio, age or gender (Figure S1, A-G). To determine if Nlrp12 in mice affected obesity, 5-6 weeks old WT and Nlrp12-/- mice were fed HFD (45% kcal from fat) or a control low fat diet (LFD, 10% kcal from fat) for 20 weeks (Figure 1B). Nlrp12-/- mice consumed the same amount of food and water as WT mice (Figure S2, A-B) and showed no significant differences in the total respiratory exchange ratio (RER) (ratio of carbon dioxide made during metabolism to oxygen used) (Figure S2C) but they had less energy expenditure (Figure S2D). They also gained significantly more weight (Figure 1C-D, ) and a greater percentage of body fat than WT mice during 22-weeks of HFD (Figure 1E). Conversely, the percentage of lean mass in HFD-fed Nlrp12-/- mice was significantly reduced (Figure 1F). Gonadal white adipose tissues (GWAT, open arrow) and inguinal white adipose tissues (InWAT, black arrows) (Figure 1G) were isolated and stained with hematoxylin and eosin to reveal significant increases in adipocyte size in both GWAT and InWAT in Nlrp12-/- vs. WT mice on LFD, but this difference was absent in mice on HFD possibly because adipocytes reached their maximum size in both strains on HFD (Figure 1, H-I). Nlrp12-/- mice exhibited a significant increase in adipose tissue weight (Figure 1, J-K), but not in spleen, heart and kidney weights compared to HFD-fed WT controls and LFD-fed animals (Figure S2, E-G). TNF and IL6 have been positively correlated with obesity and insulin tolerance (Hotamisligil et al., 1995). Both serum lL6 and TNF were significantly elevated in Nlrp12-/- over WT mice on HFD (Figure 1L), and this was accompanied by reduced insulin sensitivity (Figure 1M). Phosphorylated AKT (p-AKT), a readout of intracellular insulin signaling, was reduced in the liver, muscle, and WAT of HFD-fed
Figure 1: Nlrp12 protects against obesity.
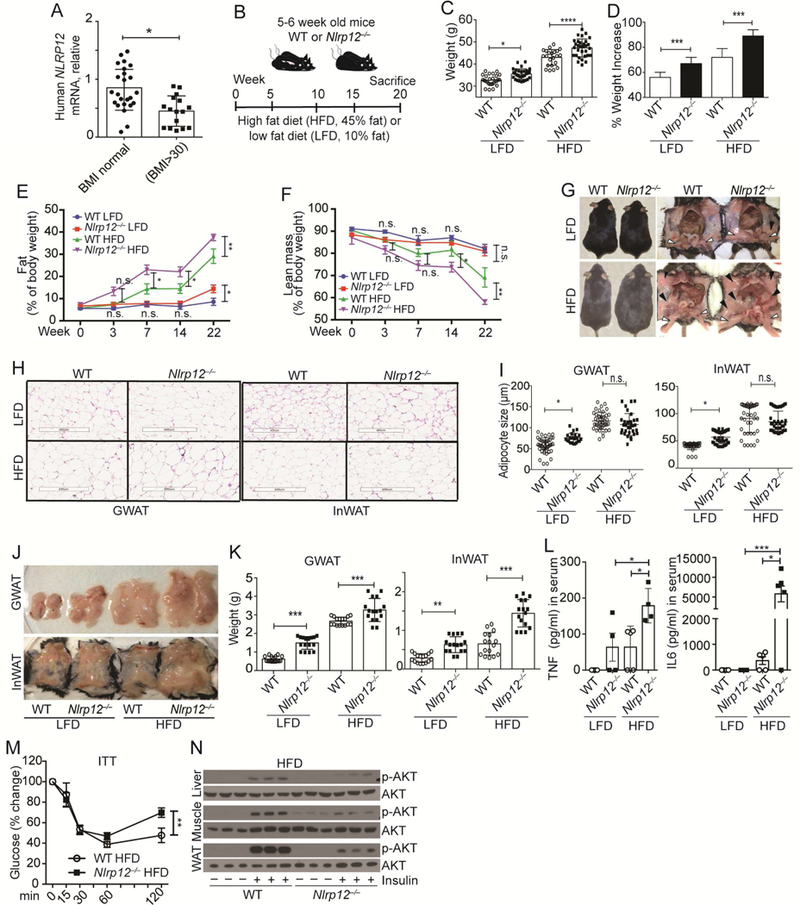
(A) Human NLRP12 mRNA in adipose tissue from healthy (n=24) and obese (BMI>30) individuals (n=16). (B) Schematic of WT and Nlrp12-/- mice fed LFD or HFD. (C) Body weight and (D) percent weight increase of WT and Nlrp12-/- fed LFD/HFD for 20 weeks (WT LFD, n=28; Nlrp12-/- LFD, n=30; WT HFD, n=22; Nlrp12-/- HFD, n=32). (E) Percentage body fat and (F) lean mass of WT and Nlrp12-/- mice at 0 to 22 weeks of LFD/HFD (WT LFD, n=9; Nlrp12-/- LFD, n=8; WT HFD, n=10; Nlrp12-/- HFD, n=11). (G) Representative image of mice from (B) indicating InWAT (black arrow) and GWAT (white arrow). (H) Representative images of H&E staining of WT and Nlrp12-/- GWAT and InWAT 20 weeks post-LFD/HFD (Scale bar = 400 μm), with (I) composite of adipocyte sizes (n=50/each group). (J) Representative images of GWAT and InWAT from mice in (B), with (K) composite weight of GWAT and InWAT (n=17/group). (L) Serum TNF and IL6 from mice treated as described in (B) (WT LFD, n=3; Nlrp12-/- LFD, n=4; WT HFD, n=5; Nlrp12-/- HFD, n=5). (M) Insulin tolerance test (ITT) in WT and Nlrp12-/- mice fed HFD for 20 weeks (WT, n=6; Nlrp12-/-, n=9). (N) Western blot of p-AKT in the liver, muscle and WAT of HFD-fed WT and Nlrp12-/- mice after insulin administration (n=3/group). Each symbol or lane represents one mouse. Error bars represent SEM, with *p<0.05, **p<0.01, *** p<0.001, **** p<0.0001 and n.s. means no significance determined by Student’s t test.
Nlrp12-/- mice compared to WT controls (Figure 1N).
Nlrp12-/- animals have increased inflammatory macrophages and exaggerated inflammation in the adipose tissue
In both humans and rodents, macrophages accumulate in adipose tissue during weight gain (Weisberg et al., 2003; Xu et al., 2003), and ATMs are thought to originate from monocytes infiltrating the adipose tissue from the circulation (Weisberg et al., 2003) or from local macrophages proliferation (Amano et al., 2014) and NLRP12 is primarily expressed by the myeloid lineage (Figure S3). The RNAseq profile of LPStreated CD14+ monocytes revealed an inversed relationship between NLRP12 expression, which was reduced by LPS, and IL1B, TNF and IL6 which were increased by LPS (Figure 2A, top). Activation epigenetic markers were also down-regulated by LPS in the NLRP12 promoter but increased in IL1B, TNF and IL6 promoters. When activated monocytes reverted to a quiescent state 24hr after stimulation, proinflammatory cytokine genes (IL1B, TNF, IL6) were silenced while NLRP12 expression was restored (Figure 2B). These results suggest that NLRP12 expression is inversely correlated with cytokine gene expression, and consistent with its role as an inhibitor of inflammatory response. In agreement with this, LFD fed Nlrp12-/- mice had more GWAT F4/80hi macrophages compared to WT mice on LFD, but GWAT from Nlrp12-/- mice on HFD had the most abundant F4/80hi cells forming ‘crown like structure’ (CLS) (Figure 2C), which is formed by macrophage aggregation (Cinti et al., 2005; Murano et al., 2008). Adipose F4/80hiCD11bhi cells were also increased in Nlrp12-/- mice as detected by flow cytometric analysis (Figure 2D).
Figure 2: NLRP12 represses macrophage infiltration and inflammation in adipose tissue.
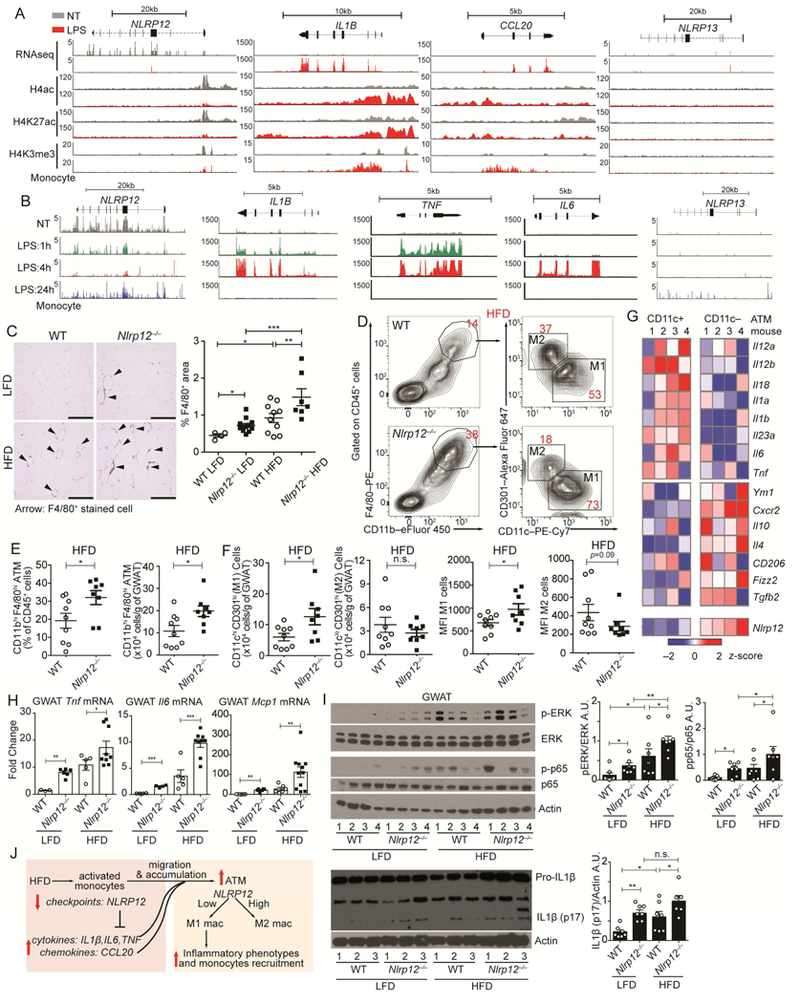
(A) Peak distributions of RNA-seq at the exons and ChIP-seq at the promoters of NLRP12, IL1B, CCL20 and NLRP13 genes in primary human CD14+ monocytes left non-treated (NT, grey) or given LPS for 3h (red) (data source: GSE100383). (B) RNAseq peak distribution at the exons of the NLRP12, IL1B, TNF, IL6 and NLRP13 genes in untreated primary human CD14+ monocytes for 1, 4 or 24 hours after LPS stimulation (data source: GSE85243). (C) Representative F4/80+ immunohistochemical staining of GWAT from LFD/HFD-fed WT and Nlrp12-/- mice (scale bar = 200 μm), with composite percentage of F4/80+ cells (right panel) (WT LFD, n=4; Nlrp12-/- LFD, n=8; WT HFD, n=10; Nlrp12-/-, n=7). (D) Representative concatenated FACS plots of cells bearing M1 vs. M2 macrophage markers, with composite quantification of (E) GWAT resident macrophage populations and (F) quantification and mean fluorescence intensity (MFI) of M1 cells (CD11chi CD301lo) and M2 (CD11clo CD301hi) from HFD-fed WT and Nlrp12-/- mice (WT HFD, n=9; Nlrp12-/- HFD, n=8). (G) Heatmap of gene expression analysis of CD11c+ and CD11c- ATM isolated from WT mice (data source: GSE53403). (H) RT-qPCR analysis of Tnf, Il6 and Mcp1 mRNA expression, and (I) western blots of IL1β and activated p65 and ERK with composite densitometry (n=7/group from 2 studies) from GWAT of LFD- or HFD-fed WT and Nlrp12-/- mice. (J) Model of NLRP12 inhibition of monocyte/macrophage inflammation and accumulation into adipose tissue. Error bars show SEM, *p<0.05, **p<0.01, *** p<0.001 and n.s. means no significance determined by Student’s t test (E, F) and one-way ANOVA (H,I).
ATMs include inflammatory M1 population (CD11bhiCD11chi) accumulate in obese mice (Nguyen et al., 2007) while alternatively activated M2 cells (CD11bhiCD11clo) are more abundant in healthy/lean adipose tissue (Martinez and Gordon, 2014). As obesity progresses, the expansion of adipose tissue coincides with activation of ATMs (Fan et al., 2016; Olefsky and Glass, 2010) and a switch from an M2-like to an M1-like phenotype (Lumeng et al., 2007). We isolated GWAT ATMs from WT or Nlrp12-/- mice after 20 weeks on HFD and found samples from Nlrp12-/- mice had significantly more F4/80hiCD11bhi ATM cells than WT controls (Figure 2, D-E). There is also a relative higher percentage of CD11chi CD301lo M1 macrophages in the Nlrp12-/- ATMs compared to the WT control (Figure 2D right, 2F). These results suggest that the loss of Nlrp12 resulted in M1enrichment. An analysis of gene expression in ATMs from WT mice revealed that Nlrp12 expression was reduced in M1 cells and inversely correlated with M1 genes (Figure 2G).
Adipose tissue releases TNF and IL6 can enhance weight gain (Ohshima et al., 1998; Tzanavari et al., 2010). We found that the GWAT of Nlrp12-/- mice had increased expression of Tnf and Il6 at the basal state when compared to WT controls, which was further enhanced with HFD (Figure 2H). Mcp1/Ccl2, a chemokine gene regulating recruitment and infiltration of monocytes into adipose tissues (Deshmane et al., 2009; Weisberg et al., 2003) was similarly enhanced in Nlrp12-/- mice. Additionally, GWAT of HFD-fed Nlrp12-/- mice had heightened p-p65 and p-ERK, and inflammasome activation indicated by increased pro-IL1β processing to mature IL1β (Figure 2I). Collectively, these results demonstrate that Nlrp12 deficiency increases activation of ATMs and contributes to a more inflammatory M1-enriched status in the adipose tissue (Figure 2J).
Macrophage-specific deletion of Nlrp12 resulted in greater obesity, reduced insulin signaling and increased inflammation
Analysis of isolated ATMs showed reduced Nlrp12 expression in ATMs isolated from obese mice relative to lean mice (Figure 3A). Figure 2 suggests that during HFD, Nlrp12 restrains M1 proinflammatory macrophages. To directly assess if Nlrp12 in myeloid cells played a role during obesity, we generated myeloid-specific Nlrp12 knockout mice (Nlrp12flox/flox LysM-Cre+) (Figure 3B). Nlrp12flox/flox LysM-Cre+ mice showed greater HFD-induced weight gain (Figure 3C) and impaired glucose tolerance measured by the OGTT (oral glucose tolerance test) (Figure 3D) than Nlrp12flox/flox LysM-Cre- control mice but only a test of weight gain reached significance. Insulin tolerance test (ITT) showed that Nlrp12flox/flox LysM-Cre+ mice showed significantly increased insulin tolerance (Figure 3E), with a significant reduction of insulin signaling (p-AKT) in the liver and WAT (Figure 3F). Adipose tissues Nlrp12flox/flox LysM-Cre+ mice have elevated inflammation manifested by increased NF-κB nuclear p52, p-p65 and mature IL1β levels (Figure 3G). These data indicate that the loss of myeloid Nlrp12 led to obesity, insulin tolerance and increased immune signaling and inflammasome activation.
Figure 3: Myeloid NLRP12 prevents obesity and adipose tissue inflammation.
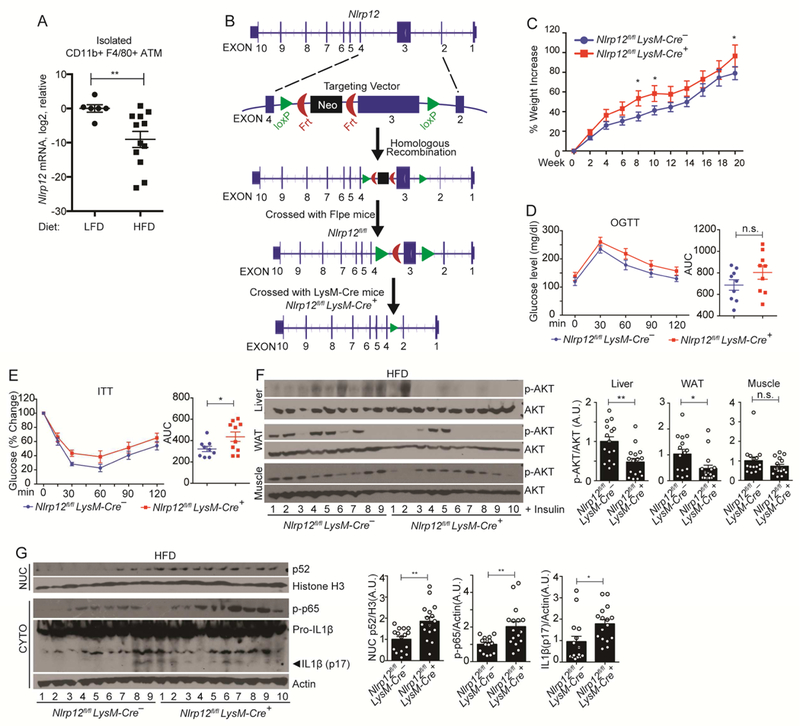
(A) RT-qPCR analysis of Nlrp12 expression in ATMs from LFD or HFD fed WT mice. Each dot in the LFD group represents pooled ATM from 2-3 mice, and each dot in the HFD group represents one mouse (LFD WT mice, n=13; and HFD WT mice, n=12). (B) Strategy for the generation of myeloid-specific Nlrp12-deficient (Nlrp12fl/fl LysM-Cre+) mice. (C) Percent weight increase in Nlrp12fl/fl LysM-Cre+ and Nlrp12fl/fl LysM-Cre- (control) mice fed HFD for 20 weeks (Nlrp12fl/fl LysM-Cre+, n=17; and Nlrp12fl/fl LysMCre-, n=18). (D) OGTT and (E) ITT of Nlrp12fl/fl LysM-Cre+ and Nlrp12fl/fl LysM-Cre- mice fed HFD for 20 weeks (F) Western blot analysis with composite quantification of p-AKT in liver, WAT and muscle and (G) nuclear p52, p-p65 and IL1β maturation in adipose tissue (Nlrp12fl/fl LysM-Cre+, n=10; Nlrp12fl/fl LysM-Cre-, n=9). Error bars show SEM, *p<0.05, **p<0.01 and n.s. means no significance determined by Student’s t test.
Gut microbiota affects HFD-induced weight gain in Nlrp12-/- mice
Intestinal microbiota is known to influence host metabolism and obesity (Bouter et al., 2017; Plovier et al., 2017). To address the role of the resident microbiota, an antibiotic cocktail (Abx) was provided in the drinking water prior to and during feeding with HFD (Figure 4A). Abx did not significantly affect the weight of WT mice, but it did reduce weight gain and percentage of body fat of Nlrp12-/- mice compared to untreated Nlrp12-/- littermates (Figure 4, B-C).
Figure 4. Commensal bacteria both contribute to and are responsive to the enhanced obesity in Nlrp12-/- mice.
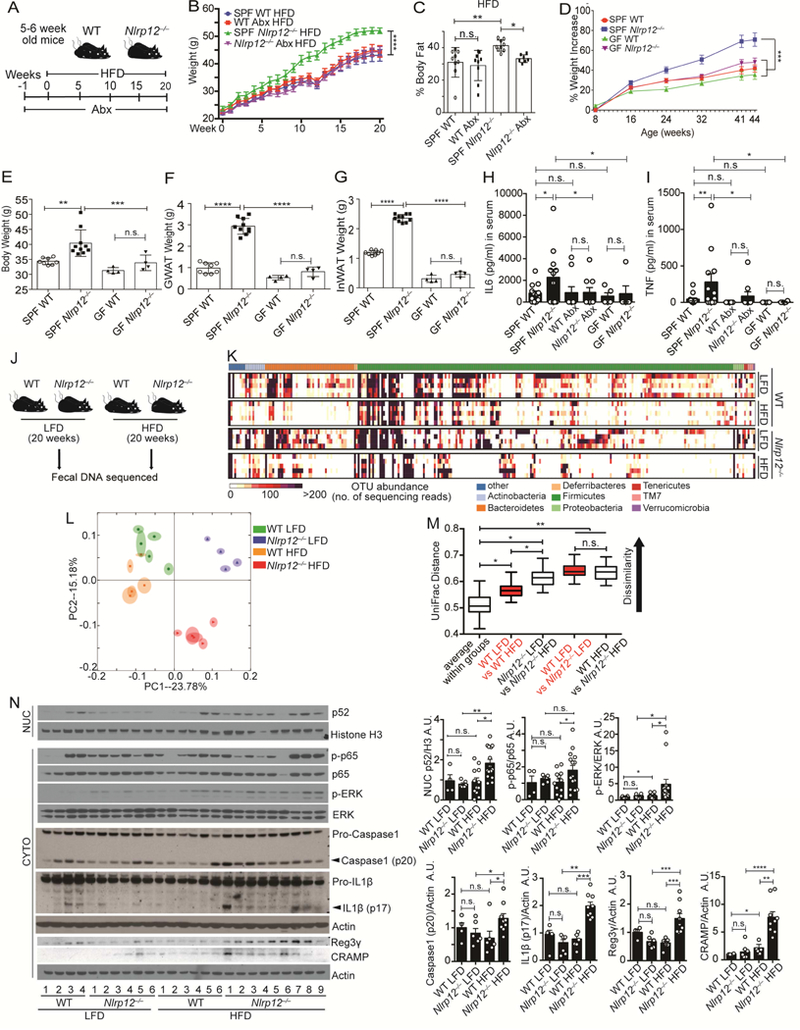
(A) Schematic of antibiotic (Abx) treatment of WT and Nlrp12-/- mice on HFD. (B) Body weight and (C) percentage body fat of mice shown in (a), (n=9/group). (D) Percentage weight increase in specific-pathogen-free (SPF) and germ-free (GF) WT and Nlrp12-/- mice on regular chow for 44 weeks. (E) Body, (F) GWAT and (G) InWAT weights of WT and Nlrp12-/- mice at week 44 post-HFD (SPF WT, n=8; Nlrp12-/- mice, n=10; GF WT and Nlrp12-/- mice, n=4/group). (H) Serum IL6 and (I) TNF from Abx-treated or germ-free mice. (SPF WT, n=13; SPF Nlrp12-/-, n=12; Abx WT, n=10; Abx Nlrp12-/-, n=9; GF WT, n=5; GF Nlrp12-/-, n=5). (J) Schematic of fecal DNA collection from WT and Nlrp12-/- mice after 20 weeks of LFD or HFD. (K) Heatmap showing microbial diversity with abundance of sequenced OTU of fecal samples collected from the mice in (J) (n=5/group). (L) PCA plot showing microbial unweighted UniFrac compositional differences, quantified by (M) UniFrac distance between WT and Nlrp12-/- mice on HFD vs. LFD. (N) Western blot analysis and composite densitometry of colonic proteins from WT and Nlrp12-/- mice on HFD vs. LFD (WT LFD, n=4; Nlrp12-/- LFD, n=6; WT HFD, n=12; Nlrp12-/- HFD, n=14). Each lane or symbol represents one mouse. Error bars show SEM, *p<0.05, **p<0.01, *** p<0.001, **** p<0.0001 and n.s. means no significance determined by Student’s t test (B, D, M) and one-way ANOVA (C, E-I, N).
To more stringently investigate the contribution of the microbiota, we examined germ free (GF) WT and Nlrp12-/- mice birthed and reared under gnotobiotic conditions. We were unable to administer HFD to GF animals because our gnotobiotic facility does not allow the introduction of special feeds due to the difficulty in maintaining sterility in irradiated high-fat diets. However, Nlrp12-/- mice raised under specific pathogen-free (SPF) condition and fed a standard chow still gained significantly more weight than WT animals on the same regimen (Figure 4D). The weight-gain of Nlrp12-/- mice fed a normal diet occurred at a later time than mice fed HFD (shown in Figure 1). This observation allowed us to compare weight gain in Nlrp12-/- vs. WT mice fed a normal diet in a germ-free environment. On normal diet, there were more significant weight gain, increased GWAT and InWAT between SPF- Nlrp12-/- vs. WT mice at 44 weeks of age, compared to 44 weeks old GF- Nlrp12-/- vs. WT mice (Figure 4, D-G). This suggests that the microbiota played a role in excessive weight gain by Nlrp12-/- mice.
To analyze the impact of the microbiota on colon inflammation, colons of Abxtreated Nlrp12-/- mice displayed significantly reduce inflammasome activation measured by the conversion of pro-IL1β to mature IL1β compared to untreated Nlrp12-/- mice. Nuclear NF-κB p52, p-p65, and p-ERK were also lowered but did not reach significance (Figure S4A). Abx also reduced IL6 and TNF in colon explants from HFD-fed Nlrp12-/- mice (Figure S4B). These results suggest that Abx-mediated changes in the microbiota resulted in attenuated colonic inflammation. Furthermore, serum IL6 and TNF were higher in SPF Nlrp12-/- mice than WT controls, while these differences disappeared in mice treated with Abx or raised under GF condition (Figure 4, H-I), affirming that the microbiota affected basal inflammation and weight gain in Nlrp12-/- mice.
Dietary fat can influence the gut microbiota, and mice fed HFD are reported to have reduced Bacteroidales but increased Firmicutes and Proteobacteria (Eckburg et al., 2005; Ley et al., 2005; Ley et al., 2006). Conversely, the gut microbiota can influence obesity (Backhed et al., 2004; Ley et al., 2005). To determine if Nlrp12-deficiency caused microbiome changes during HFD, we profiled bacterial 16S rRNA genes in feces of WT and Nlrp12-/- mice fed HFD or LFD for 20 weeks (Figure 4J). HFD-fed WT mice showed a loss in bacterial diversity compared to LFD-fed WT mice. Nlrp12deficiency compounded by an HFD showed even more loss of colonic bacterial diversity (Figure 4K). Thus, Nlrp12 deficiency and HFD each led to a significantly altered microbiome composition as shown by a principal component analysis (PCA) and quantified by UniFrac dissimilarity distance (Figure 4, L-M).
To ensure that the observed differences in microbiome are not due to housing environment, we performed these same analyses on mice housed in a different vivarium a year later. This second set of HFD-fed Nlrp12-/- mice still showed more weight gain (Figure S5A), decreased bacterial diversity (Figure S5B) and a shift in the colonic microbiome (Figure S5, C-D), confirming the finding in a second vivarium.
Loss of intestinal bacterial diversity is reported to correlate with increased inflammation (Le Chatelier et al., 2013), and obesity is frequently accompanied by increased inflammation (Park et al., 2010; Park et al., 2005; Yudkin et al., 1999). The reduction of microbial diversity in Nlrp12-/- mice on HFD suggests an increased basal intestinal inflammation. Indeed, colon explants from Nlrp12-/- mice on HFD showed increased nuclear NF-κB p52, p-ERK, cleaved caspase-1 p-20 and mature IL1β when compared to WT mice on HFD (Figure 4N). The former also contained more antimicrobial peptides Reg3γ (regenerating islet-derived protein III-gamma) and CRAMP (cathelin-related antimicrobial peptides) (Figure 4N). Increased intestinal inflammation and NF-κB promote Reg3γ and CRAMP expression (Li et al., 2009; Wu and Chakravarti, 2007), which contribute to gut bacteria alteration (Vaishnava et al., 2011; Yoshimura et al., 2018). These data indicate that HFD increased colonic inflammatory signaling in Nlrp12-/- mice and increased antimicrobial peptides which may promote a dysbiotic microbiome.
To decipher if changes in gut microbiota preceded the onset of obesity, we collected fecal DNA from mice on HFD at earlier times (1week, 5 weeks and 15 weeks). Among WT mice, there was no significant diversity loss between 1-5 weeks of HFD but after 15 weeks of HFD treatment, there was a significant loss of diversity (Figure S6, AB). Nlrp12-/- mice showed a similar pattern, except overall there was more loss of diversity compared to WT mice at all three-time points. Furthermore, Clostridiales and Lachnospiraceae were significantly reduced and Erysipelotrichaceae was significantly increased in Nlrp12-/- mice compared to WT controls (Figure S6C), which correlated with an increased inflammation status in HFD-Nlrp12-/- mice from weeks 1 to 15 (Figure S6D). These results indicated altered bacterial groups in Nlrp12-/- mice were evident before the onset of overt obesity. We next transplanted fecal contents containing high proportion of Lachnospiraceae or fecal material with low proportion of Lachnospiraceae but high Erysipelotrichaceae into germ-free recipient mice followed by HFD (Figure S6E). After 20 weeks of HFD, fecal contents with higher proportion of Erysipelotrichaceae promoted weight gain, higher fasting glucose level (Figure S6, FG), and elevated intestinal inflammation from the colon (Figure S6H).
Cohousing with WT mice attenuates HFD-induced obesity in Nlrp12-/- mice
To determine if the altered microbiota in Nlrp12-/- mice contributes to excessive weight gain, we cohoused WT and Nlrp12-/- mice to achieve microbiota transfer by coprophagia (Henao-Mejia et al., 2012; Ridaura et al., 2013). Weaned age- and gendermatched WT and Nlrp12-/- were either single housed (SiHo) or co-housed (CoHo) at 8 weeks of age for another 20 weeks of HFD (Figure 5A). Control SiHo Nlrp12-/- mice showed significantly increased body weight (Figure 5B) and percentage weight gain (Figure 5C) compared to SiHo WT mice. In contrast, Nlrp12-/- mice cohoused with WT mice (CoHo Nlrp12-/-) showed similar body weight as SiHo WT and CoHo WT given HFD, and all were significantly leaner than SiHo Nlrp12-/- littermates (Figure 5, B-C). Moreover, CoHo Nlrp12-/- mice and CoHo WT cage-mates had similar GWAT and InWAT weights (Figure 5D) and percentage of body fat (Figure 5E).
Figure 5: Nlrp12-/- mice cohoused with WT mice show attenuated weight gain and inflammation with reduced dysbiosis.
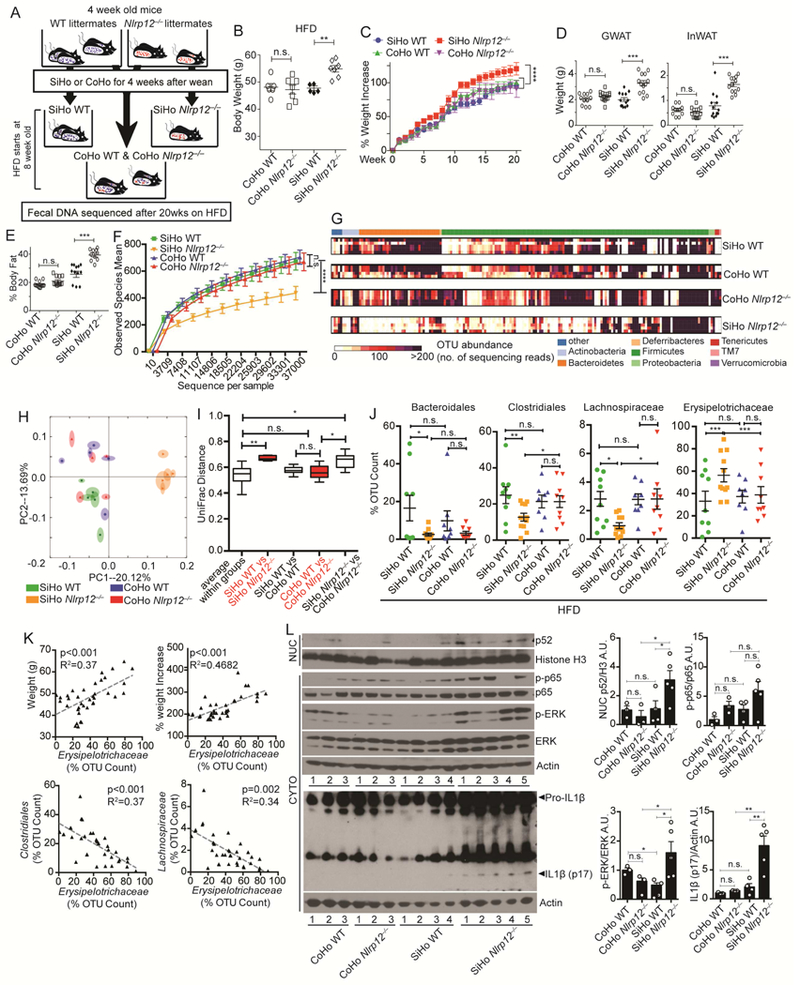
(A) Illustration of cohoused (CoHo) and singlehoused (SiHo) WT and Nlrp12-/- mice on HFD for 20 weeks with sequencing of fecal DNA. (B) Body weight and (C) percent weight increase of animals shown in (A) (CoHo WT, n=6; CoHo Nlrp12-/-, n=7; SiHo WT, n=5; SiHo Nlrp12-/-, n=7); (D) GWAT and InWAT weight, and (E) percentage body fat of SiHo and CoHo WT and Nlrp12-/- mice fed HFD for 20 weeks (CoHo WT, n=11; CoHo Nlrp12-/-, n=12; SiHo WT, n=12; SiHo Nlrp12-/-, n=13). (F) Bacterial diversity and (G) heatmap of OTU abundance of fecal microbiome from WT and Nlrp12-/- mice after 20 weeks on HFD; (H) PCA plot with (I) UniFrac distances showing microbiome compositional differences. (n=5/group). (J) Composite results of substantially changed bacterial groups identified by 2-way ANOVA from all sequenced fecal bacteria isolated from mice described in (A). (SiHo WT, n=9; SiHo Nlrp12-/-, n=11; CoHo WT, n=9; CoHo Nlrp12-/-, n=9). (K) Correlation analysis between Erysipelotrichaceae and weight gain or between Clostridiales and Lachnospiraceae in mice fed HFD (n=34). (L) Western blot analysis and densitometry of intestinal proteins from mice described in (A) (CoHo WT, n=3; CoHo Nlrp12-/-, n=3; SiHo WT, n=4; SiHo Nlrp12-/-, n=5). Each lane or symbol represents one mouse. Error bars show SEM, *p<0.05, **p<0.01, *** p<0.001, **** p<0.0001 and n.s. means no significance determined by Student’s t test (C, F, I) and one-way ANOVA (B, D, L).
To investigate changes in the microbiota after cohousing, 16S rRNA gene sequencing analysis was performed on fecal DNA from SiHo or CoHo WT and Nlrp12-/- mice fed HFD. Fecal samples from SiHo Nlrp12-/- mice showed significantly reduced microbial diversity (Figure 5F) compared to SiHo WT and CoHo animals, which agreed with the heat map of bacterial operational taxonomic units (OTUs) (Figure 5G). This is supported by PCA (Figure 5H) and the UniFrac distance metric (Figure 5I). Two-way ANOVA revealed an increased abundance of the Erysipelotrichaceae family but reduce Bacteroidales and Clostridiales orders and Lachnospiraceae family in the SiHo Nlrp12-/- mice compared to SiHo WT mice. A comparison of cohoused Nlrp12-/- and WT mice showed no difference in these bacteria (Figure 5J). These observations suggest a strong association of Erysipelotrichaceae with HFD-induced-obesity in mice. Indeed, the abundance of Erysipelotrichaceae was negatively correlated with Clostridiales and Lachnospiraceae (Figure 5K), raising the possibility that these latter bacterial groups have the potential to reduce Erysipelotrichaceae and obesity. CoHo Nlrp12-/- mice show attenuated nuclear p52, p-ERK and IL1β compared to SiHo Nlrp12-/- littermates (Figure 5L). These data indicate that the microbiota contribute to increased obesity, immune activation and IL1β maturation in Nlrp12-/- mice.
Lachnospiraceae maintains microbiota diversity, limits intestinal inflammation and reduces obesity in Nlrp12-/- mice on HFD
We next performed mono-association experiment to determine if Lachnospiraceae could attenuate the dysbiotic microbiome and weight gain in Nlrp12-/- mice. A mixture of 23 Lachnospiraceae isolated from WT mice fed normal chow (Chen et al., 2017) was delivered to WT and Nlrp12-/- mice by oral gavage three weeks prior to HFD feeding and throughout the duration of HFD feeding. Control littermates received the brain heart infusion (BHI) medium in which the bacteria were grown (Figure 6A). Profiling of bacterial 16S rRNA in the fecal material collected from Lachnospiraceae-fed Nlrp12-/- mice on HFD revealed an increase in microbiota diversity (Figure 6B) with a significant increase in the abundance of Clostridiales, but not Bacteroidales (Figure 6C). As expected, there was a significant increase of Lachnospiraceae in mice given Lachnospiraceae compared to BHI-treated littermates. Among all sequenced bacterial groups, only Erysipelotrichaceae was significantly decreased after Lachnospiraceae administration in Nlrp12-/- and WT mice on HFD. HFD-fed Nlrp12-/- mice treated with the BHI had greater activation of NF-κB, MAPK and inflammasome pathways, while Lachnospiraceae dampened these inflammatory pathways to a similar level as WT mice in both small intestine and colon (Figure S7). HFD-fed, Lachnospiraceae-treated Nlrp12-/- mice had significantly reduced percentage of weight increase and percentage of body fat (Figure 6, D-E), reduced fasting glucose levels, improved glucose metabolism as measured by OGTT and ITT (Figure 6, F-H), and increased insulin sensitivity marked by increased p-AKT in the liver, muscle and WAT (Figure 6I) compared to BHI-fed controls. Lachnospiraceae significantly reduced fasting glucose, OGTT and WAT insulin insensitivity in WT mice (Figure 6F, G, I).
Figure 6: Treatment with SCFA-producing Lachnospiraceae or SCFA ameliorates weight gain.
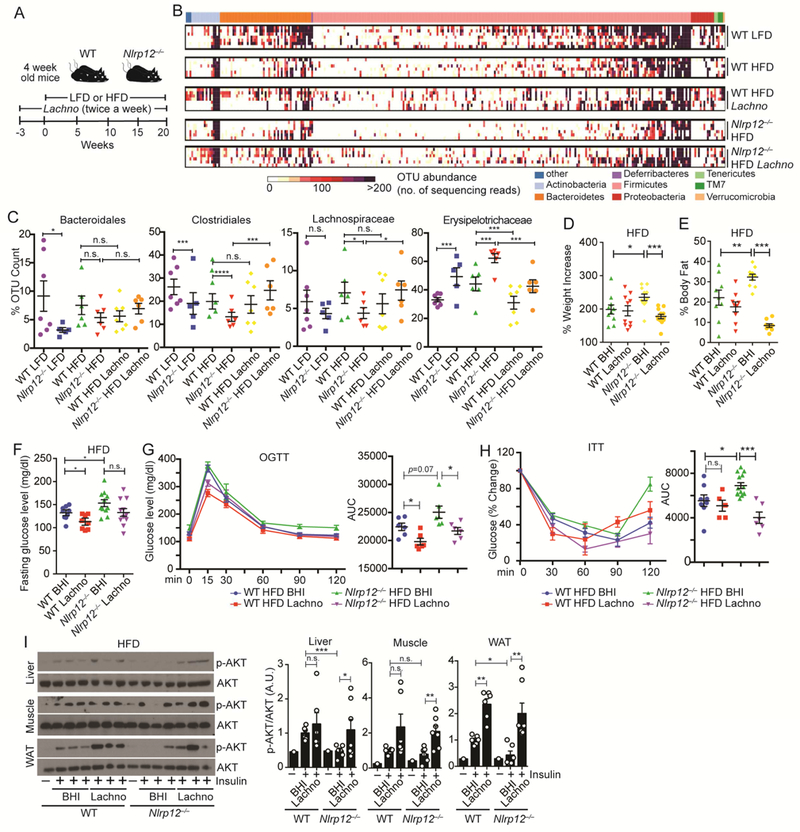
(A) Schematic of Lachnospiraceae (Lachno) vs. control (BHI) treatment of WT and Nlrp12-/- mice on LFD or HFD. (B) Heatmap of OTU abundance indicating bacterial diversity and (C) relative abundance of substantially changed bacterial groups identified by 2-way ANOVA on sequenced bacteria in fecal samples from mice in (A) (WT LFD, n=7; Nlrp12-/- LFD, n=5; WT HFD, n=6; Nlrp12-/- HFD, n=6; WT HFD Lachno, n=7; Nlrp12-/- HFD Lachno, n=6). (D) Percent weight increase and (E) percent body fat of WT and Nlrp12-/- mice in (A), (n=10/groups). (F) Fasting glucose levels (WT HFD, n=9; Nlrp12-/- HFD, n=11; WT HFD Lachno, n=9; Nlrp12-/- HFD Lachno, n=11), (G) OGTT (n=6/group) and (H) ITT (WT HFD, n=8; Nlrp12-/- HFD, n=13; WT HFD Lachno, n=5; Nlrp12-/- HFD Lachno, n=6) of HFD-fed mice with Lachno or BHI. (I) Representative western blots and composite densitometry of p-AKT in liver, muscle and WAT following treatment of 0.7 U/kg of insulin (n=6-7/group). Each lane or symbol represents one mouse. Error bars show SEM, *p<0.05, **p<0.01, *** p<0.001, **** p<0.0001 and n.s. means no significance determined by one-way ANOVA (D-I).
Clostridiales and Lachnospiraceae bacterial groups produce short chain fatty acids (SCFAs) via fermentation of dietary polysaccharides (Atarashi et al., 2013; den Besten et al., 2013; Reichardt et al., 2014). Increased abundance of Lachnospiraceae is expected to enhance the capability to produce SCFA, and using samples produced in the experiment depicted in Figure 6A, Lachnospiraceae mixture produced SCFA butyrate and propionate, but not isobutyrate compared to the BHI medium (Figure 7A). Dietary hexose and fucose can be used to generate SCFAs, propionate by three independent pathways: succinate, acrylate and propanediol pathways (Figure 7B). Key enzymes from bacteria that are important in these pathways include mmdA encoding methylmalonyl-CoA decarboxylase for the succinate pathway, lcdA, encoding lactoylCoA dehydratase for the acrylate pathway, and pduP encoding propionaldehyde dehydrogenase for the propanediol pathway. Additionally, BCoAT encoding butyryl-CoA transferase is essential for butyrate biosynthesis. Reduced expression of these enzymes correlates with reduced propionate and butyrate (Reichardt et al., 2014). The colonic microbiota from Nlrp12-/- on HFD showed significantly reduced copy numbers of these genes compared to similarly-treated WT mice, while Lachnospiraceae treatment significantly increased these genes (Figure 7B). Since Lachnospiraceae produced SCFA and also mitigated obesity in Nlrp12-/- mice, we assessed if SCFA could limit HFD-induced obesity in the Nlrp12-/- mice. Propionate and butyrate were given to WT and Nlrp12-/- mice on LFD or HFD via their drinking water ad libitum. Both WT and Nlrp12-/- mice given propionate and butyrate gained significantly less weight than controls (Figure 7, C-D), indicating that SCFA can prevent weight gain (Lin et al., 2012). Since, butyrate and propionate are bitter tasting, we monitored and found that SCFAsupplemented water did not affect food- and water-intake (Figure 7, E-F). Next, we tested if SCFA might reverse inflammatory pathways that are hyper-activated in Nlrp12-/-mice. We examined the impact of SCFA on macrophage inflammation by pretreating bone-marrow-derived macrophages (BMDMs) with butyrate or propionate, followed by a bacterial ligand, LPS. Dose and kinetic analyses were performed. Both butyrate (Figure 7, G-H) and propionate (Figure 7, I-J) suppressed proinflammatory-signaling pathways activated by LPS, including p-p65 and p-STAT3, and pro-IL1β production. To examine the impact of propionate and butyrate on inflammasome activation, we employed a typical inflammasome activation protocol using LPS pretreatment followed by nigericin. The addition of propionate or butyrate before LPS priming reduced pro-ILβ levels, which resulted in reduced mature IL1β (Figure 7K). We next tested the effect of SCFA on inflammasome activation by adding propionate or butyrate after LPS priming, with an HFD-relevant inflammasome activator, palmitate, the most abundant saturated-fatty acid in HFD (Wen et al., 2011). The addition of butyrate and/or propionate after LPS priming and during palmitate treatment reduced mature IL1β (Figure 7L). Collectively, these data indicate that SCFA-produced from bacteria such as Lachnospiraceae limited obesity in Nlrp12-/- mice, and reduced macrophage inflammation.
Figure 7: SFCA reduces obesity and immune signaling activation.
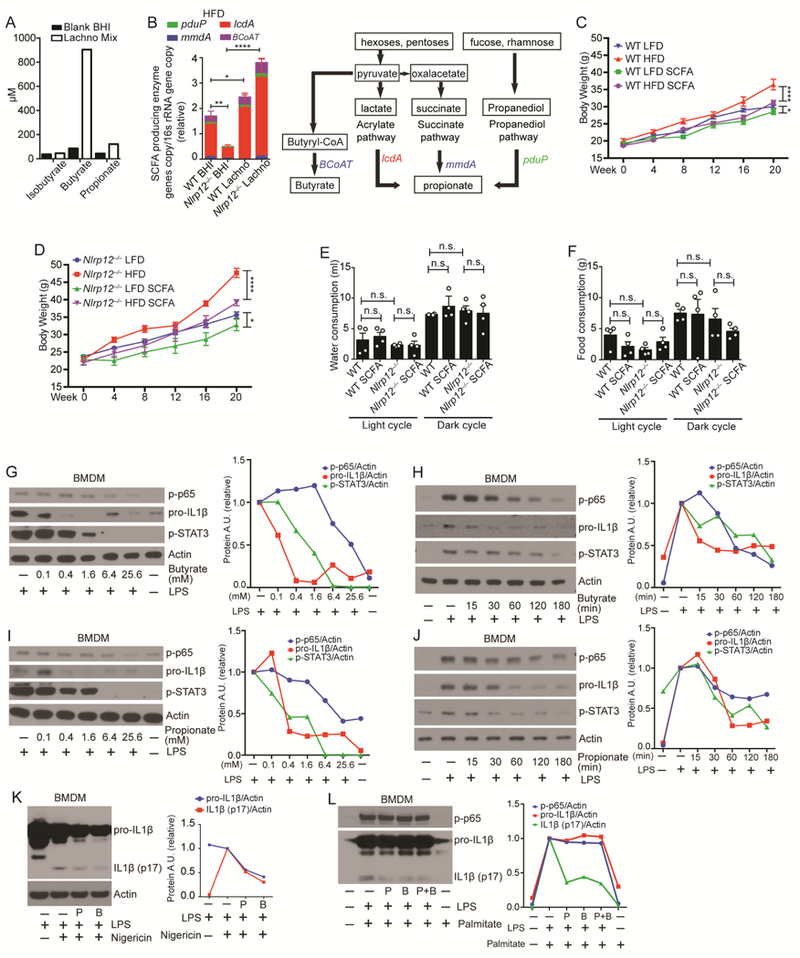
(A) Isobutyrate, butyrate and propionate production by Lachno cultures determined by mass spectrometry. (B) Relative genomic DNA copy number of the key enzymes of propionate and butyrate synthesis normalized to total bacterial 16S rRNA gene copy number in the feces from mice treated with Lachno or BHI (WT Lachno, n=9; Nlrp12-/- Lachno, n=9; WT BHI, n=19; Nlrp12-/- BHI, n=17). Schematic of SCFA propionate and butyrate synthesis pathways utilized by bacteria. (C) Body weight of WT and (D) Nlrp12-/- mice on LFD vs. HFD treated with or without 200mM of propionate and butyrate (SCFAs) in the drinking water (n=5/group). (E) Water and (F) food consumption of WT and Nlrp12-/- mice given HFD with or without SCFAs, and each symbol represents one mouse (n=4/group). (G-J) Dose and kinetic analysis of WT BMDMs pretreated with propionate (P) or butyrate (B) followed by LPS (100 ng/ml) stimulation. Levels of proIL1β, p-p65 and p-STAT3 were measured by western blot analysis with densitometry. (K) Western blot analysis of pro-IL1β, IL1β (p17) and p-p65 in WT BMDMs untreated or treated with 6.4mM of P or B for 1hr followed by 100 ng/ml of LPS and 1μM of nigericin stimulation. (L) Western blot analysis of pro-IL1β, IL1β (p17) and p-p65 in WT BMDMs primed with LPS for 3hr, followed by a 24hr stimulation with 0.2mM of palmitate with or without P or/and B. Error bars show SEM, *p<0.05, **p<0.01 **** p<0.0001 and n.s. means no significance determined by Student’s t test.
Discussion:
This study provides compelling evidence that NLRP12 restrains diet-induced obesity and maintains an intestinal microbiota that lessens the impact of HFD on obesity and inflammation. HFD-fed Nlrp12-/- harbored a deficiency of the Clostridiales order and Lachnospiraceae family. Low abundance of these bacteria has been proposed as markers for increased intestinal inflammation in pediatric and inflammatory bowel diseases (Gevers et al., 2014) but its reduction has not been directly studied in obesity. In addition, these bacteria were described as major producers of anti-inflammatory SCFA (Atarashi et al., 2013; Reichardt et al., 2014; Smith et al., 2013). This study shows the importance of Lachnospiraceae and SCFA, since reconstitution with either prevented excessive weight gain in HFD-fed Nlrp12-/- mice. Lachnospiraceae also suppressed activation of proinflammatory pathways documented to exacerbate obesity and elevated glucose levels, including increased TNF, IL6, inflammasome activation and M1 polarization.
One finding of the Lachnospiraceae treatment during obesity is that it reduced Erysipelotrichaceae. Erysipelotrichaceae has been correlated with increased TNF, resulting in chronic intestinal inflammation (Dinh et al., 2015) and its abundance was found to be enhanced in IBD patients and animal models of IBD (Chen et al., 2012; Dey et al., 2013) with one exception (Gevers et al., 2014). By contrast, Erysipelotrichaceae has been consistently associated with obesity (Fleissner et al., 2010; Ley et al., 2005), which is supported by our finding. Fecal transplantation in the germ-free mice showed that the fecal content enriched with Erysipelotrichaceae promoted more inflammation and obesity, while Lachnospiraceae reduced these two parameters. Thus, Erysipelotrichaceae may represent a potential target for treating obesity, while Lachnospiraceae administration represents a potential strategy to reduce Erysipelotrichaceae and the associated weight gain.
This study also reveals that NLRP12 inhibits obesity-associated inflammasome activation. Adipose tissue fibrosis that accompanies obesity generates substantial damage-associated molecular patterns (DAMPs) that activate the inflammasome during adipogenesis (Divoux et al., 2010; Khan et al., 2009), and elevated IL1β was shown to promote obesity (Vandanmagsar et al., 2011; Wen et al., 2011). With one exception (Henao-Mejia et al., 2012), other studies showed that deficiencies in various inflammasome components including Nlrp3, Asc and Casp1 caused less weight gain with a HFD (Stienstra et al., 2011; Vandanmagsar et al., 2011). This agrees with our finding of elevated intestinal IL1β in obese HFD-fed Nlrp12-/- mice.
In summary, this study reveals that NLRP12 is an important promoter of bacteria such as Lachnospiraceae and negative regulator of inflammatory response to mitigate obesity and obesity-associated diseases. Nlrp12 maintained intestinal SCFA-producing bacteria prevented excessive inflammation, obesity and obesity-associated diseases.
STAR METHOD
CONTACT FOR REAGENT AND RESOURCE SHARING
Further information and requests for resources and reagents should be directed to and will be fulfilled by the Lead Contact, Jenny P-Y Ting (jenny_ting@med.unc.edu).
EXPERIMENTAL MODEL AND SUBJECT DETAILS
Human subjects:
Subcutaneous adipose tissues were obtained from 70 donors (38 female, 28 male and 4 unreported gender participants, age 40-68, BMI 20.8-39.7) (Ballak et al., 2014). All subjects signed informed consent and the studies were approved by the ethical committee of the Radboud University Medical Centre, Nijmegen. Patients’ samples were completely deidentified during the experiments and thus, researchers were blinded to the information of donors. Some measurements were not carried out in all subjects.
Animals:
Ethics statement and husbandry:
All animal studies were conducted in accordance with NIH guide for the Care and Use of Laboratory Animals. All experiments were approved and overseen by the Institutional Animal Care and Use Committee (IACUC) at UNC under Protocol ID 17072. Mice were housed in microisolator cages with no more than 5 mice per cage at certified specific-pathogen-free or germ-free vivaria. Animals had access to autoclaved water and food ad libitum. Apart from a standard chow, mice were specifically described as receiving an HFD (Research Diets, D12451) (45% energy from fat, 35% from carbohydrates and 20% from protein) or a control LFD (Research Diets, D12450B) (10% energy from fat, 70% from carbohydrates and 20% from protein). Age and sex matched WT and Nlrp12-/- mice were put on special diets at the age of 8 weeks and were monitored during the diet-induced obesity development.
Nlrp12-/- mice have been described previously (Allen et al., 2012a; Allen et al., 2012b; Arthur et al., 2010). WT and Nlrp12-/- mice in this study were generated from common Nlrp12+/- parents, which were obtained from at least 9 generations backcross to WT C57BL/6J mice and were bred in house for several generations. All experiments used littermate controls, or their immediate descendants. Germ-free mice were derived by sterile embryo transfer by the National Gnotobiotic Rodent Resource Center at UNC- Chapel Hill (Chen et al., 2017).
Genotyping:
Nlrp12flox/flox mice were generated at UNC Animal Models Core using a targeting construct, which contained loxP sites flanking exon 3 of Nlrp12, next to an FRT flanked neomycin resistance cassette inserted in the intron 2. Targeted ES cells were injected into C57BL/6-albino blastocysts. The resulting male chimeras were mated with female Rosa26-Flpe mice on a C57BL/6-albino background to create heterozygous Nlrp12flox/+ mice and remove the neomycin cassette. The Nlrp12flox/+ mice were then bred with C57BL/6 mice for at least another seven generations before being inbred with heterozygous Nlrp12flox/+ mice to get the Nlrp12flox/flox mice. To generate myeloid-specific Nlrp12 KO (Nlrp12flox/flox, LysM-Cre+) mice, Nlrp12flox/flox mice were crossed with LysMCre mice (The Jackson Laboratory) for the F1 generation. And Nlrp12flox/flox LysM-Cre+ and Nlrp12flox/flox LysM-Cre- (control) littermates from the F2 generation were used for future breeders or experiments.
METHOD DETAILS:
Antibiotic treatment, cohousing studies, Lachnospiraceae and SCFA administration:
For antibiotic treatment (Abx), mice received a mixture of antibiotics (0.17g/L of gentamicin, 1g/L bacitracin, 2g/L of streptomycin and 0.125mg/L of ciprofloxacin) (Chen et al., 2008) in drinking water ad libitum one week before the special diet feeding. Antibiotics were replaced twice a week for 20 weeks along with the special diet feeding.
For the cohousing study, 3-4 weeks old WT mice born from the same breeders were divided for either single housing (SiHo) or cohousing (CoHo) with age- and sexmatched Nlrp12-/- mice (1:1) for 4-5 weeks before starting the LFD/HFD. Cohoused mice were compared to their single-housed littermates as controls.
For Lachnospiraceae treatment, mice were orally gavaged with a mixture containing 23 sequenced Lachnospiraceae stains (~108 bacteria) (Chen et al., 2017) in the culture medium consisting of brain-heart infusion broth (BHI) supplemented with 5% FBS, 0.01% L-cysteine and 1% corn starch twice a week for 3 weeks before the special diet feeding. Plain BHI medium was used as vehicle control. Mice continually received the mixture twice a week for 20 weeks along with the LFD/HFD.
For SCFA treatment of mice, a cocktail of 200mM propionate (Sigma) and butyrate (Sigma) were given to mice in the drinking water accompanied with the HFD feeding.
For fecal contents transplant experiments, we transplanted the feces collected from lean WT mice with high relative abundance of Clostridiales and Lachnospiraceae but low Erysipelotrichaceae, compared to the feces from obese Nlrp12-/- mice with low abundance of Clostridiales and Lachnospiraceae but high amount of Erysipelotrichaceae, identified by 16S sequencing. Fresh collected feces were diluted in the saline at the ratio of 40mg feces/ml saline and homogenized by a sterile blender. The insoluble particles were removed by passing the mixture through a laboratory stainless sieve. Total bacterial protein concentration was determined by BCA assay to normalize the amount of bacterial cell. The feces mixtures were mixed with 10% autoclaved glycerol, aliquoted and frozen at −80 °C until used. We oral-gavaged the 67 weeks old germ-free mice with 200μl feces mixture for 3 times in 2 weeks before HFD feeding. During the 20 weeks of HFD, the recipients’ cages were replaced by the used cages of the fecal donors once a week.
Oral glucose tolerance test (OGTT) and insulin tolerance test (ITT):
We performed OGTT and ITT on mice fed LFD/HFD for 20 weeks. The mice were fasted for 10-12 (overnight) hours before the experiment. Fasting glucose level were measured, followed by ITT and OGTT. For ITT, fasted mice were intraperitoneally injected with insulin (Lantus) (0.7 U/kg body weight, SANOFI, USA). For OGTT, fasted mice were oral-gavaged with 20% (w/v) glucose solution (2 g/kg body weight, Sigma). Glucose levels were measured using a glucometer (Freestyle, Abbott, USA) at the indicated time point.
Body composition, indirect calorimetry, food and water intake, and activity measurement:
Mouse body composition (fat and lean mass) was measured using a mice wholebody composition analyzer (Bruker) at the UNC Nutrition Obesity Research Center. Total body mass was measured by standard laboratory scales.
WT and Nlrp12-/- animals were placed into individual metabolic cages (TSE Systems International Group, Chesterfield, MO) at UNC Nutrition Obesity Research Center. Respiratory Exchange Ratio (RER), heat production and energy expenditure (EE) were measured. EE was normalized to the mice body mass. Activity was measured as total beam breaks (x+y+z axis) within the cage. Mice had free access to food and water while in the chamber. Food and water intake were measured for the duration of studies. Animals were under indirect calorimetry measurements for 72h.
Histological staining, western blot and ELISA:
For histopathology, organs were collected in 10% formalin. Tissue sections were prepared from paraffin blocks and stained with hematoxylin and eosin (H&E) or F4/80 antibody (Ebiosciences 14-4801-82). F4/80 positive staining or liver steatosis area was quantified by ImageJ and displayed as % to total (stained + non-stained) area.
For western blot analysis, the following primary antibodies were used for western blot analysis: anti-CASPASE1 (4D4) (Genentech); anti-IL1β (cat. AF-401-NA) (R&D systems); anti-pp65 (Ser536) (93H1) (cat. no. 3033); anti-p-ERK1/2 (Thr202/Tyr204) (D13.14.4E) (cat. no. 4370); anti-p65 (D14E12) (cat. no. 8242) (Cell signaling); antiREG3G (cat. no. ab198216, Abcam); anti-CRAMP (G1) (cat. no. sc-166055), anti-p52 (C-5) (cat. no. sc-7386); anti-ERK1 (C-16) (cat. no. sc-93); anti-ERK2 (C-14) (cat. no. sc-154) and anti-Actin-HRP (C-11) (cat. no. sc-1615) (Santa Cruz Biotechnology); and anti-Histone H3 (cat. no. 07-690) (Millipore). Goat anti-rabbit-IgG HRP (cat. no. 111035-144), goat anti-mouse-IgG HRP (cat. no. 115-035-146) and rabbit anti-goat-IgG HRP (cat no. 305-035-045) (Jackson Immune Research Laboratories) were used as secondary antibodies. Protein densitometry was quantified by Image J software. In Figure 4N, the composite densitometry of p-p65/p65, p-ERK/ERK, and nuc p52/H3 for HFD WT and Nlrp12-/- mice, includes the data in Figure S4A.
IL6 and TNF was measured using ELISA assays according to manufacturer’s instructions from BD Bioscience (cat# 555240 for IL6, cat# 560478 for TNF). For colon secreted cytokines, excised colons were flushed with PBS containing penicillin/streptomycin. The distal-most 1cm2 colon sections were cultured for 15hrs in RPMI media containing penicillin/streptomycin. Supernatants from these cultures were removed, cleared of debris by centrifugation and assessed for cytokines by ELISA.
RNA isolation and mRNA analysis:
For mRNA detection, total RNA was extracted from GWAT lysate using Qiazol (Qiagen). cDNA was generated from the total RNA by using iScript™ cDNA Synthesis Kit (Cat. 170-8891, Bio-Rad Laboratories, Inc.). Quantitative RT-PCR was performed on a ViiA™ 7 Real-Time PCR System. Taqman probes (Table S1) including mouse Il6, Mcp 1, Tnfa, Gapdh and Actb were used for mRNA detection. Mouse Nlrp12 was detected using a primer set: F: AATAATGGTCTATGCCTTTTTGAGA, R:CGGACATAGTCTTTGTAGGTTGTCT.
Flow cytometry analysis for adipose tissue macrophages from Gonadal Adipose Tissues:
Stromal vascular cells (SVCs) were prepared from gonadal adipose tissues as previously described (Cho et al., 2014; Orr et al., 2013). Briefly, the gonadal adipose tissues were resected from mice, and mechanically dissociated into fine pieces by a surgical blade, and then treated by 1mg/ml collagenase II (Sigma) in digestion buffer (HBSS with 0.5% BSA, 10mM EDTA) for 30min in a 37°C shaking incubator (200 rpm). The SVCs suspension was washed with FACS buffer and centrifuged at 4°C (1,200 rpm). Red blood cells were removed with ACK lysing buffer. The remaining cells were washed and counted for FACS staining.
SVCs suspensions from adipose tissue were re-suspended in FACS buffer on ice during the staining process. Cells were firstly stained with anti-CD16/32 (Fc block) (clone# 93)(cat no. 14-0161-81, eBioscience), followed with antibodies targeting cell surface molecules: CD45.2-PerCP-Cy5.5 (clone# 104) (cat no. 45-0454-80, eBioscience), CD11b-e450 (clone# M1/70) (cat no. 48-0112-82, eBioscience), F4/80-PE (clone# BM8) (cat no. 123109, Biolegend), CD11c-PE-Cy7 (clone# N418) (cat no. 25-0114-81, eBioscience) and CD301-Alexa Fluor 647 (clone# ER-MP23) (cat no. MCA2392, Bio-Rad). All cells were collected using LSRII (BD Biosciences) flow cytometer or MoFlo (Beckman Coulter) cell sorter. To gate adipocyte tissue macrophages (ATMs), cell aggregates and cellular debris were first excluded, then adipose tissue leukocytes (CD45.2+) were selected. ATMs were identified as F4/80highCD11bhigh to minimize contamination by eosinophils and neutrophils, according to a previous report (Cho et al., 2014). Finally, CD45+F4/80highCD11bhigh ATMs were gated for surface expression of CD11chiCD301lo (M1 subset) and CD11chiCD30lo (M2 subset). All data were analyzed using FlowJo software (Tree Star).
Fecal DNA isolation, propionate-producing enzyme copy number measurement and 16S rRNA gene microbiome sequencing:
Fecal samples were collected from live mice, snap-frozen and stored at −80°C. DNA was isolated by incubating fecal material at 65°C for 30min in Lysing Matrix E tubes (MP Biomedicals) containing 200mM NaCl, 100mM Tris, 20mM EDTA (pH 8.0), SDS and proteinase K (Qiagen). Phenol:Chloroform:Isoamyl alcohol (25:24:1) (Invitrogen) was added, and the samples were homogenized at 4°C for 3min using a bead beater homogenizer. The samples were centrifuged at 8000 rpm for 3min at 4°C, and the supernatant was incubated with equal volume of Phenol:Chloroform:Isoamyl alcohol for 10 min at room temperature. The samples were centrifuged at 13,000rpms for 5min at 4°C, and the aqueous phase was incubate d with isopropanol and 3M sodium acetate, pH 5.2, at −20°C for 15hrs to precipitate DNA. The precipitated DNA was collected by centrifugation at 13000rpm at 4°C for 20min, washed twice with 100% cold ethanol and resuspended in TE buffer. The DNA was further purified using a DNeasy Blood and Tissue Kit (Qiagen) according to the manufacturer’s protocol.
Fecal DNA samples were amplified by PCR using barcoded primer pairs targeting the V3-V4 region of the 16S gene. PCR amplicons were sequenced using the Mi-Seq Illumina sequencer. The resulting bacterial sequence fragments were clustered into Operational Taxonomic Units (OTUs) and aligned to Greengenes microbial gene database with 97% sequence similarity in QIIME. Bacterial taxonomy summarization, rarefaction analyses of microbial diversity, compositional differences (dissimilarity value indicated by Unweighted UniFrac Distance) were calculated in QIIME (1.8.0) as previously described using scripts (including pick_open_reference_otus.py, summarize_taxa.py, alpha_rarefaction.py, jackknifed_beta_diversity.py and make_distance_boxplots.py). PCoA plots were generated by QIIME script, make_2d_plots.py. Each point represents one mouse, and the ellipses represent the interquartile range (IQR) during the rarefaction analyses (see http://www.wernerlab.org/teaching/qiime/overview for scripts details). All 16S rRNA microbiome sequences have been deposited in the European Nucleotide Archive (http://www.ebi.ac.uk/ena), see data accessibility section for accession number.
To examine the distribution of three different pathways (succinate, acrylate and propanediol pathway) used by bacteria for propionate formation and Butyryl-CoA transferase for butyrate formation, we measured the genomic copy number of the specific key enzymes in each pathway by qPCR with reported primer sets (lcdA-F: 5′-CTGGTGTGCTGGWSIGCIWSIGTIGCNCC-3′, -R: 5′CAGATAGGTCCAIAYIGCDATNCCYTCCCA-3′; pduP-F: 5′-GTGGATGARACIGGIATGGGNAAYGTNGG-3′, -R: 5′CAATAGCCYTCICCICCRAAICCIADNGC-3′; and mmdA-F: 5′-AATGACTCGGGIGGIGCIMGNATHCARGA-3′, -R: 5′-GATTGTTACYTTIGGIACNGTNGCYTC-3 (Reichardt et al., 2014). And bcoat-F: 5’-GCIGAICATTTCACITGGAAYWSITGGCAYATG-3’, -R: 5’-CCTGCCTTTGCAATRTCIACRAANGC-3’). Copy numbers were normalized to the bacterial total 16S rRNA gene copy number detected by a universal primer set (16S rRNA-F: 5′-AGAGTTTGATYMTGGCTCAG-3′, -R: 5′-ACGGCTACCTTGTTACGACTT3′). The qPCR was performed using SensiFAST™ SYBR® No-ROX Kit (Bioline) per manufacturing instructions with fecal DNA (200ng for enzyme gene and 10ng for 16S rRNA gene) and 100nM of each primer, at 95°C for 3m in, followed by 40 cycles at 95°C for 30s, 56°C for 30s, 72°C for 40s (1min for lcdA, 2min for 16S rRNA gene) and a final extension at 72°C for 5min (10min for 16S rRNA gene )
Short chain fatty acids (SCFA) treatment of BMDM or mice:
WT bone marrow-derived macrophages (BMDM) were pretreated with short chain fatty acid with increased concentrations (0, 0.1, 0.4, 1.6, 6.4 or 25.6mM) for 1hr, followed by 100ng/ml of LPS stimulation for 30min. Also, the BMDM cells were pretreated with 6.4mM of SCFA for 0, 15, 30, 60 and 120min, followed by 100ng/ml LPS stimulation for 30min. To assay SCFA suppression of mature IL1β production, BMDM cells were pretreated with 6.4mM SCFA for 1hr, followed by 100ng/ml of LPS stimulation for 30 min and then 1μM nigericin for 30 min. To assay SCFA suppression on IL1β cleavage caused by palmitate, WT BMDM cells were primed with 100ng/ml LPS for 3h and followed by 0.2mM palmitate-BSA complex for 24hrs with or without SCFA. The palmitate-BSA complex was prepared per previously described (Wen et al., 2011).
RNA-seq, ChIP-seq and microarray data analysis:
Raw RNA-sequencing and ChIP-sequencing data for untreated and LPS activated human primary CD14+ monocytes were obtained from public dataset: GSE100383 (Park et al., 2017) and GSE85243 (Novakovic et al., 2016). Microarray data for CD11c+ and CD11c- adipose tissue macrophage isolated from WT mice was obtained from public dataset: GSE53403 (Xu et al., 2013). All public datasets were archived in the NCBI GEO database. The raw sequence data was analyzed by Galaxy (usegalaxy.org). Bowtie 2 was used to align the sequence reads to human reference genome (ver.hg19), and MACS 2 was used for peaks identification. Integrated genome browser (IGB) from BioViz was used to generate the peak distribution plots. For microarray data, raw array data was analyzed by Genespring GX (Agilent), and heatmap was generated by Gene-E (Broad Institute). Human NLRP12 expression plots were obtained from dataset: “GeneAtlas U133A, gcrma, Pubmed ID: 15075390” archived and analyzed by www.biogps.org(Wu et al., 2016).
QUANTIFICATION AND STATISTICAL ANALYSIS:
Data were shown as mean ± SEM, and “n” representing the number of animals used in the in vivo experiment were indicated in figure legends. For in vitro experiments that included samples taken from the mice model, “n” represents the number of animals to generate those samples. For all data, one dot or lane represents one mouse. Linear fitting and normalization were performed in GraphPad Prism, and Spearman correlation tests were used to determine the significance of association between NLRP12 mRNA expression and multiple obesity-related indexes. If not specified in the figure legends, statistical significance between two groups was determined by unpaired, two-tailed Student’s t test, and significance between more than two groups were determined using one-way ANOVA with Fisher’s LSD test using GraphPad Prism with default parameter based on experience. Error bar represents mean ± SEM with *p<0.05, **p<0.01, ***p<0.001, ****p<0.0001 and n.s. means no significance.
DATA AND SOFTWARE AVAILABILITY
The 16s microbiome sequencing data for the microbiome study of co-housing and Lachno transferring study in vivarium 1 and 2 are deposited in the European Nucleotide Archive under the accession number: PRJEB26984, PRJEB26985, PRJEB26986. The 16s sequencing data for microbiome of WT and Nlrp12-/- mice at 1, 5 or 15 weeks of HFD in vivarium are deposited in the European Nucleotide Archive under the accession number: PRJEB19754. Data source for Figure 2A, and G, are obtained from NCBI GEO database under the accession number: GSE100383, GSE85243 and GSE53403. Dataset for Figure S4 is obtained from BIOGPS.ORG (http://biogps.org/#goto=genereport&id=91662). The data and the codes of this study are available from the corresponding author upon reasonable request.
Supplementary Material
High lights:
NLRP12 expression is reduced in the adipose tissue of humans with increased obesity.
Nlrp12-/- mice show increased weight-gain and adipose tissue inflammation
Nlrp12-mediated protection from obesity and inflammation is microbiota dependent
Lachnospiraceae and short chain fatty acids mitigate obesity and insulin resistance
Acknowledgements:
We thank the UNC Center for Gastrointestinal Biology and Disease (CGIBD), the Microbiome Core Facility and the National Gnotobiotic Rodent Resource Center (supported by NIH P40 OD010995, P30-DK34987 and the Crohn’s and Colitis Foundation). This project is supported by NIH grants CA156330 and AI029564 (JPYT), P01-DK0947795 (JPYT and RBS), T32-DK007737-19 and F-F32-DK098916-02 (ADT), and Grants from Nutrition Obesity Research Center P30DK056350, American Cancer Society PF-13-401-01-TBE (JEW), CA156330 (AAK), T32-CA009156 (UNC-ITCMS, AAK and JWT), NMSS FG 1968-A-1 (WCC), NCI F99/K00 F99CA223019 (NC), ERC Consolidator grant (#310372)(MGN) and a Spinoza grant of the Netherlands Organization for Scientific Research. The LCCC Animal Histopathology Core was supported in part by an NCI Center Core Support Grant (CA16086).
Footnotes
Declaration of Interests
The authors declare no competing conflicts of interest.
Publisher's Disclaimer: This is a PDF file of an unedited manuscript that has been accepted for publication. As a service to our customers we are providing this early version of the manuscript. The manuscript will undergo copyediting, typesetting, and review of the resulting proof before it is published in its final citable form. Please note that during the production process errors may be discovered which could affect the content, and all legal disclaimers that apply to the journal pertain
References:
- Allen IC, Lich JD, Arthur JC, Jania CM, Roberts RA, Callaway JB, Tilley SL, and Ting JP (2012a). Characterization of NLRP12 during the development of allergic airway disease in mice. PloS one 7, e30612. [DOI] [PMC free article] [PubMed] [Google Scholar]
- Allen IC, Wilson JE, Schneider M, Lich JD, Roberts RA, Arthur JC, Woodford RM, Davis BK, Uronis JM, Herfarth HH, et al. (2012b). NLRP12 suppresses colon inflammation and tumorigenesis through the negative regulation of noncanonical NFkappaB signaling. Immunity 36, 742-754. [DOI] [PMC free article] [PubMed] [Google Scholar]
- Amano SU, Cohen JL, Vangala P, Tencerova M, Nicoloro SM, Yawe JC, Shen Y, Czech MP, and Aouadi M (2014). Local proliferation of macrophages contributes to obesityassociated adipose tissue inflammation. Cell Metab 19, 162-171. [DOI] [PMC free article] [PubMed] [Google Scholar]
- Arthur JC, Lich JD, Ye Z, Allen IC, Gris D, Wilson JE, Schneider M, Roney KE, O’Connor BP, Moore CB, et al. (2010). Cutting edge: NLRP12 controls dendritic and myeloid cell migration to affect contact hypersensitivity. J Immunol 185, 4515-4519. [DOI] [PMC free article] [PubMed] [Google Scholar]
- Atarashi K, Tanoue T, Oshima K, Suda W, Nagano Y, Nishikawa H, Fukuda S, Saito T,Narushima S, Hase K, et al. (2013). Treg induction by a rationally selected mixture of Clostridia strains from the human microbiota. Nature 500, 232-236. [DOI] [PubMed] [Google Scholar]
- Backhed F, Ding H, Wang T, Hooper LV, Koh GY, Nagy A, Semenkovich CF, and Gordon JI (2004). The gut microbiota as an environmental factor that regulates fat storage. Proc Natl Acad Sci U S A 101, 15718-15723. [DOI] [PMC free article] [PubMed] [Google Scholar]
- Ballak DB, van Diepen JA, Moschen AR, Jansen HJ, Hijmans A, Groenhof GJ, Leenders F, Bufler P, Boekschoten MV, Muller M, et al. (2014). IL-37 protects against obesity-induced inflammation and insulin resistance. Nat Commun 5, 4711. [DOI] [PubMed] [Google Scholar]
- Bouter KE, van Raalte DH, Groen AK, and Nieuwdorp M (2017). Role of the Gut Microbiome in the Pathogenesis of Obesity and Obesity-Related Metabolic Dysfunction. Gastroenterology [DOI] [PubMed] [Google Scholar]
- Chassaing B, Ley RE, and Gewirtz AT (2014). Intestinal epithelial cell toll-like receptor 5 regulates the intestinal microbiota to prevent low-grade inflammation and metabolic syndrome in mice. Gastroenterology 147, 1363-1377 e1317. [DOI] [PMC free article] [PubMed] [Google Scholar]
- Chen GY, Shaw MH, Redondo G, and Nunez G (2008). The innate immune receptor Nod1 protects the intestine from inflammation-induced tumorigenesis. Cancer Res 68, 10060-10067. [DOI] [PMC free article] [PubMed] [Google Scholar]
- Chen L, Wilson JE, Koenigsknecht MJ, Chou WC, Montgomery SA, Truax AD, Brickey WJ, Packey CD, Maharshak N, Matsushima GK, et al. (2017). NLRP12 attenuates colon inflammation by maintaining colonic microbial diversity and promoting protective commensal bacterial growth. Nature immunology. [DOI] [PMC free article] [PubMed] [Google Scholar]
- Chen W, Liu F, Ling Z, Tong X, and Xiang C (2012). Human intestinal lumen and mucosa-associated microbiota in patients with colorectal cancer. PloS one 7, e39743. [DOI] [PMC free article] [PubMed] [Google Scholar]
- Cho KW, Morris DL, and Lumeng CN (2014). Flow cytometry analyses of adipose tissue macrophages. Methods Enzymol 537, 297-314. [DOI] [PMC free article] [PubMed] [Google Scholar]
- Cinti S, Mitchell G, Barbatelli G, Murano I, Ceresi E, Faloia E, Wang S, Fortier M, Greenberg AS, and Obin MS (2005). Adipocyte death defines macrophage localization and function in adipose tissue of obese mice and humans. J Lipid Res 46, 2347-2355. [DOI] [PubMed] [Google Scholar]
- den Besten G, van Eunen K, Groen AK, Venema K, Reijngoud DJ, and Bakker BM (2013). The role of short-chain fatty acids in the interplay between diet, gut microbiota, and host energy metabolism. J Lipid Res 54, 2325-2340. [DOI] [PMC free article] [PubMed] [Google Scholar]
- Deshmane SL, Kremlev S, Amini S, and Sawaya BE (2009). Monocyte chemoattractant protein-1 (MCP-1): an overview. J Interferon Cytokine Res 29, 313-326. [DOI] [PMC free article] [PubMed] [Google Scholar]
- Dey N, Soergel DA, Repo S, and Brenner SE (2013). Association of gut microbiota with post-operative clinical course in Crohn’s disease. BMC Gastroenterol 13, 131. [DOI] [PMC free article] [PubMed] [Google Scholar]
- Dinh DM, Volpe GE, Duffalo C, Bhalchandra S, Tai AK, Kane AV, Wanke CA, and Ward HD (2015). Intestinal microbiota, microbial translocation, and systemic inflammation in chronic HIV infection. J Infect Dis 211, 19-27. [DOI] [PMC free article] [PubMed] [Google Scholar]
- Divoux A, Tordjman J, Lacasa D, Veyrie N, Hugol D, Aissat A, Basdevant A, GuerreMillo M, Poitou C, Zucker JD, et al. (2010). Fibrosis in human adipose tissue:composition, distribution, and link with lipid metabolism and fat mass loss. Diabetes 59, 2817-2825. [DOI] [PMC free article] [PubMed] [Google Scholar]
- Eckburg PB, Bik EM, Bernstein CN, Purdom E, Dethlefsen L, Sargent M, Gill SR, Nelson KE, and Relman DA (2005). Diversity of the human intestinal microbial flora. Science 308, 1635-1638. [DOI] [PMC free article] [PubMed] [Google Scholar]
- Fan R, Toubal A, Goni S, Drareni K, Huang Z, Alzaid F, Ballaire R, Ancel P, Liang N, Damdimopoulos A, et al. (2016). Loss of the co-repressor GPS2 sensitizes macrophage activation upon metabolic stress induced by obesity and type 2 diabetes. Nat Med 22, 780791. [DOI] [PubMed] [Google Scholar]
- Flegal KM, Carroll MD, Kit BK, and Ogden CL (2012). Prevalence of obesity and trends in the distribution of body mass index among US adults, 1999-2010. Jama 307, 491-497. [DOI] [PubMed] [Google Scholar]
- Fleissner CK, Huebel N, Abd El-Bary MM, Loh G, Klaus S, and Blaut M (2010). Absence of intestinal microbiota does not protect mice from diet-induced obesity. Br J Nutr 104, 919-929. [DOI] [PubMed] [Google Scholar]
- Gevers D, Kugathasan S, Denson LA, Vazquez-Baeza Y, Van Treuren W, Ren B, Schwager E, Knights D, Song SJ, Yassour M, et al. (2014). The treatment-naive microbiome in new-onset Crohn’s disease. Cell Host Microbe 15, 382-392. [DOI] [PMC free article] [PubMed] [Google Scholar]
- Gharagozloo M, Mahvelati TM, Imbeault E, Gris P, Zerif E, Bobbala D, Ilangumaran S, Amrani A, and Gris D (2015). The nod-like receptor, Nlrp12, plays an anti-inflammatory role in experimental autoimmune encephalomyelitis. J Neuroinflammation 12, 198. [DOI] [PMC free article] [PubMed] [Google Scholar]
- Henao-Mejia J, Elinav E, Jin C, Hao L, Mehal WZ, Strowig T, Thaiss CA, Kau AL, Eisenbarth SC, Jurczak MJ, et al. (2012). Inflammasome-mediated dysbiosis regulates progression of NAFLD and obesity. Nature 482, 179-185. [DOI] [PMC free article] [PubMed] [Google Scholar]
- Hensrud DD, and Klein S (2006). Extreme obesity: a new medical crisis in the United States. Mayo Clin Proc 81, S5-10. [DOI] [PubMed] [Google Scholar]
- Hotamisligil GS, Arner P, Caro JF, Atkinson RL, and Spiegelman BM (1995). Increased adipose tissue expression of tumor necrosis factor-alpha in human obesity and insulin resistance. J Clin Invest 95, 2409-2415. [DOI] [PMC free article] [PubMed] [Google Scholar]
- Khan T, Muise ES, Iyengar P, Wang ZV, Chandalia M, Abate N, Zhang BB, Bonaldo P, Chua S, and Scherer PE (2009). Metabolic dysregulation and adipose tissue fibrosis: role of collagen VI. Molecular and cellular biology 29, 1575-1591. [DOI] [PMC free article] [PubMed] [Google Scholar]
- Le Chatelier E, Nielsen T, Qin J, Prifti E, Hildebrand F, Falony G, Almeida M, Arumugam M, Batto JM, Kennedy S, et al. (2013). Richness of human gut microbiome correlates with metabolic markers. Nature 500, 541-546. [DOI] [PubMed] [Google Scholar]
- Ley RE, Backhed F, Turnbaugh P, Lozupone CA, Knight RD, and Gordon JI (2005). Obesity alters gut microbial ecology. Proc Natl Acad Sci U S A 102, 11070-11075. [DOI] [PMC free article] [PubMed] [Google Scholar]
- Ley RE, Turnbaugh PJ, Klein S, and Gordon JI (2006). Microbial ecology: human gut microbes associated with obesity. Nature 444, 1022-1023. [DOI] [PubMed] [Google Scholar]
- Li G, Domenico J, Jia Y, Lucas JJ, and Gelfand EW (2009). NF-kappaB-dependent induction of cathelicidin-related antimicrobial peptide in murine mast cells by lipopolysaccharide. Int Arch Allergy Immunol 150, 122-132. [DOI] [PMC free article] [PubMed] [Google Scholar]
- Lin HV, Frassetto A, Kowalik EJ Jr., Nawrocki AR, Lu MM, Kosinski JR, Hubert JA, Szeto D, Yao X, Forrest G, et al. (2012). Butyrate and propionate protect against dietinduced obesity and regulate gut hormones via free fatty acid receptor 3-independent mechanisms. PLoS One 7, e35240. [DOI] [PMC free article] [PubMed] [Google Scholar]
- Lukens JR, Gurung P, Shaw PJ, Barr MJ, Zaki MH, Brown SA, Vogel P, Chi H, and Kanneganti TD (2015). The NLRP12 Sensor Negatively Regulates Autoinflammatory Disease by Modulating Interleukin-4 Production in T Cells. Immunity 42, 654-664. [DOI] [PMC free article] [PubMed] [Google Scholar]
- Lumeng CN, Bodzin JL, and Saltiel AR (2007). Obesity induces a phenotypic switch in adipose tissue macrophage polarization. J Clin Invest 117, 175-184. [DOI] [PMC free article] [PubMed] [Google Scholar]
- Martinez FO, and Gordon S (2014). The M1 and M2 paradigm of macrophage activation:time for reassessment. F1000Prime Rep 6, 13. [DOI] [PMC free article] [PubMed] [Google Scholar]
- Murano I, Barbatelli G, Parisani V, Latini C, Muzzonigro G, Castellucci M, and Cinti S (2008). Dead adipocytes, detected as crown-like structures, are prevalent in visceral fat depots of genetically obese mice. J Lipid Res 49, 1562-1568. [DOI] [PubMed] [Google Scholar]
- Nguyen MT, Favelyukis S, Nguyen AK, Reichart D, Scott PA, Jenn A, Liu-Bryan R, Glass CK, Neels JG, and Olefsky JM (2007). A subpopulation of macrophages infiltrates hypertrophic adipose tissue and is activated by free fatty acids via Toll-like receptors 2 and 4 and JNK-dependent pathways. J Biol Chem 282, 35279-35292. [DOI] [PubMed] [Google Scholar]
- Novakovic B, Habibi E, Wang SY, Arts RJW, Davar R, Megchelenbrink W, Kim B, Kuznetsova T, Kox M, Zwaag J, et al. (2016). beta-Glucan Reverses the Epigenetic State of LPS-Induced Immunological Tolerance. Cell 167, 1354-1368 e1314. [DOI] [PMC free article] [PubMed] [Google Scholar]
- Ohshima S, Saeki Y, Mima T, Sasai M, Nishioka K, Nomura S, Kopf M, Katada Y, Tanaka T, Suemura M, et al. (1998). Interleukin 6 plays a key role in the development of antigen-induced arthritis. Proc Natl Acad Sci U S A 95, 8222-8226. [DOI] [PMC free article] [PubMed] [Google Scholar]
- Olefsky JM, and Glass CK (2010). Macrophages, inflammation, and insulin resistance. Annu Rev Physiol 72, 219-246. [DOI] [PubMed] [Google Scholar]
- Orr JS, Kennedy AJ, and Hasty AH (2013). Isolation of adipose tissue immune cells. Journal of visualized experiments : JoVE, e50707. [DOI] [PMC free article] [PubMed] [Google Scholar]
- Ouchi N, Parker JL, Lugus JJ, and Walsh K (2011). Adipokines in inflammation and metabolic disease. Nat Rev Immunol 11, 85-97. [DOI] [PMC free article] [PubMed] [Google Scholar]
- Park EJ, Lee JH, Yu GY, He G, Ali SR, Holzer RG, Osterreicher CH, Takahashi H, and Karin M (2010). Dietary and genetic obesity promote liver inflammation and tumorigenesis by enhancing IL-6 and TNF expression. Cell 140, 197-208. [DOI] [PMC free article] [PubMed] [Google Scholar]
- Park HS, Park JY, and Yu R (2005). Relationship of obesity and visceral adiposity with serum concentrations of CRP, TNF-alpha and IL-6. Diabetes Res Clin Pract 69, 29-35. [DOI] [PubMed] [Google Scholar]
- Park SH, Kang K, Giannopoulou E, Qiao Y, Kang K, Kim G, Park-Min KH, and Ivashkiv LB (2017). Type I interferons and the cytokine TNF cooperatively reprogram the macrophage epigenome to promote inflammatory activation. Nat Immunol 18, 1104-1116. [DOI] [PMC free article] [PubMed] [Google Scholar]
- Plovier H, Everard A, Druart C, Depommier C, Van Hul M, Geurts L, Chilloux J,Ottman N, Duparc T, Lichtenstein L, et al. (2017). A purified membrane protein from Akkermansia muciniphila or the pasteurized bacterium improves metabolism in obese and diabetic mice. Nat Med 23, 107-113. [DOI] [PubMed] [Google Scholar]
- Reichardt N, Duncan SH, Young P, Belenguer A, McWilliam Leitch C, Scott KP, Flint HJ, and Louis P (2014). Phylogenetic distribution of three pathways for propionate production within the human gut microbiota. ISME J 8, 1323-1335. [DOI] [PMC free article] [PubMed] [Google Scholar]
- Ridaura VK, Faith JJ, Rey FE, Cheng J, Duncan AE, Kau AL, Griffin NW, Lombard V, Henrissat B, Bain JR, et al. (2013). Gut microbiota from twins discordant for obesity modulate metabolism in mice. Science 341, 1241214. [DOI] [PMC free article] [PubMed] [Google Scholar]
- Sartor RB, and Wu GD (2017). Roles for Intestinal Bacteria, Viruses, and Fungi in Pathogenesis of Inflammatory Bowel Diseases and Therapeutic Approaches. Gastroenterology 152, 327-339 e324. [DOI] [PMC free article] [PubMed] [Google Scholar]
- Shoelson SE, Lee J, and Yuan M (2003). Inflammation and the IKK beta/I kappa B/NFkappa B axis in obesity- and diet-induced insulin resistance. Int J Obes Relat Metab Disord 27 Suppl 3, S49-52. [DOI] [PubMed] [Google Scholar]
- Smith PM, Howitt MR, Panikov N, Michaud M, Gallini CA, Bohlooly YM, Glickman JN, and Garrett WS (2013). The microbial metabolites, short-chain fatty acids, regulate colonic Treg cell homeostasis. Science 341, 569-573. [DOI] [PMC free article] [PubMed] [Google Scholar]
- Stienstra R, Joosten LA, Koenen T, van Tits B, van Diepen JA, van den Berg SA, Rensen PC, Voshol PJ, Fantuzzi G, Hijmans A, et al. (2010). The inflammasomemediated caspase-1 activation controls adipocyte differentiation and insulin sensitivity. Cell Metab 12, 593-605. [DOI] [PMC free article] [PubMed] [Google Scholar]
- Stienstra R, van Diepen JA, Tack CJ, Zaki MH, van de Veerdonk FL, Perera D, Neale GA, Hooiveld GJ, Hijmans A, Vroegrijk I, et al. (2011). Inflammasome is a central player in the induction of obesity and insulin resistance. Proc Natl Acad Sci U S A 108, 1532415329. [DOI] [PMC free article] [PubMed] [Google Scholar]
- Tzanavari T, Giannogonas P, and Karalis KP (2010). TNF-alpha and obesity. Curr Dir Autoimmun 11, 145-156. [DOI] [PubMed] [Google Scholar]
- Vaishnava S, Yamamoto M, Severson KM, Ruhn KA, Yu X, Koren O, Ley R, Wakeland EK, and Hooper LV (2011). The antibacterial lectin RegIIIgamma promotes the spatial segregation of microbiota and host in the intestine. Science 334, 255-258. [DOI] [PMC free article] [PubMed] [Google Scholar]
- Vandanmagsar B, Youm YH, Ravussin A, Galgani JE, Stadler K, Mynatt RL, Ravussin E, Stephens JM, and Dixit VD (2011). The NLRP3 inflammasome instigates obesityinduced inflammation and insulin resistance. Nat Med 17, 179-188. [DOI] [PMC free article] [PubMed] [Google Scholar]
- Vijay-Kumar M, Aitken JD, Carvalho FA, Cullender TC, Mwangi S, Srinivasan S, Sitaraman SV, Knight R, Ley RE, and Gewirtz AT (2010). Metabolic syndrome and altered gut microbiota in mice lacking Toll-like receptor 5. Science 328, 228-231. [DOI] [PMC free article] [PubMed] [Google Scholar]
- Weisberg SP, McCann D, Desai M, Rosenbaum M, Leibel RL, and Ferrante AW Jr. (2003). Obesity is associated with macrophage accumulation in adipose tissue. J Clin Invest 112, 1796-1808. [DOI] [PMC free article] [PubMed] [Google Scholar]
- Wen H, Gris D, Lei Y, Jha S, Zhang L, Huang MT, Brickey WJ, and Ting JP (2011). Fatty acid-induced NLRP3-ASC inflammasome activation interferes with insulin signaling. Nature immunology 12, 408-415. [DOI] [PMC free article] [PubMed] [Google Scholar]
- Wu C, Jin X, Tsueng G, Afrasiabi C, and Su AI (2016). BioGPS: building your own mashup of gene annotations and expression profiles. Nucleic Acids Res 44, D313-316. [DOI] [PMC free article] [PubMed] [Google Scholar]
- Wu F, and Chakravarti S (2007). Differential expression of inflammatory and fibrogenic genes and their regulation by NF-kappaB inhibition in a mouse model of chronic colitis. J Immunol 179, 6988-7000. [DOI] [PubMed] [Google Scholar]
- Xu H, Barnes GT, Yang Q, Tan G, Yang D, Chou CJ, Sole J, Nichols A, Ross JS, Tartaglia LA, et al. (2003). Chronic inflammation in fat plays a crucial role in the development of obesity-related insulin resistance. J Clin Invest 112, 1821-1830. [DOI] [PMC free article] [PubMed] [Google Scholar]
- Xu X, Grijalva A, Skowronski A, van Eijk M, Serlie MJ, and Ferrante AW Jr. (2013). Obesity activates a program of lysosomal-dependent lipid metabolism in adipose tissue macrophages independently of classic activation. Cell Metab 18, 816-830. [DOI] [PMC free article] [PubMed] [Google Scholar]
- Yoshimura T, McLean MH, Dzutsev AK, Yao X, Chen K, Huang J, Gong W, Zhou J,Xiang Y, et al. (2018). The Antimicrobial Peptide CRAMP Is Essential for Colon Homeostasis by Maintaining Microbiota Balance. J Immunol 200, 2174-2185. [DOI] [PMC free article] [PubMed] [Google Scholar]
- Yudkin JS, Stehouwer CD, Emeis JJ, and Coppack SW (1999). C-reactive protein in healthy subjects: associations with obesity, insulin resistance, and endothelial dysfunction: a potential role for cytokines originating from adipose tissue? Arterioscler Thromb Vasc Biol 19, 972-978. [DOI] [PubMed] [Google Scholar]
- Zaki MH, Vogel P, Malireddi RK, Body-Malapel M, Anand PK, Bertin J, Green DR, Lamkanfi M, and Kanneganti TD (2011). The NOD-like receptor NLRP12 attenuates colon inflammation and tumorigenesis. Cancer Cell 20, 649-660. [DOI] [PMC free article] [PubMed] [Google Scholar]
- Zhang W, Hartmann R, Tun HM, Elson CO, Khafipour E, and Garvey WT (2016). Deletion of the Toll-Like Receptor 5 Gene Per Se Does Not Determine the Gut Microbiome Profile That Induces Metabolic Syndrome: Environment Trumps Genotype. PloS one 11, e0150943. [DOI] [PMC free article] [PubMed] [Google Scholar]
Associated Data
This section collects any data citations, data availability statements, or supplementary materials included in this article.