Abstract
Biotic and abiotic stresses negatively affect fitness, biomass production, and crop yield in plants. The dehydration-responsive element-binding proteins (DREB) are important transcription factors (TFs), and are induced by abiotic and biotic stresses. In this study, genome-wide identification, in silico sequence, and phylogenetic analyses and expression analyses of DREB2 genes under cadmium (Cd) and salt (NaCl) stresses in sorghum (Sorghum bicolor, Sb) were performed. Six putative SbDREB2 genes were identified in sorghum genome and all contained AP2 domain (PF00847). Nucleotide diversities in SbDREB2 genes were calculated as π: 0.53 and θ: 0.39, respectively. While exon numbers of them were either one or two, length of SbDREB2 proteins ranged from 238 to 388 amino acid residues. Fifty-six cis-acting regulatory elements, which are tissue specific, light, hormone, and stress responsive, were identified in the promotor regions of SbDREB2 genes. Analyses on digital expression data indicated that SbDREB2A and SbDREB2B are more expressed genes than other SbDREB genes in sorghum. Under Cd and NaCl stresses, expressions of SbDREB2 genes were induced at different levels. All SbDREB2 genes in root were up-regulated under salt stress. In case of Cd stress, SbDREB2D gene was particularly up-regulated in leaves and roots. Co-expression analyses revealed four of TFs in co-expression network, indicating that they have roles in transcriptional cascade. Furthermore, five miRNA target regions were identified for four SbDREB2 genes, indicating their roles in post-transcriptional regulation. The predicted 3D structure of SbDREB2 proteins showed some structural divergences and structure overlap between rice and sorghum varied at between 26.58 and 50%. Finally, obtained data could be used in breeding of stress-tolerant plants, particularly genetically engineered DREB2 expressing plants. Findings in this study would also contribute to the understanding of DREB2 genes in plants, especially in sorghum.
Keywords: Sorghum, Abiotic stress, Gene expression, Genome-wide analyses
Introduction
Plant growth is adversely affected by various abiotic stresses including high temperature, drought, salinity, and low temperature (Sakuma et al. 2006a). Many stress-inducible genes have been determined in plants, and they can be divided into two groups: stress tolerance proteins and regulatory proteins (Khan et al. 2017). Transcription factors (TFs) are essential for regulating expression of functional protein genes in the genome. AP2/EREBP (APETALA2/ethylene-responsive element-binding protein) represents a large family of TF genes in plants and contains highly conserved AP2/ERF DNA-binding domain (Riechmann and Meyerowitz 1998; Zhou et al. 2010; Sharoni et al. 2011; Yan et al. 2013; Vatansever et al. 2017). AP2/EREBP gene family can be divided into four subfamilies, including AP2, RAV (related to ABI3/VP1), dehydration-responsive element-binding protein (DREB), and ERF (Sakuma et al. 2002). The AP2/EREBP supergene family is characterized by the AP2/ERF domain consisting of 50–60 amino acids, and these proteins play important roles in various regulatory mechanisms in plant metabolism (Liu et al. 1998). Ethylene-responsive factor (ERF) proteins are one of the transcription factors involved in biotic and abiotic stress responses. The DREBs (dehydration-responsive element binding) are members of ERF family of transcription factors and belonged to ABA-independent signal transduction pathway. There are two subclasses of DREBs, DREB1/CBF and DREB2, which are induced by cold and dehydration, respectively, and there is a cross-talk between them (Agarwal et al. 2006; Lata and Prasad 2011; Mizoi et al. 2012; Vatansever et al. 2017). DREB genes can be divided into six small groups named as A-1–A-6 based on their sequence similarity, which play multiple roles in plants (Liu et al. 1998; Sakuma et al. 2002). Dehydration-responsive element (DRE)/C-repeat (CRT, A/GCCGAC) core sequence is presented in many promoters involved in environmental stress response (Yamaguchi-Shinozaki and Shinozaki 1994; Stockinger et al. 1997; Sakuma et al. 2006b). The DREB2 subgroup is composed of eight members in Arabidopsis (Sakuma et al. 2002) and five in rice (Matsukura et al. 2010). In Arabidopsis, DREB2A has various roles in transcriptional cascade of heat-shock responses. DREB2A is rapidly induced by heat shock, which results in the expression of many heat shock-responsive gene-encoding transcription factors and molecular chaperones (Sakuma et al. 2006b). In rice, transgenic expression of sorghum DREB2 gene improves tolerance and yield under water limitation. Particularly, drought-stressed rd29A: SbDREB2 transgenic plants indicated a significantly higher number of panicles compared to wild-type rice plants (Bihani et al. 2011). ZmDREB2A was induced by cold, dehydration, salt, and heat stresses in maize seedlings. In addition, overexpression of ZmDREB2A improved thermo-tolerance in transgenic Arabidopsis plants (Qin et al. 2007). Mizoi et al. (2013) reported that a new soybean DREB2 gene, GmDREB2A;2, was highly expressed not only under the conditions of dehydration and heat but also low temperature. In another study, transcription of DREB2C was induced in Arabidopsis by a superoxide anion propagator, methyl viologen (MV). The DREB2C-overexpressing transgenic plants showed more oxidative stress tolerance than wild-type plants (Hwang et al. 2012). In tomato, SlDREB2 was up-regulated in roots and young leaves under NaCl exposure. In addition, it was shown that SlDREB2 was induced by KCl and drought (Hichri et al. 2016). Agarwal et al. (2010) reported that transgenic tobacco plants transformed with Pennisetum glaucum DREB2A gene (PgDREB2A) showed the abiotic stress tolerance and induced higher expression of downstream stress-responsive genes. This study reveals genome-wide identification and comparison of DREB2 genes in sorghum genome with Arabidopsis and rice genomes as well as their expression profiles under Cd and NaCl stresses.
Materials and methods
Identifications of SbDREB2 genes/proteins
Amino acid sequences of eight Arabidopsis DREB2 proteins—DREB2A (AT5G05410.1), 2B (AT3G11020.1), 2C (AT2G40340.1), 2D (AT1G75490.1), 2E (AT2G38340.1), 2F (AT3G57600.1), 2G (AT5G18450.1), and 2H (AT2G40350.1)—and five rice DREB2 proteins—DREB2A (LOC_Os01g07120.1), 2B (LOC_Os05g27930.1), 2C (LOC_Os08g45110.1), 2D (LOC_Os05g39590.1), and 2E (LOC_Os03g07830.1)—were obtained from UniProt (http://www.uniprot.org/) database. These amino acid sequences were queried in sorghum genome in Phytozome database with E−20 value (http://phytozome.jgi.doe.gov/pz/portal.html) (Goodstein et al. 2012). Later, Hidden Markov Model (HMM) was performed in putative SbDREB2 protein sequences by Pfam (http://pfam.sanger.ac.uk) (Punta et al. 2012) to confirm the presence of AP2 domain (PF00847). In addition, coding sequence (CDS) and peptide sequences of identified DREB2 genes were collected from Phytozome database for further analyses.
Sequence analyses of DREB2 genes/proteins
First, physico-chemical properties of DREB2 proteins were analyzed using ProtParam tool (https://web.expasy.org/protparam/) (Gasteiger et al. 2005). Sub-cellular localizations were predicted by WoLF PSORT (https://wolfpsort.hgc.jp/) (Horton et al. 2007). Multiple sequence alignment and amino acid composition of DREB2 proteins were performed by Bioedit v7.2.5 (Hall 1999). The pairwise distance analyses were evaluated by the MEGA7 software (Kumar et al. 2016). In addition, the coding sequences of DREB2 genes were analyzed using DnaSP 5.1 (Librado and Rozas 2009), including the estimates of genetic diversity such as π (Tajima 1989) and θ (Watterson 1975), and segregating (polymorphic) sites (S). Exon/intron organization of DREB2 genes was obtained from Phytozome database.
Annotations, conserved motif, and phylogenetic analyses
The ontology annotations of DREB2 genes were made using PhytoMine in Phytozome (https://phytozome.jgi.doe.gov/phytomine/begin.do) (Goodstein et al. 2012) and AmiGO (http://amigo.geneontology.org/amigo/landing) (Carbon et al. 2009) databases. Conserved motifs in DREB2 protein sequences were predicted using MEME (Multiple Em for Motif Elicitation) suites (http://meme-suite.org/) with parameters; maximum motif number to find: 5 and minimum–maximum motif width to find: 6–50 (Bailey et al. 2015). A phylogenetic tree was constructed by the MEGA7 software using with 1000 bootstraps (Kumar et al. 2016). The evolutionary history was inferred using the maximum-likelihood method based on the JTT matrix-based model (Jones et al. 1992). All positions containing gaps and missing data were eliminated. There were a total of 78 positions in the final data set.
Promotor sequence, digital expression, and miRNA target analyses of SbDREB2 genes
For promoter analysis, the 1000 bp upstream regions of SbDREB2 genes were retrieved from Phytozome database and searched in PlantCARE database (http://bioinformatics.psb.ugent.be/webtools/plantcare/html/) (Lescot et al. 2002). The digital expression data of DREB2 genes at anatomical and developmental levels in sorghum were obtained from the Genevestigator database for plant biology (https://genevestigator.com/gv/doc/intro_plant.jsp) (Hruz et al. 2008). In addition, expression analyses of putative SbDREB2 genes were analyzed by MOROKOSHI transcriptome database (http://sorghum.riken.jp/morokoshi/Home.html) based on approximately 40,000 full-length cDNA (FL-cDNAs) and expression profiles from RNA-Seq analysis (Makita et al. 2015). The co-expression network of SbDREB2A gene was generated by MOROKOSHI transcriptome database. To identify putative SbDREB2-targeted miRNAs, SbDREB2-coding sequences were searched against the published sorghum miRNAs in psRNATarget database (http://plantgrn.noble.org/psRNATarget/analysis?function=2) (Dai and Zhao 2011).
Secondary and tertiary structure analysis
First, secondary structures of SbDREB2 proteins were evaluated using the SOPMA server (https://npsa-prabi.ibcp.fr/cgi-bin/npsa_automat.pl?page=/NPSA/npsa_sopma.html) (Geourjon and Deleage 1995). 3D models of them were predicted at intensive mode using the Phyre2 server (http://sbg.bio.ic.ac.uk/phyre2/) (Kelley and Sternberg 2009). Model quality was checked using Ramachandran plot analysis by Vadar 1.8 server (http://vadar.wishartlab.com/) (Willard et al. 2003).
Plant material and growth condition
Sorghum (S. bicolor L. cv. Aldari) seeds were individually planted in 10-cm square-top pots containing perlite or peat pellet, and grown at 28 °C under LD 12:12 regime (170 µmol m−2 s−1—12 h light period/day), and 70% relative humidity as described previously (Akbudak et al. 2018). Plants were watered with 30 ml half-strength Hoagland solution every other day. On the 14th day of plant growth, plants were watered with 30 ml Hoagland solution-containing 200 µM CdCl2. No CdCl2 was added into Hoagland solution used for watering control plants (Panda et al. 2011). After 6 h and 24 h of CdCl2 treatments, leaves and roots of plants were separately harvested for RNA isolation. To induce salinity stress, 2-week-old plants were watered with half strength Hoagland solution-containing supplemental sodium chloride (NaCl). Salt concentration was increased gradually (50 mM, 100 mM, 150 mM, and 200 mM) every other day intervals to avoid osmotic shock (Swami et al. 2011). After 24 h treatment with 200 mM NaCl, leaves and roots were separately harvested for RNA isolation.
RNA extraction and gene expression analyses
RNA was separately isolated from leaves and roots of each plant using RNA Plant Mini Kit (Qiagen, Cat no.: 74904) following the manufacturer’s instructions. RNA amounts in the samples were determined with BioDrop µLITE (Biodrop, UK). RNA samples were treated with RQ1 RNase-Free DNase (Promega, WI, USA). The intactness of the RNA and its contamination by DNA were checked by gel electrophoresis. Real-time quantitative PCR (RT-qPCR) was carried out on a Light Cycler 96 System (Roche). Expressions of putative DREB2 genes were quantified in 10 ng DNAase-treated RNA samples using EvoScript RNA SYBR Green I Master Kit (One-step) (Roche). The forward and reverse primers (Table 1) designed for SbDREB2 genes were used in RT-qPCR analysis. Gene expression was determined using the ΔΔCT method (Livak and Schmitthgen 2001). S. bicolor serine/threonine-protein phosphatase (SbPP2A) gene served as a reference gene in the analysis (Reddy et al. 2016). For gene expression analysis, the CT values of reference genes (PP2A) were subtracted from the CT of the target genes to normalize each sample. For example:
ΔΔCT was obtained by comparing the ΔCT value of Cd/NaCl-stressed plants to control plants:
Table 1.
Primers used in RT-qPCR analysis of SbDREB2 genes
| Genes | Forward primer sequences | Reverse primer sequences | Size (bp) |
|---|---|---|---|
| SbDREB2A | 5′-AAGGCACGTGTCAACTTCTC-3′ | 5′-TAGATGCCAGCAACGAAAGC-3′ | 79 |
| SbDREB2B | 5′-CAGCCCGGAAGCAGGAAGAA-3′ | 5′-CTGCCTCACTCCACGATACC-3′ | 222 |
| SbDREB2C1 | 5′-GATGATGCAGTACTCCGCCT-3′ | 5′-CATCTGGAACGTCTGGTGGT-3′ | 151 |
| SbDREB2C2 | 5′-TCCGGCTCCTTTTCCAACTAC-3′ | 5′-GTGGAATGTCTGGTGGTTGTTG-3′ | 99 |
| SbDREB2D | 5′-GATGCGGTATCCGACATGGT-3′ | 5′-GGCGTCGAATACCTGATGCT-3′ | 75 |
| SbDREB2E | 5′-TCAGGGAGTTCTTGCAGCAG-3′ | 5′-CTGAAAACCTCCGTTGACGC-3′ | 209 |
| SbPP2A | 5′-AACCCGCAAAACCCCAGACTA-3′ | 5′-TACAGGTCGGGCTCATGGAAC-3′ | 138 |
The fold change for each line based on its corresponding reference (Control) was calculated using the following equation:
Average CT values for leaf and root tissues were obtained from at least three biological and three technical replicates for each gene.
Results and discussion
Nucleotide and protein sequence variations of DREB2 genes/proteins
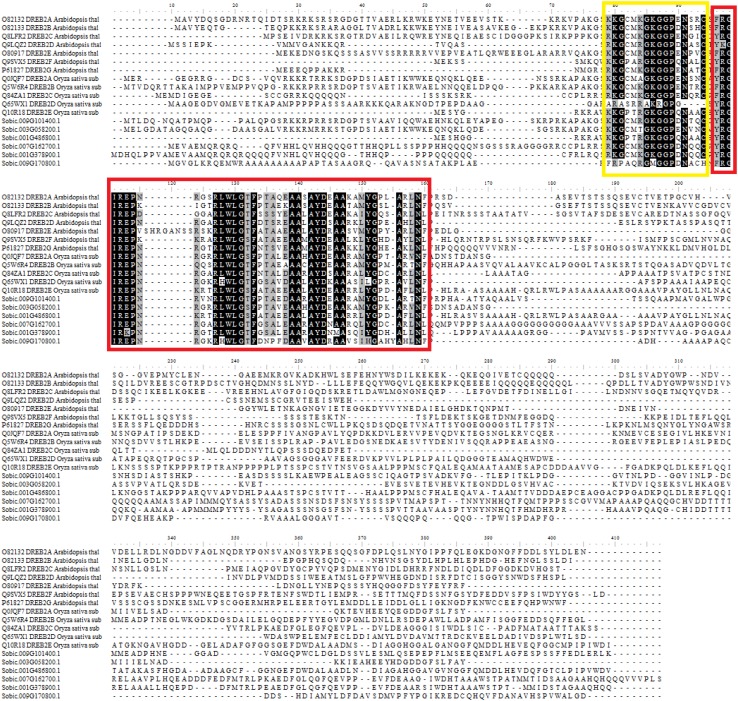
To identify DREB2 genes in the sorghum genome, BLASTP analyses were performed using Arabidopsis (eight members) and rice (five members) orthologues obtained from UniProt database. As a result, we identified six putative SbDREB2 genes and named them based on phylogenetic relationships to rice and MOROKOSHI transcriptome database (Table 2). In addition, to get more insights about DREB2 genes, Arabidopsis and rice orthologues were subjected to comparative analyses (Table 2). Gene structure analyses revealed that exon numbers of DREB2 genes were between one and two in sorghum. The lengths of the coding sequences were ranged from 717 bp (SbDREB2D) to 1167 bp (SbDREB2C1). Furthermore, G+C (guanine + cytosine) content was found between 53.91 and 72.13%, and overall pairwise average distance was identified as 0.796, suggesting that a genetic variation was between DREB2 genes in sorghum. Variable (polymorphic) sites, ~ 61% (364/593) of which were parsimony informative sites and ~ 39% (229/593) of which were singleton variable sites, were also identified in SbDREB2 genes. In addition, 63 sites were identified as invariable (monomorphic). While Tajima’s D value was found to be 2.28, nucleotide diversities were calculated as π: 0.53 and θ: 0.39. The Tajima’s D indicates the frequency spectrum for sequence polymorphism, including π from the average number of pairwise nucleotide differences (Tajima 1989) and θ derived from number of segregating sites (Watterson 1975). Because a positive value of Tajima’s D statistic indicates a balanced selection maintaining advantageous genetic diversity within populations (Yamasaki et al. 2007; Delph and Kelly 2014), DREB2 genes in the sorghum genome exhibit positive selection. All sorghum DREB2 proteins contain AP2 domain structure (PF00847) (Fig. 1). Agarwal et al. (2006) stated that the DREB proteins have an ERF/AP2 DNA-binding domain which is quite conserved. This conserved domain structure (AP2) was identified in all DREBs (Fig. 1). The protein lengths were ranged from 238 to 388 amino acids, and pI values varied between 5.07 and 8.67. Similar results were observed in Arabidopsis and rice. ZmDREB2A was found to be in the length of 274 amino acid residues in maize (Qin et al. 2007), while Mizoi et al. (2013) reported that GmDREB2A;2 was found in the length of 393 amino acid residues in soybean. In 19 DREB proteins of 14 grass species, protein lengths were found between 213 and 394 amino acid residues (Filiz and Tombuloglu 2014), which is also consistent with our data. Moreover, all DREB proteins found to be localized in the nucleus, suggesting TF functions of these proteins.
Table 2.
Details of DREB2 genes in sorghum, rice, and Arabidopsis
| Gene ID (phytozome) | Uniprot ID | Gene name | Protein domain family | Exon no. | Protein length (aa) | MW (kDa) | pI value | Localization (WoLF PSORT) |
|---|---|---|---|---|---|---|---|---|
| AT5G05410.1 | O82132 | AtDREB2A | PF00847 | 1 | 335 | 37.70 | 5.17 | Nucleus |
| AT3G11020.1 | O82133 | AtDREB2B | PF00847 | 1 | 330 | 37.12 | 5.02 | Nucleus |
| AT2G40340.1 | Q8LFR2 | AtDREB2C | PF00847 | 2 | 341 | 37.83 | 4.67 | Nucleus |
| AT1G75490.1 | Q9LQZ2 | AtDREB2D | PF00847 | 1 | 206 | 22.58 | 6.10 | Nucleus |
| AT2G38340.1 | O80917 | AtDREB2E | PF00847 | 1 | 244 | 27.37 | 8.39 | Nucleus |
| AT3G57600.1 | Q9SVX5 | AtDREB2F | PF00847 | 1 | 277 | 31.57 | 5.33 | Nucleus |
| AT5G18450.1 | P61827 | AtDREB2G | PF00847 | 1 | 307 | 34.23 | 6.32 | Nucleus |
| AT2G40350.1 | Q9SIZ0 | AtDREB2H | PF00847 | 2 | 157 | 17.79 | 10.02 | Nucleus |
| LOC_Os01g07120.1 | Q0JQF7 | OsDREB2A | PF00847 | 1 | 274 | 30.66 | 5.77 | Nucleus |
| LOC_Os05g27930.1 | Q5W6R4 | OsDREB2B | PF00847 | 2 | 373 | 40.47 | 4.76 | Nucleus |
| LOC_Os08g45110.1 | Q84ZA1 | OsDREB2C | PF00847 | 1 | 230 | 24.95 | 5.57 | Nucleus |
| LOC_Os05g39590.1 | Q65WX1 | OsDREB2D | PF00847 | 2 | 261 | 27.69 | 5.06 | Nucleus |
| LOC_Os03g07830.1 | Q10R18 | OsDREB2E | PF00847 | 1 | 318 | 33.46 | 5.91 | Nucleus |
| Sobic.003G058200.1 | – | SbDREB2A | PF00847 | 2 | 262 | 28.64 | 5.52 | Nucleus |
| Sobic.009G101400.1 | – | SbDREB2B | PF00847 | 2 | 336 | 36.17 | 5.07 | Nucleus |
| Sobic.007G162700.1 | – | SbDREB2C1 | PF00847 | 1 | 388 | 41.19 | 6.67 | Nucleus |
| Sobic.001G378900.1 | – | SbDREB2C2 | PF00847 | 2 | 351 | 38.62 | 8.67 | Nucleus |
| Sobic.009G170800.1 | – | SbDREB2D | PF00847 | 2 | 238 | 25.43 | 6.82 | Nucleus |
| Sobic.001G486800.1 | – | SbDREB2E | PF00847 | 1 | 316 | 33.27 | 5.93 | Nucleus |
PF00847: AP2 domain
Fig. 1.
Comparison of amino acid alignments of the DREB2 proteins in Arabidopsis, rice, and sorghum, respectively. The yellow and red rectangles indicate the nuclear localization site (NLS) and AP2 domain structures, respectively. Sequences were aligned by ClustalW; identical and similar residues were shaded as black and grey, respectively, with 100% threshold
The amino acid pairwise distance analyses were performed among 19 DREB2 protein sequences and overall average was found as 0.42 by MEGA7 software. Filiz and Tombuloglu (2014) reported that pairwise distance of DREB proteins was 0.588 in 14 grass species. Their result was higher than our finding. In genetic comparison of rice and sorghum DREB proteins, the lowest distance values were found as 0.013 between SbDREB2E and OsDREB2E, followed by 0.214 between OsDREB2B and SbDREB2B, 0.214 between OsDREB2B and SbDREB2C1, and 0.279 between OsDREB2C and SbDREB2B. For Arabidopsis and sorghum, the lowest distance value was found as 0.167 between AtDREB2F and SbDREB2E, followed by 0.246 between AtDREB2A and SbDREB2A and 0.279 between AtDREB2A and SbDREB2B and AtDREB2B and SbDREB2B. According to these data, it can be proposed that DREB2 genes showed variations at amino acid level.
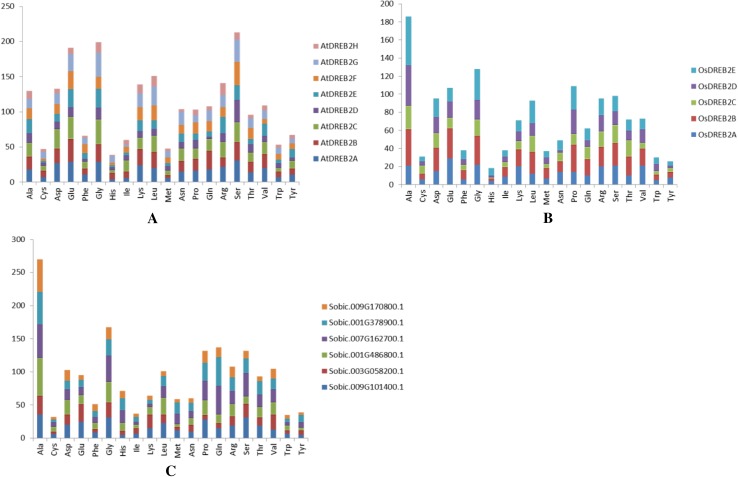
The amino acid composition of DREB2A proteins in Arabidopsis (Fig. 2a), rice (Fig. 2b) and sorghum (Fig. 2c) were analyzed. The highest number of amino acid residue was found as serine (Ser) and alanine (Ala) in Arabidopsis and rice, respectively. In sorghum, the highest number of amino acid residue was identified as alanine (Ala), followed by glycine (Gly) and glutamine (Gln). Remarkably, Gly residue was found to be abundant in DREB proteins of all three plant species. In conserved motif analyses, motif I related with AP2 domain structure contained seven Gly residues (Table 2). Filiz and Tombuloğlu (2014) determined the amino acid compositions of DREB proteins (%) in 14 grass species. It was found that glutamic acid (10%) was the most abundant amino acid followed by serine (9.3%), alanine (8.2%), and glycine (8%). Their result is consistent with our findings.
Fig. 2.
Amino acid distributions of DREB2 proteins from Arabidopsis (a), rice (b), and sorghum (c)
Annotations of sorghum DREB2 genes
The ontology annotations of DREB2 genes in sorghum were performed using PhytoMine in Phytozome and AmiGO databases. All DREB2 proteins contained PF00847 (AP2 domain), SM00380 (DNA-binding domain in plant proteins such as APETALA2 and EREBPs), and PR00367 (ethylene-responsive element-binding protein signature) domain structures based on Pfam, SMART, and PRINTS databases, respectively. GO annotations were found as GO:0003700 (transcription factor activity and sequence-specific DNA binding), GO:0043565 (sequence-specific DNA binding), GO:0044212 (transcription regulatory region DNA binding), and GO:0003677 (DNA binding) for molecular function; GO:0006355 (regulation of transcription, DNA-templated) and GO:0045893 (positive regulation of transcription, DNA-templated) were found for biological process, and GO:0005634 (nucleus) was identified for cellular component.
Analyses of conserved motifs
In the analysis, five conserved motif sequences were detected and motif-domain relationships were investigated (Table 3). The motif width and detected sites were found between 11 and 41 amino acid residues, and between 7 and 19 sites, respectively. In all sequences, motif 1 (GKGGPENAQCSYRGVRQRTWGKWVAEIREPNRGARLWLGTF) was the only one found to be related with AP2 domain structure. Based on these analyses, it can be suggested that AP2 domain structure is well conserved in all DREB2 proteins.
Table 3.
Most conserved five motifs in DREB2 proteins in sorghum, rice, and Arabidopsis
| Motif no. | Motif width | Detected sites | Motif sequence | Motif-domain associationa |
|---|---|---|---|---|
| 1 | 41 | 19 | GKGGPENAQCSYRGVRQRTWGKWVAEIREPNRGARLWLGTF | AP2 domain (PF00847) |
| 2 | 28 | 18 | PTAEEAALAYDEAARALYGPDARLNLPH | Not found |
| 3 | 11 | 14 | PAKGSKKGCMK | Not found |
| 4 | 21 | 12 | RKRNGPTSVAEIJKRWKEYNE | Not found |
| 5 | 14 | 7 | DDCFDIBELLEMJN | Not found |
A set of 19 DREB2 sequences were analyzed using MEME server
aMotifs are searched in Pfam database to figure out their associations with protein domains
Phylogenetic analyses
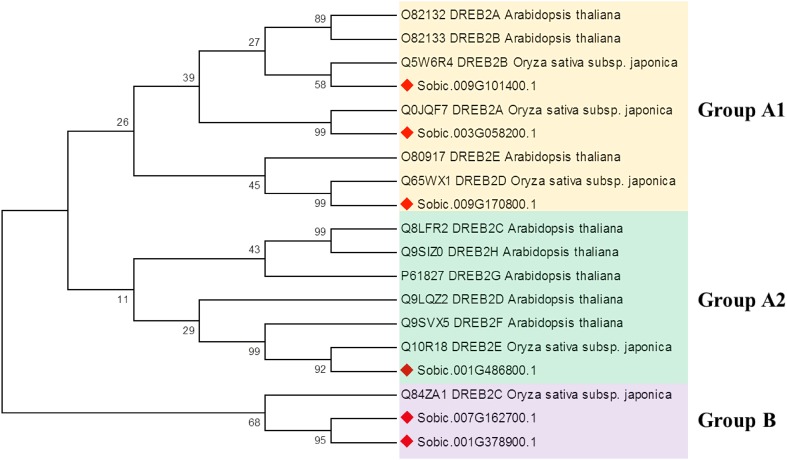
To analyze the evolutionary relationships among DREB2 proteins, we have performed phylogenetic analyses with 19 DREB2 protein sequences (Fig. 3). The two major groups were identified as groups A (subgroup A1 and A2) and B in phylogenetic tree. While the three plant species were clustered together in group A with monocots and dicot, group B was only consisted of monocot species with rice and sorghum. Particularly, rice DREB2C was isolated from the others and clustered with sorghum Sobic.007G162700.1 and Sobic.001G378900.1 in group B. Phylogenetic analyses also revealed that sorghum DREB2 proteins were continually clustered with rice orthologues, indicating conservation of DREB2 genes in grasses. In addition, a clear distinction could be observed between Arabidopsis and rice and sorghum DREB2 proteins in different subgroups. Mizoi et al. (2013) stated that monocot–dicot of DREB2 proteins separated subgroups in phylogenetic tree of Arabidopsis, rice, and soybean. These data are in agreement with our findings.
Fig. 3.
Phylogenetic tree of 19 DREB2A proteins in three plant species, including Arabidopsis, rice, and sorghum. Tree was constructed by MEGA 7 using maximum-likelihood (ML) method with 1000 bootstraps. The sorghum DREB2 proteins were indicated as red diamonds
Analyses of promoter sequences
The gene expression levels through interactions with DNA or regulatory proteins were adjusted by many elements located in plant genome at processing of genetic information. Cis-regulatory sequences are linear nucleotide regions of non-coding DNA and their localizations change due to genes activities. There are two main types of cis sequences, containing enhancers and silencers (Venter and Botha 2010). In silico analysis of promoter regions of sorghum DREB2 genes were performed in upstream of 1000 bp regions and 56 cis-element elements were identified by PlantCare database (Fig. 4). Cis-regulatory elements whose functions are unknown were removed from the heat map and present and absent elements were shown in red and green colors, respectively. In DREB2 genes, 19 type cis-elements were found to be related with light-responsive elements, including ATCT-motif, Box 4, CGTCA-motif, MBS, Skn-1_motif, Sp1, 3-AF1 binding site, AE-box, CATT-motif, GT1-motif, TCT-motif, TGG-motif, as-2-box, box II, GA-motif, GAG-motif, AT1-motif, and I-box. On the other hand, hormone responsive cis-elements such as abscisic acid responsiveness (ABRE), auxin-responsive (AuxRR-core and TGA-element), gibberellin-responsive element (MNF1), and salicylic acid responsiveness (TCA-element) were identified as 11 types, while three types of tissue-specific cis-elements were identified such as meristem (OCT), endosperm (P-box), and seed specific (RY-element). The sorghum DREB2 genes also contained low-temperature responsiveness (LTR), heat stress responsiveness (HSE), anaerobic induction (ARE), zein metabolism regulation (O2-site), fungal elicitor responsive elements (Box-W1), anoxic-specific inducibility (G-Box), core promoter (TATA and CAAT boxes), MYB-binding site (GC-motif), and cell cycle regulation (MSA-like). Bonetta and McCourt (1998) stated that many stress-reacting promoters contain at least two common cis-elements, one of which was the ACGTG(G/T)C sequence, called ABA-responsive element (ABRE). In the present study, it was identified that SbDREB2A, SbDREB2B, SbDREBC1, and SbDREB2D harbor ABRE cis-regulatory elements, indicating that they have major roles in response to stress conditions in sorghum. Consequently, it can be proposed that the various functions of cis-regulatory elements of DREB2 genes in metabolic pathways have exhibited a complicated system which regulates many cell metabolisms in sorghum.
Fig. 4.
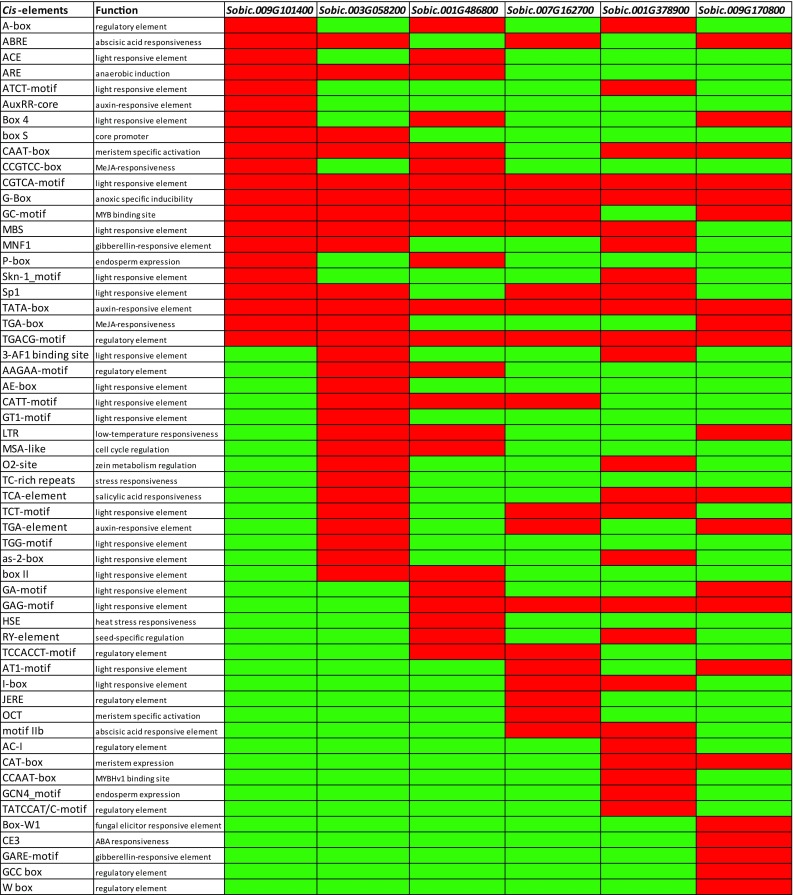
Heat map of cis-regulatory elements in DREB2 genes in sorghum (green: absent and red: present). The cis-regulatory elements were investigated using 1000-bp upstream regions of DREB2 genes
Digital expression analyses of DREB2 genes
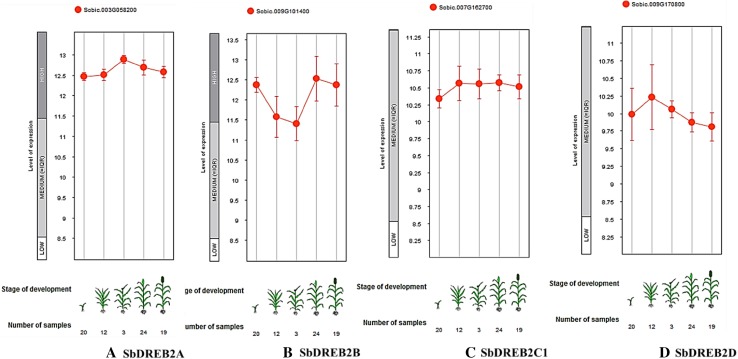
The expression profiles of sorghum DREB2 genes were investigated at different developmental stages and anatomical parts including seedling, stem elongation, booting, flowering, and dough stages (Fig. 5). The expression data of four DREB2 genes, SbDREB2A, SbDREB2B, SbDREB2C1, and SbDREB2D were identified. The high expression levels were found for SbDREB2A and SbDREB2B genes, while SbDREB2C1 and SbDREB2D genes showed the medium-level expression. In addition, SbDREB2B has more variable expression in these different stages/components, whereas SbDREB2A is more consistent in the expression levels.
Fig. 5.
Expression levels of DREB2 genes in different five development stages of sorghum, such as seedling, stem elongation, booting, flowering, and dough stages by Genevestigator database
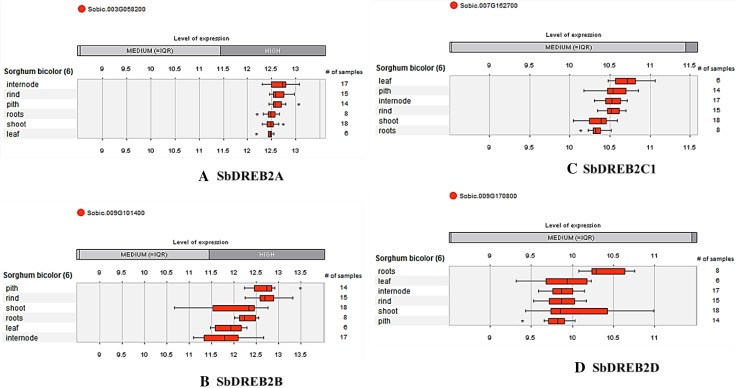
The expression level of SbDREB2A, SbDREB2B, SbDREB2C1, and SbDREB2D were investigated at six different anatomical parts, containing pith, rind, shoot, roots, leaf, and internode (Fig. 6). High expression levels were identified for SbDREB2A and SbDREB2B genes, while SbDREB2C1and SbDREB2D genes showed medium level of expression. With regard to the expression data, it can be proposed that expression levels of DREB2 genes show variations and complex regulations based on gene type, anatomical part, and developmental stage.
Fig. 6.
Expression levels of DREB2 genes in different six anatomical parts of sorghum, such as pith, rind, shoot, roots, leaf, and internode by Genevestigator database
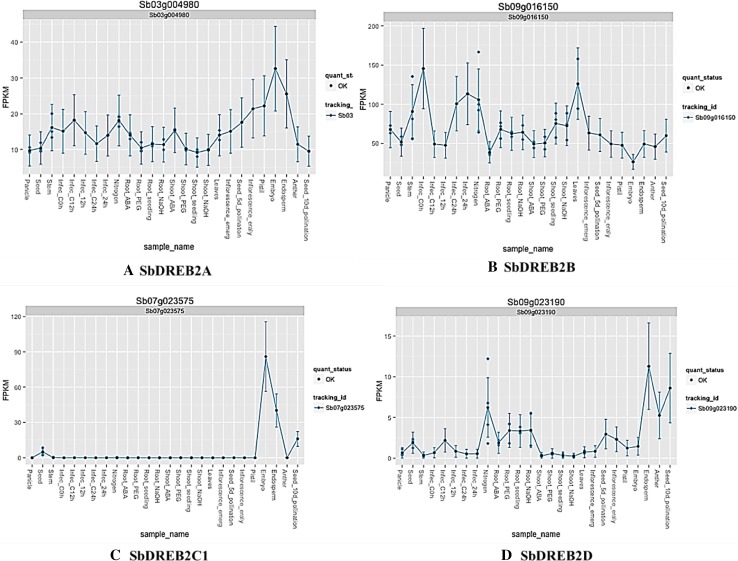
To get deep insights about function of SbDREB2 genes, MOROKOSHI transcriptome database was used, and expression data of four SbDREB2 genes were obtained (Fig. 7). When expression profiles of SbDREB2 genes were analyzed, highest FPKM (fragments per kilobase million) values were found for SbDREB2B genes (Fig. 7b). Particularly, SbDREB2B gene was highly expressed in leaf and stem, while its expression was the lowest in embryo. Furthermore, infections induced the expression level of SbDREB2B gene. While the SbDREB2C1 gene was highly expressed in embryo and endosperm tissues (Fig. 7c), SbDREB2A was highly expressed in pistil, embryo, and endosperm tissues (Fig. 7a). Expression of SbDREB2D gene was high in endosperm, seed, and anther (Fig. 7d). In addition, SbDREB2D gene was up-regulated by nitrogen, PEG (polyethylene glycol), and ABA (abscisic acid) treatments in roots. In general, it can be suggested that SbDREB2A and SbDREB2B genes reported higher expression levels under various conditions and in tissues of sorghum.
Fig. 7.
Expression profiles of SbDREB2A, B, C1, and D genes in various development stages, anatomical parts, tissues, and stress conditions using MOROKOSHI transcriptome database. The legends on the figures show the synonym name of SbDREB2 genes
The co-expression network of SbDREB2A gene
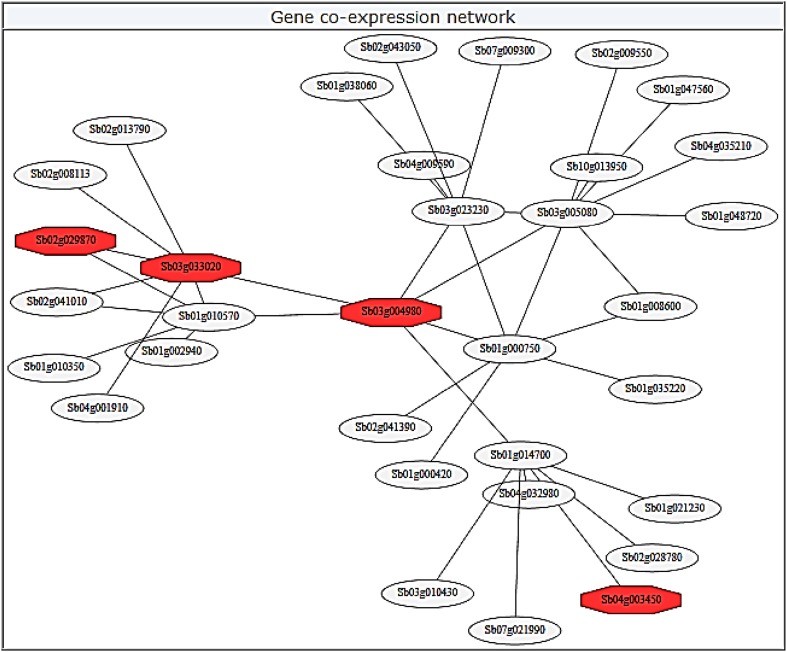
To understand roles of SbDREB2A gene in metabolic pathways, a co-expression network of SbDREB2A (Sobic.003G058200) was constructed using MOROKOSHI Sorghum transcriptome database (Fig. 8). The six first neighbors were identified for SbDREB2A gene, including Sb03g033020.1 (transcription factor GT-2 and related proteins, contains trihelix DNA-binding/SANT domain), Sb01g010570.1 (transcription regulator), Sb03g023230.1 (unknown protein), Sb03g005080.1 (DNA-binding protein, putative), Sb01g000750.1 (RNA recognition motif (RRM)-containing protein), and Sb01g014700.1 (F-box family protein). In addition, two transcription factors were found as Sb02g029870.1 (bZIP transcription factor, putative bZIP69) and Sb04g003450.1 (pathogenesis related homeodomain protein A, PRHA) in other neighbors. The F-box is a protein motif consisting of nearly 50 amino acids that function as a site of protein–protein interaction (Kipreos and Pagano 2000). F-box proteins play roles in various cellular processes such as cell cycle transition, transcriptional regulation, and signal transduction with Skp1p–cullin–F-box protein (SCF) complexes or non-SCF complexes (Kuroda et al. 2002). Trihelix family transcription factor (known as GT factor) is one of the plant-specific TF families, and they function in development and stress tolerance in various plants (Li et al. 2017). The GT factors bind to GT elements present in the promoters for many plant genes (Ayadi et al. 2004). Members of the RNA-editing factor interacting protein (RIP) family and Organelle RNA Recognition Motif-containing (ORRM) family are vital components for editosome in Arabidopsis (Shi et al. 2016). The basic leucine zipper (bZIP) TF family regulates essential processes in all eukaryotes. The bZIPs are regulators of many metabolic processes such as leaf and seed formation, photomorphogenesis, energy homeostasis, and abiotic and biotic stress responses in plants (Corrêa et al. 2008). On the basis of the above given data, it can be proposed that SbDREB2A gene may play roles in the regulation of various metabolic processes in sorghum. TFs regulate gene expressions depending on intrinsic and extrinsic signal; thus, there are regulatory relationships among TFs. When primary transcription factors are expressed, they induce another one or another target gene. This process repeats and as known transcriptional cascade (Jothi et al. 2009). In this study, four TFs were found in co-expression network, suggesting that SbDREB2A gene may be a member of transcriptional cascade in metabolic pathways of sorghum.
Fig. 8.
Co-expression networks of SbDREB2A gene by MOROKOSHI Sorghum transcriptome database. Sb03g004980 shows the synonym of SbDREB2A (Sobic.003G058200). In addition, the red filled octagons show the transcription factors
Analyses of miRNAs targeting
MicroRNAs (miRNAs) are endogenous small RNA class with mostly consisting of 20–24 nucleotide controlling gene expression. In plants, miRNAs regulate gene expression, including transcription factors, stress response proteins, and proteins affecting development, growth, and physiology of plants (Ding et al. 2012; Rogers and Chen 2013). miRNAs function in two ways: suppressing translation of a target gene or degrading target mRNAs post-transcriptionally (Carrington and Ambros 2003). In sorghum, 113 conserved miRNA homologs belonging to 31 distinct miRNA families were found by processing the small RNA reads (Zhang et al. 2011). Under drought stress, a significant de-regulation was identified with miR396, miR393, miR397-5p, miR166, miR167, and miR168 in 11 elite sorghum genotypes (Hamza et al. 2016). In the present study, six SbDREB2 genes were searched against psRNATarget database using 241 known miRNAs for sorghum to identify miRNAs that play roles in regulation of SbDREB2 genes. Finally, five types of miRNAs were identified for SbDREB2A, SbDREB2B, SbDREB2C1, and SbDREB2C2 (Table 4). Katiyar et al. (2015) reported that induced expression of miR156b, miR396b-c, miR396d-e, miR396f, and miR5385 was enhanced under drought stress in drought tolerant genotype in sorghum. Zhang et al. reported that the least-abundant expression was found for miR393, miR437, miR1126, and miR1436 in sweet Sorghum (M81E). In addition, miR5568-TAS derived tasi-RNA (trans-acting short-interfering RNA) was detected in drought-stressed library of a drought-sensitive genotype targeting a universal stress protein (USP) (Katiyar et al. 2015). In the present study, sbi-miR5385 was identified for SbDREB2C1 gene by translation inhibition, suggesting that this gene may play roles in response to drought stress.
Table 4.
Details of predicted miRNAs for SbDREB2 genes using psRNATarget database
| Target gene | miRNA acc. | Expectation | miRNA sequence | Inhibition type |
|---|---|---|---|---|
| Sobic.009G101400.1 | sbi-miR6232a-5p | 4.5 | UACAUGGUUUUUUCAGUUUCGCUG | Cleavage |
| Sobic.009G101400.1 | sbi-miR437x-5p | 5 | UUUCAAACUGAAUCCUGUUGAGAU | Cleavage |
| Sobic.003G058200.1 | sbi-miR5568e-3p | 5 | UGCAAAAUCGAAAAGAUCUAU | Translation |
| Sobic.007G162700.1 | sbi-miR5385 | 5 | CUCUUCGCCACCCCAACCACCA | Translation |
| Sobic.001G378900.1 | sbi-miR5386 | 4.5 | GUCGCGCGCGCUGUCGCUGC | Cleavage |
Expression profiles of SbDREB2 genes under Cd and drought stresses
DREBs are important transcription factors that are induced by abiotic stress-related genes. They can be separated into two groups, DREB1 and DREB2, members of which are involved in two different signal transduction pathways under low temperature and dehydration, respectively (Agarwal et al. 2006). In the present study, to elucidate their roles in stress conditions, expressions of SbDREB2 genes in sorghum root and leaf tissues under NaCl and Cd stresses were quantified using RT-qPCR. In the analysis, the expressions of four DREB2 genes (SbDREB2A, 2B, 2C2, and 2D) were detected, but SbDREB2C1 and 2E (Fig. 9). Under Cd stress, SbDREB2A and 2C2 were down-regulated in both root and leaf tissues, while SbDREB2B was down-regulated only in leaves (Fig. 9a). Conversely, SbDREB2D in both leaves and roots was up-regulated, but SbDREB2B only in roots. Mizoi et al. (2013) reported that GmDREB2A;2 was expressed not only by dehydration and heat but also by low temperature in soybean. In a similar study, expression level of ZmDREB2A increased by cold, dehydration, salt and heat stresses in maize seedlings (Qin et al. 2007). Hwang et al. (2012) proposed that Arabidopsis DREB2C gene was expressed by a superoxide anion propagator, methyl viologen (MV), suggesting that Arabidopsis DREB2C is an oxidative stress-responsive gene. The mentioned data establish that DREB2 TFs are induced under various abiotic stresses, explaining the induction of SbDREB2 genes under Cd stress.
Fig. 9.
Expression of SbDREB2 genes under Cd (a) and NaCl (b) stresses in sorghum leaves and roots detected by RT-qPCR. Bars above/below x-axis demonstrate up- and down-regulation of genes, respectively. Expression values are indicated as log2 scale to better represent the symmetry of magnitude for up and down-regulated genes. Error bars depict standard deviation of the mean (sdom; n = 3). Values with identical lowercase letters are not significantly different (P < 0.01) as compared by Student’s t test
Under NaCl stress, all SbDREB2 genes were up-regulated in roots, while SbDREB2A and 2B gene were up-regulated only in leaves (Fig. 9b). On the other hand, SbDREB2C2 and 2D were down-regulated in leaves. It was reported that DREB2A and DREB2B transcription factors in Arabidopsis were induced by dehydration stress and enhanced expression of various genes related to drought tolerance (Liu et al. 1998; Nakashima et al. 2014). In pearl millet (P. glaucum), PgDREB2A gene was up-regulated under drought stress within 1 h of treatment, whereas the expression was delayed when plants were exposed to cold and salinity stresses (Agarwal et al. 2007). Herath (2016) showed that OsDREB2B was highly expressed under three stress conditions (drought, cold, and salt). Highest OsDREB2B expression was estimated under cold stress in silico expression analysis of OsDREB2s genes. In addition, both OsDREB2A and OsDREB2C indicated highest expression under drought stress. In tomato, SlDREB2 was up-regulated in roots and young leaves under NaCl exposure, and it was also induced by KCl and drought (Hichri et al. 2016). In foxtail millet (Setaria italica), a significant up-regulation of SiDREB2 was detected under dehydration (polyethylene glycol) and salinity (NaCl) stresses, while its expression was less affected by other stresses (Lata et al. 2011). Finally, the results of these reported studies were similar to our findings.
Seconder and tertiary structures analyses of DREB2 proteins
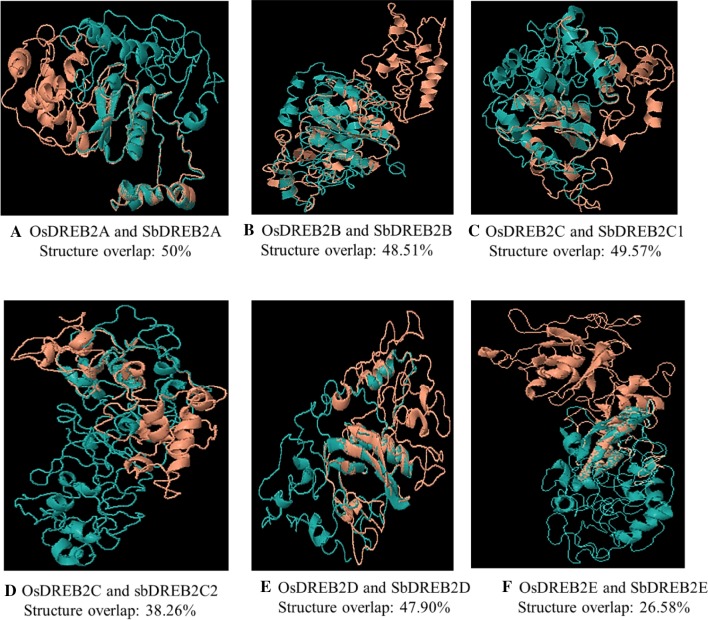
To better understand functions of SbDREB2 proteins, we first performed secondary and tertiary structure analyses (Fig. 10). According to the results of secondary structure analysis, percentage (%) of alpha helix (α-helix), extended strand (E-strands), beta-turn (β turn), and random coil were ranged from 30.15 to 40.08, from 10.76 to 16.79, from 3.35 to 9.16, and from 33.97 to 53.09, respectively. Ji and Li (2010) reported that the secondary structures play important roles in protein structure and folding. These results proved that some structural variations observed in SbDREB2 proteins may be related with functional flexibilities of SbDREB2 proteins. Subsequently, all SbDREB2 proteins were modelled using Phyre2 server at intensive mode. The Ramachandran plot analysis was used for model validation by Vadar server. The results showed that more than 90% of residues were present in core and allowed regions, indicating the reliability of 3D models. In addition, topology independent comparison of the 3D structures was performed by CLICK server comparing sorghum and rice DREB2 proteins (Fig. 8). While the highest structure overlap was found as 50% between OsDREB2A and SbDREB2A (Fig. 7a), the lowest overlap found as 26.58% between rice OsDREB2E and SbDREB2E (Fig. 7f). In phylogenetic tree, OsDREB2A and SbDREB2A and OsDREB2E and SbDREB2E were grouped together with 99% and 92% bootstrap values, respectively. While OsDREB2B and SbDREB2B were clustered as 58% bootstrap value which is the lowest value in phylogenetic tree, structure overlap for this group was found as 48.51%, suggesting that phylogenetic relationship may not be directly connected with 3D structure similarity for all SbDREB2 genes. Upon having compared 3D models of AP2 domain structures of DREB proteins in Oryza sativa and Avena sativa, some structural divergences were detected at Pro59, Gly60, and Arg62 amino acid residues contributing to β-sheet formation in rice, which were not presented in their A. sativa complements (Filiz and Tombuloglu 2014). In the present study, some structural divergences were detected on 3D structures of SbDREB2 proteins; these variations could support the functional diversities of SbDREB2 genes in cell metabolism.
Fig. 10.
Structure overlaps of DREB2 proteins at superimposition mode by CLICK server. The orange and blue 3D structures show the rice and sorghum, respectively. In addition, structure overlaps values (%) were indicated in figure legends
In conclusion, SbDREB2 genes and proteins were analyzed at two steps: bioinformatics approaches and transcript levels in this study. The bioinformatics analyses showed that SbDREB2 genes indicated structural variations and differences at expression levels. In addition, SbDREB2 proteins exhibited some structural differences in secondary and tertiary structures. According to the expression profiles under Cd and NaCl stresses, expression of SbDREB2 genes showed variations with regard to stress and tissue types. Particularly, SbDREB2A and 2B under NaCl stress and SbDREB2D under Cd stress showed more dynamic expression profiles over the others. Finally, results of this study will contribute to understandings of DREB2 genes in grasses, particularly sorghum under abiotic stress conditions.
Author contribution
EF and MAA conceived the study; MAA, EF, and KK conducted the experiments. MAA and EF wrote the manuscript; all authors read, edited, and approved the manuscript.
Compliance with ethical standards
Conflict of interest
The authors declare no conflict of interest.
Contributor Information
M. Aydın Akbudak, Email: akbudak@akdeniz.edu.tr.
Ertugrul Filiz, Email: ertugrulfiliz@gmail.com.
References
- Agarwal PK, Agarwal P, Reddy MK, Sopory SK. Role of DREB transcription factors in abiotic and biotic stress tolerance in plants. Plant Cell Rep. 2006;25:1263–1274. doi: 10.1007/s00299-006-0204-8. [DOI] [PubMed] [Google Scholar]
- Agarwal P, Agarwal PK, Nair S, Sopory SK, Reddy MK. Stressinducible DREB2A transcription factor from Pennisetum glaucum is a phosphoprotein and its phosphorylation negatively regulates its DNAbinding activity. Mol Genet Genom. 2007;277:189–198. doi: 10.1007/s00438-006-0183-z. [DOI] [PubMed] [Google Scholar]
- Agarwal P, Agarwal PK, Joshi AJ, Sopory SK, Reddy MK. Overexpression of PgDREB2A transcription factor enhances abiotic stress tolerance and activates downstream stress-responsive genes. Mol Biol Rep. 2010;37:1125–1135. doi: 10.1007/s11033-009-9885-8. [DOI] [PubMed] [Google Scholar]
- Akbudak MA, Filiz E, Kontbay K. Genome-wide identification and cadmium induced expression profiling of sulfate transporter (SULTR) genes in sorghum (Sorghum bicolor L.) Biometals. 2018;31:91. doi: 10.1007/s10534-017-0071-5. [DOI] [PubMed] [Google Scholar]
- Ayadi M, Delaporte V, Li YF, Zhou DX. Analysis of GT-3a identifies a distinct subgroup of trihelix DNA-binding transcription factors in Arabidopsis. FEBS Lett. 2004;562:147–154. doi: 10.1016/S0014-5793(04)00222-4. [DOI] [PubMed] [Google Scholar]
- Bailey TL, Johnson J, Grant CE, Noble WS. The MEME suite. Nucleic Acids Res. 2015;43(W1):39–49. doi: 10.1093/nar/gkv416. [DOI] [PMC free article] [PubMed] [Google Scholar]
- Bihani P, Char B, Bhargava S. Transgenic expression of sorghum DREB2 in rice improves tolerance and yield under water limitation. J Agric Sci. 2011;149:95–101. doi: 10.1017/S0021859610000742. [DOI] [Google Scholar]
- Bonetta D, McCourt P. Genetic analysis of ABA signal transduction pathways. Trends Plant Sci. 1998;3:231–235. doi: 10.1016/S1360-1385(98)01241-2. [DOI] [Google Scholar]
- Carbon S, Ireland A, Mungall CJ, Shu S, Marshall B, et al. AmiGO: online access to ontology and annotation data. Bioinformatics. 2009;25:288–289. doi: 10.1093/bioinformatics/btn615. [DOI] [PMC free article] [PubMed] [Google Scholar]
- Carrington JC, Ambros V. Role of microRNAs in plant and animal development. Science. 2003;301:336–338. doi: 10.1126/science.1085242. [DOI] [PubMed] [Google Scholar]
- Corrêa LGG, Riaño-Pachón DM, Schrago CG, Vicentini dos Santos R, Mueller-Roeber B, Vincentz M. The role of bZIP transcription factors in green plant evolution: adaptive features emerging from four founder genes. PLoS One. 2008;3(8):e2944. doi: 10.1371/journal.pone.0002944. [DOI] [PMC free article] [PubMed] [Google Scholar]
- Dai X, Zhao PX. psRNATarget: a plant small RNA target analysis server. Nucleic Acids Res. 2011;39:W155–W159. doi: 10.1093/nar/gkr319. [DOI] [PMC free article] [PubMed] [Google Scholar]
- Delph LF, Kelly JK. On the importance of balancing selection in plants. New Phytol. 2014;201:45–56. doi: 10.1111/nph.12441. [DOI] [PMC free article] [PubMed] [Google Scholar]
- Ding J, Li D, Ohler U, Guan J, Zhou S. Genomewide search for miRNA-target interactions in Arabidopsis thaliana with an integrated approach. BMC Genom. 2012;13(Suppl 3):S3. doi: 10.1186/1471-2164-13-S3-S3. [DOI] [PMC free article] [PubMed] [Google Scholar]
- Filiz E, Tombuloğlu H. In silico analysis of DREB transcription factor genes and proteins in grasses. Appl Biochem Biotechnol. 2014;174:1272–1285. doi: 10.1007/s12010-014-1093-x. [DOI] [PubMed] [Google Scholar]
- Gasteiger E, Hoogland C, Gattiker A, Duvaud S, Wilkins MR, Appel RD, et al. Protein identification and analysis tools on the ExPASy server. In: Walker JM, et al., editors. The proteomics protocols handbook. Louisville: Humana; 2005. pp. 571–607. [Google Scholar]
- Geourjon C, Deleage G. SOPMA: significant improvements in protein secondary structure prediction by consensus prediction from multiple alignments. Comput Appl Biosci. 1995;11:681–684. doi: 10.1093/bioinformatics/11.6.681. [DOI] [PubMed] [Google Scholar]
- Goodstein DM, Shu S, Howson R, Neupane R, Hayes RD, Fazo J, et al. Phytozome: a comparative platform for green plant genomics. Nucleic Acids Res. 2012;40:1178–1186. doi: 10.1093/nar/gkr944. [DOI] [PMC free article] [PubMed] [Google Scholar]
- Hall TA. BioEdit: a user-friendly biological sequence alignment editor and analysis program for Windows 95/98/NT. Nucleic Acids Symp Ser. 1999;41:95–98. [Google Scholar]
- Hamza NB, Sharma N, Tripathi A, Sanan-Mishra N. MicroRNA expression profiles in response to drought stress in Sorghum bicolor. Gene Expr Patterns. 2016;20:88–98. doi: 10.1016/j.gep.2016.01.001. [DOI] [PubMed] [Google Scholar]
- Herath V. Small family, big impact: in silico analysis of DREB2 transcription factor family in rice. Comput Biol Chem. 2016;65:128–139. doi: 10.1016/j.compbiolchem.2016.10.012. [DOI] [PubMed] [Google Scholar]
- Hichri I, Muhovski Y, Clippe A, Žižková E, Dobrev PI, Motyka V, Lutts S. SlDREB2, a tomato dehydration-responsive element-binding 2 transcription factor, mediates salt stress tolerance in tomato and Arabidopsis. Plant Cell Environ. 2016;39:62–79. doi: 10.1111/pce.12591. [DOI] [PubMed] [Google Scholar]
- Horton P, Park KJ, Obayashi T, Fujita N, Harada H, Adams-Collier CJ, Nakai K. WoLF PSORT: protein localization predictor. Nucleic Acids Res. 2007;35:W585–W587. doi: 10.1093/nar/gkm259. [DOI] [PMC free article] [PubMed] [Google Scholar]
- Hruz T, Laule O, Szabo G, Wessendorp F, Bleuler S, Oertle L, Widmayer P, Gruissem W, Zimmermann P. Genevestigator v3: a reference expression database for the meta-analysis of transcriptomes. Adv Bioinform. 2008;2008:420747. doi: 10.1155/2008/420747. [DOI] [PMC free article] [PubMed] [Google Scholar]
- Hwang JE, Lim CJ, Chen H, Je J, Song C, Lim CO. Overexpression of Arabidopsis dehydration responsive element-binding protein 2C confers tolerance to oxidative stress. Mol Cells. 2012;33:135–140. doi: 10.1007/s10059-012-2188-2. [DOI] [PMC free article] [PubMed] [Google Scholar]
- Ji YY, Li YQ. The role of secondary structure in protein structure selection. Eur Phys J E. 2010;32:103–107. doi: 10.1140/epje/i2010-10591-5. [DOI] [PubMed] [Google Scholar]
- Jones DT, Taylor WR, Thornton JM. The rapid generation of mutation data matrices from protein sequences. Comput Appl Biosci. 1992;8:275–282. doi: 10.1093/bioinformatics/8.3.275. [DOI] [PubMed] [Google Scholar]
- Jothi R, Balaji S, Wuster A, Grochow AJ, Gsponer J, Przytycka MT, Aravind L, Babu MM. Genomic analysis reveals a tight link between transcription factor dynamics and regulatory network architecture. Mol Syst Biol. 2009;5:294. doi: 10.1038/msb.2009.52. [DOI] [PMC free article] [PubMed] [Google Scholar]
- Katiyar A, Smita S, Muthusamy SK, Chinnusamy V, Pandey DM, Bansal KC. Identification of novel drought-responsive microRNAs and trans-acting siRNAs from Sorghum bicolor (L.) Moench by high-throughput sequencing analysis. Front Plant Sci. 2015;6:506. doi: 10.3389/fpls.2015.00506. [DOI] [PMC free article] [PubMed] [Google Scholar]
- Kelley LA, Sternberg MJE. Protein structure prediction on the Web: a case study using the Phyre server. Nat Protoc. 2009;4:363–371. doi: 10.1038/nprot.2009.2. [DOI] [PubMed] [Google Scholar]
- Khan ZH, Kumar B, Dhatterwal P, Mehrotra S, Mehrotra R. Transcriptional regulatory network of cis-regulatory elements (Cres) and transcription factors (TFs) in plants during abiotic stress. Int J Plant Biol Res. 2017;5(2):1064. [Google Scholar]
- Kipreos ET, Pagano M. The F-box protein family. Genome Biol. 2000;1(5):reviews3002.1–3002. doi: 10.1186/gb-2000-1-5-reviews3002. [DOI] [PMC free article] [PubMed] [Google Scholar]
- Kumar S, Stecher G, Tamura K. MEGA7: molecular evolutionary genetics analysis version 7.0 for bigger datasets. Mol Biol Evol. 2016;33:1870–1874. doi: 10.1093/molbev/msw054. [DOI] [PMC free article] [PubMed] [Google Scholar]
- Kuroda H, Takahashi N, Shimada H, Seki M, Shinozaki K, Matsui M. Classification and expression analysis of Arabidopsis F-box-containing protein genes. Plant Cell Physiol. 2002;43:1073–1085. doi: 10.1093/pcp/pcf151. [DOI] [PubMed] [Google Scholar]
- Lata C, Prasad M. Role of DREBs in regulation of abiotic stress responses in plants. J Exp Bot. 2011;62:4731–4748. doi: 10.1093/jxb/err210. [DOI] [PubMed] [Google Scholar]
- Lata C, Bhutty S, Bahadur RP, Majee M, Prasad M. Association of a SNP in a novel DREB2-like gene SiDREB2 with stress tolerance in foxtail millet [Setaria italica (L.)] J Exp Bot. 2011;62:3387–3401. doi: 10.1093/jxb/err016. [DOI] [PMC free article] [PubMed] [Google Scholar]
- Lescot M, De´hais P, Moreau Y, De Moor B, Rouze´ P, Rombauts S. PlantCARE: a database of plant cis-acting regulatory elements and a portal to tools for in silico analysis of promoter sequences. Nucleic Acids Res. 2002;30:325–327. doi: 10.1093/nar/30.1.325. [DOI] [PMC free article] [PubMed] [Google Scholar]
- Li H, Huang W, Liu ZW, Wu ZJ, Zhuang J. Trihelix family transcription factors in tea plant (Camellia sinensis): identification, classification, and expression profiles response to abiotic stress. Acta Physiol Plant. 2017;39:217. doi: 10.1007/s11738-017-2518-2. [DOI] [Google Scholar]
- Librado P, Rozas J. DnaSP v5: a software for comprehensive analysis of DNA polymorphism data. Bioinformatics. 2009;25:1451–1452. doi: 10.1093/bioinformatics/btp187. [DOI] [PubMed] [Google Scholar]
- Liu Q, Kasuga M, Sahana Y, Abe H, Miura S, Yamaguchi-Shinozaki K, Shinozaki K. Two transcription factors, DREB1 and DREB2, with an EREBP/AP2 DNA binding domain separate two cellular signal, respectively, in Arabidopsis. Plant Cell. 1998;10:1391–1406. doi: 10.1105/tpc.10.8.1391. [DOI] [PMC free article] [PubMed] [Google Scholar]
- Livak KJ, Schmittgen TD. Analysis of relative gene expression data using real-time quantitative PCR and the 2(-Delta Delta C(T)) method. Methods. 2001;25:402–408. doi: 10.1006/meth.2001.1262. [DOI] [PubMed] [Google Scholar]
- Makita Y, Shimada S, Kawashima M, Kondou-Kuriyama T, Toyoda T, Matsui M. MOROKOSHI: transcriptome database in Sorghum bicolor. Plant Cell Physiol. 2015;56:e6. doi: 10.1093/pcp/pcu187. [DOI] [PMC free article] [PubMed] [Google Scholar]
- Matsukura S, Mizoi J, Yoshida T, Todaka D, Ito Y, Maruyama K, Shinozaki K, Yamaguchi-Shinozaki K. Comprehensive analysis of rice DREB2-type genes that encode transcription factors involved in the expression of abiotic stress-responsive genes. Mol Genet Genom. 2010;283:185–196. doi: 10.1007/s00438-009-0506-y. [DOI] [PubMed] [Google Scholar]
- Mizoi J, Shinozaki K, Yamaguchi-Shinozaki K. AP2/ERF family transcription factors in plant abiotic stress responses. Biochem Biophys Acta. 2012;1819:86–96. doi: 10.1016/j.bbagrm.2011.08.004. [DOI] [PubMed] [Google Scholar]
- Mizoi J, Ohori T, Moriwaki T, Kidokoro S, Todaka D, Maruyama K, Kusakabe K, Osakabe Y, Shinozaki K, Yamaguchi-Shinozaki K. GmDREB2A;2, a canonical dehydration-responsive element-binding protein 2-type transcription factor in soybean, is posttranslationally regulated and mediates dehydration-responsive element-dependent gene expression. Plant Physiol. 2013;161:346–361. doi: 10.1104/pp.112.204875. [DOI] [PMC free article] [PubMed] [Google Scholar]
- Nakashima K, Yamaguchi-Shinozaki K, Shinozaki K. The transcriptional regulatory network in the drought response and its crosstalk in abiotic stress responses including drought, cold, and heat. Front Plant Sci. 2014;5:170. doi: 10.3389/fpls.2014.00170. [DOI] [PMC free article] [PubMed] [Google Scholar]
- Panda P, Nath S, Chanu TT, Sharma GD, Panda SK. Cadmium stress-induced oxidative stress and role of nitric oxide in rice (Oryza sativa L.) Acta Physiol Plant. 2011;33:1737–1747. doi: 10.1007/s11738-011-0710-3. [DOI] [Google Scholar]
- Punta M, Coggill PC, Eberhardt RY, Mistry J, Tate J, Boursnell C, et al. The Pfam protein families database. Nucleic Acids Res. 2012;40:D290–D301. doi: 10.1093/nar/gkr1065. [DOI] [PMC free article] [PubMed] [Google Scholar]
- Qin F, Kakimoto M, Sakuma Y, Maruyama K, Osakabe Y, Tran LS, Shinozaki K, Yamaguchi-Shinozaki K. Regulation and functional analysis of ZmDREB2A in response to drought and heat stresses in Zea mays L. Plant J. 2007;50:54–69. doi: 10.1111/j.1365-313X.2007.03034.x. [DOI] [PubMed] [Google Scholar]
- Reddy DS, Sivasakthi K, Bhatnagar-Mathur P, Vadez V, Sharma KK. Evaluation of sorghum [Sorghum bicolor (L.)] reference genes in various tissues and under abiotic stress conditions for quantitative real-time PCR data normalization. Front Plant Sci. 2016;7:529. doi: 10.3389/fpls.2016.00529. [DOI] [PMC free article] [PubMed] [Google Scholar]
- Riechmann JL, Meyerowitz EM. The AP2/EREBP family of plant transcription factors. Biol Chem. 1998;379:633–646. doi: 10.1515/bchm.1998.379.6.633. [DOI] [PubMed] [Google Scholar]
- Rogers K, Chen X. Biogenesis, turnover, and mode of action of plant microRNAs. Plant Cell. 2013;25:2383–2399. doi: 10.1105/tpc.113.113159. [DOI] [PMC free article] [PubMed] [Google Scholar]
- Sakuma Y, Liu Q, Dubouzet JG, Abe H, Shinozaki K, Yamaguchi-Shinozaki K. DNA-binding specificity of the AP2/ERF domain of Arabidopsis DREBs, transcription factors involved in dehydration- and cold-inducible gene expression. Biochem Biophys Res Commun. 2002;290:998–1009. doi: 10.1006/bbrc.2001.6299. [DOI] [PubMed] [Google Scholar]
- Sakuma Y, Maruyama K, Osakabe Y, Qin F, Seki M, Shinozaki K, Yamaguchi-Shinozaki K. Functional analysis of an Arabidopsis transcription factor, DREB2A, involved in drought-responsive gene expression. Plant Cell. 2006;18:1292–1309. doi: 10.1105/tpc.105.035881. [DOI] [PMC free article] [PubMed] [Google Scholar]
- Sakuma Y, Maruyama K, Qin F, Osakabe Y, Shinozaki K, Yamaguchi-Shinozaki K. Dual function of an Arabidopsis transcription factor DREB2A in water-stress responsive and heat-stress-responsive gene expression. Proc Natl Acad Sci USA. 2006;103:18822–18827. doi: 10.1073/pnas.0605639103. [DOI] [PMC free article] [PubMed] [Google Scholar]
- Sharoni AM, Nuruzzaman M, Satoh K, Shimizu T, Kondoh H, Sasaya T, Choi IR, Omura T, Kikuchi S. Gene structures, classification and expression models of the AP2/EREBP transcription factor family in rice. Plant Cell Physiol. 2011;52:344–360. doi: 10.1093/pcp/pcq196. [DOI] [PubMed] [Google Scholar]
- Shi X, Germain A, Hanson MR, Bentolila S. RNA recognition motif-containing protein ORRM4 broadly affects mitochondrial RNA editing and impacts plant development and flowering. Plant Physiol. 2016;170:294–309. doi: 10.1104/pp.15.01280. [DOI] [PMC free article] [PubMed] [Google Scholar]
- Stockinger EJ, Gilmour SJ, Thomashow MF. Arabidopsis thaliana CBF1 encodes an AP2 domain-containing transcriptional activator that binds to the C-repeat/DRE, a cis-acting DNA regulatory element that stimulates transcription in response to low temperature and water deficit. Proc Natl Acad Sci USA. 1997;94:1035–1040. doi: 10.1073/pnas.94.3.1035. [DOI] [PMC free article] [PubMed] [Google Scholar]
- Swami AK, Alam SI, Sengupta N, Sarin R. Differential proteomic analysis of salt stress response in Sorghum bicolor leaves. Environ Exp Bot. 2011;71:321–328. doi: 10.1016/j.envexpbot.2010.12.017. [DOI] [Google Scholar]
- Tajima F. Statistical methods to test for nucleotide mutation hypothesis by DNA polymorphism. Genetics. 1989;123:585–595. doi: 10.1093/genetics/123.3.585. [DOI] [PMC free article] [PubMed] [Google Scholar]
- Vatansever R, Uras ME, Sen U, Ozyigit II, Filiz E. Isolation of a transcription factor DREB1A gene from Phaseolus vulgaris and computational insights into its characterization: protein modeling, docking and mutagenesis. J Biomol Struct Dyn. 2017;35:3107–3118. doi: 10.1080/07391102.2016.1243487. [DOI] [PubMed] [Google Scholar]
- Venter M, Botha FC. Synthetic promoter engineering. In: Pua EC, Davey MR, editors. Plant developmental biology—biotechnological perspectives. Berlin: Springer; 2010. pp. 393–414. [Google Scholar]
- Watterson GA. On the number of segregating sites in genetical models without recombination. Theor Popul Biol. 1975;7:188–193. doi: 10.1016/0040-5809(75)90020-9. [DOI] [PubMed] [Google Scholar]
- Willard L, Ranjan A, Zhang H, Monzavi H, Boyko RF, Sykes BD, Wishart DS. VADAR: a web server for quantitative evaluation of protein structure quality. Nucleic Acids Res. 2003;31:3316–3319. doi: 10.1093/nar/gkg565. [DOI] [PMC free article] [PubMed] [Google Scholar]
- Yamaguchi-Shinozaki K, Shinozaki K. A novel cis-acting element in an Arabidopsis gene is involved in responsiveness to drought, low temperature, or high-salt stress. Plant Cell. 1994;6:25 l–264. doi: 10.1105/tpc.6.2.251. [DOI] [PMC free article] [PubMed] [Google Scholar]
- Yamasaki M, Wright SI, McMullen MD. Genomic screening for artificial selection during domestication and improvement in maize. Ann Bot. 2007;100:967–973. doi: 10.1093/aob/mcm173. [DOI] [PMC free article] [PubMed] [Google Scholar]
- Yan HW, Hong L, Zhou YQ, Jiang HY, Zhu SW, Fan J, Cheng BJ. A genome-wide analysis of the ERF gene family in Sorghum. Genet Mol Res. 2013;12:2038–2055. doi: 10.4238/2013.May.13.1. [DOI] [PubMed] [Google Scholar]
- Zhang L, Zheng Y, Jagadeeswaran G, Li Y, Gowdu K, Sunkar R. Identification and temporal expression analysis of conserved and novel microRNAs in Sorghum. Genomics. 2011;98:460–468. doi: 10.1016/j.ygeno.2011.08.005. [DOI] [PubMed] [Google Scholar]
- Zhou M, Ma J, Pang J, Zhang Z, Tang Y, Wu Y. Regulation of plant stress response by dehydration responsive element binding (DREB) transcription factors. Afr J Biotech. 2010;9:9255–9279. [Google Scholar]


