Abstract
Current models of somatosensory perception emphasize transmission from primary sensory neurons to the spinal cord and on to the brain1–4. Mental influence on perception is largely assumed to be acting locally within the brain. We have now examined if there is top-down control of sensory inflow through the spinal cord directly by the cortex. Although traditionally viewed as a primary motor pathway5, a subset of corticospinal neurons (CSNs) originating in the S1/S2 somatosensory cortex directly innervate the spinal dorsal horn via corticospinal tract (CST) axons. We show here that either reduction in somatosensory CSN activity or transection of the CST selectively impairs behavioral responses to light touch without altering responses to noxious stimuli. Moreover, such CSN manipulation greatly attenuates tactile allodynia in a peripheral neuropathic pain model. Tactile stimulation activates somatosensory CSNs and their corticospinal projections facilitate light touch-evoked activity of cholecystokinin (CCK+) interneurons in the deep dorsal horn. This represents a touch-driven feed forward spinal-cortical-spinal sensitization loop, which is important for the recruitment of spinal nociceptive neurons under tactile allodynia. These results reveal direct cortical modulation of normal and pathological tactile sensory processing in the spinal cord and open up opportunities for new treatments for neuropathic pain.
To assess if descending corticospinal projections regulate sensory processing in the spinal cord, we performed a bilateral pyramidotomy6,7 to lesion the CST in the brainstem of adult mice (Fig. 1a, b) and tested them for sensitivity to noxious and innocuous sensory stimuli (Fig. 1c-i), with histological verification (Extended Data Fig. 1a). Bilateral CST lesions caused a marked deficit in behavioral responses to dynamic and static light touch, as indicated by a reduced response to stroking by a soft paintbrush (Fig. 1h) and increased latency to detect tape on the hindpaw plantar surface (Fig. 1i). Similarly, in the von Frey test, mice with the CST lesions exhibited reduced responses to innocuous low pressure punctate stimuli (0.16g)8 but had normal sensitivity to higher mechanical forces (0.6-2g), which activate nociceptors9 (Fig. 1g). The hindpaw withdrawal responses to noxious thermal and mechanical stimuli were though fully intact in mice with a pyramidotomy (Fig. 1c-f), as was gross motor performance (Extended Data Fig. 1b, c). The selective deficits in light touch sensitivity (Extended data Fig. 1a) corroborate the finding that CST axons co-terminate with low-threshold mechanosensory afferents in laminae III-V10,11 (Extended Data Fig. 2a, b).
Fig. 1. Adult CST ablation impairs light touch but not nociceptive behavioral responses.
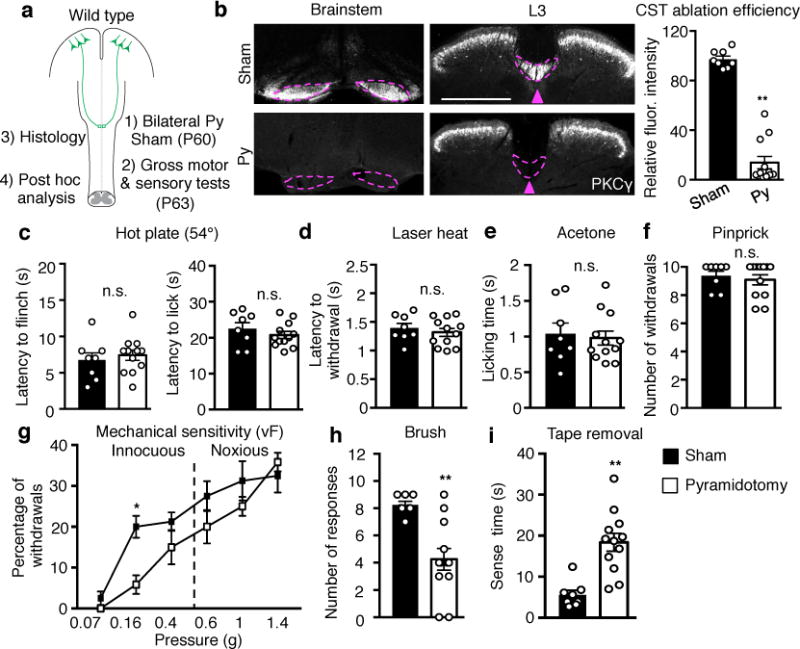
a, Schematic of experimental paradigm. Py: pyramidotomy. b, Left: Representative images of transverse sections of the brain stem at pyramids and dorsal spinal cord (L3) in sham (n=8) or pyramidotomized (n=12) mice for sensory tests stained with anti-PKCY. Arrowhead and dashed lines indicate the location of main CST. Scale bar: 500 μm. Right: Quantification of PKCY immunofluorescence intensity (normalized to control) in the lumbar dorsal funiculus of sham or pyramidotomized mice. P <0.0001. c-i, Measurement of thermal and mechanical sensitivities by: hot plate (c, P=0.59 and 0.35 for flinch and lick, respectively), laser heat (d, P=0.50), acetone (e, P=0.73), pinprick (f, P=0.58), von Frey filaments (g, P=0.016 for 0.16g), dynamic light brush (h, P=0.001), and tape removal (i, P=0.0003) in sham (n=8) or pyramidotomized mice (n=12). In b, c-f, h, and i, two-sided t-test; In g, two-way repeated measures ANOVA followed by Bonferroni correction. Data are presented as mean±SEM.
To determine which populations of CSNs in which areas of the cerebral cortex12 may be responsible for the sensory modulation, we used anterograde tracing to identify if there is innervation of the dorsal horn of the spinal cord. We found that CST axons from hindlimb S1 cerebral cortex, with a minor contribution from S2, terminate in laminae III-V (Fig. 2a,b), suggesting a sensory role, while the hindlimb motor cortex projects more ventrally, to laminae VI-VII (Fig. 2a,b) compatible with its known motor functions. Thus, CST axons from the somatosensory cortices (S1/S2) are more likely to execute control over tactile sensory processing in the spinal cord. To test this further, we used intersectional targeting12–14 to express human diphtheria toxin receptor (DTR) in S1/S2 CSNs, enabling selective ablation only of these neurons. High-efficiency retrograde lentiviral vectors (HiRet) expressing Cre were injected into the lumbar spinal cord (T13-L6) of mice at P14, a time when cortical pruning is complete15,16, followed by an injection of AAV-FLEX-DTR into S1/S2 (Fig. 2c). Administration of diphtheria toxin to these mice ablated ~85% of CSNs in S1/S2 (Extended Data Fig. 3), and mice with such selective ablation fully phenocopied the results of pyramidotomy (Fig. 2d-g), indicating that it is the CST axons from S1/S2 cortex that contribute to tactile sensitivity.
Fig. 2. Hindlimb somatosensory CSN ablation causes specific loss of light touch response and mechanical allodynia.
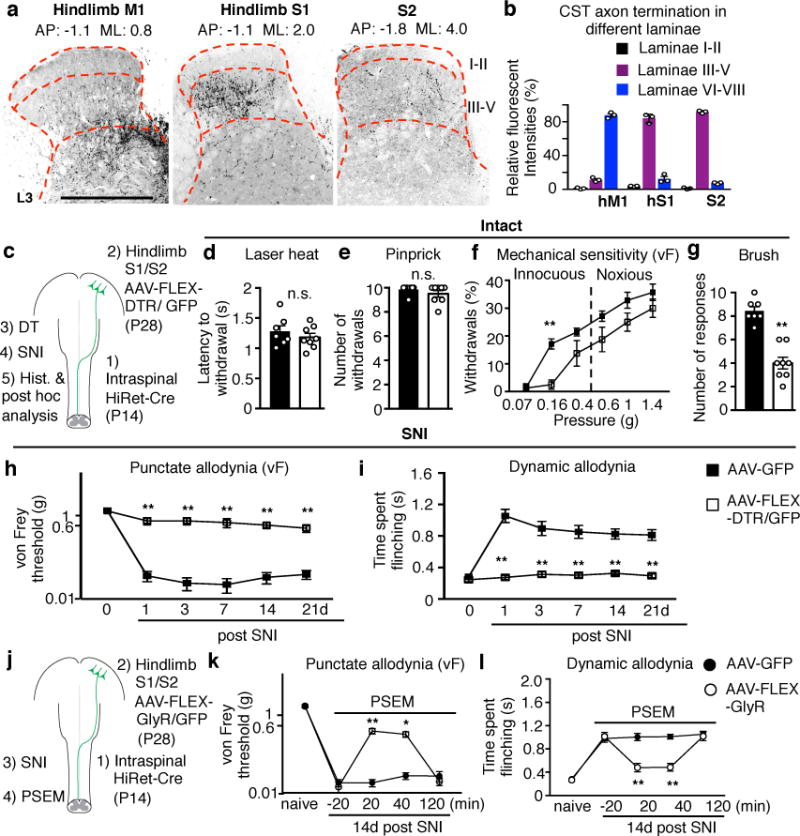
a, Representative images showing projection patterns of CST axons originating from indicated cortical areas. Scale bar: 500 μm. b, Quantification of relative CST termination percentile within different laminae from indicated cortical areas (n=3). c, Schematic of regional CSN ablation where HiRet viruses were injected into the lumbar spinal cord (T13-L6) at P14. d-g, Measurements of sensitivity to laser heat (d, P=0.40), pinprick (e, P=0.28), von Frey filaments (f, P=0.004 for 0.16g) and brush stimuli (g, P<0.0001) in control (n=7), or hindlimb somatosensory CSN ablated (n=8) animals. h-i, Measurement of punctate and dynamic mechanical allodynia after SNI in control (n=7) and hindlimb somatosensory CSN ablated (n=8) animals. j, Schematic of S1/S2 CSN silencing when HiRet-Cre was injected into the lumbar spinal cord at P14. k-l, Measurement of punctate and dynamic allodynia after SNI with PSEM administration in AAV-FLEX-GlyR (n=7) or AAV-GFP (n=8) injected mice. In h, i, k, l, P= 0.0001 & 0.0006 for 14 and 21d in I; P=0.002 & 0.016 for 20 & 40 min in k, P<0.0001 for others with **. In d,e,g, two-sided t-test. In f, h, i, k, l, two-way repeated measures ANOVA followed by Bonferroni correction. Data are presented as mean±SEM.
A prominent feature of peripheral neuropathic pain is mechanical allodynia where light touch triggers pain3,4. To assess if the CST modulates mechanical allodynia we subjected mice with ablation of S1/S2 CSNs to the spared nerve injury (SNI) model of neuropathic pain17. S1/S2 CSN-ablated mice exhibited a profound reduction both in the punctate allodynia evoked by low intensity static von Frey stimuli and in the dynamic allodynia evoked by brush at all time points tested (1 to 21d) (Fig. 2h,i). Mice with a pyramidotomy also failed to develop mechanical allodynia either by SNI (Extended Data Fig. 4a-c) or by intraplantar injection of complete Freund’s adjuvant (CFA), a model of peripheral inflammatory pain (Extended Data Fig. 4f, g). However, the CST-lesioned mice still exhibited cold allodynia and hyperalgesia in response to intense mechanical stimuli after SNI (Extended Data Fig. 4d, e). We conclude that CSNs from S1/S2 are required for the induction of mechanical allodynia but not other aspects of the pain hypersensitivity phenotype. In support of this, transiently silencing CSNs in the hindlimb S1/S2 cortex using an inducible chemogenetic method18 diminished established mechanical allodynia in SNI mice (Fig. 2j-l). These results show that somatosensory CSNs projecting to the deep dorsal horn contribute both to innocuous tactile processing in normal conditions and the generation of mechanical allodynia in pathological states, something not suspected before.
To assess how CSNs in S1 respond to peripheral tactile stimulation, we used in vivo miniaturized microscopy12,19 to monitor calcium levels in CSNs expressing GCaMP6s, a genetically encoded fluorescent calcium indicator (Fig. 3a, Extended Data 5). Activities of S1 CSNs in intact freely moving mice were sparse and scattered over time (Fig. 3b, c). In contrast, brush or von Frey stimulation, but not laser heat, to the hindpaw elicited calcium activity in a subset of S1 CSNs, and such activation was significantly increased after SNI in the same mice (Fig. 3b, c). In addition, the proportion of cells responding to both brush and von Frey was increased after SNI (Extended Data Fig 5). Thus, CSNs in the somatosensory cortex of intact mice are activated by innocuous tactile stimuli and this is amplified under neuropathic pain conditions, suggesting a spinal-cortical-spinal sensitization loop.
Fig. 3. Light touch elicited activation of somatosensory CSNs and spinal dorsal horn neurons.
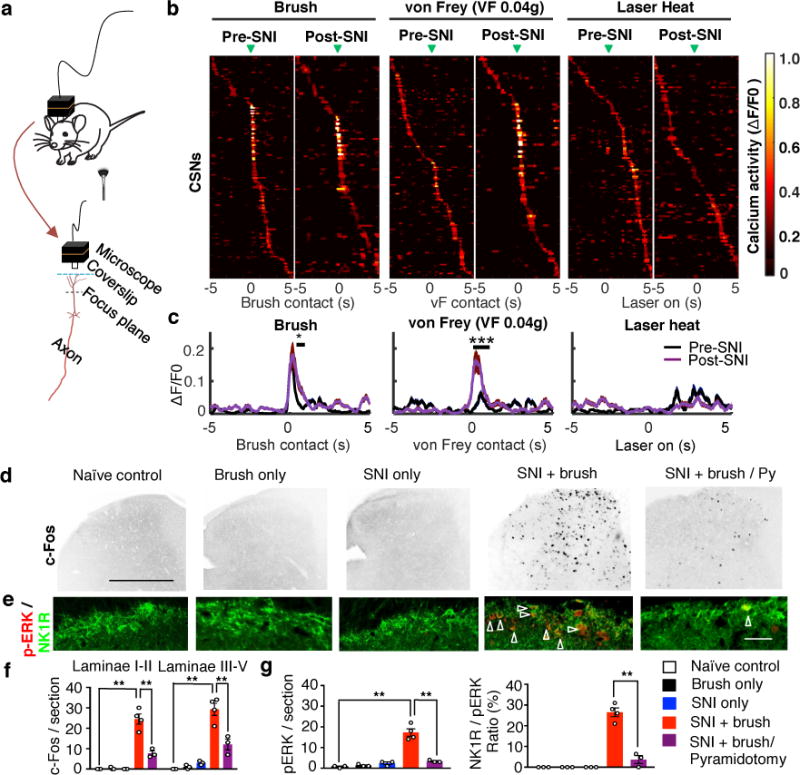
a, Diagrams showing calcium activity imaging in S1 CSNs by a head-mounted miniaturized microscope. b, Trial-average activity of CSNs in response to indicated sensory stimuli before and after SNI. Active calcium event traces were aligned to the time when the brush (Pre-SNI: n=156 neurons from 4 mice, Post-SNI: n=103 neurons from 4 mice), von Frey (Pre-SNI: n=151 neurons from 4 mice, Post-SNI: n= 94 neurons from 4 mice), or laser (Pre- SNI: n=156 neurons from 4 mice, Post-SNI: n= 116 neurons from 4 mice) affected the hindpaw (green arrowheads). Trial averages (13-17 trials/mouse) were sorted based on peak activity time. Arrowheads indicate onset of stimulation. c, Average response to brush, von Frey (0.04g) and laser heat stimuli pre- and post-SNI. Number of neurons is the same as listed in b. *and ***, P=0.03 and 0.0002 for brush and von Frey, respectively, ranksum test. d-g Representative images (d,e) and quantification (f,g) of c-Fos and pERK (red)/NK1R (green) immunoreactivity in the dorsal horn of the spinal cord (L3-L4) in naïve control (n=3), brush only (n=3), SNI only (n=3), SNI and brush (n=4), SNI and brush with pyramidotomy (n=3) animals. Scale bar: 500 and 100 μm in d, e, respectively. Arrowheads indicate the co-localization of pERK and NK1R immunostaining. For f and g, one-way ANOVA followed by Bonferroni correction. P=0.0008 for SNI+brush with/without Py in f, P<0.0001 for all others with **. Data are presented as mean±SEM.
We next examined whether descending CST axons modulate the neuronal activation evoked by low intensity mechanical stimulation in the spinal cord. Few c-Fos+ cells were detected in the dorsal horn of intact mice after brush stimulation and in SNI mice without brush stimulation (Fig. 3d). However, brush stimulation in SNI mice increased c-Fos+ cells in all laminae (I-V) of the ipsilateral dorsal spinal cord (Fig. 3d,f), and importantly, a CST lesion reduced this elevation both in deep laminae (III-V) and in superficial lamina I/II, a region that normally only processes inputs from nociceptors and which is not contacted directly by CST (Fig. 3d,f). These results suggest that CST inputs contribute to the level of brush-evoked neuronal activation in all laminae of the dorsal horn. Neurons expressing NK1R in lamina I of the spinal cord are a major nociceptive output pathway to the brain20,21. To assess if CSNs modulate their patterns of activation, we monitored phospho-ERK (pERK) immunoreactivity as an activity-marker22. Tactile stimuli in SNI but not intact mice induced significantly higher levels of pERK/NK1R+ neurons in laminae I (Fig. 3e, g) in a CST-dependent manner (Fig. 3e, g). Tactile stimulation after SNI in the presence of an intact CST directly activates neurons in laminae III-V, and indirectly increases activation of lamina I projection neurons. The latter likely results from a disinhibition of polysynaptic circuits connecting laminae III-V with lamina I4,20,23. Consistently, CST ablation also blocked the mechanical allodynia caused by spinal disinhibition produced pharmacologically by inhibiting GABA and glycine activity21,23 (Extended Data Fig. 6). These data indicate that the corticospinal pathway acting on their direct targets in laminae III-V is required for low threshold afferent inputs to activate ascending nociceptive pathways after SNI. Supporting this we find that the activation of multiple brain areas, including CSNs in S1/S2, produced by tactile stimulation after SNI is blocked by CST ablation (Extended Data Fig. 7).
We next investigated which neurons in the dorsal horn are targeted by the S1/S2 CST. Excitatory CCKiresCre-labeled cells in the deep dorsal horn are co-innervated by the CST and Aβ and their selective silencing results in tactile defects11, making them likely players. Indeed, we found that selective ablation of CCK+ interneurons in the lumbar spinal cord (T13-L6) phenocopied CST lesions (Figs. 1 and 2), producing selective defects in tactile sensitivity in intact mice and a reduction of mechanical allodynia after SNI (Fig. 4a-d, Extended Data Fig. 8a-f). CCK+ interneuron ablation also significantly reduced brush stimulation-triggered c-Fos+ cells in all dorsal horn laminae in SNI mice (Extended Data Fig. 8g, i), but to a lesser extent than pyramidotomy (Fig. 3d, f), suggesting contributions of other neurons co-innervated by CST and Aβ fibers11. Nevertheless, these results show that CCK+ interneurons in deep laminae of the dorsal horn are critical players in the facilitatory effects of the CST on tactile sensitivity and mechanical allodynia.
Fig. 4. Lumbar CCK+ neurons receive convergent Aβ and CST inputs and are required for mechanical allodynia.
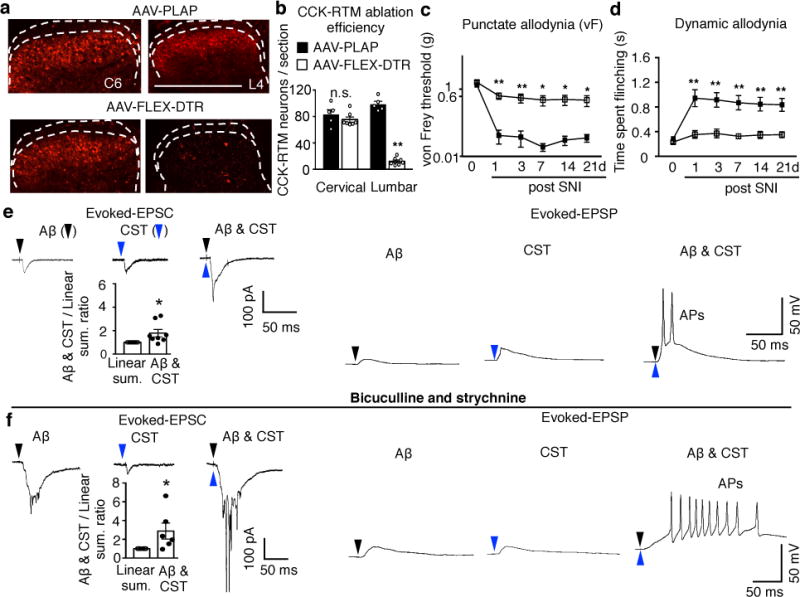
a-b, Representative images (a) of cervical and lumbar spinal cord dorsal horn in control (AAV-PLAP, n=5) or CCK-RTM neuron ablated (AAV-FLEX-DTR, n=7) mice with quantification (b). P =0.35 and < 0.0001 for cervical and lumbar, respectively, two-sided t test. c-d, Measurement of punctate and dynamic mechanical allodynia after SNI in control (n=8) or CCK-RTM interneuron ablated (n=7) mice. Two-way repeated measures ANOVA followed by Bonferroni correction. P=0.002,0.01,0.03,0.03,0.04 and P<0.0001, =0.0003,0.0003,0.0009,0,0014 for 1,3,7,14, and 21d, respectively. e-f, Averaged traces of EPSCs evoked by Aβ, CST, and co-stimulation (−70mV, voltage clamp, left) or representative trace of EPSP/AP (current clamp, right) in CCK-RTM neurons without (e) or with bicuculline/strychnine treatment (f). Bar graphs under EPSC curves: Relative change of eEPSC amplitude evoked by Aβ/CST co-stimulation compared to the sum of amplitudes evoked by individual stimulation (n=8, in e, P=0.02; n=6, in f, P=0.04), one-sided paired t-test. Data are presented as mean±SEM.
To test if CCK+ interneurons are directly activated by the CST and Aβ, we performed whole-cell patch recordings in ex vivo spinal cord slices21,24,25, with attached dorsal roots prepared from CCK-RTM mice26, in which S1/S2-derived CST axons were labeled by channelrhodopsin2 (ChR2)-YFP (Extended Data Fig. 9a). Among all recorded CCK-RTM cells, 50% exhibited excitatory monosynaptic responses to both Aβ and CST stimulation (Extended Data Fig. 9b, c), but in only a few was single stimulation of either input sufficient to evoke action potentials (APs) (Extended Data Fig. 9b, c). However, in those neurons with direct connections from Aβ fibers and the CST (Extended Data Fig. 9d), co-stimulation of the afferents and descending pathway led to super-additive synaptic responses, with a significantly increased AP output (Fig. 4e). In the presence of bicuculline (GABAA receptor inhibitor) and strychnine (glycine receptor inhibitor), a treatment mimicking the spinal disinhibition that occurs in SNI21,23, such additive responses were further enhanced, with AP trains in all recorded CCK-RTM neurons (Fig. 4f). In SNI mice half of c-Fos+ cells in the dorsal horn following repetitive touch stimulation were CCK+ expressing (Extended Data Fig. 8g), and c-Fos immunoreactivity in these cells was abolished by pyramidotomy (Extended Data Fig. 8g, h). Together, these results suggest a crucial sensitizing role for CST inputs onto CCK+ interneurons in the processing of tactile input in naïve animals, and more so, after nerve injury.
Finally, we found that optical stimulation of CSNs in S1 in mice with ChR2 expression targeted to CSNs (Extended Data Fig. 10a), significantly extended the duration of paw flinching/licking after a light brush stimulus (Extended Data Fig. 10b, c), and increased brush-induced pERK in lamina I NK1R neurons (Extended Data Fig. 10d). We conclude that the direct output from the somatosensory cortex to the spinal dorsal horn via the CST mediates a powerful facilitation of tactile sensory processing in the spinal cord, which amplifies transmission of tactile-related signaling to the brain. This represents a spino-cortico-spinal feed-forward sensitization loop crucial for controlling tactile sensation and allodynia. Normalizing the excitability of somatosensory CSNs could be a potential target therefore, for treating neuropathic pain by pharmacological or electromagnetic manipulation. Furthermore, by identifying a direct cortical control of tactile processing within spinal circuits, these results provide a plausible explanation for how mental states could directly increase or decrease normal and pathological tactile sensations in different contexts or mood states, by controlling activity in transmission pathways from the spinal cord to the brain.
METHODS
Mice Strains
All experimental procedures were performed in compliance with animal protocols approved by the Institutional Animal Care and Use Committee at Boston Children’s Hospital or National Institute of Mental Health. C57Bl/6 wild type mouse, Rosa-LSL-ChR2EYFP (Jax#12569), Rosa-LSL-tdTomato27, CCKCre (Jax#012706) mouse strains were maintained on C57Bl/6 genetic background. For each sets of the behavioral measurement, animals used in experimental and control groups were littermates. The body weight and sexes were randomized and assigned to different treatment groups, and no other specific randomization was used for the animal studies. Behavioral tests were run blinded to the experimental condition.
Virus production and intraspinal injection
Lentivirus vectors of HiRet-GFP, HiRet-Cre (all lenti-virus titers were adjusted to 1.6-2×10¹² copies/ml for injection) were constructed based on the HiRet backbone13. To retrogradely target supraspinal neurons, HiRet-lenti-viruses were injected to the mice spinal cord guided by a Vevo 770 ultrasound system (VisualSonics, Toronto) as described before28.
Regional ablation/silencing of corticospinal neurons or CCK+ interneurons
For regional CSNs ablation, 2 μl HiRet-Cre viruses (2x10¹² copies/ml) were intraspinally injected in wild type mice at P4 (pilot experiment, data not shown) or P14. 1 μl AAV2/8-FLEX-DTR viruses (5x10¹² copies/ml) or AAV2/8-FLEX-PLAP viruses (5x10¹² copies/ml) as control were injected to the cortical areas covering ACC/PFC (AP: 0.8 - 2.5 mm, ML: 0.2 - 0.8 mm to the bregma) or the somatosensory cortex (S1: −0.3 - −1.6 mm, ML: 1.5 - 2.4 mm to bregma; S2: AP: −1.8 - −2.1 mm, ML: 3.3 - 4.0 mm to bregma), respectively. To monitor injection position and targeting efficiency, all mice were co-injected with AAV2/8-GFP in the cortex (5x10¹² copies/ml). Diphtheria toxin (DT, Sigma, D0564, 100 μg/kg) was administered intraperitoneally in adult animals (8 weeks). After behavioral and histological assessments were performed blindly, mice with incomplete CST ablation, as defined by more than 25% spared GFP+ axons in the lumbar spinal cord, were excluded for further analysis. In our pilot experiment, we found that diphtheria toxin (DT)-mediated CSN ablation in S1/S2 but not PFC/ACC, significantly impaired responses to light touch, while the responses to noxious heat or mechanical stimuli were not affected by these manipulations.
To transiently silence CSNs activity, 2 μl HiRet-Cre or PLAP viruses (2×10¹² copies/ml, respectively) were injected to the lumbar spinal cord at P14, 1ul AAV-2/8-FLEX-PSAML141F-Y115F-GlyR-IRES-GFP viruses (5x10¹² copies/ml) were injected (P28) to the cortical areas covering hindlimb S1/S2 cortical areas. After the measurement of von Frey and brush (see behavioral assessment) post the spared nerve ligation (SNI), PSEM308 (Apex Scientific, 10 mg/kg) was administered intraperitoneally at 20 min before re-measurement of the von Frey and brush. We verified the expression (GFP+) of GlyR in the somatosensory cortex as post hoc histological analysis.
For lumbar spinal CCK+ interneuron ablation, 3μl AAV2/8-FLEX-DTR viruses (5x10¹² copies/ml) or AAV2/8-FLEX-PLAP viruses (5x10¹² copies/ml) as control were injected (P21) into the lumbar spinal cord (T13-L6) of CCK-RTM mice. Diphtheria toxin (DT, Sigma, D0564, 100 μg/kg) was administered intraperitoneally at P35. Animals were subject for gross motor and sensory tests 2 weeks post DT injection. For post hoc examination, CCK-RTM+ cells were quantified in the cervical and lumbar spinal cord in AAV-FLEX-DTR or AAV-FLEX-PLAP injected animals, respectively.
Immunohistochemistry and Imaging
Mice were perfused transcardially with 4% paraformaldehyde (PFA) in phosphate-buffered saline (PBS) followed by further 4% PFA in PBS post-fixation overnight. The tissue was cryo-protected with 30% sucrose and processed using cryostat (section thickness 30 μm for spinal cord and 60 μm for brain). Sections were intensively washed with PBS and then treated with a blocking solution containing 10% goat normal serum (GNS), 0.5 % Triton-100 for 2 hours at room temperature before staining. The primary antibody used are chicken anti-GFP [Abcam (ab13970), 1:1000], rabbit anti-RFP [Abcam (ab34771), 1:1000], rabbit anti-PKCγ [Santa Cruz (sc211), 1:100], rabbit anti-c-fos [Cell signaling technology (2250), 1:200], mouse anti-pERK [Cell signaling technology (9106), 1:100], and rabbit-anti-NK1R [Sigma-Aldrich (S8305), 1:1000]. Secondary antibodies, including Alexa Fluor 488-conjugated goat anti chicken, Alexa Fluor 488, 594-conjugated goat anti rabbit, and IB4-Alex Fluor 488 conjugated were purchased from Invitrogen. Floating brain tissue section (60 μm) were incubated with primary antibodies overnight at 4°C and washed three times for 10 min with PBS before incubated with secondary antibodies, or IB4 (1:400 dilution) for 2 hours. After thoroughly washed with PBS, sections were mounted with ProLong antifade mounting medium with or without DAPI for imaging and analysis. Sections were imaged with a confocal laser-scanning microscope (Zeiss 700), or a wide field Nikon 80i Microscope (air).
Surgery
For pyramidotomy, the procedure is similar to what described previously8,9. Briefly, animals were anesthetized with ketamine/xylazine. An incision was made at the left side of the trachea, followed by the blunt dissection to expose the skull base. A craniotomy in the occipital bone was then performed to allow for access to the medullary pyramids. The left and right pyramids were cut with a fine scalpel medially up to the basilar artery. The wound was closed in layers with 6.0 sutures. Animals with pyramidotomy were tested for gross motor functions. Most animals showed normal gross motor functions, consistent with previous findings9,12,29,30. At the end point, the lumbar spinal cord sections from all mice were subjected to immunostaining with antibodies against PKCγ and the remaining PKCγ immunofluorescence in the dorsal column was quantified. As shown in Extended data Fig. 1, a few mice with inefficient CST ablation showed neither nociceptive nor tactile sensation deficits. With these criteria, we excluded animals with inefficient CST ablation and/or gross motor defects in all other independent experiments (CFA, c-fos, pERK quantification).
For anterograde labeling of CST axons (Fig. 2a-b), AAV2/1-ChR2-mCherry (1x10¹³ copies/ml for injection, produced by Boston Children’s Hospital, viral core) was injected to the mouse sensorimotor cortex at multiple sites as described previously12.
Spared nerve ligation (SNI) surgery was performed under isoflurane (3% for induction/2% for maintenance) on adult mice (8 to 12 weeks old). Briefly, the tibial and common peroneal branches of the sciatic nerve were tightly ligated with a 5.0 silk suture and transected distally, while the sural nerve was left intact15. After injury, incision was sutured and mice were allowed to recover on heated pads before being returned to their home cage. Both punctate and dynamic mechanical allodynia, cold allodynia, or mechanical hyperalgesia were measured at 1-21 days after SNI. To induce spinal disinhibition, we intrathecally injected 10 μl saline containing bicuculline (0.02 μg, Sigma-Aldrich, 14340) and strychnine (0.05 μg Sigma-Aldrich, S0532) into the spinal cord21. We started to measure mechanical allodynia 10 min after injection. For Complete Freund’s Adjuvant (CFA, Sigma)-induced inflammation, mice were anesthetized with isoflurane (2%). 20 μl of CFA was then injected into the plantar surface of the left hindpaw. Both punctate and dynamic mechanical allodynia were measured at 1-7 days after CFA treatment.
Behavioral experiments
Contact heat pain (Hot plate test)
Mice were placed on a metallic plate heated to a set temperature (50 or 54°C) within an acrylic container (Bioseb, France), and videotaped for their responses. The latency for flinching and licking one of the hindpaws were blindly measured by video analysis, respectively. One temperature was tested per day.
Laser heat pain
Individual mouse was habituated in a small plastic (7.5 × 7.5 × 15 cm) cage. A laser heat source was targeted at the paw and the latency to withdraw was measured.
Acetone test (cold allodynia)
Mice were habituated in a small plastic (7.5 × 7.5 × 15 cm) cage and a small volume of acetone (5 μl) was applied onto the plantar surface of the hindpaw. The time spent flinching or licking the paw was recorded for one minute.
Pinprick
Mice were habituated in a small plastic (7.5 × 7.5 × 15 cm) cage. The tester used a pin to touch the plantar surface of the hindpaw without skin penetration. Numbers of withdrawal response per 10 trials (within 1 min) were counted.
Calibrated forceps
Individual mouse was habituated and handled for several minutes. The day of the test, mice were gently handled and a calibrated forceps (Bioseb, France) was applied at the base of the tail to cause a brisk withdrawal reflex occurred. 3 measurements were performed per mouse. The pressure for reflex (g) was measured.
Tape removal
Mice were habituated in a transparent cylinder. A 9-mm diameter circular adhesive Microtube Tough-Spots label (Diversified Biotech, USA) was attached on the hindpaw plantar. The latency of biting or licking to remove the tape (sense time) was measured. 3 measurements were performed per mouse.
Brush (dynamic mechanical stimuli)
Each mouse was habituated in a small plastic (7.5 × 7.5 × 15 cm) cage for at least 1 h prior to testing. The plantar hindpaw was stimulated by light stroking with a paintbrush, in the direction from heel to toe. For baseline dynamic mechanical sensitivity, the test was repeated 10 times. The number of walking away or occasionally brief paw lifting was measured. For dynamic mechanical allodynia, the paw flinching/licking time was recorded as an indicator and averaged between 3 trials for individual animals.
von Frey filaments (static punctate mechanical stimuli)
Each mouse was habituated in a small plastic (7.5 × 7.5 × 15 cm) cage for at least 1 h prior to testing. Mechanical sensitivity was determined with a series of von Frey filaments (bending forces: 0.02, 0.04, 0.07, 0.16, 0.4, 0.6, 1 and 2 g, respectively) stimuli applied within the sciatic nerve territory (lateral part of the hindpaw). Each filament was tested 10 times in a manner of increasing order from the lowest force. Between individual measurements, von Frey filaments were applied at least 3s after the mice had returned to their initial resting state. For baseline static mechanical sensitivity, all filaments were applied and the number of withdrawals was recorded. For tactile allodynia, the minimal force filament for which animals presented either a brisk paw withdrawal and/or an escape attempt in response to at least 5 of the 10 stimulations was determined as the mechanical response threshold.
Open Field
To test overall locomotor activity, mice were individually placed on the side of a circular open arena that consisted of an unmarked floor enclosed by a 45 cm diameter wall and allowed to roam freely for 20 minutes. The arena was divided into the outermost periphery (“wall”), the center of the arena (15cm diameter), and the neutral zone between the center and the wall (25cm diameter). Video tracking software (Ethovision XT v11.5, Noldus BV, The Netherlands) was used to quantify the distance travelled in each zone by the animal. The arena was housed in a dimly lit room (30 lux) with no noise, and examiners were not present in the room during testing to allow for limited distractions to the mice.
Ground walking
For ground walking, mice were placed in the MotoRater (TSE Systems)12, kinematic analysis was performed based on data collected by the MotoRater.
Rotarod
Mice were trained for five times on a single speed (15 RPM) rotarod (IITC Life Science Inc.). After that, the latency to fall was recorded at next day. Experiment was repeated twice at 20 min intervals and the average was calculated as rotarod latency.
Calcium imaging in freely behaving mice
Mice used for calcium imaging experiments received HiRet-Cre (5x10¹² copies/ml) injection in spinal cord at p14. In adult, a cranial window was installed over the injected area following previously published procedures12,31–33. During the procedures, mice were anesthetized with Avertin (1.5% solution given at 0.01 ml/g, i.p.) and treated with dexamethasone (0.2 mg/kg, s.c.) and carprofen (5 mg/kg, s.c.) to prevent brain swelling and inflammation. A piece of skull (3.5 mm in diameter) above the somatosensory cortex was removed after high-speed dental drilling. AAV2/9-FLEX-syn-GCaMP6s (5x10¹³ copies/ml, 0.45 μl per animal) was injected into primary sensory (hindlimb S1) cortex using a micro-syringe pump. A 3-mm coverslip was used to seal the cranial window and the exposed scalp was sutured. After 7 days, the baseplate of a miniaturized integrated fluorescent microscope (Inscopix)34 was fixed on top of the coverslip17. Animals were then habituated to the attachment of the microscope for 2 days. Calcium imaging was then performed in freely moving mice without sensory stimulation, or in intact mice with light brush, von Frey fiber and laser heat applied to the hindpaw. SNI was then performed and calcium imaging was conducted on the same batch of animals at 3 days post-SNI. Sham controls were conducted in separate animals by cutting the skin on the hindlimb without damaging the nerves involved in SNI, and imaging sessions were performed before and after sham procedures. Each imaging session include 5 blocks: 20 min habituation, 4 minutes free moving and followed by 13-17 trials (trial interval: 10 second) of brush, von Frey and laser heat stimuli.
Calcium imaging was performed in freely moving mice using the head-attached microscope (Inscopix; LED power: 0.6 - 1.0 mW; camera resolution: 1440 x1080 pixels). Images were acquired at 30 Hz using nVista HD software (Inscopix). At the beginning of each imaging session, the protective cap of the previously implanted baseplate was removed and the microscope was attached. The imaging field of view was approximately 900 × 600 μm2 at 0.65 μm/pixel resolution and the imaging depth was selected by adjusting the focus of the microscope until clear dendritic trunk signals were observed, which appeared as bright spots in the images. The focal plane was 150-250 μm below the lens. Mouse behavior was recorded with a video camera (Canon), which was synchronized with calcium imaging using the trigger-out signal from nVista HD12.
Calcium imaging videos were analyzed by using Mosaic software (Inscopix) and custom-written scripts in Matlab following published algorithms35,36. Raw videos were first down-sampled by four-fold along spatial dimensions to reduce file size and noise. The mean fluorescence intensity of each pixel during a recording session (4-8 min) was calculated as F0 and changes in pixel intensity at time t were expressed as (Ft - F0)/F0 or ΔF/F0. To extract active dendritic signals, principal component and independent component analysis (PCA-ICA) was applied to the spatial-temporal data matrices of ΔF/F0 using CellSort and fastICA toolboxes (These toolboxes are freely downloadable from Matlab central35,36). This analysis decomposes a spatiotemporal data matrix into independent components based on the skewness of data distribution. Each component has a characteristic spatial filter over the imaged area and a corresponding temporal signal during the imaging period. The spatial filter and the temporal signal of each component were graphically displayed and inspected by human observers who were blind to the experimental conditions of each video. If the spatial filter for a component overlapped with the dark shadows casted by blood vessels in the F0 image, this component was likely contributed by blood flow and was therefore rejected. In addition, since calcium signals show characteristic fast-rising and slow-decaying time course37, the temporal skewness of calcium signals is expected to be positive and those components with skewness less than 1 were rejected35. For each selected component, the location of the dendritic trunk was identified as the brightest spot (3 × 3 pixel) of the spatial filter. The corresponding temporal signal of the dendritic trunk was calculated from the ΔF/F0 video by subtracting the median value of the background area (outside the dendritic tree) from the average value of the dendritic trunk area. Calcium activity in dendritic trunks tightly correlated with that in the soma in freely behaving mice12, similar to what has been reported before by two-photon microscopy38,39.
To identify periods of increased neuronal activity, we searched for the rising phase of each calcium event (peak ΔF/F0 > 3 standard deviation of baseline fluctuation), which has been shown closely associated with neuronal spiking activities37,40,41. The start of this rising phase is detected when the 1st derivative of ΔF/F0 (calculated in 200 ms moving window) rises above 0 and continues to increase above 5 standard deviation of baseline fluctuation41, and the end of this rising phase is detected when the 1st derivative of ΔF/F0 falls below 0. For each dendrite, the amplitude of each detected calcium event was normalized by the standard deviation of the whole calcium trace. To visualize the activity patterns of detected dendrites during stimulation, the active event traces of each CSN were aligned by the time when brush, Von Frey and laser heat was applied to the left plantar of hindlimb. The resulting traces from all the CSNs were sorted based on their peak activation time during the window and displayed in temporal raster plots.
To quantify the activity difference during pre- and post-SNI conditions, we first calculated the trial-average activities of CSN dendrites in response to different sensory stimuli, then compared the responses between pre- and post-SNI conditions within 1s after stimulation (ranksum tests). A significant increase in CSN activity in response to von Frey was observed after SNI (Fig. 3c), but not in sham controls (data not shown).
To quantify the proportion of activated neurons responding to brush only, von Frey only, or both stimuli in pre- and post-SNI conditions, we concatenated the calcium videos of the brush and von Frey sessions. Responsive neurons were classified based on whether they showed maximal trial average activity within 1s after either or both stimuli.
Spinal cord slice preparation and electrophysiology
To label CST axons, AAV-2/1-ChR2-YFP was unilaterally injected into the somatosensory cortex in neonatal CCK-RTM mice (P1). At P28-P31, mice were deeply anesthetized with isoflurane, decapitated and the lumbar spinal cord was quickly removed to ice-cold modified artificial cerebrospinal fluid (ACSF): NaCl, 80; KCl, 2.5; NaH2PO4, 1.25; CaCl2, 0.5; MgCl2, 3.5; NaHCO3, 25; sucrose, 75; sodium ascorbate, 1.3; sodium pyruvate, 3.0 (all in mM), with pH at 7.4 and osmolarity at 310-320 mOsm, and oxygenated with 95% O2 and 5% CO2. Sagittal spinal cord slices (350-500 μm) with dorsal roots (3-5 mm) attached were cut by a vibratome VT1000S (Leica, Germany). Slices were then incubated for about 1 h at 35°C in a solution that contains (in mM): NaCl, 125; KCl, 2.5; CaCl2, 2; MgCl2, 1, NaH2PO4, 1.25; NaHCO3, 26; D-glucose, 25; sodium ascorbate, 1.3; sodium pyruvate, 3.0 with pH at 7.2 and measured osmolality at 310-320 mOsm, and oxygenated with 95% O2 and 5% CO2. The slice was then transferred into a recording chamber and perfused with oxygenated recording solution at a rate of 5 ml/min prior to electrophysiological recordings at room temperature (23 °C).
For whole cell patch clamp recording, CCK-RTM neurons were viewed by an upright microscope (Olympus, BX51WI, Japan) with a 63X water-immersion objective, infrared differential interference contrast (IR-DIC) and fluorescence. Patch pipettes (5-10 MΩ) from borosilicate glass (Sutter, USA) were made by P-1000 horizontal micropipette puller (Sutter). Internal solution contains (in mM): potassium gluconate 130, KCl 5, MaATP 4, NaGTP 0.5, HEPES 100, EGTA 0.5, pH 7.28 with KOH, and measured osmolality at 280-300 mOsm. This internal solution allows separation of AMPAR and GABAA currents at the reversal potential of the other receptor. Data were acquired with pClamp 10.0 software (Molecular Devices, USA) using MultiClamp 700B patch-clamp amplifier and Digidata 1440A (Molecular Devices). Responses were low-pass filtered on-line at 4 kHz, digitized at 10 kHz. Junction potential was around 6-8 mV. No correction for junction potential was applied. Membrane capacitance (24.3 ± 1.1 pF), membrane resistance (493.4 ± 29.4 mOhm) were monitored continuously and cells were excluded from analysis if these values changed by more than 10% during experiment. Following established procedure22, recordings with series resistance greater than 30mOhm or resting membrane potential more depolarized than −50mV were excluded from analysis. All recordings were performed at room temperature (23 °C).
Voltage clamp recordings were performed by holding membrane potential at −70 mV. Under this condition, evoked inhibitory postsynaptic currents (eIPSCs) were minimized, and evoked excitatory postsynaptic currents (eEPSCs) were detected. This was used to study whether a neuron received inputs directly (mono-synaptic) or indirectly (poly-synaptic) from dorsal root or CST axons. Current clamp was also carried out at resting membrane potential in order to record evoked action potential output. Dorsal root stimulation was generated with ISO-Flex stimulus isolator (A.M.P.I.) and delivered with suction electrode (A-M Systems). CST electrical stimulation was delivered with bipolar stainless steel electrodes (WPI Inc). The stimulation pulse width was 0.1 ms and intensity for Aβ fibers was 25 μA, and 100 μA for CST. High-frequency stimulation at 20 Hz was used to determine mono-synaptic input for Aβ and CST fibers. Laser stimulation (473nm, 5 ms, 5mW) for activating CST axon terminals were delivered with fiber optic (200μm core, 0.22NA; Thorlabs) directly illuminating the recording area. Mono-synaptic transmission for opto-stimulation was verified by applying TTX (0.5 μM, Abcam) in the recording bath to block sodium channel, followed by 4-AP (2 mM, Sigma) to augment light-induced, direct depolarization of ChR2 axon terminals42. NBQX (5 μM) and CPP (20 μM) were used to block AMPAR and NMDAR currents, respectively. To mimic the spinal disinhibition condition, both voltage and current clamps were performed with the presence of both bicuculline (10 μM, Sigma) and strychnine (2 μM, Sigma).
Innocuous mechanical for c-Fos and/or pERK induction
To induce c-Fos expression by innocuous mechanical (dynamic brush) stimulation, animals were lightly restrained by using the rodent restraint bag (traditional triangle shape, AIMS). We used a paintbrush to stroke the hindpaw. Each touch, lasting 2 s and moving from the middle position of the foot to the distal foot pad along the peripheral side that belongs to the sural nerve territory, was applied once every 4 s for 10 min. This touch stimulus does not elicit a flexion reflex in normal mice. Animals were perfused two hours later and the spinal cord transverse sections were prepared for c-Fos immunostaining. For pERK induction, the same procedures were applied as for c-fos induction, except that mice were sacrificed immediately after repetitive mechanical brushing or 5 min after the thermal stimulation.
Light-based CSNs stimulation
The HiRet-Cre virus (2×10¹² copies/ml) was intraspinally injected into lumbar spinal cord of LSL-ChR2-YFP mice at P14 to retrogradely label hindlimb corticospinal neurons. 4 weeks later, the animals were subjected to optical stimulation experiments. For optic fiber implantation, animals were anesthetized with Ketamine/Xylazine (100 mg/kg ketamine, 10 mg/kg Xylazine) and mounted on stereotaxic frame. A 1-mm hole was drilled on the right side of skull, centered at −1.2 mm posterior to Bregma and 1.65 mm lateral to midline, with dura remained intact (Notice all SNI surgeries were performed on the left hindpaw). A customized fiber optic cannula (Ø1.25 mm Ceramic Ferrule, Ø200 μm Core, 0.50 NA, 2 mm projection; Thorlabs) was positioned on cortical surface through the hole. Silicon elastomer and dental cement were applied to protect the skull window and secure the cannula. The incision was sutured and animals were allowed to recover for 7 days prior to behavioral test. Prior to optogenetic stimulation, an optogenetic patch cable was connected to the cannula via mating sleeve. The patch cable was connected to laser source with rotary joint (FRJ 1x1, Doric) to allow the free moving of the animal. Laser stimulation (473 nm, 5mW; 100 pulses of 5 ms, 20 Hz) was delivered during sensory tests. We verified the expression of ChR2-YFP in the hindlimb S1 as post hoc histological analysis.
For pERK induction, animals were lightly restrained by using the rodent restraint bag (traditional triangle shape, AIMS). Laser stimulation (473 nm, 5mW; 100 pulses of 5 ms, 20 Hz) was delivered with 2-s interval for 10 min, and repeated for 3 times with 1- min rest between each session in SNI animals (contra-lateral cortex). Repetitive light brush (see c-fos section) was applied during optogenetic stimulation. Animals were perfused immediately after the stimulation.
Code Availability
All custom codes used in this study are available from the corresponding author on reasonable request.
Quantification and statistical analysis
The normality and variance similarity were measured by STATA (version 12, College station, TX, USA) before we applied any parametric tests. Two-sided or one-sided t-test was used for the single comparison between two groups. The rest of the data were analyzed using one-way or two-way ANOVA depending on the appropriate design. Post hoc comparisons were carried out only when a main effect showed statistical significance. P-value of multiple comparisons was adjusted by using Bonferroni’s correction. Error bars in all figures represent mean ± S.E.M. ***, **, *, and n.s.: P < 0.001, P < 0.01, P < 0.05 and no statistical significance (P ≥ 0. 05), respectively.
Extended Data
Extended Data Figure 1. Effects on tactile behaviors and gross locomotion in mice with pyramidotomy.
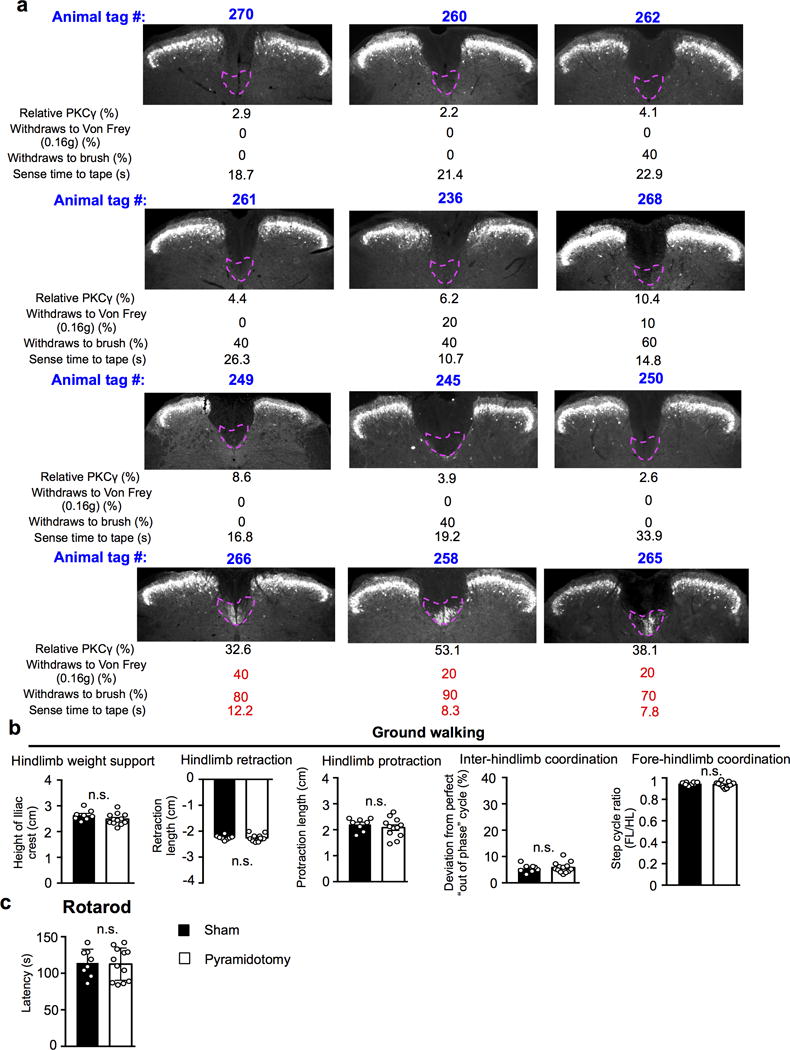
a, Correlation between CST ablation and tactile behaviors in mice with pyramidotomy. For individual animals, tag number, image and quantification of L3 spinal cord sections stained with anti- PKCγ antibody showing remaining CST axons, percentage of withdrawal response to low-threshold von Frey (0.16g) and light brush, and sense time to the tape were present in the group receiving pyramidotomy. b-c, Performance on over ground walking (b, P=0.14, hindlimb weight support; P=0.81, hindlimb retraction; P=0.41, hindlimb protraction; P=0.81, inter-limb coordination; P=0.20, fore-hindlimb coordination), and rotarod test (c, P=0.87) in mice with sham (n=8) or pyramidotomy (n=12). n.s.: no statistical significance. Two-sided student’s t-test. Data are presented as mean ± SEM.
Extended Data Figure 2. CST axon termination in the lumbar spinal cord.
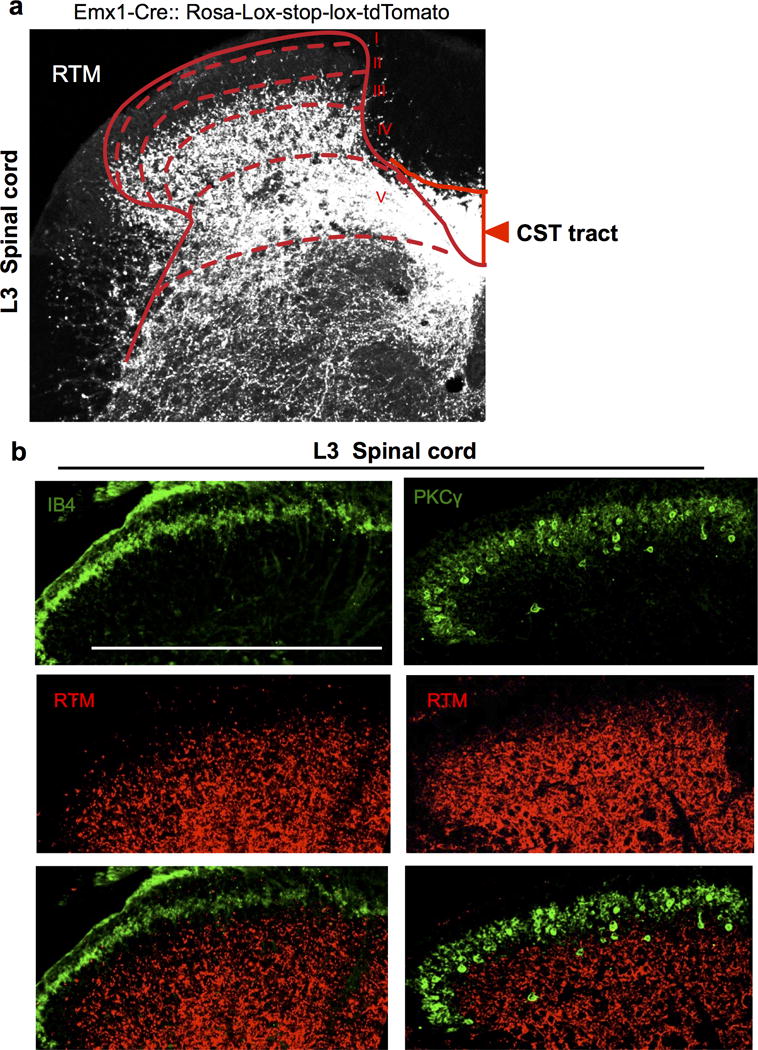
a-b, Representative transverse spinal section (L3) from an Emx1-tdTomato (red) reporter line (a). Sections were co-stained with IB4 (green), a lamina IIi marker and anti- PKCγ, a laminae IIi/III marker in the spinal dorsal horn (b). Scale bar: 500 μm. For a, b, 3 and 4 animals showed similar results, respectively.
Extended Data Figure 3. Evaluation of ablation efficiency for somatosensory CSNs by P14 intraspinal injection.
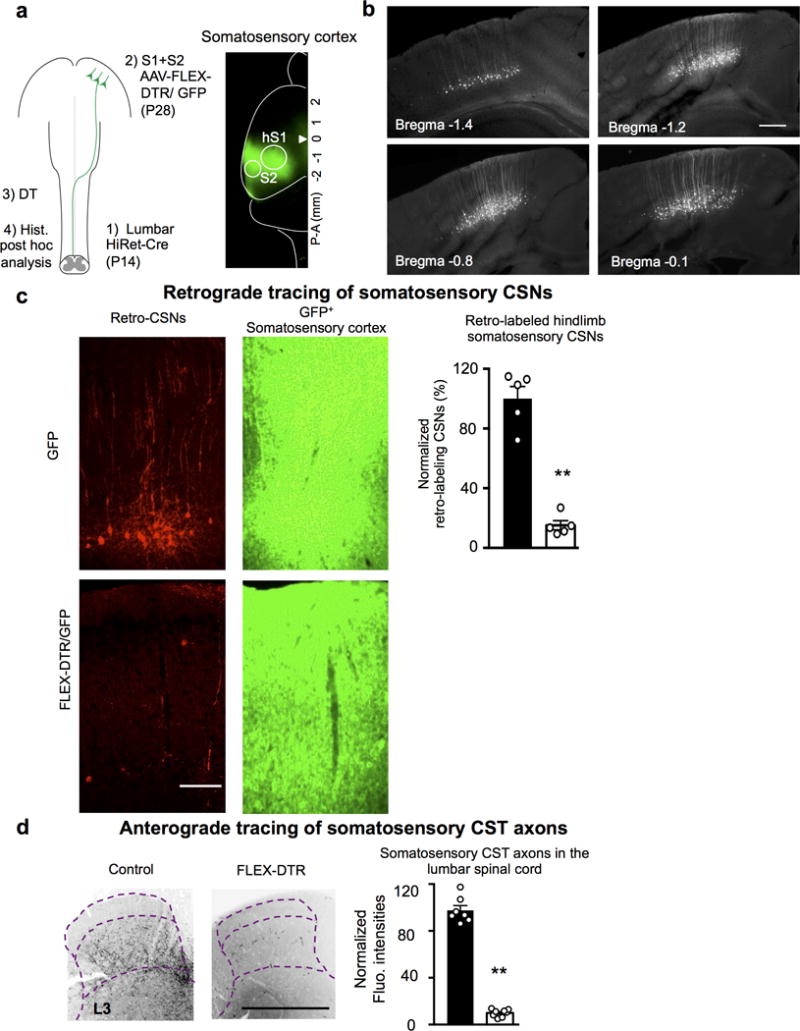
a, Left: Schematic of regional CSN ablation by P14 lumbar (T13-L6) intraspinal injection. Right: Representative image (n=8 animals with similar results) of the cortex with GFP+ areas covering hindlimb S1/S2. b, Representative images (n=6 animals with similar results) of cortical sections showing retrogradely labeled hindlimb CSNs by a lumbar (T13-L6) intraspinal HiRet-GFP injection at P14. Scale bar: 100 μm. c, To assess ablation efficiency, at the end point, retrograde-targeting rAAV-mCherry was injected into the lumbar spinal cord in some animals. Representative images of cortical sections showing retrogradely labeled mCherry+ CSNs (left) within the GFP+ cortical areas (right) (S1/S2) in control or AAV-FLEX-DTR injected animals with quantification (normalized to those in controls as 100). **, P < 0.01 (P<0.0001), two-sided student’s t-test. n=5, 5 for control or AAV-FLEX-DTR injected mice, respectively. Scale bar: 100 μm. d, Representative images of transverse lumbar spinal cord sections showing residual CST axons labeled by GFP (from AAV-GFP co-injected to S1/S2 with AAV-FLEX-DTR) in control or S1/S2 CSN ablated animals with quantification. **, P < 0.01 (P<0.0001), two sided student’s t-test. n= 7,8 for control or AAV-FLEX-DTR injected mice, respectively. Scale bar: 500 μm. Data are presented as mean ± SEM.
Extended Data Figure 4. Mechanical allodynia induced by SNI or CFA injection, but not cold allodynia and mechanical hyperalgesia induced by SNI, is compromised in mice with pyramidotomy.
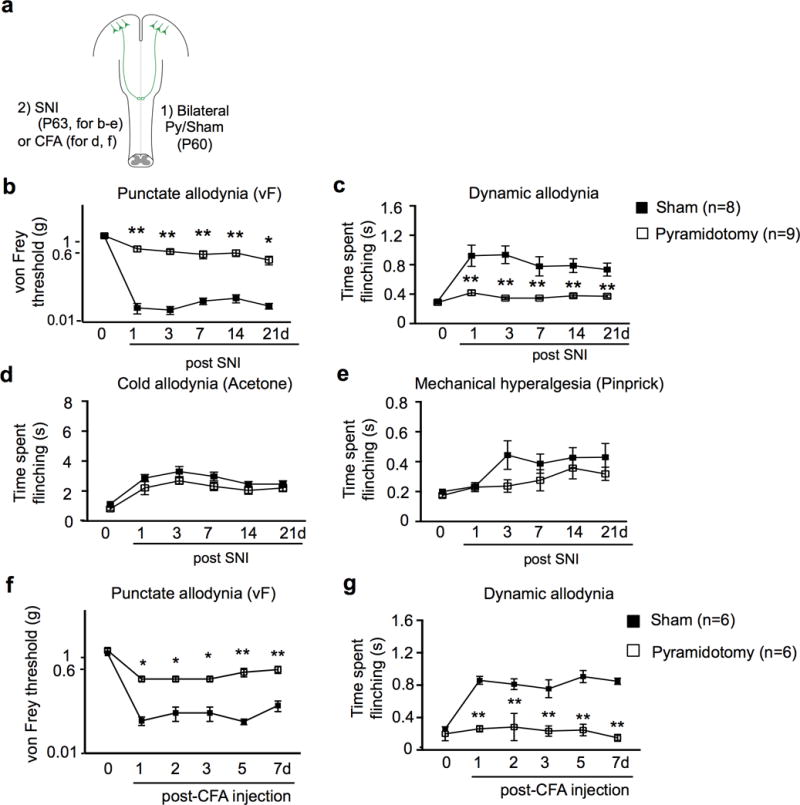
a, Schematic drawing of experimental paradigm. b-e, Measurement of punctate (b) and dynamic (c) mechanical allodynia, cold allodynia (d) or mechanical hyperalgesia (e) after SNI in mice receiving sham (n=8), or pyramidotomy (n=9) surgeries at 1-21 days post SNI. b: P<0.0001, P<0.0001, P=0.0012,P=0.0004,P=0.041; c: P<0.0001, P<0.0001, P=0.0004,P=0.001, P=0.0045; d: P=0.26, P=0.33, P=0.29, P>0.99, P>0.99; e: P>0.99,P=0.15,P=0.56,P>0.99,P=0.74 for 1d, 3d, 7d, 14d, and 21d, respectively. f-g, Measurement of punctate (f) and dynamic (g) mechanical allodynia in mice receiving sham (n=6), or pyramidotomy (n=6) surgeries at 1-7 days post hindpaw CFA injection. f: P=0.01, P=0.01, P=0.01, P<0.0001, P<0.0001; g: P<0.0001 for 1, 2, 3, 5, and 7d, respectively. Two-way repeated measures ANOVA followed by Bonferroni correction. Data are presented as mean ± SEM.
Extended Data Figure 5. Calcium imaging of CSN activity in intact and SNI mice.
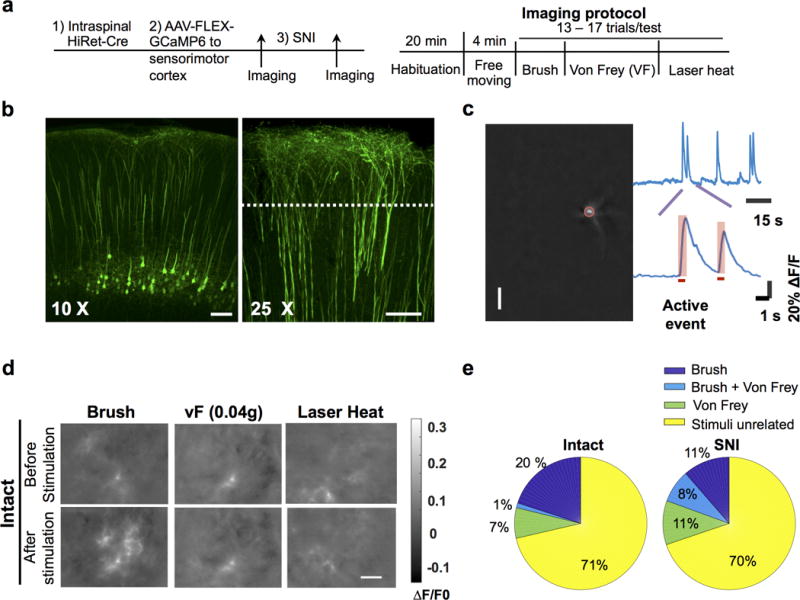
a, Schematic of experimental procedures. b, Confocal fluorescence images of coronal brain sections showing specific expression of GCaMP6s in CSNs. Left, a 10X image showing labeled CSN soma and dendrites; Right, a 25X image showing the magnified view of apical dendritic trunks. Dotted line: the expected focal plane of head-mounted microscope. Scale bar: 100 μm. c, Procedures for identifying the active events of CSN dendrites. Left: an example of dendrites identified from a calcium movie by ICA analysis. The brightest spot in a dendritic tree, corresponding to the trunk (highlighted by a red circle), is used as region of interest for temporal signal analysis. The upper trace: the temporal signal of the dendrite. The bottom trace: magnified calcium events. The horizontal bar indicates the rising phase of the calcium event, which is associated with neuronal activation and used in subsequent analysis. d, Example calcium movie frames showing dendritic activities of hindlimb S1 CSNs upon different sensory stimuli in intact mice. In these examples, brush stimuli activated CSNs, whereas von Frey (0.04g) and laser heat did not. Calcium signals are expressed as ΔF/F0 (F0 is the time average of the whole movie). For b, d, the experiments were repeated independently 4 times with similar results. e, Pie charts showing the proportions of neurons responded to brush, Von Frey or both brush and Von Frey in pre-SNI and post-SNI conditions. Few neurons responded to both stimuli pre-SNI, but this overlapping proportion increased post-SNI, potentially reflecting disinhibited sensory pathways after SNI.
Extended Data Figure 6. Mechanical allodynia induced by spinal disinhibition (bicuculline/strychnine) is compromised in mice with pyramidotomy.
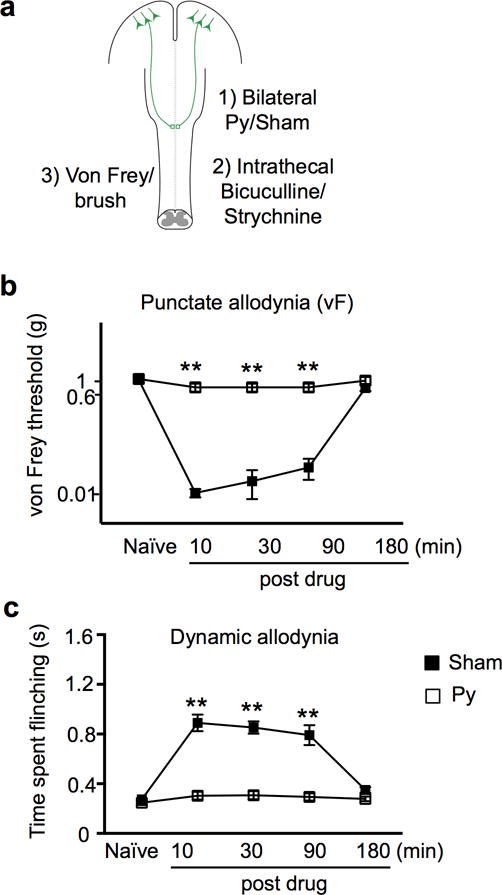
a, Schematic drawing of experimental paradigm. b-c, Measurement of punctate (b) and dynamic (c) mechanical allodynia after intrathecal injection of bicuculline/strychnine in mice receiving sham (n=6), or pyramidotomy (n=7). **, P < 0.01 (P<0.0001 for both b and c at 10, 30, and 90 min post drug), two-way repeated measures ANOVA followed by Bonferroni correction. Data are presented as mean ± SEM.
Extended Data Figure 7. Neuronal activity in cortical and subcortical areas upon light touch after SNI.
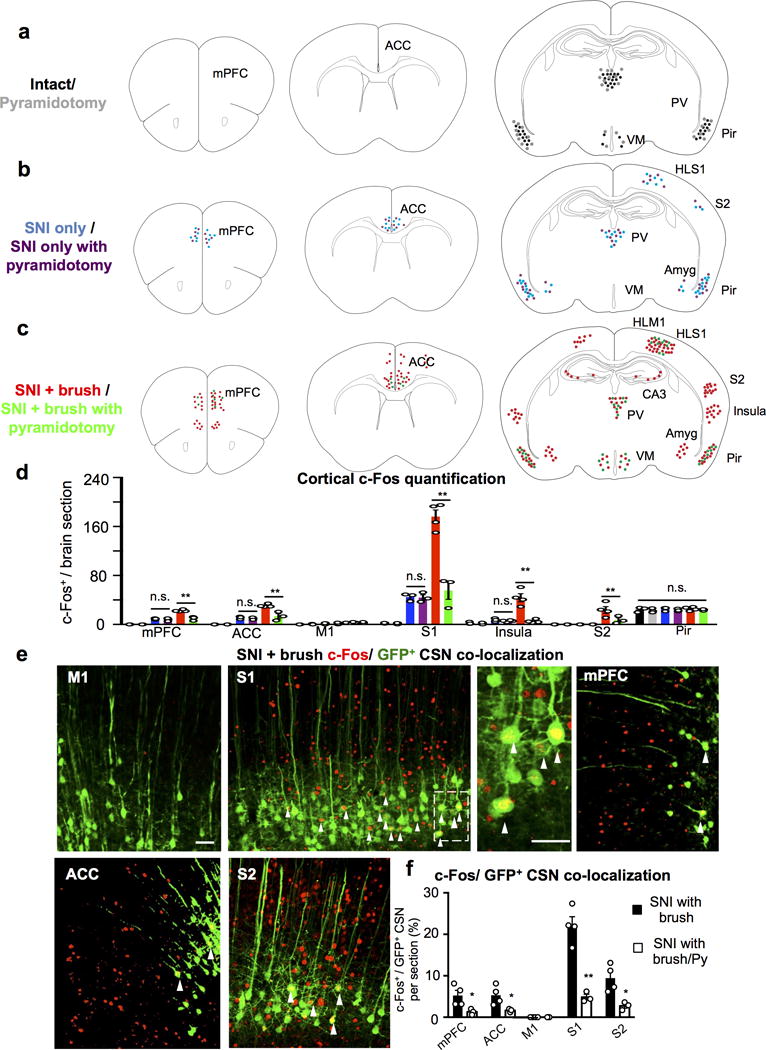
a-c, Cartoon drawing of c-Fos immunostaining in intact (a), SNI only (b) and SNI with light brush (c) conditions from control and mice with pyramidotomy. mPFC: medial prefrontal cortex, ACC: anterior cingulate cortex, S1HL: hindlimb primary somatosensory cortex, S2: secondary somatosensory cortex, Pir: piriform cortex, PV: periventricular nucleus of the thalamus, VM: ventromedial nucleus of the hypothalamus, and Amyg: amygdala. d, Quantification of c-Fos+ cells in multiple cortical areas in intact (with CSN: n=3, with pyramidotomy: n=3), SNI only (with CSN: n=3, with pyramidotomy: n=3), SNI with light brush (with CSN: n=4, with pyramidotomy, n=3) mice. **, P < 0.01, n.s., no statistical significance. PFC SNI only with or without Py: P>0.99; PFC SNI+ brush with or without Py: P<0.0001; ACC SNI only with or without Py: P>0.99; ACC SNI+ brush with or without Py: P=0.0002; M1 SNI only with or without Py: P>0.99; M1 SNI+ brush with or without Py: P>0.99; S1 SNI only with or without Py: P>0.99; S1 SNI+ brush with or without Py: P<0.0001; Insula SNI only with or without Py: P>0.99; Insula SNI+ brush with or without Py: P<0.0001; S2 SNI+ brush with or without Py: P=0.0075; Pir all conditions (ANOVA): P=0.82. One Way ANOVA followed by Bonferroni correction. e, Representative images of multiple cortical areas stained with c-Fos (red) and GFP (green, HiRet-GFP injection) in SNI mice with light brush. Arrowheads mark the co-localization of c-fos and GFP+ CSNs. Scale bar: 20 μm. f, Quantification of c-Fos+/GFP+ CSN co-localization in multiple cortical areas in animals with SNI following light brush without (n=4) or with pyramidotomy (Py, n=3). * or **, P < 0.05 or P < 0.01, P=0.03, 0.04, 0.0009, 0.02 for mPFC, ACC, S1, and S2, respectively. two-sided student’s t test. Data are presented as mean ± SEM.
Extended Data Figure 8. Tactile sensitivity and dorsal horn neuronal activation post SNI, but not nociceptive response or gross locomotion, is reduced in mice with lumbar CCK+ interneuron ablation.
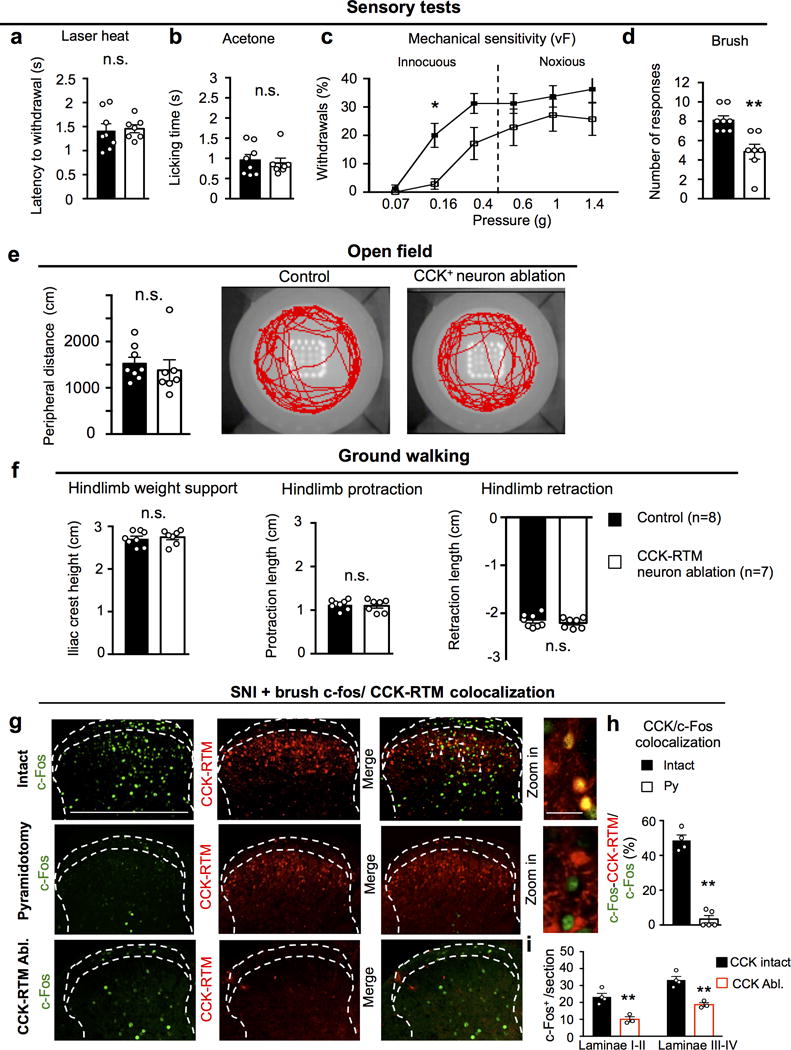
a-d, Measurements of the sensitivity to laser heat (a, P=0.76), acetone (b, P=0.86), von Frey (c, P=0.03 for 0.016g) and brush (d, P=0.002) stimuli in control (n=8) or CCK-RTM interneuron ablated (n=7) animals. a, b, d, two-sided Student’s t-test; c, two-way repeated measures ANOVA followed by Bonferroni correction. e-f, Performance on open field (e, P=0.54) and ground walking (f, P=0.68, 0.72, 0.50 for hindlimb weight support, protraction, and retraction.) in control (n=8) or CCK-RTM interneuron ablated (n=7) mice. n.s.: no statistical significance, two-sided Student’s t-test. g-i, Representative images of c-Fos (green) activity (g) and quantification of CCK-RTM+/c-Fos+ cells (h), c-Fos+ neurons in different laminae (i) of the dorsal horn of the spinal cord (L3-L4) of CCK-RTM (red) mice after SNI and brush receiving sham (n=4), pyramidotomy (n=5) or lumbar CCK-RTM ablation (n=3). Scale bars: 500 and 50 μm. **, p < 0.01, two-side student’s t test. For h: P<0.0001, i: P=0.0045 and 0.0028 for laminae I-II, laminae III-V, respectively. Data are presented as mean ± SEM.
Extended Data Figure 9. Characterization Aβ and CST inputs onto CCK-RTM neurons.
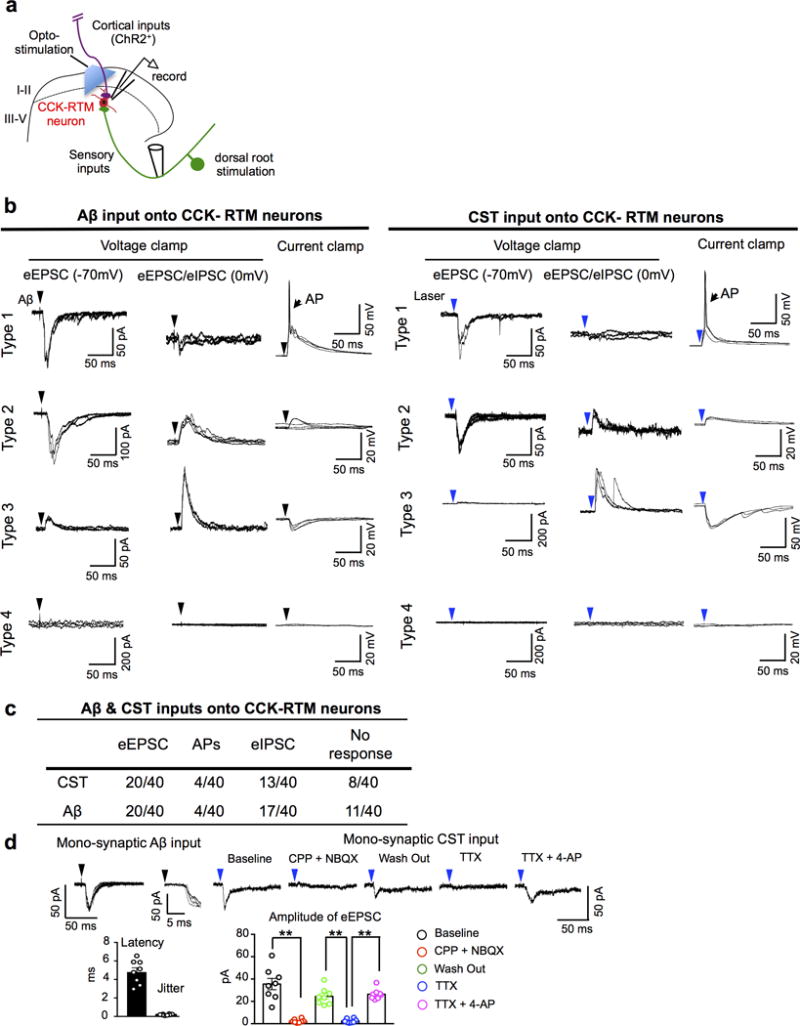
a, Schematic of the stimulation–whole cell patch recording set-up for RTM-labeled CCK-RTM interneurons. CST axons labeled by AAV-ChR2-YFP were stimulated with a 473nm laser. A single dorsal root (L4-L6) was stimulated with a glass suction electrode. b, c, Representative consecutive traces (n=3) of Aβ (left) and opto-CST (right) stimulation evoked responses (b) and summarization (c) of whole cell patch clamping recordings on CCK-RTM interneurons. Three recording conditions were used: First, to detect evoked excitatory post-synaptic currents (eEPSCs), we held the membrane potential at −70 mV, which is the equilibrium potential of Cl− and thereby minimizes the flow of inhibitory post-synaptic currents (eIPSCs). Second, by holding the membrane potential at 0 mV, we examined the polysynaptic, inhibitory inputs (eIPSCs) on CCK- RTM interneurons. Third, we used current clamp mode to examine whether the stimulation drives action potential (AP) firing at the resting membrane potential. Type 1: CCK-RTM neurons only receive excitatory inputs, few of them generated AP output when Aβ or CST inputs were respectively stimulated; Type 2: CCK-RTM neurons receive both excitatory inputs and feed forward, inhibitory inputs, with no AP output; Type 3: CCK-RTM neurons only receive feed forward inhibition, with no AP output; Type 4: CCK-RTM neurons show no response at either voltage or current clamp recording. d, Left: Representative recording of an Ab (25 mA) dorsal root evoked EPSC at −70mV. Latency and jitter properties (magnified in inset) with quantifications (n=8 neurons) are consistent with mono-synaptic sensory connectivity. Right: Opto-stimulation evoked EPSC (averaged traces) at −70mV in the same cell shown on the left. The evoked EPSC was blocked by AMPA/NMDA antagonist [NBQX (5 mM)/CPP (20 mM)]. In addition, such opto-stimulation evoked EPSC was eliminated by TTX (0.5 mM), and reinstated by 4-AP (2 mM), indicating the monosynaptic connection between CST and CCK-RTM interneurons. Bar graph: Quantification of eEPSCs amplitude with drug administration. **, P < 0.0001 for all comparisons with **, One-way ANOVA followed by Bonferroni correction. n=8 neurons. Data are presented as means ± SEM.
Extended Data Figure 10. Reinforcement or without induction of tactile allodynia in animals with or without SNI by optogenetic stimulation of somatosensory CSNs.
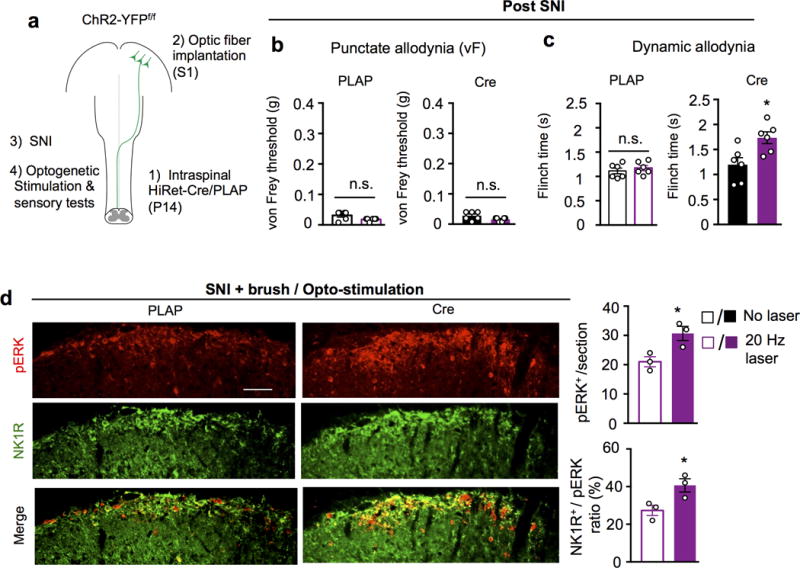
a, Schematic drawing of experimental paradigm. b-c, Measurement of punctate (von Frey), dynamic (brush) mechanical allodynia upon opto-stimulation in control (n=6) and ChR2-YFP+ CSNs (n=6) mice after SNI. n.s. and *, no statistical significance and P < 0.05, For b and c, P=0.18, 0.08 and 0.41, 0.02 for PLAP and Cre, without or with laser, respectively, two-sided student’s t-test. d, Representative images and quantification of pERK (red) and NK1R (green) immunostaining in the superficial dorsal horn (laminae I-II) of the spinal cord (L3-L4) in control (n=3) or hindlimb ChR2-YFP+ CSNs (n=3) animals receiving SNI and brush, coupled with opto-stimulation. Scale bar: 100 μm. *, P < 0.05, P=0.02 and 0.01 for pERK and pERK/NK1R ratio, respectively, two-sided student’s t-test. 6 sections crossing the lumbar spinal cord (L3-L4) were quantified for individual animals. Data are presented as mean ± SEM.
Supplementary Material
Acknowledgments
We thank Drs. T. Huang, Y. Zhang and Q. Ma for advice and Drs. D. Ginty, S. Hegarty, Q. Ma, F. Wang and P. Williams for critical reading. This study was supported by grants from Craig Neilsen Foundation (YLiu and XW), Paralyzed Veterans of America Foundation (YLiu), Dr. Miriam and Sheldon G. Adelson Medical Research Foundation and NINDS (to CJW and ZH) and NIMH intramural research program ZIA MH002897 (KHW, XL). IDDRC and viral cores supported by the grants NIH P30 HD018655 and P30EY012196 were used for this study.
Footnotes
Supplemental Information is available online.
Data availability statement The datasets generated during and/or analyzed during the current study are available from the corresponding author on reasonable request.
Author Contributions Y.L., A.L., X.L., Z.Z., K.H.W., C.J.W., and Z.H. conceived the experiments. Y.L., A.L., X.L., Z.Z., M.C., X.W., C.F., C.A., Z.G., B.C., X.D., J.Z., and Y.Z. performed the experiments. Y.L., A.L., X.L., C.C., K.H.W., C.J.W., and Z.H. prepared the manuscript with the inputs from all authors. K.H.W., C.J.W., and Z.H. co-supervised the project.
Author information The authors declare no competing financial interests. Readers are welcome to comment on the online version of the paper.
References
- 1.Owens DM, Lumpkin EA. Diversification and specialization of touch receptors in skin. Cold Spring Harb Perspect Med. 2014;4:12. doi: 10.1101/cshperspect.a013656. [DOI] [PMC free article] [PubMed] [Google Scholar]
- 2.Abraira VE, Ginty DD. The sensory neurons of touch. Neuron. 2013;79:618–639. doi: 10.1016/j.neuron.2013.07.051. [DOI] [PMC free article] [PubMed] [Google Scholar]
- 3.Basbaum AI, Bautista DM, Scherrer G, Julius D. Cellular and molecular mechanisms of Pain. Cell. 2009;139:267–284. doi: 10.1016/j.cell.2009.09.028. [DOI] [PMC free article] [PubMed] [Google Scholar]
- 4.Costigan M, Scholz J, Woolf CJ. Neuropathic pain: a maladaptive response of the nervous system to damage. Annu Rev Neurosci. 2009;32:1–32. doi: 10.1146/annurev.neuro.051508.135531. [DOI] [PMC free article] [PubMed] [Google Scholar]
- 5.Lemon RN. Descending pathways in motor control. Annu Rev Neurosci. 2008;31:195–218. doi: 10.1146/annurev.neuro.31.060407.125547. [DOI] [PubMed] [Google Scholar]
- 6.Liu K, et al. PTEN deletion enhances the regenerative ability of adult corticospinal neurons. Nat Neurosci. 2010;13:1075–1081. doi: 10.1038/nn.2603. [DOI] [PMC free article] [PubMed] [Google Scholar]
- 7.Jin D, et al. Restoration of skilled locomotion by sprouting corticospinal axons induced by co-deletion of PTEN and SOCS3. Nat Commun. 2015;6:12. doi: 10.1038/ncomms9074. [DOI] [PMC free article] [PubMed] [Google Scholar]
- 8.Boada MD, Woodbury CJ. Myelinated skin sensory neurons project extensively throughout adult mouse substantia gelatinosa. J Neurosci. 2008;28:2006–2014. doi: 10.1523/JNEUROSCI.5609-07.2008. [DOI] [PMC free article] [PubMed] [Google Scholar]
- 9.Boada MD, Woodbury CJ. Physiological properties of mouse skin sensory neurons recorded intracellularly in vivo: Temperature effects on somal membrane properties. J Neurophysiol. 2007;98:668–680. doi: 10.1152/jn.00264.2007. [DOI] [PubMed] [Google Scholar]
- 10.Lemon RN, Griffiths J. Comparing the function of the corticospinal system in different species: Organizational differences for motor specialization? Muscle Nerve. 2005;32:261–279. doi: 10.1002/mus.20333. [DOI] [PubMed] [Google Scholar]
- 11.Abraira VE, et al. The cellular and synaptic architecture of the mechanosensory dorsal horn. Cell. 2017;168:295–310. doi: 10.1016/j.cell.2016.12.010. [DOI] [PMC free article] [PubMed] [Google Scholar]
- 12.Wang XH, et al. Deconstruction of corticospinal circuits for goal-directed motor skills. Cell. 2017;171:440–455. doi: 10.1016/j.cell.2017.08.014. [DOI] [PMC free article] [PubMed] [Google Scholar]
- 13.Kinoshita M, et al. Genetic dissection of the circuit for hand dexterity in primates. Nature. 2012;487:235–238. doi: 10.1038/nature11206. [DOI] [PubMed] [Google Scholar]
- 14.Liu Y, et al. A sensitized IGF1 treatment restores corticospinal axon-dependent functions. Neuron. 2017;95:817–833. doi: 10.1016/j.neuron.2017.07.037. [DOI] [PMC free article] [PubMed] [Google Scholar]
- 15.O’Leary DD. Development of connectional diversity and specificity in the mammalian brain by the pruning of collateral projections. Curr Opin Neurobiol. 1992;2:70–77. doi: 10.1016/0959-4388(92)90165-h. [DOI] [PubMed] [Google Scholar]
- 16.O’Leary DD, Koester SE. Development of projection neuron types, axon pathways, and patterned connections of the mammalian cortex. Neuron. 1993;10:991–1006. doi: 10.1016/0896-6273(93)90049-w. [DOI] [PubMed] [Google Scholar]
- 17.Decosterd I, Woolf CJ. Spared nerve injury: an animal model of persistent peripheral neuropathic pain. Pain. 2000;87:149–158. doi: 10.1016/S0304-3959(00)00276-1. [DOI] [PubMed] [Google Scholar]
- 18.Atasoy D, Betley JN, Su HH, Sternson SM. Deconstruction of a neural circuit for hunger. Nature. 2012;488:172–177. doi: 10.1038/nature11270. [DOI] [PMC free article] [PubMed] [Google Scholar]
- 19.Li X, et al. Skin suturing and cortical surface viral infusion improves imaging of neuronal ensemble activity with head-mounted miniature microscopes. J Neurosci Methods. 2017;291:238–248. doi: 10.1016/j.jneumeth.2017.08.016. [DOI] [PMC free article] [PubMed] [Google Scholar]
- 20.Todd AJ. Neuronal circuitry for pain processing in the dorsal horn. Nat Rev Neurosci. 2010;11:823–836. doi: 10.1038/nrn2947. [DOI] [PMC free article] [PubMed] [Google Scholar]
- 21.Cheng L, et al. Identification of spinal circuits involved in touch-evoked dynamic mechanical pain. Nat Neurosci. 2017;20:804–814. doi: 10.1038/nn.4549. [DOI] [PMC free article] [PubMed] [Google Scholar]
- 22.Ji RR, Baba H, Brenner GJ, Woolf CJ. Nociceptive-specific activation of ERK in spinal neurons contributes to pain hypersensitivity. Nat Neurosci. 1999;2:1114–1119. doi: 10.1038/16040. [DOI] [PubMed] [Google Scholar]
- 23.Torsney C, MacDermott AB. Disinhibition opens the gate to pathological pain signaling in superficial neurokinin 1 receptor-expressing neurons in rat spinal cord. J Neurosci. 2006;26:1833–1843. doi: 10.1523/JNEUROSCI.4584-05.2006. [DOI] [PMC free article] [PubMed] [Google Scholar]
- 24.Duan B, et al. Identification of spinal circuits transmitting and gating mechanical pain. Cell. 2014;159:1417–1432. doi: 10.1016/j.cell.2014.11.003. [DOI] [PMC free article] [PubMed] [Google Scholar]
- 25.Bourane S, et al. Identification of a spinal circuit for light touch and fine motor control. Cell. 2015;160:503–515. doi: 10.1016/j.cell.2015.01.011. [DOI] [PMC free article] [PubMed] [Google Scholar]
- 26.Taniguchi M, et al. A resource of Cre driver lines for genetic targeting of GABAergic neurons in cerebral cortex. Neuron. 2011;71:995–1013. doi: 10.1016/j.neuron.2011.07.026. [DOI] [PMC free article] [PubMed] [Google Scholar]
- 27.Sun F, et al. Sustained axon regeneration induced by co-deletion of PTEN and SOCS3. Nature. 2011;480:372–375. doi: 10.1038/nature10594. [DOI] [PMC free article] [PubMed] [Google Scholar]
- 28.Arlotta P, et al. Neuronal subtype-specific genes that control corticospinal motor neuron development in vivo. Neuron. 2005;45:207–221. doi: 10.1016/j.neuron.2004.12.036. [DOI] [PubMed] [Google Scholar]
- 29.Metz GA, Dietz V, Schwab ME, van de Meent H. The effects of unilateral pyramidal tract section on hindlimb motor performance in the rat. Behav Brain Res. 1998;96:37–46. doi: 10.1016/s0166-4328(97)00195-2. [DOI] [PubMed] [Google Scholar]
- 30.Muir GD, Whishaw IQ. Complete locomotor recovery following corticospinal tract lesions: measurement of ground reaction forces during overground locomotion in rats. Behav Brain Res. 1999;103:45–53. doi: 10.1016/s0166-4328(99)00018-2. [DOI] [PubMed] [Google Scholar]
- 31.Mastwal S, et al. Phasic dopamine neuron activity elicits unique mesofrontal plasticity in adolescence. J Neurosci. 2014;34:9484–9496. doi: 10.1523/JNEUROSCI.1114-14.2014. [DOI] [PMC free article] [PubMed] [Google Scholar]
- 32.Cao VY, et al. In vivo two-photon imaging of experience-dependent molecular changes in cortical neurons. J Vis Exp. 2013;71 doi: 10.3791/50148. [DOI] [PMC free article] [PubMed] [Google Scholar]
- 33.Cao VY, et al. Motor Learning Consolidates Arc-Expressing Neuronal Ensembles in Secondary Motor Cortex. Neuron. 2015;86:1385–1392. doi: 10.1016/j.neuron.2015.05.022. [DOI] [PMC free article] [PubMed] [Google Scholar]
- 34.Ziv Y, et al. Long-term dynamics of CA1 hippocampal place codes. Nat Neurosci. 2013;16:264–266. doi: 10.1038/nn.3329. [DOI] [PMC free article] [PubMed] [Google Scholar]
- 35.Mukamel EA, Nimmerjahn A, Schnitzer MJ. Automated analysis of cellular signals from large-scale calcium imaging data. Neuron. 2009;63:747–760. doi: 10.1016/j.neuron.2009.08.009. [DOI] [PMC free article] [PubMed] [Google Scholar]
- 36.Hyvarinen A, Oja E. Independent component analysis: algorithms and applications. Neural Netw. 2000;13:411–430. doi: 10.1016/s0893-6080(00)00026-5. [DOI] [PubMed] [Google Scholar]
- 37.Chen TW, et al. Ultrasensitive fluorescent proteins for imaging neuronal activity. Nature. 2013;499:295–300. doi: 10.1038/nature12354. [DOI] [PMC free article] [PubMed] [Google Scholar]
- 38.Hill DN, Varga Z, Jia H, Sakmann B, Konnerth A. Multibranch activity in basal and tuft dendrites during firing of layer 5 cortical neurons in vivo. Proc Natl Acad Sci USA. 2013;110:13618–13623. doi: 10.1073/pnas.1312599110. [DOI] [PMC free article] [PubMed] [Google Scholar]
- 39.Peters AJ, Lee J, Hedrick NG, O’Neil K, Komiyama T. Reorganization of corticospinal output during motor learning. Nat Neurosci. 2017;20:1133–1141. doi: 10.1038/nn.4596. [DOI] [PMC free article] [PubMed] [Google Scholar]
- 40.Cichon J, Blanck TJJ. Activation of cortical somatostatin interneurons prevents the development of neuropathic pain. Nat Neurosci. 2017;20:1122–1132. doi: 10.1038/nn.4595. [DOI] [PMC free article] [PubMed] [Google Scholar]
- 41.Peters AJ, Chen SX, Komiyama T. Emergence of reproducible spatiotemporal activity during motor learning. Nature. 2014;510:263–267. doi: 10.1038/nature13235. [DOI] [PubMed] [Google Scholar]
- 42.Holloway BB, et al. Monosynaptic glutamatergic activation of locus coeruleus and other lower brainstem noradrenergic neurons by the C1 cells in mice. J Neurosci. 2013;33:18792–18805. doi: 10.1523/JNEUROSCI.2916-13.2013. [DOI] [PMC free article] [PubMed] [Google Scholar]
Associated Data
This section collects any data citations, data availability statements, or supplementary materials included in this article.


