

Abstract
Papillary renal cell carcinoma (PRCC) is the most common nonclear cell RCCs and is known to comprise two histological subtypes. PRCC2 is more aggressive and is molecularly distinct from the other subtypes. Despite this, PRCCs are treated together as one entity, and they show poor response to the current therapies that do not target pathways implicated in their pathogenesis. We have previously detected ABCC2 (an ABC transporter), VEGF, and mTOR pathways to be enriched in PRCC2. In this study, we assess the therapeutic potential of targeting these pathways in PRCC2. Twenty RCC cell lines from the Cancer Cell Encyclopedia were compared to the Cancer Genome Atlas PRCC cohort (290), to identify representative PRCC2 cell lines. Cell lines were further validated in xenograft models. Selected cell lines were treated in vitro and in vivo (mice models) under five different conditions, untreated, anti‐VEGF (sunitinib), ABCC2 blocker (MK571), mTOR inhibitor (everolimus) and sunitinib + MK571. Sunitinib +ABCC2 blocker group showed a significant response to therapy compared to the other treatment groups both in vitro (P ≤ 0.0001) and in vivo (P = 0.0132). ABCC2 blockage resulted in higher sunitinib uptake, both in vitro (P = 0.0016) and in vivo (P = 0.0031). Everolimus group demonstrated the second best response in vivo. The double‐treatment group showed the highest apoptotic rate and lowest proliferation rate. There is an urgent need for individualized therapies of RCC subtypes that take into account their specific biology. Our results demonstrate that combined targeted therapy with sunitinib and ABCC2 blocker in PRCC2 has therapeutic potential. The results are likewise potentially significant for other ABCC2 high tumors. However, the results are preliminary and clinical trials are needed to confirm these effects in PRCC2 patients.
Keywords: ABC transporters, papillary renal cell carcinoma subtypes, papillary renal cell carcinoma type 2, renal cell carcinoma cell lines, targeted therapy
Abbreviations
- ABC transporters
ATP binding cassette
- ABCC2
ABC binding cassette subfamily C member 2
- CCRCC
clear cell renal cell carcinoma
- Chr
chromosome
- PRCC
papillary renal cell carcinoma
Introduction
Renal cell carcinomas (RCCs) are tumors that arise from renal tubules. They represent ~90% of adult kidney tumors and one of the most prevalent malignancies worldwide (Afriansyah et al., 2016; Kumar and Kapoor, 2017). Due to the lack of predictable early signs and symptoms of the disease, 30% of the cases are discovered at a locally advanced or metastatic stage(Kumar and Kapoor, 2017). At that point, the 5‐year survival rate becomes extremely poor (10–50%) (Afriansyah et al., 2016; Kumar and Kapoor, 2017).
RCCs are, however, composed of multiple histological types, the most common of which are the clear cell RCCs (CCRCC) (~75%), and the second most common are papillary RCC (PRCC) (10–15%) which is comprised of multiple subtypes (Saleeb et al., 2016). We and others have shown that PRCC subtypes are also molecularly and prognostically distinct (Saleeb et al., 2016; TCGA, 2016; Yang et al., 2005). Other RCC subtypes as chromophobe, MiT family translocation RCCs and other rare types collectively constitute the remaining 5–10% (Moch et al., 2016).
Targeted molecular therapies are currently the standard of care for metastatic CCRCCs. These include first‐line therapies vascular endothelial growth factor (VEGF) tyrosine kinase inhibitors (TKIs), for example, sunitinib and pazopanib, and second‐line therapies the mammalian target of rapamycin (mTOR) inhibitors (everolimus and temsirolimus), and the recently approved PD‐1 immune checkpoint inhibitor nivolumab (Ciccarese et al., 2015, 2017; Kumar and Kapoor, 2017). There is, however, a substantial lack of evidence regarding the management of nonclear cell RCC (Giles et al., 2017). While they are treated empirically as CCRCCs, they do not respond as well as the CCRCC counterpart.
In our previous studies, we have confirmed the distinct molecular profiles of PRCC subtypes 1 and 2. We also uncovered specific molecular pathways and biomarkers that can influence PRCC subtypes response to therapy (Saleeb et al., 2016, 2017). PRCC1, as noted from previous literature, had much better prognosis, compared to PRCC2 (Klatte et al., 2010; Pignot et al., 2007). Pignot et al. found the PRCC1 tumors to have significantly better overall survival and disease‐free survival than PRCC2. Their PRCC1 tumors also had significantly lower TNM stage diseases, and the differences in survival retained significance on multivariate analysis (Pignot et al., 2007). In our previous work, gene set enrichment analysis indicated that PRCC1 had enrichment in the MET, WNT, and NOTCH pathways, while in comparison, PRCC2 had enrichment in the mTOR, VEGF, and NRF2‐ARE pathways (Saleeb et al., 2016). These findings were consistent with the findings of the Cancer Genome Atlas (TCGA) and other reports (Ooi et al., 2013; TCGA, 2016). The mTOR and VEGF pathways are known to activate each other in a positive feedback loop manner (Guo et al., 2015). ABCC2 and other drug transporters are activated downstream to the ARE pathway (Jeong et al., 2015; Taguchi et al., 2011; TCGA, 2016). Interestingly, HIF1α in stabilized and increased in response to ARE activation and in turn HIF1α is known to induce VEGF (Taguchi et al., 2011).
Additionally, PRCC2 highly expressed the ABC drug transporter ABCC2 at the transcriptomic and proteomic level (79 times higher in PRCC2 than PRCC1), with high statistical significance (Saleeb et al., 2016, 2017). ABCC2 is known to be activated downstream to the NRF2‐ARE pathway which is specific to the PRCC2 biology (Jeong et al., 2015; TCGA, 2016). We have also shown that ABCC2 can be used as a prognostic marker to classify the PRCC tumors. ABCC2 belongs to the family of ABC transporters and is reported to contribute to chemotherapy resistance and thus called multidrug‐resistant protein 2 (MRP2) (Jeong et al., 2015). Reports suggest that ABCC2 and other ABC transporters induce cancer resistance to TKIs (Kathawala et al., 2015; Shibayama et al., 2011). Hence, it might contribute to the observed developed resistance in PRCC2 by actively transporting the drugs out of the tumor cells.
Therapeutic clinical trials for nonclear cell RCC are extremely limited, with small patient cohorts, and mostly all yielding disappointing results (Ciccarese et al., 2017; Courthod et al., 2015; Giles et al., 2017). One major hindrance to these trials is the inclusion of all nonclear cell RCCs as one category, despite the fact that they are known to be phenotypically and molecularly diverse (Armstrong et al., 2016; Giles et al., 2017; Ravaud et al., 2015; Tannir et al., 2016). There is considerable need for therapies and clinical trials that take into account the oncogenic pathways specific to each of these RCC subtypes (Giles et al., 2017; Kumar and Kapoor, 2017).
There are only two trials that have attempted to assess differences in response to therapy between the two subtypes of PRCC; however, small patient cohorts limited both trials (Escudier et al., 2016; Ravaud et al., 2015). There are currently clinical trials assessing the value of targeting the MET pathway in PRCC (Giles et al., 2017). MET pathway is significantly enriched in PRCC1 (Saleeb et al., 2016; TCGA, 2016); however, there are no trials focusing on the more aggressive PRCC2 phenotype.
We hypothesize that PRCC2 could benefit from targeting pathways that are specifically enriched in its phenotype. Blockage of ABCC2 in addition to the standard first‐line therapies of metastatic RCCs might be of added benefit to the tumor treatment. Also, tumors of pure PRCC2 biology would potentially benefit from mTOR inhibitors in contrast to other treatment modalities. In this study, we proceed to assess the value of targeting these pathways both in vitro and in vivo in PRCC2.
Methods
Ethics approval, Public genomic, and clinical data extraction
Ethics approval was obtained through our institution's ethics board. The local animal care committee approved all animal experiments. Publically available databases used were the TCGA, GEO (Gene expression Omnibus), and CCLE (Cancer Cell Line Encyclopedia‐Broad Institute). Gene expressions (mRNA seq, RSEM values) were downloaded for the KIRP 290 PRCC cohort from the TCGA Web site (our published study) (Saleeb et al., 2016). Gene expression (microarray) data for 20 Renal Cancer cell lines from the CCLE was explored and extracted through GEO (786‐O, KMRC‐3, KMRC‐2, KMRC‐20, KMRC‐1, CAL‐54, Caki‐1, Caki‐2, BFTC‐909, ACHN, A‐704, A‐498, 769‐P, VMRC‐RCZ, VMRC‐RCW, TUHR4TKB, TUHR14TKB, TUHR10TKB, SNU‐1272, RCC10RGB) (Barretina et al., 2012).
Selection of cell lines
First, we identified CAL‐54 (RCC cell line) as a PRCC1 cell line based on literature evidence of its papillary nature (Gioanni et al., 1996; Sinha et al., 2017), low ABCC2 expression, and its known chromosomal aberrations (gains in Chr 7 & 17). To further validate the morphology and immune phenotypes of CAL‐54 as a PRCC1 representative cell line, the cells were cultured in vitro, after which 106 cells were injected subcutaneously in immunocompromised outbred athymic nude (homozygous Foxn1 nu) mice (4 mice). Tumors were harvested and sections were histologically examined for cell lines morphology and IHC profiles and compared to those of PRCC1. Similar to PRCC1, the histology of the mice tumors showed a tubulo‐papillary architecture of small low‐grade tumor cells, linear nuclear arrangement, and negative staining for ABCC2 IHC (Fig. S1). Next, the CAL‐54 gene expression signature (from CCLE) was used as a comparison against which we elicited the top expressed genes in the other available 19 RCC CCLE cell lines. That comparison was correlated with the TCGA tumors comparison (PRCC1 vs PRCC2) to elicit best‐fit cell line to PRCC2.
Cell culture in vitro
The CAKI‐2 and CAL‐54 RCC cells were obtained from the American Type Culture Collection (ATCC, Manassas, VA, USA) and the Deutsche Sammlung von Mikroorganismen und Zellkulturen (DSMZ, Germany), respectively. The former was grown in McCoy cell media with 10% fetal bovine serum (FBS), while the latter was grown in DMEM cell media with 15% FBS, 0.4 μg·mL−1 hydrocortisone, and 10 ng·mL−1 EGF.
In vitro treatment
Cells were plated at 1.0 × 10³ cells per well in a 96‐well plate and after 24 h grouped into the five treatment conditions, untreated, treated sunitinib 1.0 μm, treated with MK‐571 25 μm (ABCC2 blocker) (Tang et al., 2002), treated with combined MK‐571 + sunitinib, and treated with everolimus 50 nM (Lane et al., 2009). Cellular viability was measured using the WST‐1 cell proliferation colorimetric assay (Roche Applied Science, Indianapolis, IN, USA) at day 2, 3, and 9 post‐treatment. Described resistance index equation was used to measure the cytotoxic effect of the medications on the cells(Pénzváltó et al., 2013). The exact equation is:
Npre is the medium absorbance value of precontrol (representing the number of cells at the beginning of the treatment), Npost is the medium absorbance value of control (representing the number of cells with no treatment at the end of the treatment period), and N2 is the medium absorbance value of treated cells at the end of the treatment period.
Effect of blocking ABCC2 on sunitinib and other drug uptake in vitro and in vivo
The spectral properties of sunitinib were noted from the previous literature (Nowak‐Sliwinska et al., 2015). Brilliant violet 510 (BV510) fluorochrome was identified as having very similar light absorbance, excitation, and emission properties as sunitinib. The BV510 spectral range of detection was used to detect sunitinib fluorescence intensity in treated cells. Cell lines were cultured and treated with sunitinib ± MK571. After 4 days of treatment, cells were trypsinized and washed with PBS‐1% and assessed for sunitinib presence with flow cytometry. All experiments were repeated in triplicates.
Similarly, CAKI‐2 cell line tumors grown in mice were harvested after 8 weeks of treatment. Tumors were dissociated through mincing tumor sample and then incubated for 30 min at 37 °C with hyaluronidase and collagenase enzyme mix. Tumor cells were further passed through a 70‐micron filter mesh, and then, cells were washed with PBS for subsequent analysis with flow cytometry.
CAKI‐2 cells seeded in 96‐well plates and treated with MK‐571 were stained with Hoechst 33342 (DNA dye). The plate was scanned with image express analyzer to detect the number of cells with dye uptake. Subsequently, the cells were fixed with paraformaldehyde (PFA), subjected to the Hoechst dye again, and rescanned with the image express.
In vivo validation
Mice bought from ‘The Jackson laboratory’ were the immunocompromised strains outbred athymic nude (homozygous Foxn1 nu) mice and NOD SCID (severe combined immunodeficiency) gamma mice.
CAKI‐2 cells were grown to 80% confluency and trypsinized, into single‐cell suspension. 106 CAKI‐2 cells were suspended in a 100ul of saline and added to another 100ul of Matrigel and then injected subcutaneously above the mice flanks Treatment started when the tumors reached 100 mm3 using the formula: length x (diameter)2 x π /6, where length is the longest dimension and diameter is the shortest dimension (Zhu et al., 2012). Mice were divided into five treatment groups with an average of 4–6 mice per arm: untreated (control), treated with MK571 only (25 mg·kg−1), sunitinib only (50 mg·kg−1), everolimus only (2.5 mg·kg−1), sunitinib + MK571, and everolimus + MK571(Hara et al., 2011; Karam et al., 2011; Lane et al., 2009; Zhu et al., 2012). The treatment was given through oral gavage 5 days on and 2 days off for the period of 8 weeks. The response was assessed through tumor growth curves and through evaluation of metastasis at the experiment end point (mice autopsy). Percentage of apoptotic cells was assessed at mice end point after tumor dissociation, with the Annexin V flow cytometry apoptosis assay. The proliferation of tumor cells was assessed with the Ki67 immunohistochemical stain on mice tumors. Ki67 staining was quantified using the aperio image analysis software (Leica Biosystems Group of Companies, Wetzlar, Germany).
Immunohistochemistry
Immunohistochemistry was performed using Ki67 and ABCC2 antibodies. The Ki67 was performed using a Ventana automated system. Ki67 is a marker of cell proliferation (detected by nuclear staining), as it is present in all active phases of the cell cycle (de Sousa e Melo et al., 2017). IHC staining of ABCC2 was achieved by the streptavidin–biotin–peroxidase complex protocol using an ABCC2‐specific mouse monoclonal antibody (Monosan, UDEN, the Netherlands; Cat# MON9026; dilution 1 : 200). FFPE normal kidney tissue served as a positive control, while substitution of the primary antibodies with PBS served as a negative control.
Quantitative image analysis and statistical analysis
Mice tumor slides stained with Ki67 were scanned and analyzed with the aperio image analysis software. The algorithm combines staining intensity and percentage positivity to provide a combined score (Kolin et al., 2014). Statistical analysis was performed using the GraphPad 7 prism and spss statistical software packages (Chicago, IL, USA).
Results
Identification of cell lines with best molecular, morphological, and immunophenotypical correlation with PRCC2
From the PRCC TCGA cohort, a distinct PRCC2 mRNA signature of 500 genes (compared to PRCC1) was elicited (Saleeb et al., 2016) and compared with the top 500 genes for each of the CCLE cell lines (compared to CAL‐54) using Pearson correlation coefficient r and linear regression r2, as previously described (Malone and Oliver, 2011). As the ARE pathway is known to be enriched in PRCC2, an ARE PRCC2 gene signature (ABCC2, ACTA2, ACTC1, ACTG2, EPHX1, FTL, GCLM, GPX2, GSR, GSTA1, GSTA2, NQO1, PRKCE, SQSTM1, TXNRD1, AKR1B10, AKR1C1, AKR1C3, SRXN1) (Ooi et al., 2013; TCGA, 2016) was used to assess the correlation between the PRCC2 and each of the RCC cell lines. The bioinformatic statistical analysis was performed using graphpad prism 7 and spss statistical software (San Diego, CA, USA).
Of the 19 RCC cell lines, CAKI‐2 showed excellent correlation with PRCC2 top matched genes (Pearson correlation coefficient r: 0.79, r2:0.63 (P ≤ 0.0001), as well as best correlation with the ARE pathway genes (Pearson correlation coefficient r:0.77, r2:0.59 (P = 0.0002) Figs 1A and S2.
Figure 1.
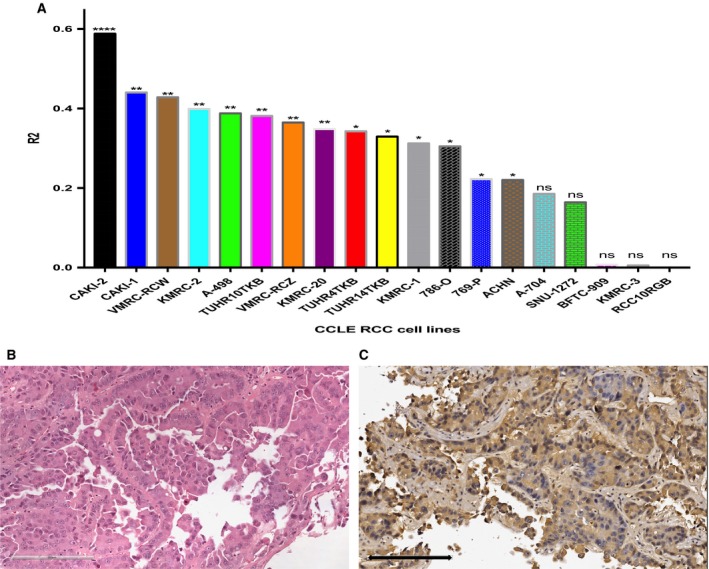
The CAKI‐2 cell line represents PRCC2. (A) Comprehensive bioinformatic analysis of the 19 renal cell carcinoma cell lines from the Cancer Cell Line Encyclopedia (CCLE) revealed CAKI‐2 as best match to PRCC2. Coefficient of determination statistical test was used to compare the expression of ARE pathway genes between the cell lines and PRCC2 (nonsignificant: ns, P > 0.05:*, P ≤ 0.05:**, P ≤ 0.01:***, P ≤ 0.001:****, P ≤ 0.0001). (B) Histological sections of CAKI‐2 cells xenografted in mouse model showed typical PRCC2 morphology formed of papillary growth with large cells, abundant cytoplasm and prominent nucleoli, and pseudostratification. (C) The cells stained strong diffuse positive for ABCC2, in agreement with the expression level of this protein in PRCC2 tumors. Scale bar = 200 μm.
To further validate the morphology and immune phenotypes of our selected cell lines, CAKI‐2 was cultured in vitro, after which 106 cells were injected subcutaneously in immunocompromised outbred athymic nude (homozygous Foxn1 nu) mice (6 mice). Tumors were harvested and sections were histologically examined for cell lines morphology and IHC profiles and compared to those of PRCC2. All of the six injected nude mice developed tumors with papillary morphology and had large eosinophilic cells, with nuclear pseudostratification and prominent nucleoli, consistent with what is known as a PRCC2 morphology (Fig. 1B). Additionally, the tumors demonstrated diffuse strong staining with ABCC2 (Fig. 1C) as we have previously described in the PRCC2 subtype (Saleeb et al., 2017). Taken together, the morphology, immunostaining pattern, and molecular analyses show that CAKI‐2 can serve as a representative model for PRCC2. This is consistent with Brodaczewska et al. recent review on RCC cell lines describing multiple evidence linking CAKI‐2 to PRCC (Brodaczewska et al., 2016). Additionally, CAKI‐2 harbors chromosome 8 aberrations, which has also been described in PRCC2 (Furge et al., 2007; Saleeb et al., 2017).
In vitro treatment of PRCC2 cell line shows the best response achieved with double‐treatment sunitinib and ABCC2 blocker therapy
We first assessed CAKI‐2 cell susceptibility to sunitinib (current first‐line metastatic RCC treatment) ± MK571. The group of cells that were exposed to the dual treatment with both sunitinib and blocker was the most sensitive to treatment (Fig. 2A), using both the WST‐1 viability assay and the calculated resistant index. The results indicate that ABCC2 as a drug transporter might play a role in the sunitinib medication influence of the treated cancer cells (Warta et al., 2014; Zhang et al., 2014). The group of cells treated with MK571 only also showed a considerable reduction in cell viability. This is in agreement with recent reports that ABC transporters are directly implicated in the biology of the tumors rather than being merely drug transport pumps(Henderson et al., 2011; Wu et al., 2017).
Figure 2.
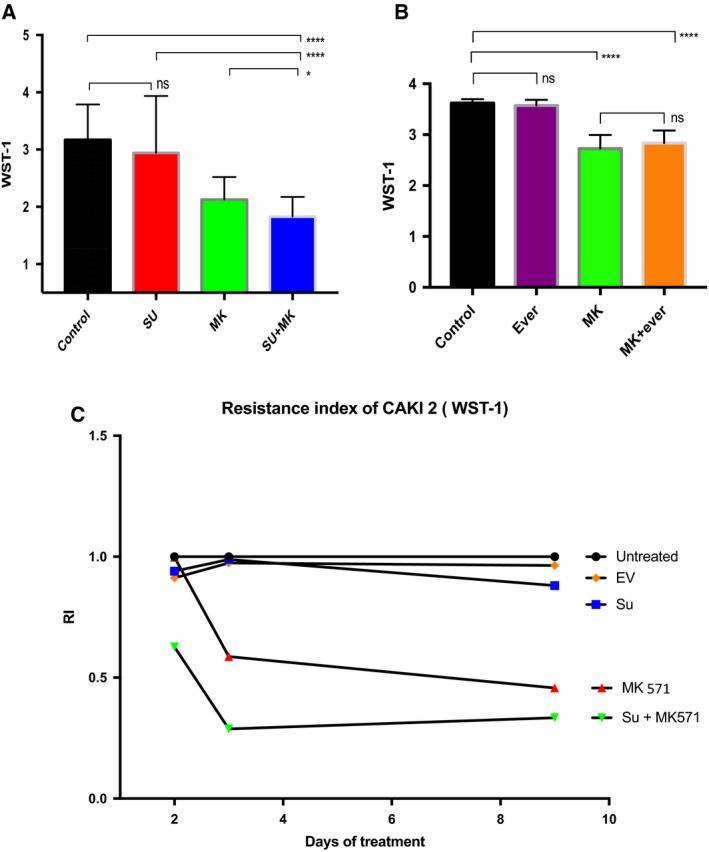
In vitro response of CAKI‐2 (PRCC2 cell line) to different treatment modalities, late (day 9) responses are shown. (A) The addition of ABCC2 blocker to sunitinib results in significant decrease in viable cell count. (control n = 19, sunitinib n = 17, MK n = 20, sunitinib + MK571 n = 20) (B) Similar analysis adding MK571 to everolimus did not produce significant decrease in viable cell count than MK571 alone (control n = 21, everolimus n = 23, MK n = 23, everolimus + MK571, n = 23). Two‐tailed t‐test used for the analysis of A and B, error bars represent SD. (Nonsignificant: ns, P > 0.05:*, P ≤ 0.05:**, P ≤ 0.01:***, P ≤ 0.001:****, P ≤ 0.0001.) (C) Response to treatment as assessed by resistance index (RI) to the different treatments. RI is calculated through a special formula that compares the cells response to the control group, the control group is given the RI = 1, and a more drug‐sensitive response = <1.
We performed a similar in vitro experiment assessing the effect of everolimus with and without MK571 on the cancer cells. Interestingly, the combination of blocker (MK571) and everolimus did not produce significant differences in cell viability versus the blocker alone (Fig. 2B).
Assessing response using resistance index again showed a superior response to both MK571 ± sunitinib (Fig. 2C).
In vitro, ABCC2 induces active export of medications
To validate the activity of ABCC2 drug transporter pump in PRCC2, CAKI‐2 cells were grown in 96‐well plates. At the end of 9 days, untreated and MK571 (ABCC2 blocker) treated groups were stained with the cell permeable Hoescht 33342 DNA dye and then subjected to image screening and visualization using the Xpress image analyzer. MK571‐treated cells showed considerable dye uptake (indicating dye retention), whereas untreated cells failed to stain indicating an active export of the Hoescht dye by ABCC2. Then, we proceeded to fix the cells with paraformaldehyde (PFA) to terminate the ABCC2 drug transporter pump effect. Fixed untreated cells showed a significant increase in staining after blocking the ABCC2 effect with fixation, P = 1.33275E‐15. While previously blocker treated cells did not show a significant change in stained cells after fixation, P = 0.73 (Fig. 3). The results indicate that the lack of staining in blocker untreated viable cells was an active process as in an ATP transporter pump, while adding the blocker to viable cells resulted in dye uptake without the need for fixation.
Figure 3.
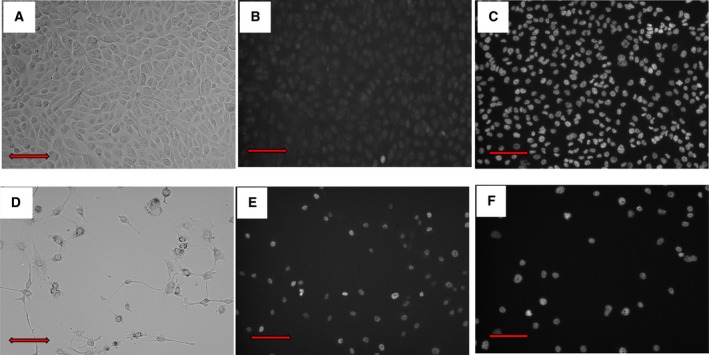
In vitro assessment of the drug transporter pump effect (CAKI‐2 PRCC2 cell line.) (A) Untreated cells, (B) Untreated cells stained with Hoescht permeable stain showed no staining indicating active transport of the dye outside the cell, (C) after blocking the receptor, there is a significant increase in signal indicating dye retention. (D) MK571 (ABCC2 blocker)‐treated cells. Treated cells stained for the dye before (E) and after fixation (F). Red scale bar = 200 μm.
To further confirm that ABCC2 contributes to drug resistance through pumping out medications, we measured sunitinib uptake in CAKI‐2 cells through the detection of its known spectral range in flow cytometry (Nowak‐Sliwinska et al., 2015). The results show a near doubling of the uptake of sunitinib after the addition of MK571, from 28 044 median fluorescence intensity (MFI) to 54 421 MFI (Fig. 4A–D). To further validate our findings, we assessed sunitinib uptake ± ABCC2 blockage in the CAL54 cell lines (represent PRCC1 with low ABCC2 expression). Sunitinib uptake was not increased upon addition of MK571 (Fig. 4E).
Figure 4.
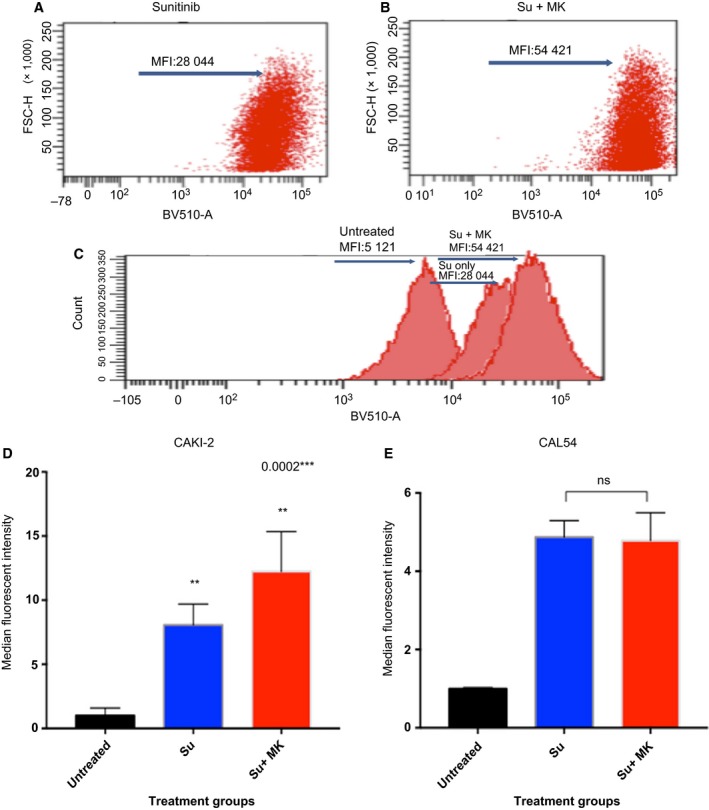
Sunitinib uptake of PRCC2 CAKI‐2 cells is increased with blockage of ABCC2. (A) sunitinib (Su) only treated cells show Su median fluorescence intensity (MFI) of 28 044. (B) Adding MK571 (ABCC2 blocker) increases Su MFI to 54 421. (C) Histogram of the MFI shift. (D) A bar graph representation of the data presented in A–C in CAKI‐2 cell line. (All groups n = 3). One‐way ANOVA statistical test, error bars represent SD (E). CAL54 RCC cell line (PRCC1 equivalent and low ABCC2 expression) shows no significant increase in sunitinib uptake by flow cytometry. (All groups n = 3) Two‐tailed t‐test used, error bars represent SD (nonsignificant: ns, P > 0.05:*, P ≤ 0.05:**, P ≤ 0.01:***, P ≤ 0.001:****, P ≤ 0.0001).
In vivo validation, tumor mouse models exhibit the highest response to therapy in the sunitinib + ABCC2 blocker group
Tumor mouse model was optimized in immunocompromised athymic nude and NOD SCID gamma mice. 106 CAKI‐2 cells were injected subcutaneously. We used physiologically relevant doses of sunitinib, MK‐571, and everolimus. Mice were divided into five treatment groups: untreated, sunitinib, sunitinib + MK‐571, everolimus, and MK571 only (Armstrong et al., 2016; Hara et al., 2011; Karam et al., 2011; Lane et al., 2009; Zhu et al., 2012). Mice were treated for eight consecutive weeks. Similar to what was observed in vitro, the best tumor response (final tumor size and tumor rate of growth) was observed in the group that was exposed to the sunitinib and MK571 treatment (Fig. 5A). Average tumor volume after treatment for that group was 663 mm3 compared to 2230 mm3 in the sunitinib only treated group (P = 0.045) and 3686 mm3 in the control untreated group (P = 0.0132). The growth curves of everolimus‐treated group showed the second highest response to therapy, volume of 1225 mm3. Both everolimus and sunitinib + MK571 arms showed significant differences from the sunitinib treated arm. Sunitinib only and MK571 only treated groups showed similar responses to their corresponding therapy (2230 mm3 and 2176 mm3, respectively) with no significant differences between the two treatment arms.
Figure 5.
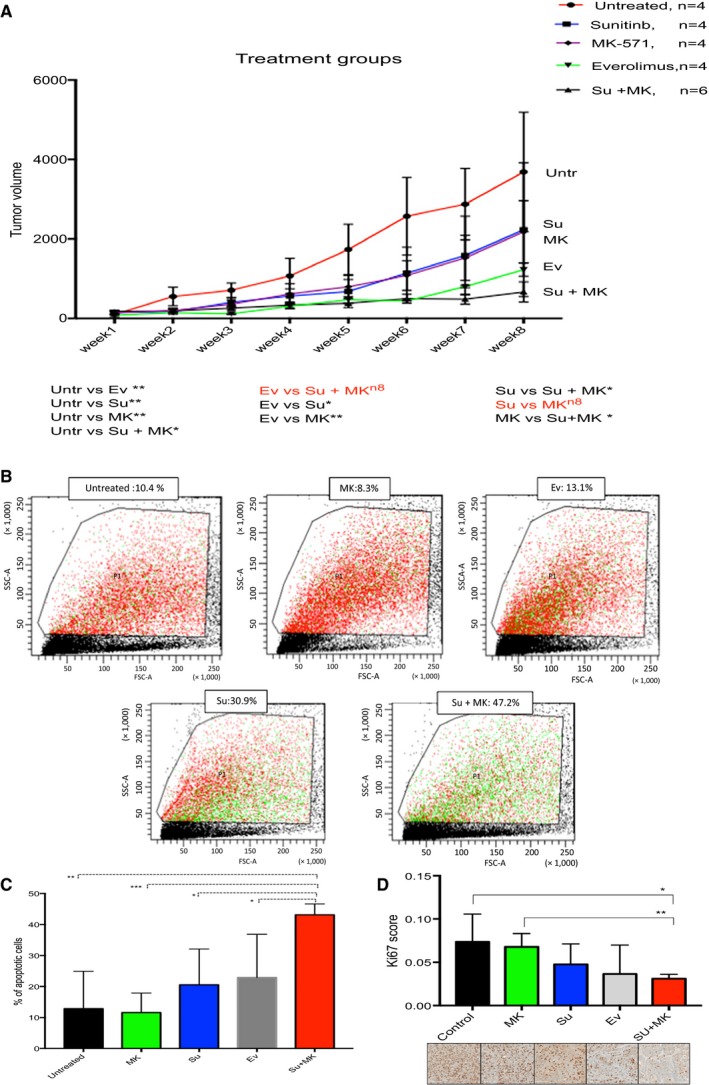
In vivo validation of treatment effect, CAKI‐2 cell line grown in mice. (A) Tumor growth curves in mouse models subjected to five treatment conditions; untreated, sunitinib, MK‐571, everolimus and sunitinib + MK571. Best response is shown in the double‐treatment and everolimus groups. (Untreated n = 4, sunitinib = 4, MK‐571 = 4, everolimus n = 4, sunitinib + MK571 = 6), error bars represent SEM. Paired t‐test is used for the analysis (B) Annexin V apoptosis assay assessing the percentage of apoptotic cells in the different treatment conditions. Highest level of apoptosis was found in the double‐treatment (sunitinib + MK571) group. Apoptotic cells stain green. (C) A bar graph showing the double‐treatment group (sunitinib + MK571) to cause a significant increase in apoptotic cells in comparison with the other treatment groups (untreated n = 3, MK571 n = 4, sunitinib n = 3, everolimus n = 2, sunitinib + Mk571 n = 4). (D) Digital quantification of Ki67 IHC (proliferation marker) of mice tumors shows double‐treatment group to have significantly less proliferation than the other groups (control n = 2, MK571 n = 4, sunitinib n = 3, everolimus n = 3, sunitinib + MK 571 = 5). Two‐tailed t‐test used for the analysis of C and D, error bars represent standard deviation (nonsignificant: ns, P > 0.05:*, P ≤ 0.05:**, P ≤ 0.01:***, P ≤ 0.001:****, P ≤ 0.0001). Scale bar = 200 μm
To further confirm our results, the percentage of apoptotic cells among each treatment group was measured with the Annexin V assay by flow cytometry. The sunitinib + MK571 group showed the highest level of apoptosis (mean 43.125%), which was significantly higher (P = 0.0045) compared to other treatment groups (Fig. 5B,C). We further assessed proliferation in formalin‐fixed sections of tumor tissues, which were stained with the proliferative marker Ki67 and quantified with digital image analysis. Our findings revealed significant decrease in proliferation in the sunitinib + blocker group (P = 0.0197) (Fig. 5D).
Lastly, we histologically examined the mice tissue organs for evidence of response, progression, and metastasis in the five treatment groups. The double‐treatment arm showed the highest degree of necrosis, indicating better response (average 20% necrosis in primary tumors), followed by sunitinib (14%), everolimus (7.5%) and then MK571 and untreated groups (2–5%). Upon comparing the distant organ metastasis among the different groups, the sunitinib + MK571 and everolimus groups showed the lowest level of metastasis among the treated mice (25–30%) (number of mice showing distant organ metastasis in their group). Even though the everolimus group showed a low level of lung metastasis, it was less tolerated by mice as 50% (2/4) were deceased halfway through the treatment period. The sunitinib and MK571 groups showed 50% and 75% metastasis, respectively (Table S1).
In vivo validation, blocking ABCC2 increases sunitinib uptake in CAKI‐2 tumor cells
Tumors grown in mice corresponding to the different treatment groups were harvested at the experiment end point (after 8 weeks of treatment). After tumor dissociation into a single‐cell suspension, the sunitinib content of each mouse tumor was measured by flow cytometry as described in previous sections. Our in vivo analysis yielded similar results to what was detected with in vitro treatment, with a significant increase in intracellular sunitinib among the group that was additionally treated with the ABCC2 blocker. sunitinib median fluorescent intensity (MFI) was 11 250 in the sunitinib + MK571 treated mice versus 6870 in the sunitinib only treated mice (P = 0.028) (Fig. 6).
Figure 6.
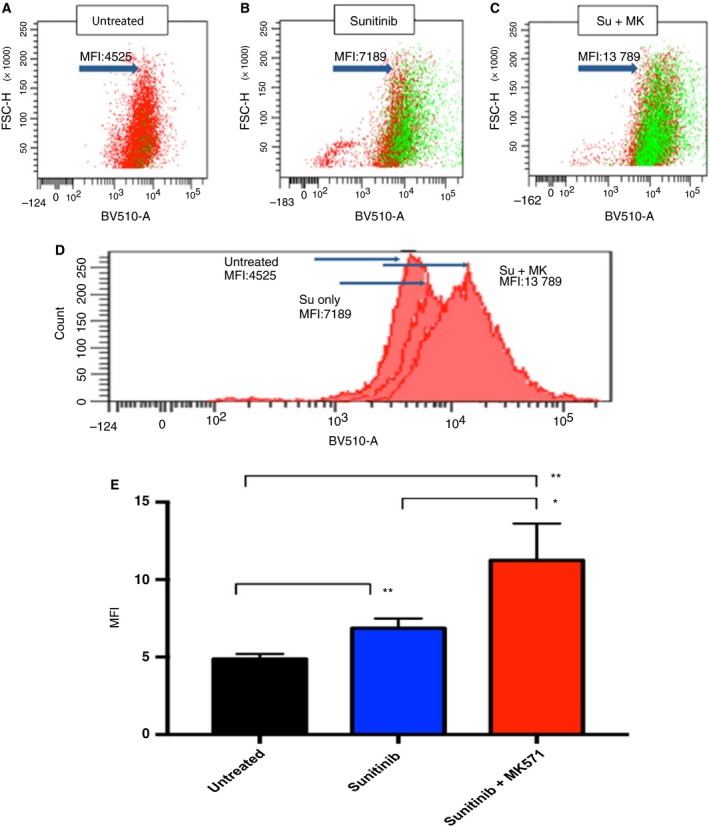
(A) In vivo, flow cytometry shows sunitinib uptake is increased with blockage of ABCC2, (A–C). Dot plot showing median fluorescence intensity of intracellular sunitinib in different groups. (D) Histogram showing fluorescence intensity shift with dual treatment. (E) Bar chart showing significant increases in sunitinib uptake after ABCC2 blockage in the double‐treatment mice group (Untreated n = 3, sunitinib n = 3, sunitinib + Mk571 n = 4). Two‐tailed t‐test used for the analysis, error bars represent SD (nonsignificant: ns, P > 0.05:*, P ≤ 0.05:**, P ≤ 0.01:***, P ≤ 0.001:****, P ≤ 0.0001).
Discussion
In the era of personalized medicine, we are getting to understand more about the individualized biology of different tumors and our approach to this management should reflect this knowledge. While there are many drugs under development toward that goal, we are not yet there for the different RCC subtypes (Posadas et al., 2017). Currently, there are no evidence‐based guidelines for appropriate management of nonclear cell RCC (Ciccarese et al., 2017; Giles et al., 2017). The most common of these nonclear cell RCC subtypes is PRCC, which of itself is known to harbor at least two histological types PRCC1 and PRCC2 with different molecular makeup and clinical behavior (Saleeb et al., 2016; TCGA, 2016; Yang et al., 2005). There is an unmet need to treat these tumors in a manner relevant to their biology so as to respond better to therapy.
There are ongoing clinical trials on the use of MET inhibitors on PRCCs that harbor an activation in the MET pathway (Giles et al., 2017). While PRCC1 is known to harbor MET overexpression, PRCC2 is reported to have activations in the NRF2‐ARE pathway (Ooi et al., 2013; Saleeb et al., 2016; TCGA, 2016). Albiges et al. reported some increased MET activity in PRCC2 in comparison with the normal kidney and CCRCC. Nonetheless, they failed to find MET amplification or a considerably higher MET expression by (q‐RT‐PCR) in PRCC2 (Albiges et al., 2014). The MET pathway was not one of the PRCC2‐enriched pathways, established by the TCGA and ourselves in studying the KIRP cohort (TCGA PRCC cohort) (Saleeb et al., 2016; TCGA, 2016). There are currently no particular clinical trials targeting the more aggressive PRCC2 tumors.
We have previously studied the PRCC subtypes and found pathways enriched in each type that can be relevant for therapy. In the current study, we focus on the more aggressive PRCC2 where we have detected a high level of ABC drug transporters (predominantly ABCC2) and enrichment in the mTOR pathway, consistent with TCGA findings (Saleeb et al., 2016; TCGA, 2016), as ABCC2 is known to contribute to drug resistance (also called multidrug‐resistant protein (MRP2). We hypothesized that blocking ABCC2 would enhance the cancer response to the current first‐line therapy (VEGF TKI, e.g., sunitinib) (Tivnan et al., 2015). We also assessed the validity of using mTOR inhibitors (current second‐line treatment) in PRCC2. We identified an RCC cell line that phenotypically and molecularly closely represents PRCC2. We compared the CCLE gene expression data of 20 RCC cell lines to PRCC2 transcriptomic signatures. Our analysis highlighted the CAKI‐2 cell line as best match for PRCC2 regarding the expression of the top expressed genes as well as the expression of the ARE pathway genes. We confirmed these results by analyzing the in vivo CAKI‐2 cell morphology and immunoprofile which matched those of PRCC2 that was also consistent with literature (Brodaczewska et al., 2016). CAKI‐2 is not known to harbor VHL mutations or 3P deletions distinguishing it from CCRCC. Brodaczewska et al. described multiple evidence linking CAKI‐2 to PRCC (Brodaczewska et al., 2016). Additionally, CAKI‐2 has been known to harbor chromosome 8 aberrations, also described in PRCC2 (Furge et al., 2007; Saleeb et al., 2017).
As expected, CAKI‐2 responded significantly better to anti‐VEGF TKI sunitinib treatment after blocking ABCC2 in vitro. Similarly, the double‐treatment arm showed the best response in vivo, with the smallest average tumor size, highest percentage of apoptotic cells, lowest proliferation rate, highest rate of tumor necrosis, and low tumor metastasis rate. We confirmed that this effect is related to an increase in sunitinib uptake, which we have demonstrated both in vitro and in vivo. Contrarily ABCC2‐low RCC cell lines (CAL‐54) did not show an increase in sunitinib uptake upon ABCC2 blockage. The results ascertain what was shown in other studies regarding an increase in drug uptake upon ABC transporter blockage, especially in cancer with a high level of transporters (S. Shukla et al., 2011).
A known obstacle in the treatment of TKIs is the development of resistance. One of the proposed mechanisms for resistance is their active cellular efflux induced by the ABC transporters (He and Wei, 2012). Many TKIs are substrates for ABC transporters, which produces a complex intricate relationship between TKIs and ABC transporters. ABC transporters would contribute to TKI resistance while TKIs could reversibly inhibit the ABC transporter efflux mechanism (He and Wei, 2012). There are early trials assessing individualized sunitinib dosing in RCC, which have shown improved PFS with the increase of sunitinib dosage when tolerated (Kumar and Kapoor, 2017). This could be possibly linked to blocking the ABC transporter resistance by the increase in TKI exposure (Kathawala et al., 2015; Suneet Shukla et al., 2009). Conversely, an addition of an ABC transporter blocker could enhance the therapeutic potential of TKIs(S. Shukla et al., 2011; Suneet Shukla et al., 2009).
Interestingly, ABCC2 blockage alone by MK571 also affected the PRCC2 cell line growth both in vitro and in vivo, in keeping with emerging evidence suggesting that ABC transporters contribute to tumor growth in ways beyond drug efflux (Fletcher et al., 2010; Nozaki et al., 2010). Henderson et al. demonstrated that in neuroblastoma, ABCC transporters contribute to the tumors biology and clinical behavior independent of its role as chemotherapy resistance (Henderson et al., 2011). It is proposed that ABC transporters contribute to a number of hallmarks essential for cancer initiation and progression, as proliferation and apoptosis, cell differentiation and stem cell maintenance, cell migration invasion and metastasis (Fletcher et al., 2010). Montelukast is an FDA‐approved leukotriene receptor antagonist that functions similarly to MK571 and is found to also inhibit ABCC2 (Roy et al., 2009). Montelukast was found to have a chemotherapeutic potential in a number of studies, highlighting the promising role of ABCC transporter blockers as cancer therapeutic agents(Tsai et al., 2017).
Likewise, we assessed the effect of the mTOR inhibitor everolimus on the PRCC2 (CAKI‐2) RCC cell line. In vivo, the everolimus‐treated arm showed the second best response to therapy after the sunitinib+ blocker group. Everolimus is currently among the second‐line therapies of clear cell RCC, a paradigm that is also generally adopted for the nonclear cell subtypes. Our data indicate that in pure PRCC2 biology, everolimus does show better chemopreventative effect than sunitinib. Two previous trials (ASPEN and ESPN) have attempted to compare between sunitinib and everolimus treatment in PRCCs (Armstrong et al., 2016; Schmid and Gore, 2016; Tannir et al., 2016). In both the ASPN and ESPN trials, no attempt was made to subtype the PRCC patients or distinguish between the treatment arms in the specific PRCC subtypes. Additionally, the number of PRCC patients in each of these trials was considerably small with 70 patients in the ASPEN trial (33 sunitinib and 37 everolimus) and 27 in the ESPN trial (14 sunitinib and 13 everolimus). Ravaud et al. in the SUPAP trial assessing the effect of sunitinib treatment only on the two PRCC subtypes found slightly superior benefit with type 1 versus the type 2 (better partial response, longer stable disease, and overall survival). These data highlight potential benefit in subtyping PRCCs in clinical trials. Large subtype‐specific clinical trials are required to formulate better guidelines (Giles et al., 2017).
Conclusion
We believe our study uncovers extremely pertinent information regarding PRCC2 treatment. Discoveries on the individualized nature of tumor biology should direct the clinical field toward similarly individualized treatments. We assessed the efficacy of targeting tumor‐specific pathways in a preclinical setting and showed that these treatment modalities show great promise. We highlight the importance of targeting ABC transporters, as ABCC2 in PRCC2 and in other high drug transporter tumors. We acknowledge that the current study has a number of limitations, particularly its experimental design in cell lines and the nature of the assessment in in vitro setting and in mouse models. However, our findings would pave the way for clinical trials that can confirm these results and lead to a more accurate tumor‐specific treatment for the patients of PRCC2 and similar tumors.
Author contributions
RS designed the project, performed the experiments, analyzed the data, and wrote the manuscript. MF performed in vivo and in vitro experiments and analyzed data. ZL guided and performed experiments, and interpreted results. FB reviewed and helped interpret the tumor pathology data. JB helped with the in vivo experiments. GB reviewed data and guided the tumor therapeutic experiments, and helped interpret data. AF reviewed and helped interpret the clinical data. FB performed experiments and immunohistochemical stains. MD: reviewed and helped interpret the tumor pathology data. GS, senior scientist, supervised the project, guided the experimental framework, helped interpret the results, and reviewed the final work and the manuscript.
Supporting information
Fig. S1. The CAL‐54 RCC cell line represents PRCC1.
Fig. S2. The CAKI‐2 cell line represents PRCC2.
Table S1. Histological examination of mice tumor models.
Acknowledgements
This work was supported by grants from the Kidney Cancer Research Network of Canada and the Canadian Urology Oncology group (KCRNC/CUOG) research trainee award, the Ontario Institute of Cancer Research (Transformative Pathology Fellowship award RFTP‐004), and Ontario Molecular Pathology Research Network (OMPRN stream 1 grant #CPTRG‐004).
References
- Afriansyah A, Hamid ARA, Mochtar CA and Umbas R (2016) Targeted therapy for metastatic renal cell carcinoma. Acta Medica Indonesiana 48, 335–347. [PubMed] [Google Scholar]
- Albiges L, Guegan J, Le Formal A, Verkarre V, Rioux‐Leclercq N, Sibony M, Bernhard JC, Camparo P, Merabet Z, Molinie V et al (2014) MET Is a potential target across all papillary renal cell carcinomas: Result from a large molecular study of pRCC with CGH array and matching gene expression array. Clin Cancer Res 20, 3411–3421. [DOI] [PubMed] [Google Scholar]
- Armstrong AJ, Halabi S, Eisen T, Broderick S, Stadler WM, Jones RJ, Garcia JA, Vaishampayan UN, Picus J, Hawkins RE et al (2016) Everolimus versus sunitinib for patients with metastatic non‐clear cell renal cell carcinoma (ASPEN): a multicentre, open‐label, randomised phase 2 trial. Lancet Oncol 17, 378–388. [DOI] [PMC free article] [PubMed] [Google Scholar]
- Barretina J, Caponigro G and Stransky N (2012) The Cancer Cell Line Encyclopedia enables predictive modelling of anticancer drug sensitivity. Nature 483, 603–607. [DOI] [PMC free article] [PubMed] [Google Scholar]
- Brodaczewska KK, Szczylik C, Fiedorowicz M, Porta C and Czarnecka AM (2016) Choosing the right cell line for renal cancer research. Mol Cancer 15, 83. [DOI] [PMC free article] [PubMed] [Google Scholar]
- Ciccarese C, Iacovelli R, Brunelli M, Massari F, Bimbatti D, Fantinel E, De Marco V, Porcaro AB, Martignoni G, Artibani W et al (2017) Addressing the best treatment for non‐clear cell renal cell carcinoma: A meta‐analysis of randomised clinical trials comparing VEGFR‐TKis versus mTORi‐targeted therapies. Eur J Cancer 83, 237–246. [DOI] [PubMed] [Google Scholar]
- Ciccarese C, Massari F, Santoni M, Heng DYC, Sotte V, Brunelli M, Conti A, Cheng L, Lopez‐Beltran A, Scarpelli M et al (2015) New molecular targets in non clear renal cell carcinoma: an overview of ongoing clinical trials. Cancer Treat Rev 41, 614–622. [DOI] [PubMed] [Google Scholar]
- Courthod G, Tucci M, Di Maio M and Scagliotti GV (2015) Papillary renal cell carcinoma: a review of the current therapeutic landscape. Crit Rev Oncol/Hemat 96, 100–112. [DOI] [PubMed] [Google Scholar]
- Escudier B, Molinie V, Bracarda S, Maroto P, Szczylik C, Nathan P, Negrier S, Weiss C, Porta C, Grünwald V et al (2016) Open‐label phase 2 trial of first‐line everolimus monotherapy in patients with papillary metastatic renal cell carcinoma: RAPTOR final analysis. Eur J Cancer 69, 226–235. [DOI] [PubMed] [Google Scholar]
- Fletcher JI, Haber M, Henderson MJ and Norris MD (2010) ABC transporters in cancer: more than just drug efflux pumps. Nat Rev Cancer 10, 147–156. [DOI] [PubMed] [Google Scholar]
- Furge KA, Chen J, Koeman J, Swiatek P, Dykema K, Lucin K, Kahnoski R, Yang XJ and Bin TT (2007) Detection of DNA copy number changes and oncogenic signaling abnormalities from gene expression data reveals MYC activation in high‐grade papillary renal cell carcinoma. Can Res 67, 3171–3176. [DOI] [PubMed] [Google Scholar]
- Giles RH, Choueiri TK, Heng DY, Albiges L, Hsieh JJ, Linehan WM, Pal S, Maskens D, Paseman B, Jonasch E et al (2017) Recommendations for the management of rare kidney cancers. Eur Urol 6, 974–983. [DOI] [PubMed] [Google Scholar]
- Gioanni J, Zanghellini E, Mazeau C, Amiel J, Poustis‐Delpont C, Lagrange JL, Duplay H, Caldani C, Courdi A (1996) CAL 54, une nouvelle lignée cellulaire dérivée d'un carcinome rénal humain: caractérisation et radiosensibilité. Bull Cancer 83, 553–558. [PubMed] [Google Scholar]
- Guo H, German P, Bai S, Barnes S, Guo W, Qi X, Lou H, Liang J, Jonasch E, Mills GB et al (2015) The PI3K/AKT pathway and renal cell carcinoma. Journal of Genetics and Genomics 42, 343–353. [DOI] [PMC free article] [PubMed] [Google Scholar]
- Hara Y, Sassi Y, Guibert C, Gambaryan N, Dorfmüller P, Eddahibi S, Lompré AM, Humbert M, Hulot J (2011) Inhibition of MRP4 prevents and reverses pulmonary hypertension in mice. Journal of Clinical Investigation, 121, 2888–2897. [DOI] [PMC free article] [PubMed] [Google Scholar]
- He M and Wei M‐J (2012) Reversing multidrug resistance by tyrosine kinase inhibitors. Chines Journal of Cancer 31, 126–133. [DOI] [PMC free article] [PubMed] [Google Scholar]
- Henderson MJ, Haber M, Porro A, Munoz MA, Iraci N, Xue C, Murray J, Flemming CL, Smith J, Fletcher JI et al (2011) ABCC multidrug transporters in childhood neuroblastoma: clinical and biological effects independent of cytotoxic drug efflux. J Natl Cancer Inst 103, 1236–1251. [DOI] [PMC free article] [PubMed] [Google Scholar]
- Jeong H‐S, Ryoo I‐G and Kwak M‐K (2015) Regulation of the expression of renal drug transporters in KEAP1‐knockdown human tubular cells. Toxicology in Vitro : An International Journal Published in Association with BIBRA 29, 884–892. [DOI] [PubMed] [Google Scholar]
- Karam JA, Zhang X‐Y, Tamboli P, Margulis V, Wang H, Abel EJ, Culp SH and Wood CG (2011) Development and characterization of clinically relevant tumor models from patients with renal cell carcinoma. Eur Urol 59, 619–628. [DOI] [PubMed] [Google Scholar]
- Kathawala RJ, Gupta P, Ashby CR and Chen Z‐S (2015) The modulation of ABC transporter‐mediated multidrug resistance in cancer: A review of the past decade. Drug Resist Updates 18, 1–17. [DOI] [PubMed] [Google Scholar]
- Klatte T, Anterasian C, Said JW, de Martino M, Kabbinavar FF, Belldegrun AS and Pantuck AJ (2010) Fuhrman grade provides higher prognostic accuracy than nucleolar grade for papillary renal cell carcinoma. J Urol 183, 2143–2147. [DOI] [PubMed] [Google Scholar]
- Kolin DL, Sy K, Rotondo F, Bassily MN, Kovacs K, Brezden‐Masley C, Streutker CJ and Yousef GM (2014) Prognostic significance of human tissue kallikrein‐related peptidases 11 and 15 in gastric cancer. Biol Chem 395, 1087–1093. [DOI] [PubMed] [Google Scholar]
- Kumar R and Kapoor A (2017) Current management of metastatic renal cell carcinoma: evolving new therapies. CE: Swati; SPC, 3, 231–237. [DOI] [PubMed] [Google Scholar]
- Lane HA, Wood JM, McSheehy PMJ, Allegrini PR, Boulay A, Brueggen J, Littlewood‐Evans A, Maira SM, Martiny‐Baron G, Schnell CR et al (2009) mTOR inhibitor RAD001 (Everolimus) has antiangiogenic/vascular properties distinct from a VEGFR tyrosine kinase inhibitor. Clin Cancer Res 15, 1612–1622. [DOI] [PubMed] [Google Scholar]
- Malone JH and Oliver B (2011) Microarrays, deep sequencing and the true measure of the transcriptome. BMC Biol 9, 34. [DOI] [PMC free article] [PubMed] [Google Scholar]
- Moch H, Humphrey P, Ulbright T and Reuter VE (2016) WHO Classifications of Tumours of the Urinary System and Male Genital Organs. IARC, Lyon. [DOI] [PubMed] [Google Scholar]
- Nowak‐Sliwinska P, Weiss A, van Beijnum JR, Wong TJ, Kilarski WW, Szewczyk G, Verheul HM, Sarna T, van den Bergh H and Griffioen AW (2015) Photoactivation of lysosomally sequestered sunitinib after angiostatic treatment causes vascular occlusion and enhances tumor growth inhibition. Cell Death Dis 6, e1641. [DOI] [PMC free article] [PubMed] [Google Scholar]
- Nozaki M, Yoshikawa M, Ishitani K, Kobayashi H, Houkin K, Imai K, Ito Y and Muraki T (2010) Cysteinyl leukotriene receptor antagonists inhibit tumor metastasis by inhibiting capillary permeability. Keo J Med 59, 10–18. [DOI] [PMC free article] [PubMed] [Google Scholar]
- Ooi A, Dykema K, Ansari A, Petillo D, Snider J, Kahnoski R, Anema J, Craig D, Carpten J and Teh BT (2013) CUL3 and NRF2 mutations confer an NRF2 activation phenotype in a sporadic form of papillary renal cell carcinoma. Can Res 73, 2044–2051. [DOI] [PubMed] [Google Scholar]
- Pénzváltó Z, Tegze B, Szász AM, Sztupinszki Z, Likó I, Szendrői A, Schäfer R and Győrffy B (2013) Identifying Resistance Mechanisms against Five Tyrosine Kinase Inhibitors Targeting the ERBB/RAS Pathway in 45 Cancer Cell Lines. PLoS ONE 8, e59503. [DOI] [PMC free article] [PubMed] [Google Scholar]
- Pignot G, Elie C, Conquy S, Vieillefond A, Flam T, Zerbib M, Debré B and Amsellem‐Ouazana D (2007) Survival Analysis of 130 Patients with Papillary Renal Cell Carcinoma: Prognostic Utility of Type 1 and Type 2 Subclassification. Urology 69, 230–235. [DOI] [PubMed] [Google Scholar]
- Posadas EM, Limvorasak S and Figlin RA (2017) Targeted therapies for renal cell carcinoma. Nat Rev Nephrol 13, 496–511. [DOI] [PubMed] [Google Scholar]
- Ravaud A, Oudard S, De Fromont M, Chevreau C, Gravis G, Zanetta S, Theodore C, Jimenez M, Sevin E, Laguerre B et al (2015) First‐line treatment with sunitinib for type 1 and type 2 locally advanced or metastatic papillary renal cell carcinoma: A phase II study (SUPAP) by the French Genitourinary Group (GETUG). Ann Oncol 26, 1123–1128. [DOI] [PubMed] [Google Scholar]
- Roy U, Chakravarty G, Honer Zu Bentrup K and Mondal D (2009) Montelukast is a potent and durable inhibitor of multidrug resistance protein 2‐mediated efflux of taxol and saquinavir. Biological & Pharmaceutical Bulletin 32, 2002–2009. [DOI] [PMC free article] [PubMed] [Google Scholar]
- Saleeb RM, Brimo F, Farag M, Rompré‐Brodeur A, Rotondo F, Beharry V, Wala S, Plant P, Downes MR, Pace K et al (2017) Toward biological subtyping of papillary renal cell carcinoma with clinical implications through histologic, immunohistochemical, and molecular analysis. Am J Surg Pathol 41, 1618–1629. [DOI] [PubMed] [Google Scholar]
- Saleeb RM, Plant P, Tawedrous E, Krizova A, Brimo F, Evans AJ, Wala SJ, Bartlett J, Ding Q, Boles D et al (2016) Integrated Phenotypic/Genotypic Analysis of Papillary Renal Cell Carcinoma Subtypes: Identification of Prognostic Markers, Cancer‐related Pathways, and Implications for Therapy. Eur Urol Focus 10.1016/j.euf.2016.09.002 [Epub ahead of print]. [DOI] [PubMed] [Google Scholar]
- Schmid TA and Gore ME (2016) Sunitinib in the treatment of metastatic renal cell carcinoma. Therapeutic Advances in Urology 8, 348–371. [DOI] [PMC free article] [PubMed] [Google Scholar]
- Shibayama Y, Nakano K, Maeda H, Taguchi M, Ikeda R, Sugawara M, Iseki K, Takeda Y and Yamada K (2011) Multidrug resistance protein 2 implicates anticancer drug‐resistance to sorafenib. Biological & Pharmaceutical Bulletin 34, 433–435. [DOI] [PubMed] [Google Scholar]
- Shukla S, Ohnuma S and Ambudkar SV (2011) Improving cancer chemotherapy with modulators of ABC drug transporters. Curr Drug Targets 12, 621–630. [DOI] [PMC free article] [PubMed] [Google Scholar]
- Shukla S, Robey RW, Bates SE and Ambudkar SV (2009) Sunitinib (Sutent, SU11248), a small‐molecule receptor tyrosine kinase inhibitor, blocks function of the ATP‐binding cassette (ABC) transporters P‐glycoprotein (ABCB1) and ABCG2. Drug Metab Dispos 37, 359–365. [DOI] [PMC free article] [PubMed] [Google Scholar]
- Sinha R, Winer AG, Chevinsky M, Jakubowski C, Chen Y‐B, Dong Y, Tickoo SK, Reuter VE, Russo P and Coleman JA (2017) Analysis of renal cancer cell lines from two major resources enables genomics‐guided cell line selection. Nat Commun 8, 15165. [DOI] [PMC free article] [PubMed] [Google Scholar]
- de Sousa e Melo F, Kurtova AV, Harnoss JM, Kljavin N, Hoeck JD, Hung J, Anderson JE, Storm EE, Modrusan Z, Koeppen H et al (2017). A distinct role for Lgr5+ stem cells in primary and metastatic colon cancer. Nature, 543, 676–680. [DOI] [PubMed] [Google Scholar]
- Taguchi K, Motohashi H and Yamamoto M (2011) Molecular mechanisms of the Keap1 – Nrf2 pathway in stress response and cancer evolution. Genes Cells 16, 123–140. [DOI] [PubMed] [Google Scholar]
- Tang F, Horie K and Borchardt RT (2002) Are MDCK cells transfected with the human MRP2 gene a good model of the human intestinal mucosa? Pharm Res 19, 765–772. [DOI] [PubMed] [Google Scholar]
- Tannir NM, Jonasch E, Albiges L, Altinmakas E, Ng CS, Matin SF, Wang X, Qiao W, Dubauskas Lim Z, Tamboli P et al (2016). Everolimus Versus Sunitinib Prospective Evaluation in Metastatic Non–Clear Cell Renal Cell Carcinoma (ESPN): A Randomized Multicenter Phase 2 Trial. Eur Urol 69, 866–874. [DOI] [PMC free article] [PubMed] [Google Scholar]
- TCGA (2016) Comprehensive molecular characterization of papillary Renal cell carcinoma. N Engl J Med 374, 135–145. [DOI] [PMC free article] [PubMed] [Google Scholar]
- Tivnan A, Zakaria Z, O'Leary C, Kögel D, Pokorny JL, Sarkaria JN and Prehn JHM (2015) Inhibition of multidrug resistance protein 1 (MRP1) improves chemotherapy drug response in primary and recurrent glioblastoma multiforme. Frontiers in Neuroscience 9, 1–10. [DOI] [PMC free article] [PubMed] [Google Scholar]
- Tsai M‐J, Chang W‐A, Tsai P‐H, Wu C‐Y, Ho Y‐W, Yen M‐C, Lin YS, Kuo PL and Hsu Y‐L (2017) Montelukast Induces Apoptosis‐Inducing Factor‐Mediated Cell Death of Lung Cancer Cells. Int J Mol Sci 18, 1353. [DOI] [PMC free article] [PubMed] [Google Scholar]
- Warta R, Theile D, Mogler C, Herpel E, Grabe N, Lahrmann B, Plinkert PK, Herold‐Mende C, Weiss J and Dyckhoff G (2014) Association of drug transporter expression with mortality and progression‐free survival in stage IV head and neck squamous cell carcinoma. PLoS ONE 9, e108908. [DOI] [PMC free article] [PubMed] [Google Scholar]
- Wu T, Chen Z, To KKW, Fang X, Wang F, Cheng B and Fu L (2017) Effect of abemaciclib (LY2835219) on enhancement of chemotherapeutic agents in ABCB1 and ABCG2 overexpressing cells in vitro and in vivo. Biochem Pharmacol 124, 29–42. [DOI] [PubMed] [Google Scholar]
- Yang XJ, Tan M‐H, Kim HL, Ditlev JA, Betten MW, Png CE, Kort EJ, Futami K, Furge KA, Takahashi M et al (2005). A molecular classification of papillary renal cell carcinoma. Can Res 65, 5628–5637. [DOI] [PubMed] [Google Scholar]
- Zhang H, Zhang Y‐K, Wang Y‐J, Kathawala RJ, Patel A, Zhu H, Sodani K, Talele TT, Ambudkar SV, Chen ZS et al (2014) WHI‐P154 enhances the chemotherapeutic effect of anticancer agents in ABCG2‐overexpressing cells. Cancer Sci 105, 1071–1078. [DOI] [PMC free article] [PubMed] [Google Scholar]
- Zhu Y, Zhang X, Liu Y, Zhang S, Liu J, Ma Y and Zhang J (2012) Antitumor effect of the mTOR inhibitor everolimus in combination with trastuzumab on human breast cancer stem cells in vitro and in vivo. Tumor Biology 33, 1349–1362. [DOI] [PubMed] [Google Scholar]
Associated Data
This section collects any data citations, data availability statements, or supplementary materials included in this article.
Supplementary Materials
Fig. S1. The CAL‐54 RCC cell line represents PRCC1.
Fig. S2. The CAKI‐2 cell line represents PRCC2.
Table S1. Histological examination of mice tumor models.