Abstract
Purpose
To test the hypothesis that human, monkey, pig, sheep, cow, and goat eyes exhibit circumferential, radial, and interweaving collagen architecture in the posterior sclera.
Methods
We analyzed 1,327 cryosections from the posterior poles of 4 human, 4 monkey, 5 pig, 8 sheep, 1 goat, and 2 cow eyes. Images were acquired using polarized light microscopy and processed to obtain polar fiber orientations relative to the center of the canal. Circumferential, radial, and interweaving regions were identified and analyzed for mean fiber orientation and anisotropy and region width and thickness.
Results
Every eye exhibited circumferential, radial, and interweaving fibers in consistent locations. Radial fibers extended out from near the canal into the peripapillary and peripheral sclera in the innermost sclera. Circumferential fibers were directly adjacent to the canal and most prevalent in the outermost, posterior sclera. Interweaving fibers were found throughout the sclera thickness. Across all species, median anisotropy in the radial, circumferential, and interweaving regions were 0.95, 0.96, and 0.28, respectively.
Conclusions
Regions of radial, circumferential, and interweaving fibers occur in the posterior pole sclera of human, monkey, pig, sheep, cow, and goat eyes. The consistency across species in scleral architecture suggests that they are primary organizational components whose functions should be better understood.
Keywords: collagen, sclera, optic nerve head, microscopy
Collagen architecture heavily influences the properties of the sclera and, therefore, the biomechanics of the eye.1,2 To understand eye physiology and pathophysiology, it is necessary to characterize the collagen architecture in the globe and, in particular, the posterior pole. Several techniques have been leveraged toward this, including wide-angle x-ray scattering (WAXS),3–5 small angle light scattering (SALS),6,7 magnetic resonance imaging (MRI),8,9 and second harmonic generated imaging.10 We have previously used polarized light microscopy (PLM) to visualize and quantify the collagen in the posterior sclera11 and to identify the major organizational components of the posterior sclera of sheep eyes.12 A key finding of our studies was that the collagen fibers of the posterior pole and peripapillary sclera of sheep eyes are organized into three distinct regions: a region of highly aligned circumferential fibers adjacent to the canal; a region of highly aligned radial fibers in the most anterior, or innermost to the globe, sclera; and a region of interweaving fibers without a primary alignment orientation.
Our goal was to test the hypothesis that circumferential, radial, and interweaving regions are consistent features of the collagen organization of the posterior sclera. Specifically, we studied if this is the case in eyes from human, monkey, pig, sheep, cow, and goat.
Methods
Eye Procurement, Preparation, and Sectioning
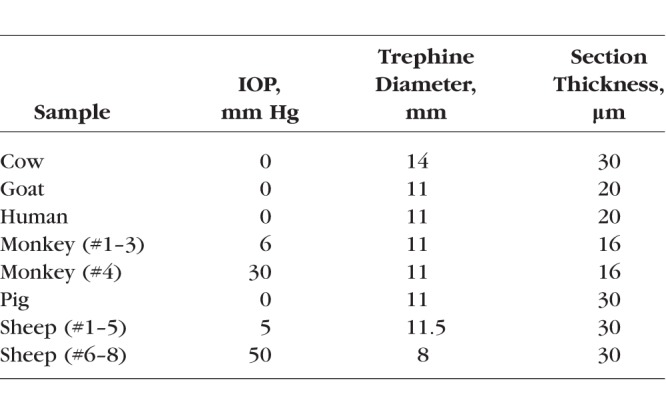
This study was conducted in accordance with the tenets of the Declaration of Helsinki, the Health Insurance Portability and Accountability Act, and the Association of Research in Vision and Ophthalmology's statement for the use of animals in ophthalmic and vision research. Four normal human donor eyes were obtained through the Center for Organ Recovery and Education of Pennsylvania. The eyes were originally acquired for use in another study and were deidentified and stripped of all information that could potentially be used to identify the patients, including demographic information. Four monkey eyes were obtained from collaborators from animals that had been used for studies not involving the eyes. Pig, sheep, cow, and goat eyes (5, 8, 2, and 1, respectively) were obtained from a local abattoir. All eyes were ostensibly healthy, without known abnormalities, and obtained and processed within 24 hours of death. Globes were processed as described elsewhere.12 Briefly, the episcleral tissues, fat, and muscles were carefully removed. Intraocular pressure (IOP) was set, as per the Table, through a cannula inserted into the anterior chamber and connected to a saline reservoir. The globes were then perfusion and immersion fixed in 10% formalin for 24 hours. After fixation, the optic nerve head (ONH) and posterior pole were excised with a circular trephine. The excised regions were cryosectioned coronally starting from the posterior side. Sections were collected starting when there was visible sclera and stopping when the canal was no longer visible. Some of the globes were also used in other studies with different requirements. Hence, there were slight variations in preparation parameters (listed in the Table).
Table.
Eye Preparation Parameters
Imaging
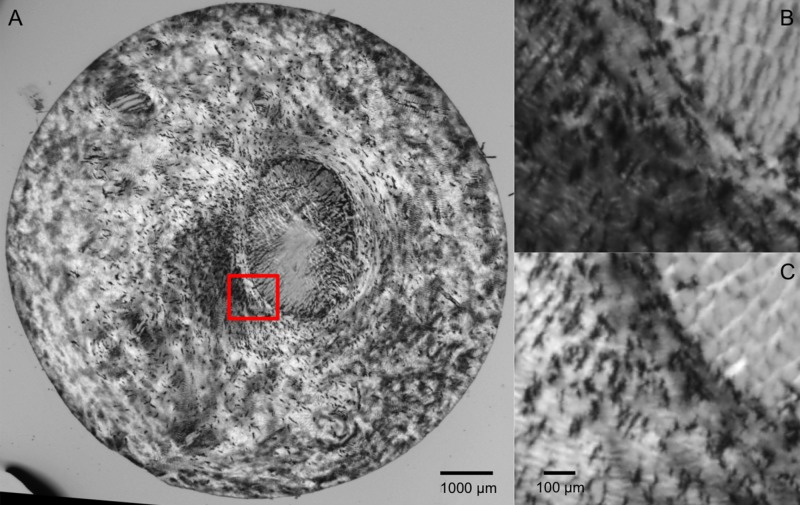
All sections were imaged with PLM as described before.12 Briefly, two polarized filters (Hoya, Tokyo, Japan) were used, one a polarizer and the other an analyzer, to collect images at four filter orientations 45° apart (Fig. 1). These polarized filters were used to collect all of the images used in this study, regardless of imaging system. Because of the requirements of the other studies using the same tissues, images in this work were obtained using four imaging systems. Elsewhere, we have shown that PLM-derived measurements of the type of parameters of interest in this work are not affected by the imaging system, magnification, or mosaicking.11 The cow, goat, and monkey eye images were all captured using the 1× objective (numerical aperture [NA] 0.25) of an Olympus MVX10 microscope (0.8× magnification setting), paired with a monochrome Hamamatsu ORCA-Flash4.0 LT camera. All of the pig and one of the human eyes were imaged using the 0.8× objective (NA 0.12) of an Olympus SZX16 microscope, paired with a dual chip Olympus DP80 camera. The remaining three human eyes were imaged using the 1× objective (NA 0.1) of a Nikon SMZ1500 microscope, paired with a Nikon DXM1200 camera. Finally, all of the sheep eyes were imaged using the 10× objective (NA 0.5) of a Nikon Eclipse Ti microscope, paired with a Cascade 1K camera. When necessary, images were stitched into mosaics to cover the whole section.
Figure 1.
Example “raw” PLM of the posterior pole of a pig eye. (A) Full section view illustrating the variations in image intensity for differently oriented collagen fibers. (B, C) Close-up of the canal edge (red box in A), illustrating the changes in intensity due to polarizer orientations 45° apart.
Visualization
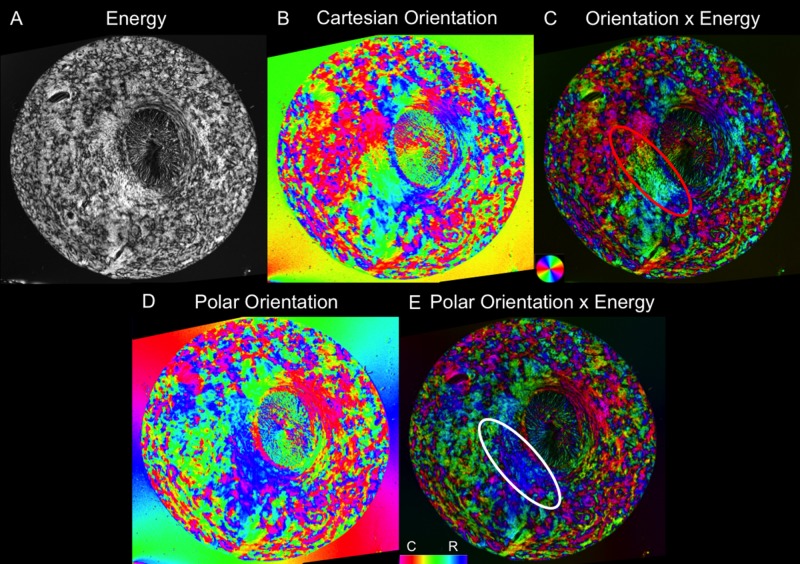
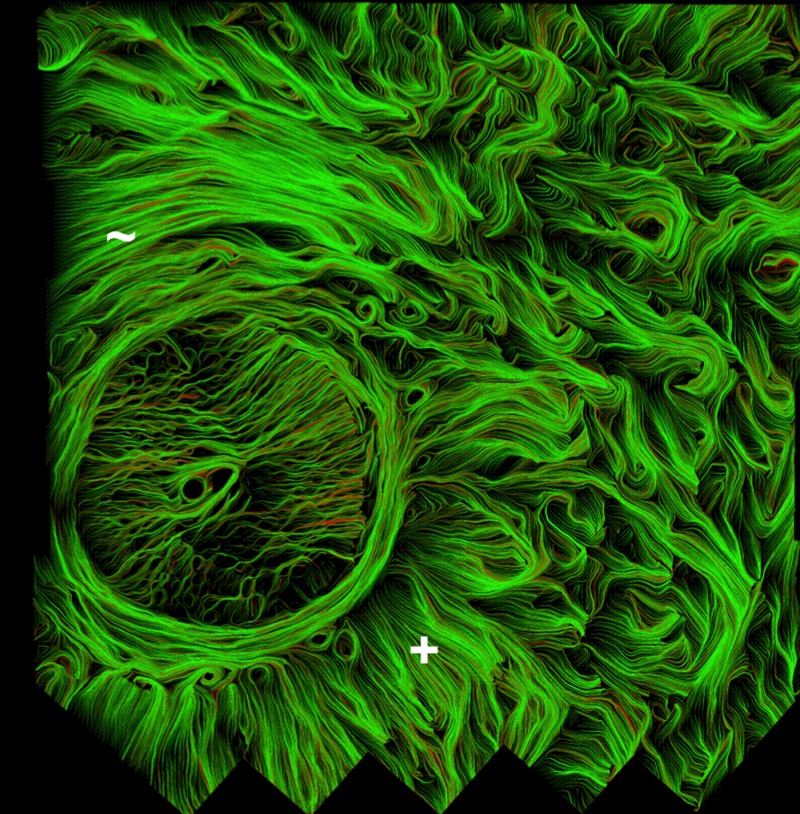
The PLM images were processed as previously described12,13 to obtain Cartesian orientation and “energy” images (Fig. 2). The orientation images display the collagen orientation in each pixel and were used for all of the analyses. The “energy” images reflect the signal strength in each pixel and were used to better visualize structure by adjusting the pixel brightness of the orientation images, as previously described.12,13 Unless stated otherwise, all orientation images are shown masked this way. Using this processing, the canal region appears darker than the sclera, mainly due to lower collagen density (Fig. 2). To better illustrate the architecture of the ONH region, we also applied fiber “tracing” methods, as previously described12 (Fig. 3).
Figure 2.
Example visualization of fiber orientation from a single section in a pig eye. (A) An “energy” parameter proportional to the signal information at each pixel helps distinguish the tissue from the background. (B) Cartesian orientation map. (C) Combining the energy and Cartesian orientation maps for visualization helps discern tissue architecture. (D) Polar orientation map. (E) Combined energy and polar orientation map. The polar orientation allows for the radial and circumferential fibers to be more easily distinguished. Whereas in Cartesian coordinates, these fibers display a spectrum of colors, as seen by the radials in the red oval, in polar coordinates, they each have a more limited set of colors, as seen in the white oval.
Figure 3.
Collagen fiber traces in the ONH of a human eye. The fiber traces help to emphasize the fiber continuity and organization. This particular section shows good examples of both (+) radial and (∼) circumferential regions, as well as the less aligned interweaving regions on the right hand side. Also discernible is the fibrous lamina cribrosa, within the canal, although this was not the objective of this work.
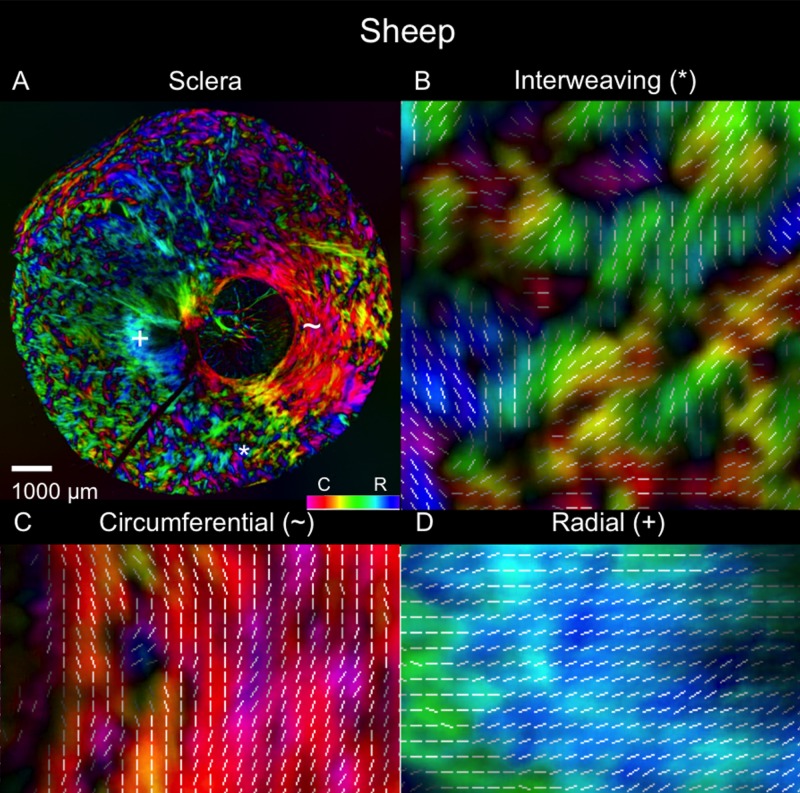
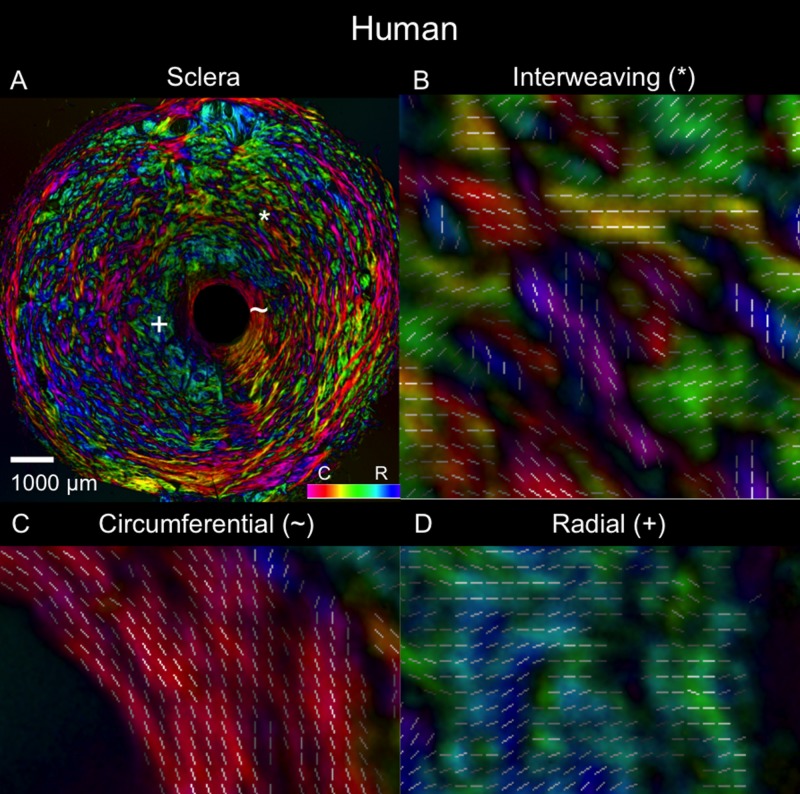
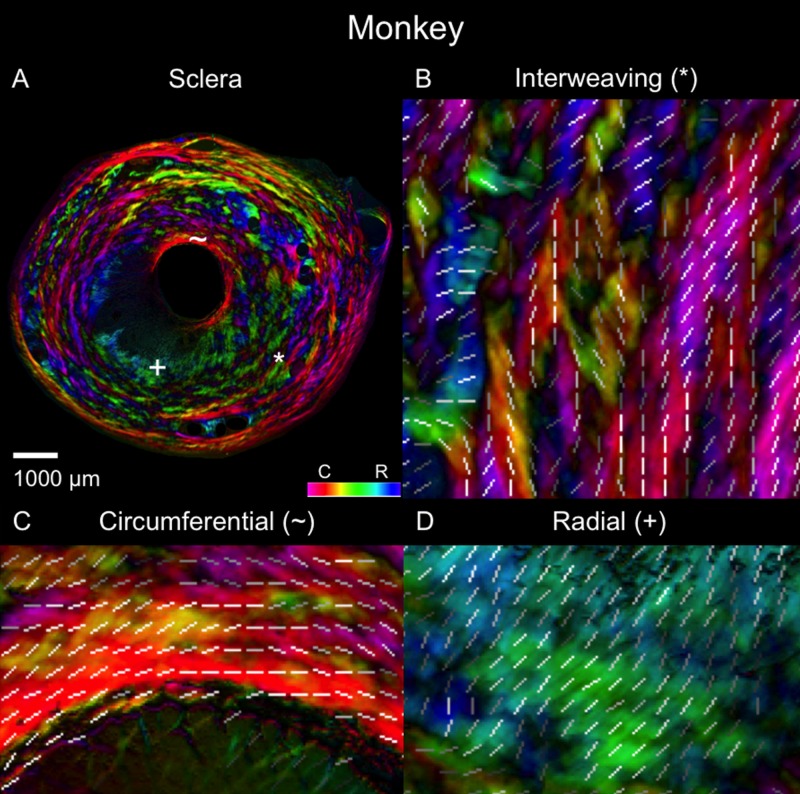
For analysis, the orientation information was converted from the initially obtained Cartesian coordinates into polar coordinates. This was achieved by first manually marking the scleral canal center in each of the images. Then, the Cartesian coordinates were transformed to polar coordinates relative to the center of the canal. This transformation also simplified discerning the radial, circumferential, and interweaving regions because the polar orientations of 0° correspond to radial fibers and orientations of 90° correspond to circumferential fibers. Furthermore, they are more visually identifiable because radial areas appear green, blue, and cyan; circumferential areas are magenta, red, and orange; and interweaving regions have many different colors interweaving throughout.
Image Stacking and Registration
After processing the PLM images, all of the images from a single eye were stacked sequentially and registered to the most posterior image. The registration was done manually based on tissue edges and fiducial marks made on the sclera before sectioning. After registration, the original images were reprocessed to obtain “corrected” orientation angles based on the intersection rotations that resulted from the registration. The registered stacks of images were then used to create virtual cross sections and to inspect the depth dependence of the orientations. It is important to note that all orientation measures are in the planes of the section.
Quantification
We analyzed fiber orientations on each section following the previously reported methodology.12 Briefly, we manually marked rectangular areas (200–500 μm per side) in radial, circumferential, or interweaving regions. The marked areas, 2749 in total, were processed to compute the circular mean and anisotropy in each. The circular mean represents the primary fiber orientation in the marked area. The anisotropy represents the spread of orientations, indicating the degree of alignment around the primary orientation. The anisotropy values were normalized so that perfectly aligned fibers have an anisotropy of 1 and fibers evenly dispersed in all directions have an anisotropy of 0. These values were used to create regional angle (circular mean) and anisotropy plots for each of the three region types in order to assess the patterns associated with the visually identified regions.
Linear mixed effects (LME) models, accounting for autocorrelations, or dependent similarities, between measurements from the same species, eyes, and sections, were used to assess if either the average angle or anisotropy were significantly related to the region types (radial, circumferential, and interweaving) identified when marking the images. This was done both for the individual species and between all species included in this study.
Note that a subset of the measurements in sheep eyes had been previously reported as part of an earlier, more limited study.12 To facilitate comparability with the other species, the sheep data were reprocessed and reanalyzed, extending the analyses to include the depth-related measurements in this work.
Depth Analysis
To assess the depth variations of the radial, circumferential, and interweaving regions, we inspected each stack image to determine which of the three region types were present. We recorded the innermost (most anterior) and outermost (most posterior) locations where each region type was found. We computed the relative depth of each marking based on the most innermost and outermost sclera. Because of natural variations in optic nerve and posterior pole anatomy, the coronal sections were not always perfectly perpendicular to the scleral canal. We accounted for this by adjusting the calculations of the relative depth of a location by using the local most anterior and most posterior sections. These relative depth locations of the sclera regions were then compared between animals within and across species.
Segmentation
An automated segmentation method was developed to study the radial and circumferential regions in more detail. The segmentation used the anisotropy and circular mean to isolate the radial and circumferential fibers from all others. The neighborhood and threshold used for the results presented in the manuscript were identified in a preliminary sensitivity study. To do this, each pixel was assigned an anisotropy and circular mean value based on the orientation values of its “neighborhood” of 51 × 51 pixels. The segmentation then assessed these values to determine if a pixel was radial, circumferential, or neither. The segmentation first separated the highly aligned pixels, including radials and circumferentials, from the less aligned pixels. The highly aligned pixels were identified using an anisotropy threshold. This threshold varied between 0.8 and 0.9, depending on the species. The segmentation then classified the highly aligned pixels based on the circular mean. Guided again by the fiber orientation quantification, angular thresholds were set for the radial and circumferential regions. Based on the range of −90° to 90° that the circular mean values fell in, values within 30° of the perfect radial at 0° (angles between −30° and 30°) were classified as radial. Orientations within 30° of the perfect circumferential at −90° or 90° (angles smaller than −60°, or larger than 60°) were classified as circumferential.
Results
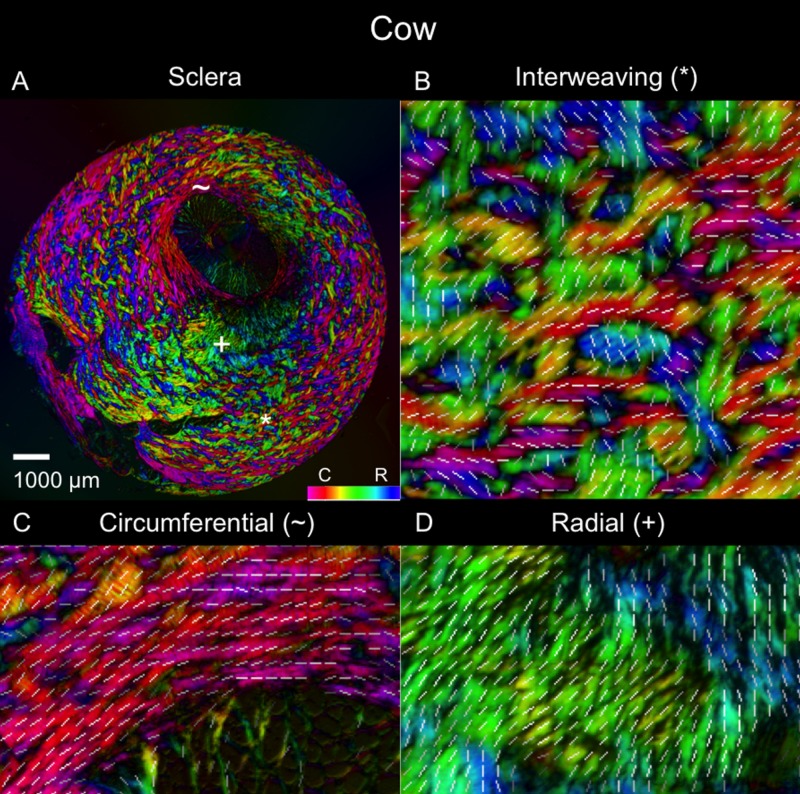
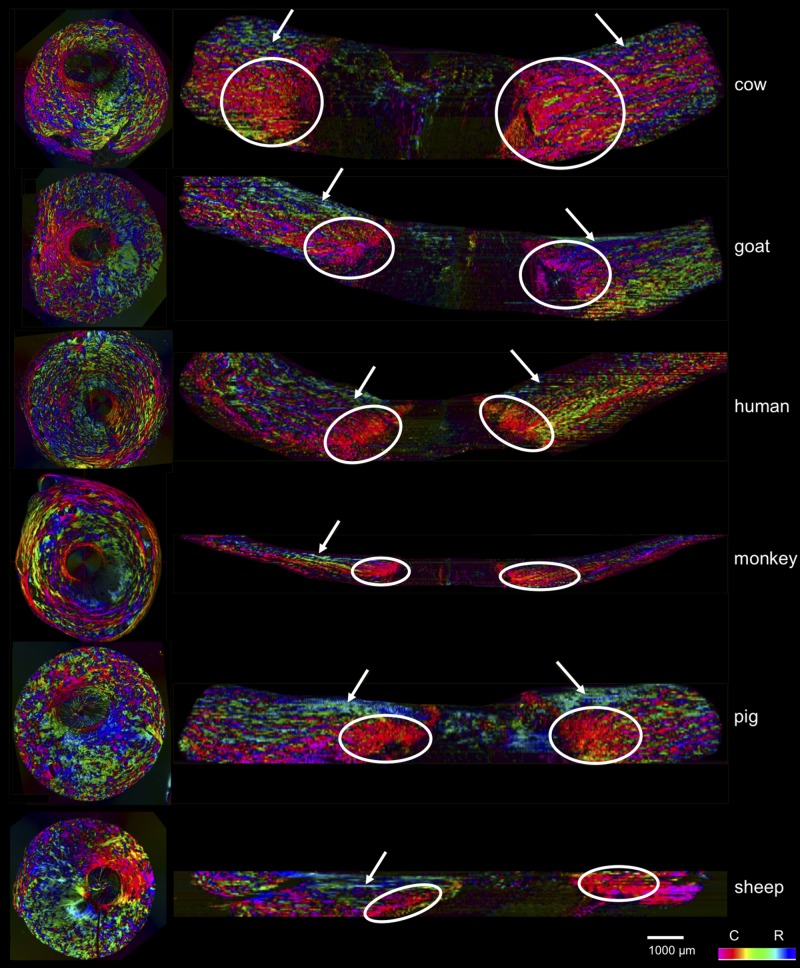
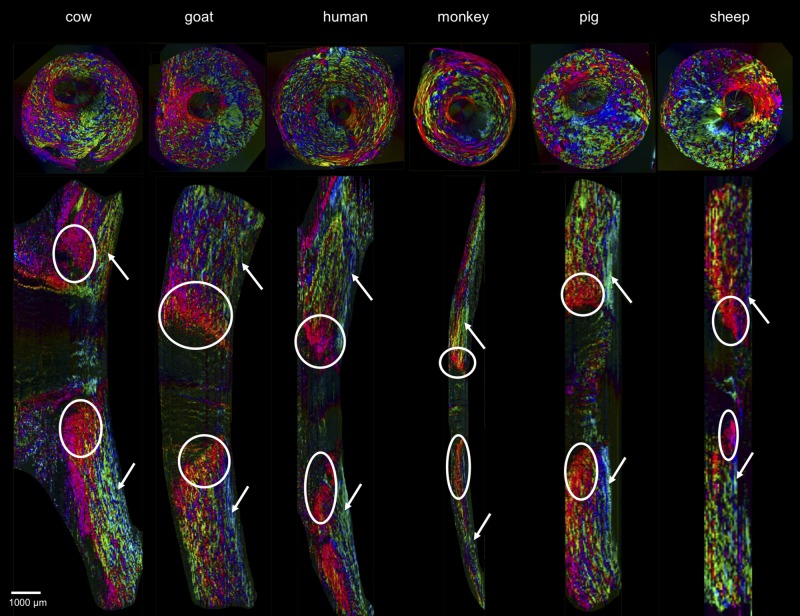
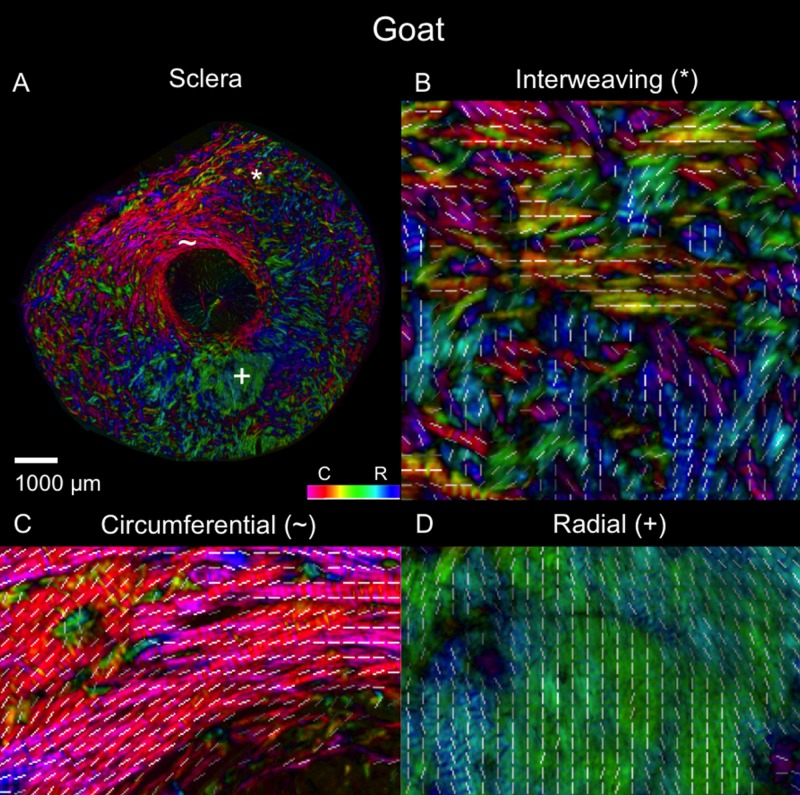
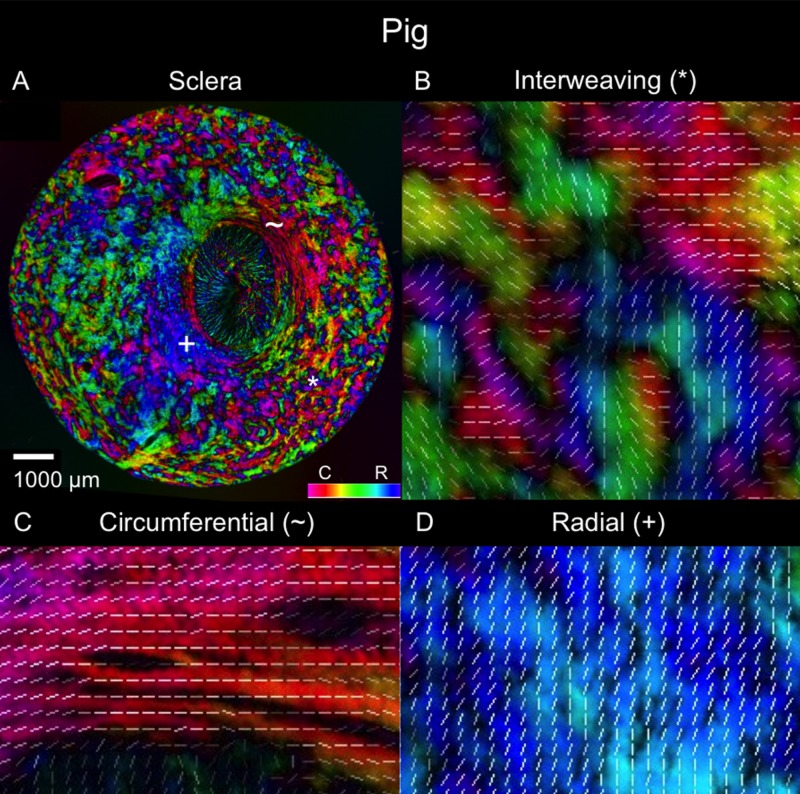
Example polar orientation maps from each species are shown in Figures 4 through 9. We found sections demonstrating radial, circumferential, and interweaving regions in all eyes. As shown in Figures 10 and 11, the location of these regions, relative to the canal, were consistent across eyes and species. Regions of circumferential fibers were directly adjacent to the canal and extended outward into the peripapillary sclera, sometimes substantially. In contrast, the radials started near the canal and extended nearly all the way out to the edge of the section. There was always a narrow ring of circumferential fibers between the edge of the canal and the radials fibers.
Figure 4.
Polar orientation of fibers in the cow eye. Shown are (A) an image of the whole section's energy-weighted polar orientation map and (B–D) close-ups of three regions: (B) interweaving fibers that form a basket-weave pattern (asterisk); (C) fibers oriented circumferentially (tilde symbol); and (D) fibers oriented radially from the canal (plus symbol). The colors represent the polar orientation or direction at each pixel, with the intensity scaled by “energy”, as described in the main text. In addition, to simplify discerning fiber orientation, we overlaid short white line segments representing the mean orientation over a small square region with side length equal to the length of the line.
Figure 9.
Polar orientation of fibers in the pig eye. The panels show the energy-weighted polar orientations in (A) the whole section and (B–D) close-ups of three regions, following the same organization as in Figure 4.
Figure 10.
Coronal and axial images of polar orientation from all six species. The coronal plane images are of actual sections showing in-plane orientation, whereas the axial images are virtual, based on the registered coronal stacks, showing the orientations from the coronal sections. The circles indicate areas of circumferential fibers, whereas the solid arrows point to areas of radial fibers. In all the species, the coronal sections and the virtual longitudinal sections show clearly the three fiber families.
Figure 11.
Coronal and sagittal images of polar orientation, of the same six eyes and in similar organization as Figure 10. The difference is that the longitudinal sections herein are longitudinal. As in Figure 10, the coronal images are of actual sections showing in-plane orientation, whereas the sagittal images are virtual, based on the registered coronal stacks and showing orientations from the coronal sections. The circles indicate areas of circumferential fibers while the solid arrows point to areas of radial fibers. Again, in all the species, all three fiber types are discernible in both planes.
Figure 5.
Polar orientation of fibers in the goat eye. The panels show the energy-weighted polar orientations in (A) the whole section and (B–D) close-ups of three regions, following the same organization as in Figure 4.
Figure 6.
Polar orientation of fibers in the human eye. The panels show the energy-weighted polar orientations in (A) the whole section and (B–D) close-ups of three regions, following the same organization as in Figure 4.
Figure 7.
Polar orientation of fibers in the monkey eye. The panels show the energy-weighted polar orientations in (A) the whole section and (B–D) close-ups of three regions, following the same organization as in Figure 4.
Figure 8.
Polar orientation of fibers in the pig eye. The panels show the energy-weighted polar orientations in (A) the whole section and (B–D) close-ups of three regions, following the same organization as in Figure 4.
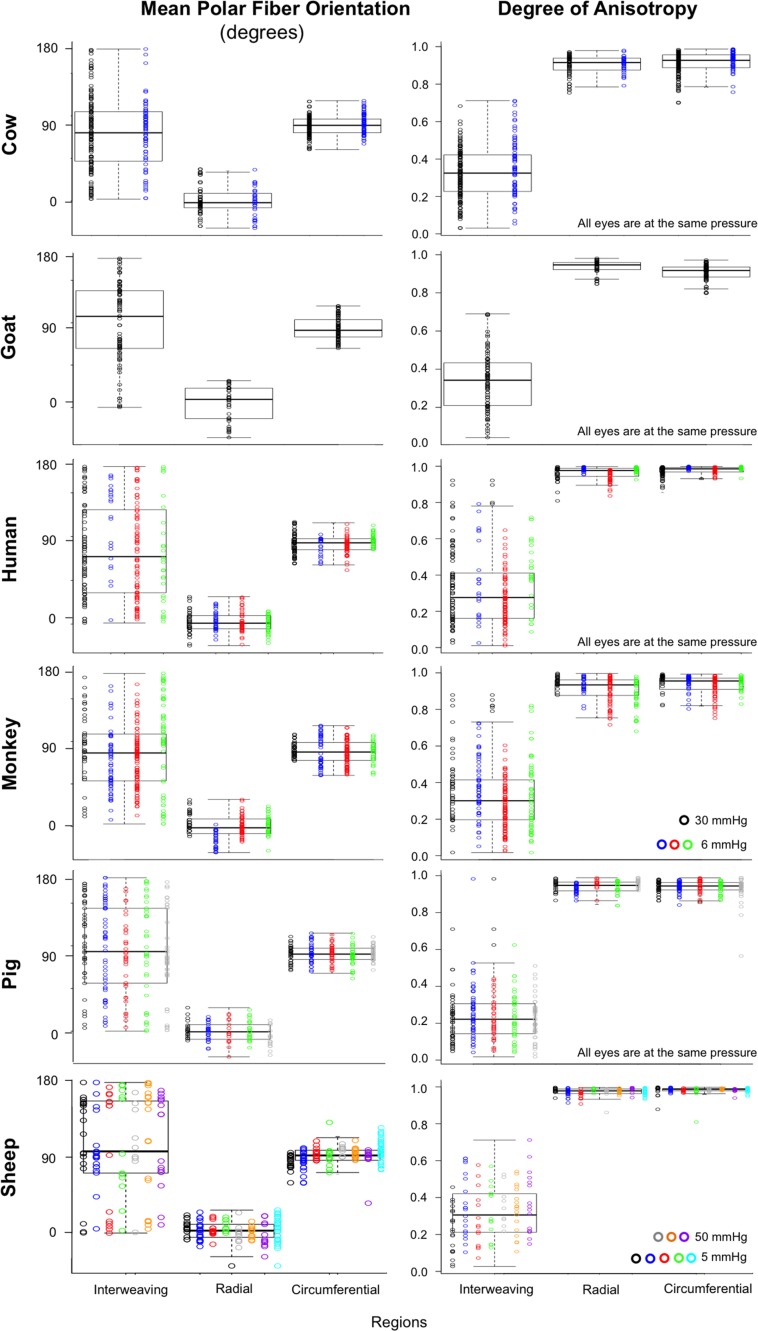
Regional angle and anisotropy plots for all manually marked regions, for all the eyes, are shown in Figure 12. Regardless of species, radial regions consistently had orientation values clustered at 0°, circumferential regions had orientation values clustered at 90°, and interweaving regions had orientation values that were highly dispersed, displaying no preferential alignment. Using LME models, we found that manually classified region type was significantly associated with mean polar angle (P < 0.0001). Regarding anisotropy measures, radial and circumferential regions had anisotropies between 0.75 and 1, with an across-species median of 0.95, indicating highly aligned fibers. Anisotropy in interweaving regions was typically under 0.7, with a median of 0.28, indicating fibers that were not well aligned. When tested with LME models, manually classified region type was also significantly associated with anisotropy (P < 0.0001).
Figure 12.
Box plots of the polar fiber orientations and degree of anisotropy by region type in each of the six species. Data from each subject within a species is plotted in a different color. Fixation IOPs are noted on the bottom right of the anisotropy plots. Consistently, across eyes and species, regions of radial and circumferential fibers showed high anisotropy, differing only in orientation. Conversely, regions of interweaving fibers show low anisotropy. Anisotropy was plotted from 0 to 1, where 0 is perfectly isotropic and 1 is perfectly anisotropic.
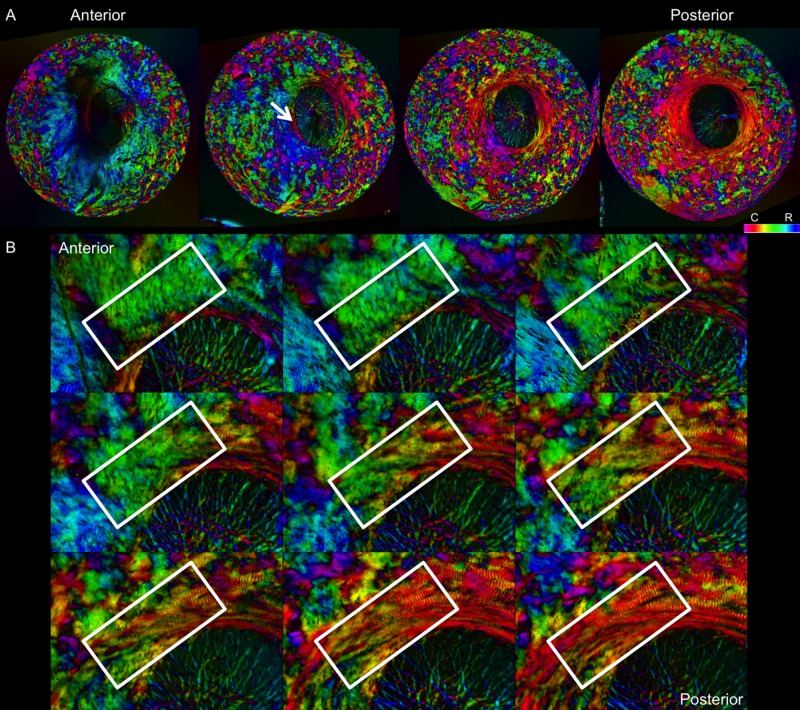
Visual inspection of the image stacks revealed recurring regional depth patterns in all eyes, as illustrated in Figure 13. Regions of radial fibers were most prevalent in the innermost part of the eye, the most anterior sections. Circumferential fibers were present throughout but were most prevalent in the outermost, posterior regions. Interweaving fibers were found throughout.
Figure 13.
Sequence of images of polar orientation in pig peripapillary sclera to illustrate the depth dependence of fiber orientations. (A) Four images of evenly spaced sections through depth, from anterior/innermost to posterior/outermost. Radial fibers are clearly discernible in the anterior-most section, especially from 5 to 10 o'clock. With increasing depth, radial fibers progressively give way to circumferential fibers, initially in the region immediately adjacent to the canal, pointed out by the white arrow. A wide ring of circumferential fibers is discernible in the deeper sclera, surrounded by regions of interweaving fibers of low anisotropy. (B) Images of a subset of consecutive sections through depth to visualize the transition from radial to circumferential fibers. The white boxes highlight the same region in each image. These areas of transition occurred most often between radial and circumferential regions.
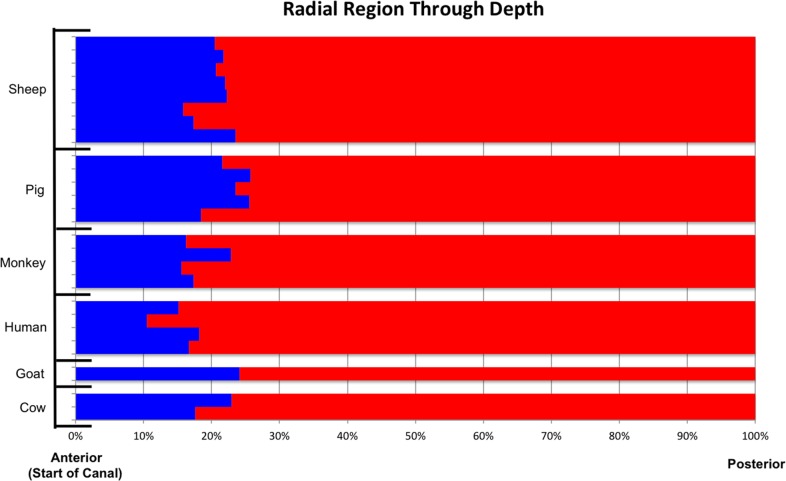
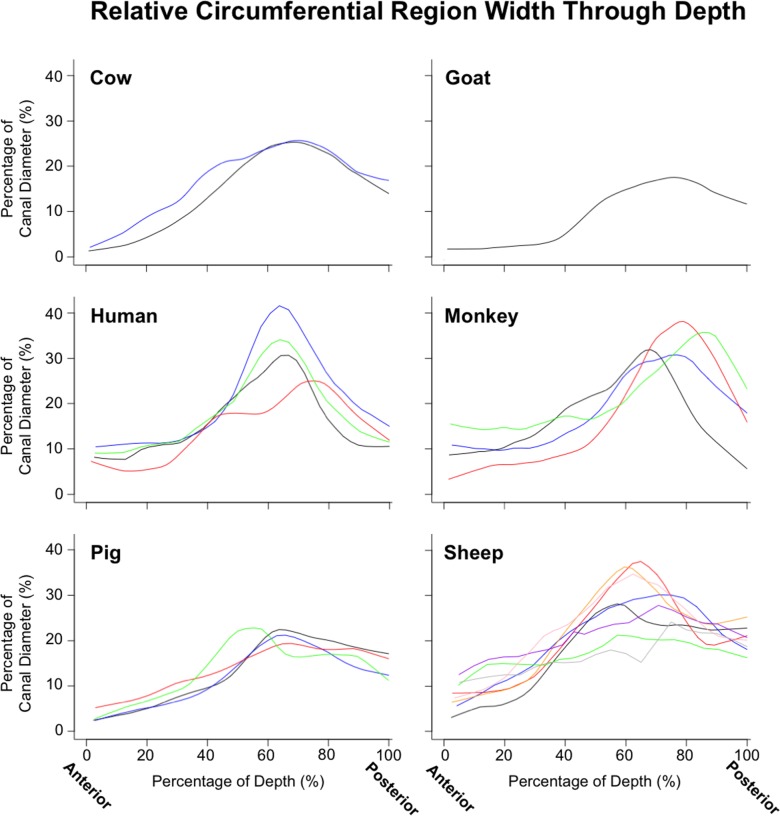
Quantitative depth analysis of the regions segmented into radial and circumferential fibers again demonstrated consistent patterns through the depth (Fig. 14). Regions of radial fibers were always found in the most anterior sclera, spanning between 10.5% and 25.7% of the sclera thickness. The circumferential regions were always present, although they varied substantially in width between eyes and species (Fig. 15). In all subjects, the circumferential region's width, relative to the diameter of the canal, increased steadily from anterior to posterior until approximately 60%–80% of the way through the sclera, where it reached its maximum, decreasing again toward the most posterior sclera.
Figure 14.
Occurrence of radial region through depth, from anterior opening of the canal to posterior outermost sclera, across all animals from all species. Each row corresponds to one eye. The x-axis represents the percent depth, determined from the section number, normalized to the total number of sections in the eye across the sclera thickness. Blue indicates that the percentage of radial pixels, of all tissue pixels, as determined by the segmentation, was greater than 15%, within the section. Red indicates that no substantial region of radial fibers was found. The radial region was consistently found in the most anterior portions of the sclera, spanning between 10.5% and 25.7% of the sclera thickness.
Figure 15.
Lowess plots illustrating the depth variations of the width of the circumferential region. To simplify comparison across eyes of different sizes, the width was scaled to the canal diameter of the eye at the anterior lamina insertion. Each panel shows the measurements for a given species, with each line representing a different eye. Note the consistent patterns of ring width through depth across animals and species. Ring width sometimes varied around the canal. The values reported are average ring widths based on 16 evenly distributed measurements (every 22.5°), adjusted to account for gaps in the ring and tilt in the sections.
Discussion
The purpose of this study was to visualize and quantify the collagen architecture in the posterior pole of several large mammals and to test the hypothesis that three consistent fiber arrangement types, circumferential, radial, and interweaving, appear in all of the species studied. Using PLM, we analyzed 1327 sections from 4 human, 4 monkey, 2 cow, 1 goat, 5 pig, and 8 sheep eyes and assessed the mean fiber orientation and anisotropy of each. To the best of our knowledge, this is the first systematic quantification of scleral collagen orientation and anisotropy in multiple species. Two main results arise from this work: (1) radial, circumferential, and interweaving fibers were found in the posterior pole of every eye from every species; and (2) the radial, circumferential, and interweaving regions had consistent patterns through depth across species. Both of these will be discussed in more detail below.
Radial, Circumferential, and Interweaving Fibers Were Found in the Posterior Pole of Every Eye from Every Species
The radial fibers were found in the most anterior sections and often extended from near the edge of the canal out to the edge of the section. The circumferential fibers bordered the canal, forming a ring around it, through the sclera thickness. The interweaving fibers were found over the entire depth of the sclera.
Radial, Circumferential, and Interweaving Fibers Had Consistent Patterns Through Depth Across Species
Across the six species we studied, the radial fiber regions were present, on average in the 19.8% anterior of the sclera, varying between 10.5%, and as much as 25.7%. Circumferential fibers formed narrow regions between the canal and the radial fibers in the most anterior sclera, widening in deeper sclera. They were widest between 60% and 80% of the sclera depth. The interweaving fibers were found throughout the sclera depth.
The presence and consistent distribution of the radial, circumferential, and interweaving regions in every eye studied suggests that they are primary organizational components of the posterior pole of large mammal eyes. As such, these fibers likely play a role in determining the biomechanics of the posterior sclera and ONH. Future studies should identify the roles of the radial, circumferential, and interweaving regions and their influence on the overall biomechanics, especially given that the various species have different vision, eye physiology, and susceptibility to disease.
A similar consistent pattern of collagen organization has been shown for the cornea, with more interwoven fibers in the anterior stroma (exterior), than in the posterior (interior).4,14,15 The overlapping of the radial and circumferential regions in the anterior part of the sclera suggests that, while the radial and circumferential regions are distinguishable from one another, they may also be structurally and functionally linked. Within these sections of overlap, there are often areas where the radial and circumferential regions are right next to each other (Fig. 13). It seems plausible that some collagen bundles might transition between radial and circumferential regions.16 Further studies should explore this possibility, as it could have major implications in how these two regions function biomechanically, especially in the meso- and macroscale transmission of forces.
There have been limited data published about the radial region, but our results support what was found in earlier studies. In our previous study of sheep, we characterized the radial region and found that it is anterior to the circumferential region, extends from the canal boundary to section edge, and comprises 60–180 μm of the depth.12 The radial region has also been reported in humans. Pijanka and colleagues17 described detecting fibers primarily oriented radially in the innermost (anterior) one-third of the peripapillary sclera. More specifically, the radial fibers were found in the anterior 150 μm of the posterior sclera. Although the function of the radial region is unknown, potential functions could include providing support for the vasculature in the choroid, providing support for the nerves coming into the ONH from the fovea, ensuring that they are not subject to large longitudinal deformations, and providing support for the lamina cribrosa, preventing large bending deformations of the ONH.
The circumferential region that we observed was also reported in several studies on the posterior scleral architecture. Most often referred to as a circumferential ring, these fibers are highly aligned and oriented parallel to the scleral canal.18 Several techniques have been used to study this ring. Inverse modeling, as done by Grytz and colleagues,19 predicted the existence of the circumferential region. Circumferential fibers have also been reported using WAXS,17 SALS,6 second harmonic imaging,10 scanning electron microscopy,20–22 and immunofluorescence,23–25 and in our own study using PLM.12 It is generally believed that the circumferential region provides structural support to the ONH.26–28
The interweaving region has also been studied using inverse modeling and SALS. Through their use of inverse modeling, Grytz and colleagues28 predicted that the collagen within the sclera is mostly randomly orientated. Using SALS, Girard and colleagues6 did not find a preferential orientation for the fibers in wide regions of the sclera. At this point, it is important to consider the nomenclature. Several previous studies referred to this region as being “random” and “isotropic,” while herein we have instead opted to refer to them as “interweaving.” PLM's higher spatial resolution compared with SALS enabled us to both quantify the low degree of anisotropy in these regions and visualize the interweaving of the fiber bundles. Quantitatively, the only established characteristic of the interweaving region is decreased anisotropy. At this time, it is not understood how the interweaving region is organized, but given the apparent organization of the radial and circumferential regions, it seems unlikely that the region would be truly “random.” It seems instead that it simply remains beyond our understanding. As with the other regions, further research is needed to understand its structure and role in globe biomechanics.
This study was able to build on the success of the previous work analyzing radial, circumferential, and interweaving fibers through use of PLM. PLM has high spatial and angular sensitivity and resolution over a wide field of view and over a wide range of connective tissue densities, making pixel-by-pixel calculation of fiber orientation possible throughout the sclera.11 PLM also works well in thin sections.11 This is in contrast with WAXS18,29 and SALS6 that can analyze thick sclera samples but may suffer from artifacts when measuring thin sections.30 The ability of PLM to quantify thin sections allowed for a higher depth resolution when analyzing stacks compared with studies published using scattering techniques. In addition, PLM was well suited for our goals in this work because it is robust to imaging systems and magnifications.11 This allowed us to scale the magnification to best suit the sections from a given eye and to use images collected on several systems, without adversely affecting the analysis. PLM, like all techniques based on sectioning, is subject to section deformations, which may be smaller when the sections are thicker. Another advantage of PLM is that it did not require tissue labels,31,32 dehydrating,33 or flattening5,34 the samples, which may introduce artifacts.
There are also several limitations of this study. First, our analysis of fiber orientations is limited to two dimensions due to the histologic sectioning and the imaging technique. This means that the collagen architecture reported in this work is a simplification of what is actually an even more complex three-dimensional (3D) structure. This simplification is not unique to PLM and is actually a common concern with fiber-analysis methods, such as WAXS and SALS. Although we have recently demonstrated an extension of PLM that allows measuring the full 3D orientation of the fibers based on PLM,35 we have not yet applied the methods to this dataset. Our goal in this study was to determine the existence of regions of radial and circumferential fibers, which could be achieved with the more traditional PLM.
Another consideration when interpreting the results presented is that the sections had a thickness of 16–30 μm. This is thick enough that within each pixel, there are probably multiple overlapping fibers, perhaps with different orientations. The PLM implementation used in this work provides a measure of the dominant fiber orientation in each pixel. The images analyzed were obtained from tissues that were histologically processed. This processing may have introduced artifacts, such as tissue shrinkage or distortion, from the fixation and sectioning. However, we have shown that the distortions and shrinkage effects due to this fixation and sectioning are minimal.36 The eyes used in this study were not all fixed at the same IOP. These changes in IOP could potentially affect fiber crimp and thus orientation and anisotropy.37–39 This is also an issue for studies using WAXS and SALS.32 Comparing eyes at different IOPs, we observed that the microscale uncrimping at elevated pressure reduced anisotropy without affecting the mean fiber orientation (Fig. 12). Interestingly, the effects of IOP on anisotropy were substantial in the circumferential fibers and essentially null in the radial ones (Supplementary Materials).
Calculation of the polar angles used to identify the radial and circumferential fibers was done based on manual identification of the center of the canal. This poses a number of potential problems. First, the markings were made based on visual recognition of the borders of the canal and the surrounding anatomy. Although someone experienced in identifying the structures within the ONH did the marking, it is subjective. Second, the center of the canal was marked based only on its two-dimensional section; it did not incorporate the fact that the eye is a 3D structure. Furthermore, in cases where the canal is not circular, the fibers may not be oriented radially with respect to the center of the canal but instead to the canal edge.
Our analysis was based on the assumption that the measurements are only from collagen. The presence of other birefringent components could, however, introduce artifacts. Elsewhere, we have shown that our PLM signal is in good agreement with other measurements of collagen, such as those from autofluorescence.12 PLM also cannot distinguish elastin fibers, which can be visualized through nonlinear microscopy.40
We recognize that the discretization of fiber populations into radial, circumferential, and interweaving is a simplification. It is essential to continue the work and refine the analysis to identify other aspects of the peripapillary sclera fiber organization that may have been lost in this analysis. For example, we have proposed that in the peripapillary sclera are groups of fibers that are tangential to the scleral canal, potentially appearing as circumferential near the canal and as radial farther away.16
We have, to the best of our knowledge, presented the first systematic quantification of collagen fiber architecture and assessment of patterns of organization in the posterior pole of multiple large mammal species. We have confirmed that in human, monkey, cow, goat, sheep, and pig, the peripapillary sclera and posterior sclera have three organizational components: circumferential fibers, radial fibers, and interweaving fibers. These different fiber types appear in distinct regions with respect to the canal and anterior-posterior position. Future studies should identify the roles of the radial, circumferential, and interweaving regions and their influence on the overall biomechanics, especially given that the various species have different vision, eye physiology, and susceptibility to disease. This would benefit from determining the location of the lamina cribrosa relative to these regions. Future studies should also determine if the radial fibers are present in consistent locations in nasal-temporal and inferior-superior directions as well as through depth and if they are present in mice, rats, guinea pigs, and other small mammals often used in studies of the posterior pole.
Supplementary Material
Acknowledgments
Supported by National Institutes of Health R01-EY023966, R01-EY025011, and P30-EY008098, Eye and Ear Foundation (Pittsburgh, PA, USA), and Research to Prevent Blindness (support to UPMC Department of Ophthalmology).
Disclosure: A. Gogola, None; N.-J. Jan, None; K.L. Lathrop, None; I.A. Sigal, None
References
- 1.Coudrillier B, Tian J, Alexander S, Myers KM, Quigley HA, Nguyen TD. Biomechanics of the human posterior sclera: age- and glaucoma-related changes measured using inflation testing. Invest Ophthalmol Vis Sci. 2012;53:1714–1728. doi: 10.1167/iovs.11-8009. [DOI] [PMC free article] [PubMed] [Google Scholar]
- 2.Ethier CR, Johnson M, Ruberti J. Ocular biomechanics and biotransport. Annu Rev Biomed Eng. 2004;6:249–273. doi: 10.1146/annurev.bioeng.6.040803.140055. [DOI] [PubMed] [Google Scholar]
- 3.Coudrillier B, Boote C, Quigley HA, Nguyen TD. Scleral anisotropy and its effects on the mechanical response of the optic nerve head. Biomech Model Mechanobiol. 2013;12:941–963. doi: 10.1007/s10237-012-0455-y. [DOI] [PMC free article] [PubMed] [Google Scholar]
- 4.Meek KM, Boote C. The use of X-ray scattering techniques to quantify the orientation and distribution of collagen in the corneal stroma. Prog Retin Eye Res. 2009;28:369–392. doi: 10.1016/j.preteyeres.2009.06.005. [DOI] [PubMed] [Google Scholar]
- 5.Pijanka JK, Abass A, Sorensen T, Elsheikh A, Boote C. A wide-angle X-ray fibre diffraction method for quantifying collagen orientation across large tissue areas: application to the human eyeball coat. J Appl Crystallogr. 2013;46:1481–1489. [Google Scholar]
- 6.Girard MJ, Dahlmann-Noor A, Rayapureddi S, et al. Quantitative mapping of scleral fiber orientation in normal rat eyes. Invest Ophthalmol Vis Sci. 2011;52:9684–9693. doi: 10.1167/iovs.11-7894. [DOI] [PubMed] [Google Scholar]
- 7.Yan D, McPheeters S, Johnson G, Utzinger U, Vande Geest JP. Microstructural differences in the human posterior sclera as a function of age and race. Invest Ophthalmol Vis Sci. 2011;52:821–829. doi: 10.1167/iovs.09-4651. [DOI] [PMC free article] [PubMed] [Google Scholar]
- 8.Ho LC, Sigal IA, Jan N-J, et al. Magic angle-enhanced MRI of fibrous microstructures in sclera and cornea with and without intraocular pressure loading. Invest Ophthalmol Vis Sci. 2014;2:522–533. doi: 10.1167/iovs.14-14561. [DOI] [PMC free article] [PubMed] [Google Scholar]
- 9.Ho LC, Sigal IA, Jan N-J, et al. Non-invasive MRI assessments of tissue microstructures and macromolecules in the eye upon biomechanical or biochemical modulation. Sci Rep. 2016;6:32080. doi: 10.1038/srep32080. [DOI] [PMC free article] [PubMed] [Google Scholar]
- 10.Winkler M, Jester B, Nien-Shy C, et al. High resolution three-dimensional reconstruction of the collagenous matrix of the human optic nerve head. Brain Res Bull. 2010;81:339–348. doi: 10.1016/j.brainresbull.2009.06.001. [DOI] [PMC free article] [PubMed] [Google Scholar]
- 11.Jan N-J, Grimm JL, Tran H, et al. Polarization microscopy for characterizing fiber orientation of ocular tissues. Biomed Opt Express. 2015;6:4705–4718. doi: 10.1364/BOE.6.004705. [DOI] [PMC free article] [PubMed] [Google Scholar]
- 12.Jan N-J, Lathrop K, Sigal IA. Collagen architecture of the posterior pole: high-resolution wide field of view visualization and analysis using polarized light microscopy. Invest Ophthalmol Vis Sci. 2017;58:735–744. doi: 10.1167/iovs.16-20772. [DOI] [PMC free article] [PubMed] [Google Scholar]
- 13.Jan NJ, Gomez C, Moed S, et al. Microstructural crimp of the lamina cribrosa and peripapillary sclera collagen fibers. Invest Ophthalmol Vis Sci. 2017;58:3378–3388. doi: 10.1167/iovs.17-21811. [DOI] [PMC free article] [PubMed] [Google Scholar]
- 14.Abahussin M, Hayes S, Knox Cartwright NE, et al. 3D collagen orientation study of the human cornea using x-ray diffraction and femtosecond laser technology. Invest Ophthalmol Vis Sci. 2009;50:5159–5164. doi: 10.1167/iovs.09-3669. [DOI] [PubMed] [Google Scholar]
- 15.Winkler M, Shoa G, Xie Y, et al. Three-dimensional distribution of transverse collagen fibers in the anterior human corneal stroma. Invest Ophthalmol Vis Sci. 2013;54:7293–7301. doi: 10.1167/iovs.13-13150. [DOI] [PMC free article] [PubMed] [Google Scholar]
- 16.Voorhees A, Jan N, Hua Y, Yang B, Sigal I. Peripapillary sclera architecture revisited: a tangential fiber model and its biomechanical implications. Acta Biomater. In press. [DOI] [PMC free article] [PubMed]
- 17.Pijanka JK, Spang MT, Sorensen T, et al. Depth-dependent changes in collagen organization in the human peripapillary sclera. PLoS One. 2015;10:e0118648. doi: 10.1371/journal.pone.0118648. [DOI] [PMC free article] [PubMed] [Google Scholar]
- 18.Pijanka JK, Coudrillier B, Ziegler K, et al. Quantitative mapping of collagen fiber orientation in non-glaucoma and glaucoma posterior human sclerae. Invest Ophthalmol Vis Sci. 2012;53:5258–5270. doi: 10.1167/iovs.12-9705. [DOI] [PMC free article] [PubMed] [Google Scholar]
- 19.Grytz R, Meschke G. Constitutive modeling of crimped collagen fibrils in soft tissues. J Mech Behav Biomed Mater. 2009;2:522–533. doi: 10.1016/j.jmbbm.2008.12.009. [DOI] [PubMed] [Google Scholar]
- 20.Thale A, Tillmann B, Rochels R. SEM studies of the collagen architecture of the human lamina cribrosa: normal and pathological findings. Ophthalmologica. 1996;210:142–147. doi: 10.1159/000310694. [DOI] [PubMed] [Google Scholar]
- 21.Thale A, Tillmann B, Rochels R. Scanning electron-microscopic studies of the collagen architecture of the human sclera--normal and pathological findings. Ophthalmologica. 1996;210:137–141. doi: 10.1159/000310693. [DOI] [PubMed] [Google Scholar]
- 22.Thale A, Tillmann B. The collagen architecture of the sclera—SEM and immunohistochemical studies. Ann Anat. 1993;175:215–220. doi: 10.1016/s0940-9602(11)80004-x. [DOI] [PubMed] [Google Scholar]
- 23.Hernandez MR, Luo XX, Igoe F, Neufeld AH. Extracellular matrix of the human lamina cribrosa. Am J Ophthalmol. 1987;104:567–576. doi: 10.1016/0002-9394(87)90165-6. [DOI] [PubMed] [Google Scholar]
- 24.Hernandez MR, Luo XX, Andrzejewska W, Neufeld AH. Age-related changes in the extracellular matrix of the human optic nerve head. Am J Ophthalmol. 1989;107:476–484. doi: 10.1016/0002-9394(89)90491-1. [DOI] [PubMed] [Google Scholar]
- 25.Morrison JC, Jerdan JA, Dorman ME, Quigley HA. Structural proteins of the neonatal and adult lamina cribrosa. Arch Ophthalmol. 1989;107:1220–1224. doi: 10.1001/archopht.1989.01070020286040. [DOI] [PubMed] [Google Scholar]
- 26.Coudrillier B, Geraldes DM, Vo NT, et al. Phase-contrast micro-computed tomography measurements of the intraocular pressure-induced deformation of the porcine lamina cribrosa. IEEE Trans Med Imaging. 2016;35:988–999. doi: 10.1109/TMI.2015.2504440. [DOI] [PMC free article] [PubMed] [Google Scholar]
- 27.Girard MJ, Downs JC, Bottlang M, Burgoyne CF, Suh J-KF. Peripapillary and posterior scleral mechanics—part II: experimental and inverse finite element characterization. J Biomech Eng. 2009;131:051012. doi: 10.1115/1.3113683. [DOI] [PMC free article] [PubMed] [Google Scholar]
- 28.Grytz R, Meschke G. A computational remodeling approach to predict the physiological architecture of the collagen fibril network in corneo-scleral shells. Biomech Model Mechanobiol. 2010;9:225–235. doi: 10.1007/s10237-009-0173-2. [DOI] [PubMed] [Google Scholar]
- 29.Coudrillier B, Pijanka J, Jefferys J, et al. Collagen structure and mechanical properties of the human sclera: analysis for the effects of age. J Biomech Eng. 2015;137:041006. doi: 10.1115/1.4029430. [DOI] [PMC free article] [PubMed] [Google Scholar]
- 30.Pierlot CM, Lee JM, Amini R, Sacks MS, Wells SM. Pregnancy-induced remodeling of collagen architecture and content in the mitral valve. Ann Biomed Eng. 2014;42:2058–2071. doi: 10.1007/s10439-014-1077-6. [DOI] [PubMed] [Google Scholar]
- 31.Hernandez MR, Luo XX, Igoe F, Neufeld AH. Extracellular matrix of the human lamina cribrosa. Am J Ophthalmol. 1987;104:567–576. doi: 10.1016/0002-9394(87)90165-6. [DOI] [PubMed] [Google Scholar]
- 32.Hernandez MR, Andrzejewska WM, Neufeld AH. Changes in the extracellular matrix of the human optic nerve head in primary open-angle glaucoma. Am J Ophthalmol. 1990;109:180–188. doi: 10.1016/s0002-9394(14)75984-7. [DOI] [PubMed] [Google Scholar]
- 33.Yang H, Downs JC, Bellezza A, Thompson H, Burgoyne CF. 3-D histomorphometry of the normal and early glaucomatous monkey optic nerve head: prelaminar neural tissues and cupping. Invest Ophthalmol Vis Sci. 2007;48:5068–5084. doi: 10.1167/iovs.07-0790. [DOI] [PubMed] [Google Scholar]
- 34.Pijanka JK, Coudrillier B, Ziegler K, et al. Quantitative mapping of collagen fiber orientation in non-glaucoma and glaucoma posterior human sclerae. Invest Ophthalmol Vis Sci. 2012;53:5258–5270. doi: 10.1167/iovs.12-9705. [DOI] [PMC free article] [PubMed] [Google Scholar]
- 35.Yang B, Jan N-J, Brazile B, Voorhees A, Lathrop KL, Sigal IA. Polarized light microscopy for 3-dimensional mapping of collagen fiber architecture in ocular tissues. J Biophotonics. 2018;11:e201700356. doi: 10.1002/jbio.201700356. [DOI] [PMC free article] [PubMed] [Google Scholar]
- 36.Tran H, Jan N-J, Hu D, et al. Formalin fixation and cryosectioning cause only minimal changes in shape or size of ocular tissues. Sci Rep. 2017;7:12065. doi: 10.1038/s41598-017-12006-1. [DOI] [PMC free article] [PubMed] [Google Scholar]
- 37.Gogola A, Jan N-J, Brazile B, et al. Spatial patterns and age-related changes of the collagen crimp in the human cornea and sclera. Invest Ophthalmol Vis Sci. 2018;59:2987–2998. doi: 10.1167/iovs.17-23474. [DOI] [PMC free article] [PubMed] [Google Scholar]
- 38.Jan N-J, Brazile BL, Hu D, et al. Crimp around the globe; patterns of collagen crimp across the corneoscleral shell. Exp Eye Res. 2018;172:159–170. doi: 10.1016/j.exer.2018.04.003. [DOI] [PMC free article] [PubMed] [Google Scholar]
- 39.Jan N-J, Sigal IA. Collagen fiber recruitment: a microstructural basis for the nonlinear response of the posterior pole of the eye to increases in intraocular pressure. Acta Biomater. 2018;72:295–305. doi: 10.1016/j.actbio.2018.03.026. [DOI] [PMC free article] [PubMed] [Google Scholar]
- 40.Yu C-H, Tai S-P, Kung C-T, et al. In vivo and ex vivo imaging of intra-tissue elastic fibers using third-harmonic-generation microscopy. Opt Express. 2007;15:11167–11177. doi: 10.1364/oe.15.011167. [DOI] [PubMed] [Google Scholar]
Associated Data
This section collects any data citations, data availability statements, or supplementary materials included in this article.


