Abstract
Multiple myeloma (MM) is a debilitating neoplasm of terminally differentiated plasma B cells that resulted in over 13,000 deaths in 2017 alone. Combination therapies involving melphalan, a small-molecule DNA alkylating agent, are commonly prescribed to patients with relapsed or refractory MM, necessitating the stratification of responding patients to minimize toxicities and improve quality of life. Here, we evaluated the use of 3,4-dihydroxy-6-18F-fluoro-l-phenylalanine (18F-FDOPA), a clinically available PET radiotracer with specificity to the L-type amino acid transporter 1 (LAT1), which also mediates melphalan uptake, for imaging melphalan therapy response in a preclinical immunocompetent model of MM. Methods: C57BL/KaLwRij mice were implanted subcutaneously with unilateral murine green fluorescent protein–expressing 5TGM1 tumors and divided into 3 independent groups: untreated, treated beginning week 2 after tumor implantation, and treated beginning week 3 after tumor implantation. The untreated and week 2 treated groups were imaged with preclinical MRI and dynamic 18F-FDG and 18F-FDOPA PET/CT at week 4 on separate, contiguous days, whereas the week 3 treated group was longitudinally imaged weekly for 3 wk. Metabolic tumor volume, total lesion avidity, SUVmax, and total uptake were calculated for both tracers. Immunohistochemistry was performed on representative tissue from all groups for LAT1 and glucose transporter 1 (GLUT1) expression. Results: Melphalan therapy induced a statistically significant reduction in lesion avidity and uptake for both 18F-FDG and 18F-FDOPA. There was no visible effect on GLUT1 expression, but LAT1 density increased in the week 2 treated group. Longitudinal imaging of the week 3 treated group showed variable changes in 18F-FDG and 18F-FDOPA uptake, with an increase in 18F-FDOPA lesion avidity in the second week relative to baseline. LAT1 and GLUT1 surface density in the untreated and week 3 treated groups were qualitatively similar. Conclusion: 18F-FDOPA PET/CT complemented 18F-FDG PET/CT in imaging melphalan therapy response in preclinical extramedullary MM. 18F-FDOPA uptake was linked to LAT1 expression and melphalan response, with longitudinal imaging suggesting stabilization of LAT1 levels and melphalan tumor cytotoxicity. Future work will explore additional MM cell lines with heterogeneous LAT1 expression and response to melphalan therapy.
Keywords: 18F-FDOPA PET, 18F-FDG PET, melphalan therapy response, multiple myeloma
Multiple myeloma (MM) is a cancer of terminally differentiated plasma B cells that originates in the hematopoietic bone marrow and accounts for 15%–20% of all hematologic malignancies (1,2). In the last decade, the availability of autologous stem cell transplantation and combination therapies consisting of immunomodulatory drugs, proteasome inhibitors, and other chemotherapeutics has improved median 5-y survival from 34.6% in 2004 to 49.6% in 2013 (3,4). One of the main therapies used for MM is the small-molecule alkylating agent melphalan (5–7). However, melphalan efficacy is variable in the clinical population, especially in relapsed and refractory MM, and is also implicated in various toxicities, including severe mucositis and myelosuppression. Thus, stratification of melphalan-responsive patients in the MM patient population is critical for reducing therapy-induced toxicities.
The L-type amino acid transporter 1 (LAT1) is a key mediator in uptake and intracellular accumulation of melphalan and correlates with melphalan sensitivity and response in MM and other cancers (8–10). LAT1, a member of the system L family of transporters, is expressed primarily in fetal liver, bone marrow, placenta, and testes (11,12) and is overexpressed in MM, correlating with poor MM prognosis and survival (10). LAT1 is a heterodimer consisting of a light chain (SLC7A5) that provides the amino acid transporter function and a glycosylated heavy chain subunit (CD98) that provides trafficking and membrane localization (13,14). LAT1 is implicated in tumor proliferation pathways, through the mammalian target of rapamycin and glutamine/glutamate signaling pathways (15).
The glucose analog 18F-FDG is currently used in PET imaging of MM and other cancers for disease staging and for monitoring of therapy response. Clinical trials on patients with MM have found a correlation between suppression of 18F-FDG uptake and improved event-free survival (16). 18F-FDG PET/CT is useful for staging and response monitoring in MM, but the sensitivity for detecting marrow involvement by MM is variable, particularly when there is a relatively low marrow burden of disease (17). 18F-FDG uptake may be increased in the setting of inflammation after chemotherapy and in the presence of exogenous or endogenous marrow stimulation. Thus, there is a need for other PET tracers with increased sensitivity and specificity for detecting intramedullary MM, particularly when the disease burden is low. Additionally, 18F-FDG uptake and retention are mediated by glucose transporter 1 (GLUT1) and hexokinase, which are involved primarily in glycolysis. As a result, 18F-FDG uptake does not reflect the LAT1 expression and melphalan sensitivity of MM tumors.
In this study, we sought an alternative tracer that directly interrogates the functional status of LAT1. The amino acid PET tracer 3,4-dihydroxy-6-18F-fluoro-l-phenylalanine (18F-FDOPA) is structurally related to melphalan and is primarily transported into cells by LAT1 (18). 18F-FDOPA PET is used mostly in imaging gliomas and neuroendocrine tumors in cancer patients (19,20). Because LAT1 mediates the intracellular accumulation of both 18F-FDOPA and melphalan, we hypothesized that 18F-FDOPA uptake in myeloma cells will correlate with melphalan therapy response. Using an immunocompetent xenograft model of murine myeloma, we demonstrate that 18F-FDOPA can serve as a complementary imaging agent to 18F-FDG for MM PET imaging and can potentially provide additional information allowing stratification of responders and nonresponders to melphalan therapy.
MATERIALS AND METHODS
Cell Culture and Reagents
Green fluorescent protein–expressing 5TGM1 cells (obtained from Katherine N. Weilbaecher, Washington University) were maintained at 106 cells/mL in Iscove modified Dulbecco medium supplemented with 10% v/v fetal bovine serum and 1% penicillin/streptomycin (all from Thermo Fisher Scientific). Melphalan (Sigma-Aldrich) was prepared weekly, before injection, from a 5 mg/mL 0.1 M HCl EtOH stock. 18F-FDG and 18F-FDOPA were produced in compliance with current good manufacturing practices by the Washington University Cyclotron Facility.
Tumor Model and Melphalan Therapy
All animal studies were conducted according to protocols approved by the Washington University Animal Studies Committee. C57BL/6 KaLwRij mice received a unilateral subcutaneous injection of 106 5TGM1 cells in the lower flank. All tumor implantation and imaging procedures were conducted under 1%–2% v/v isoflurane/100% O2 anesthesia.
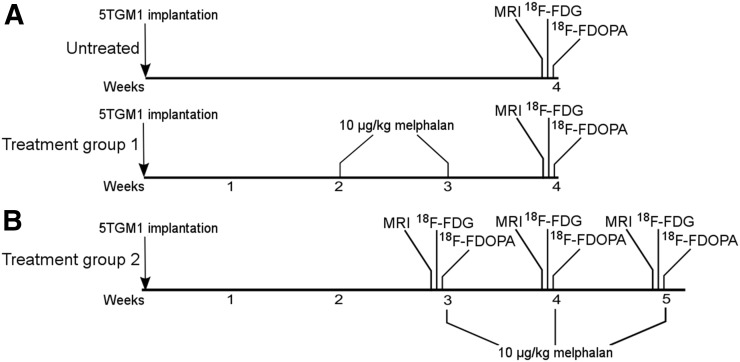
Tumor-bearing mice were separated into 2 independent studies. The first study consisted of an untreated group (n = 6) and a treated group (n = 7) that received melphalan at weeks 2 (14–18 d) and 3 after tumor implantation, with imaging being performed at week 4 (Fig. 1A). The second study consisted of a group (n = 3) that received melphalan at weeks 3, 4, and 5 after tumor implantation, with imaging being performed immediately before the start of each treatment (Fig. 1B). In both studies, melphalan treatment consisted of a 10 mg/kg intraperitoneal dose in saline (21).
FIGURE 1.
Timeline for treated and untreated groups. Melphalan was administered weekly beginning at either week 2 (A) or week 3 (B) after tumor implantation. Imaging with MRI, 18F-FDG PET/CT, and 18F-FDOPA PET/CT was performed on separate, contiguous days. In week 2 group, imaging took place at end of study. In week 3 group, imaging took place before each treatment administration at weeks 3, 4, and 5.
In Vivo Imaging of Structural Tumor Volume (STV) and Metabolic Tumor Volume (MTV)
To minimize signal cross-contamination, 18F-FDG PET/CT and 18F-FDOPA PET/CT were performed on separate, contiguous days. To standardize the sequence of imaging techniques, 18F-FDOPA PET/CT was always performed after 18F-FDG PET/CT.
STV was assessed by calipers and non–contrast-enhanced MRI. The mice were placed supine within a birdcage radiofrequency coil and imaged on a 4.7-T (200-MHz) small-animal MRI scanner (Agilent Technologies). Respiration and body temperature were maintained at approximately 50 breaths/min and 37°C, respectively. Transverse T2-weighted contiguous slices were collected using a spin-echo sequence (repetition time, 1.5 s; echo time, 40 ms; number of averages, 2; field of view, 2.5 × 2.5 × 1.6 cm; data matrix, 128 × 128 × 16). Region-of-interest analysis was performed using ImageJ (National Institutes of Health).
MTV was assessed by 18F-FDG and 18F-FDOPA PET/CT. Before radiotracer administration, a whole-body 60-kVp CT scan was acquired for each mouse. The mice were injected with 7.4-MBq dose of the tracer via the lateral tail vein, and 60-min dynamic scans were collected afterward using an Inveon PET/CT or Focus F220 PET imaging system (Siemens Healthcare). 18F-FDG PET/CT was performed after the mice had been kept fasting for 6–8 h with access to water. 18F-FDG and 18F-FDOPA PET/CT images were processed using iterative reconstruction and displayed on an Inveon Research Workplace (version 4.2; Siemens Healthcare) in multiplanar views.
PET Image Analysis
Volumetric tumor and control-tissue regions of interest were defined using the companion CT image and the summed PET image. Dynamic time–activity curves were decay-corrected and converted to SUVs before analysis. The MTV (volume of tumor with SUV > 0.42 × SUVmax) (22), total lesion avidity (TLA) (MTV SUVmean × MTV), and total uptake (area under the tracer time–activity curve) were calculated for 18F-FDOPA. MTV, total lesion glycolysis (TLG) (MTV SUVmean × MTV), and total uptake were also calculated for 18F-FDG. To minimize single-voxel noise in SUVmax measurements, SUVmax was defined as the mean of the 95% isocontour (23).
Immunohistochemistry
Immunohistochemistry was performed on tissue from both treated groups to evaluate changes in LAT1 and GLUT1 expression. Tumor tissue was excised, flash-frozen in optimal-cutting-temperature compound (Tissue Tek; Sakura Finetek), and stored at −20°C. Tyramide-amplified immunohistochemistry using a TSA Plus Cyanine 3 detection kit (PerkinElmer, Inc.) was performed as per the manufacturer’s protocol (24). Briefly, sections were fixed in 4% v/v paraformaldehyde/phosphate-buffered saline. Endogenous peroxidase and nonspecific binding were blocked with 3% H2O2 and 0.5% TSA blocking reagent, respectively. Sections were incubated separately overnight at 4°C with 1:50 dilutions of rabbit polyclonal anti-SLC7A5 (Proteintech Group, Inc.), anti-GLUT1 (Abcam), anti-CD98 (Santa Cruz Biotechnology, Inc.), and anti-CD31 (Novus Biologicals). The slides were mounted with Vectashield antifade mounting medium (Vector Laboratories) with 4′,6-diamidino-2-phenylindole (DAPI) after signal amplification with 1:50 TSA-Cy3. Stained slides were imaged on an LSM 880 II Airyscan inverted confocal fluorescence microscope (Zeiss). The slides were sequentially imaged with a DAPI filter (excitation/emission wavelength, 405/465 nm), a green fluorescent protein filter (excitation/emission wavelength, 488/509 nm), and a Cy3 filter (excitation/emission wavelength, 561/603 nm). As a negative control, muscle tissue excised from the contralateral leg was stained and imaged using the described settings.
Statistical Analysis
All statistical analyses were performed using Prism (version 5.0; GraphPad). Two-way ANOVA with repeated measures was used for time–activity curve comparisons. One-way ANOVA with Bonferroni multiple-comparisons posttesting was used for SUVmax and total uptake comparisons. Two-tailed Student t testing was used for TLA, TLG, and volume comparisons. Lin concordance correlation coefficients between 18F-FDOPA and 18F-FDG parameters were calculated using MATLAB (version 2014b; The MathWorks, Inc.).
RESULTS
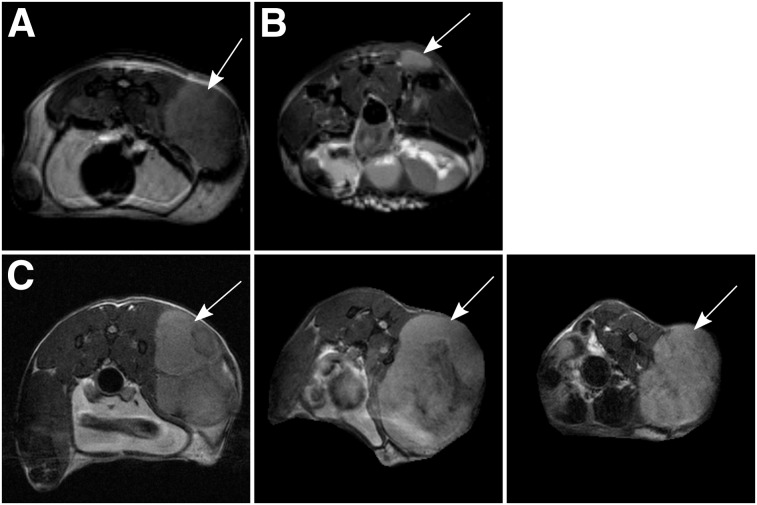
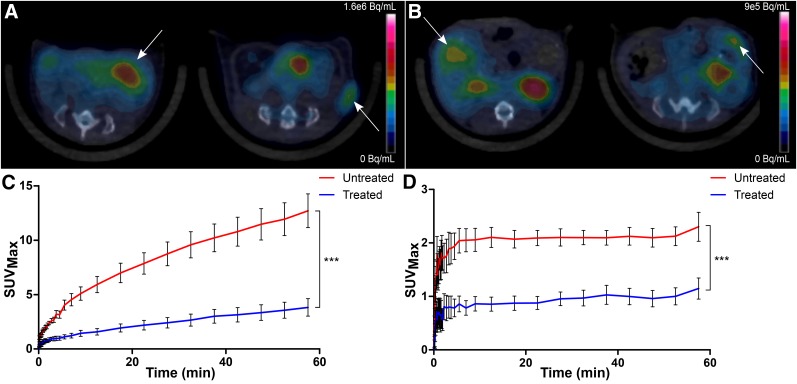
At 4 wk after tumor implantation, the treated group showed a heterogeneous reduction in STV on MRI (9.9 ± 7.7-fold) (Table 1; Figs. 2A and 2B), along with a corresponding decrease in MTV as represented by 18F-FDG and 18F-FDOPA uptake (Figs. 3A and 3B). Decay-corrected time–activity curves derived from the tumor volume of interest for 18F-FDG and 18F-FDOPA showed a decrease in overall uptake across time for the treated mice (Figs. 3C and 3D). Interestingly, treatment did not affect the time to reach steady state in the 18F-FDOPA time–activity curves, suggesting that melphalan therapy has no impact on the overall uptake mechanism or washout kinetics for 18F-FDOPA.
TABLE 1.
18F-FDOPA and 18F-FDG Measurements
| Parameter | Treated (n = 7) | Untreated (n = 6) | Untreated-to-treated ratio |
| TLA | 13.07 ± 5.89 | 603.9 ± 165.9 | 46.21 ± 24.37 |
| TLG | 44.92 ± 12.05 | 2,329 ± 532.1 | 51.85 ± 18.27 |
| MTV (mm3) | |||
| 18F-FDOPA | 22.16 ± 7.67 | 636 ± 194.5 | 28.7 ± 13.22 |
| 18F-FDG | 28.81 ± 5.35 | 416.1 ± 182.5 | 14.44 ± 6.88 |
| SUVmax | |||
| 18F-FDOPA | 0.70 ± 0.13 | 1.48 ± 0.17 | 2.11 ± 0.46 |
| 18F-FDG | 2.84 ± 0.65 | 7.03 ± 0.84 | 2.47 ± 0.64 |
| Total uptake | |||
| 18F-FDOPA | 53.06 ± 8.33 | 118.9 ± 8.55 | 2.24 ± 0.39 |
| 18F-FDG | 138.8 ± 28.18 | 483.5 ± 58.98 | 3.48 ± 0.83 |
| STV (mm3) | 78.31 ± 53.6 | 771.2 ± 291.7 | 9.85 ± 7.70 |
Data are mean ± SEM.
FIGURE 2.
Representative T2-weighted transverse MR images. (A) Untreated mouse. (B) Mouse treated at weeks 2 and 3 after tumor implantation. (C) Mouse treated at weeks 3, 4, and 5 after tumor implantation (pretreatment baseline image [left]; week 4 image [middle]; week 5 image [right]). Implanted tumors are indicated by arrows.
FIGURE 3.
Tumor localization and time–activity profiles. Representative transverse views of treated mice (left image in each panel) and untreated mice (right image in each panel) are shown for 18F-FDG (A) and 18F-FDOPA (B) PET/CT, along with respective time–activity curve data (C and D), plotted as mean ± SEM for each time point. Implanted tumors are indicated by arrows. ***P < 0.001.
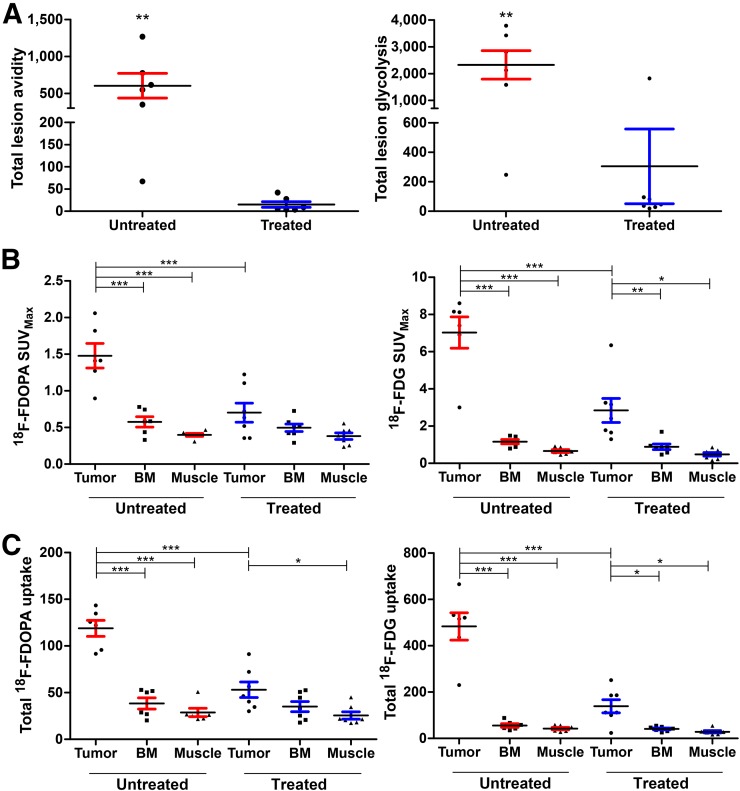
TLA and uptake of both 18F-FDOPA and 18F-FDG were reduced in the treated tumors. There was a larger reduction in 18F-FDOPA MTV (28.7 ± 13.2-fold) than in 18F-FDG MTV (14.4 ± 6.9-fold), although this difference did not translate into a significant correlation between MTV and STV. TLA and TLG decreased similarly in treated tumors (Fig. 4A). Overall, 18F-FDG SUVmax was higher than 18F-FDOPA SUVmax in both untreated and treated tumors (Fig. 4B; Table 1). 18F-FDOPA total uptake and SUVmax fell to within control-tissue (bone marrow and muscle) levels on melphalan treatment, whereas 18F-FDG uptake remained significantly higher in tumors than in control tissues (Fig. 4C). These results suggest that, compared with 18F-FDG, changes in 18F-FDOPA uptake in this tumor model may be more specific to a melphalan-mediated reduction in tumor size.
FIGURE 4.
18F-FDG and 18F-FDOPA distribution and TLA metrics in treated and untreated mice. Scatterplots with mean and SEM are displayed for TLA and TLG (A), SUVmax (B), and total uptake (C). *P < 0.05. **P < 0.01. ***P < 0.001.
In the analysis using Lin concordance correlation coefficients, TLA and MTV in the treated group were moderately concordant between 18F-FDOPA and 18F-FDG, whereas SUVmax and total uptake demonstrated poor agreement (Table 2). Interestingly, the concordance of TLA and total uptake between 18F-FDOPA and 18F-FDG was stronger after therapy, whereas that of MTV and SUVmax was relatively unaffected. The lack of concordance in SUVmax and total uptake between 18F-FDOPA and 18F-FDG is likely linked to the difference in uptake mechanisms, whereas the moderate agreement between MTV and TLA indicated similar global effects on metabolism in the setting of effective therapy.
TABLE 2.
Lin Correlation Coefficients Relative to 18F-FDG PET/CT Parameters
| Parameter | Treated (n = 7) | Untreated (n = 6) |
| TLA | 0.41 (0.04 to 0.68) | 0.16 (−0.08 to 0.4) |
| MTV | 0.64 (−0.01 to 0.91) | 0.55 (0.01 to 0.84) |
| SUVmax | 0.03 (−0.11 to 0.16) | 0.03 (−0.03 to 0.09) |
| Total uptake | 0.21 (−0.02 to 0.42) | 0.02 (−0.02 to 0.06) |
Data are mean correlation coefficient followed by 5%–95% confidence interval in parentheses.
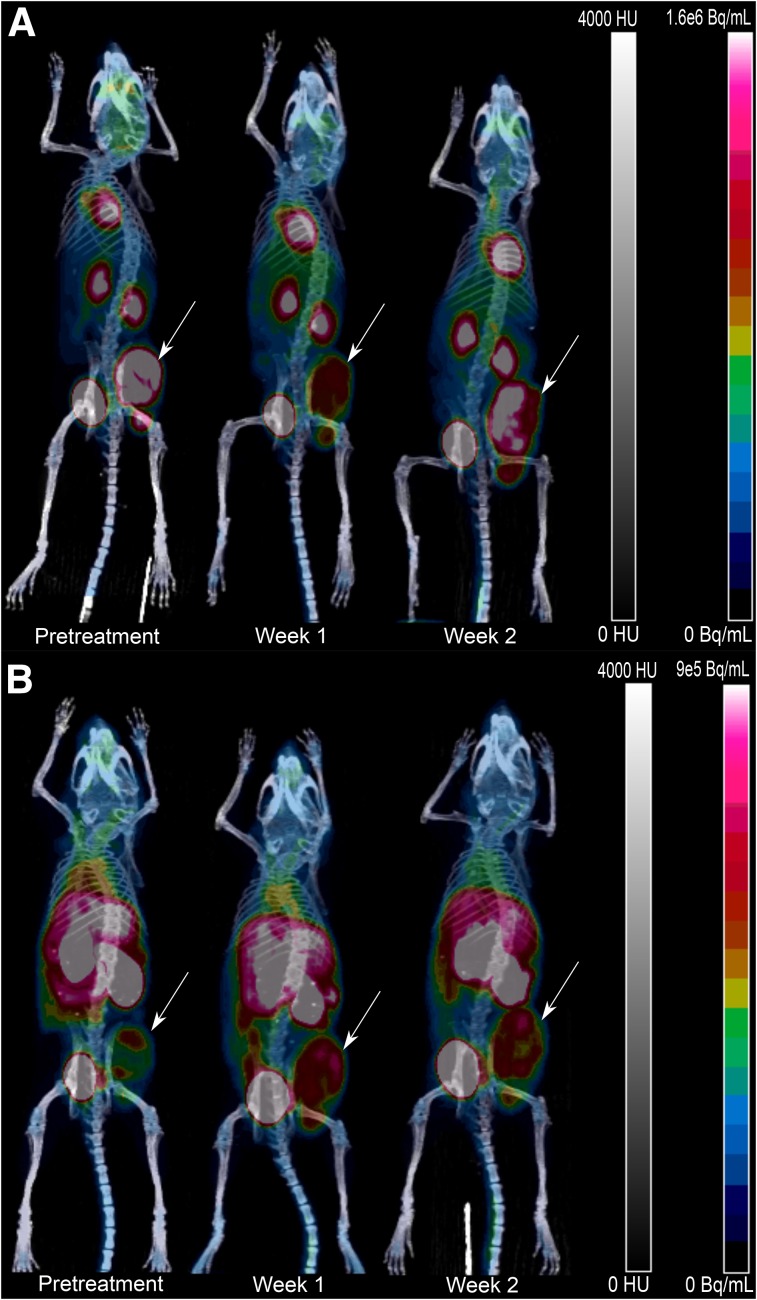
T2-weighted MRI indicated minimal STV reduction throughout the therapy regimen (Fig. 2C). 18F-FDG uptake was significantly reduced in week 1 of therapy, with a return to pretreatment levels during week 2 (Fig. 5A and Supplemental Fig. 1A; supplemental materials are available at http://jnm.snmjournals.org). By week 2 of therapy, there was also an increase in TLG (1.7 ± 0.4-fold), SUVmax (2.1 ± 0.4-fold), and total uptake (2.1 ± 0.4-fold) for 18F-FDG, suggesting a rebound of glucose-avid tumor cells (Supplemental Figs. 1B and 1D). By contrast, 18F-FDOPA kinetics were unaffected by the therapy regimen (Fig. 5B and Supplemental Fig. 1A). There was an increase in TLA (2.4 ± 0.9-fold) between the pretreatment baseline and week 1 for 18F-FDOPA, and this increase remained consistent at week 2 (0.8 ± 0.2-fold relative to week 1) (Supplemental Fig. 1B). No corresponding change was seen in SUVmax or total uptake for 18F-FDOPA (Supplemental Figs. 1C and 1D). These results suggest that treatment of established tumors with melphalan may result in stabilization of the STV and MTV. Additionally, the lack of correlation between 18F-FDOPA and 18F-FDG uptake indicates that acute changes in glucose metabolism are independent of changes in the transport and intracellular metabolism of the amino acid 18F-FDOPA.
FIGURE 5.
Representative 18F-FDG PET/CT (A) and 18F-FDOPA PET/CT (B) maximum-intensity projections at pretreatment baseline and weeks 1 and 2 during treatment. Implanted tumors are indicated by arrows.
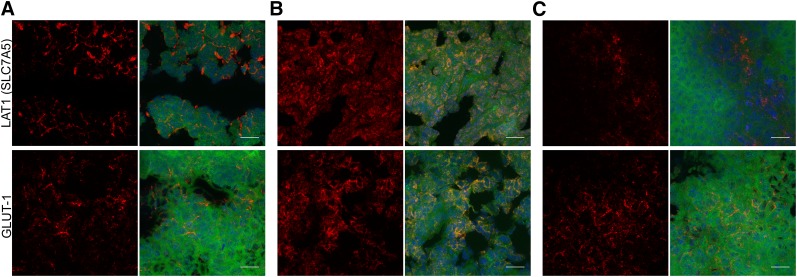
The immunohistochemistry results showed that changes in LAT1 expression were modulated by both tumor size and therapy. The week 3 treated group had reduced LAT1 surface density (Fig. 6C, top) relative to the week 2 treated group and the untreated group (Figs. 6A and 6B, top). The high LAT1 density in the week 2 treated group relative to the untreated group can be attributed to the smaller size and increased vascular density of the tumors. Indeed, LAT1 and GLUT1 expression was generally concentrated near blood vessels, as confirmed by CD31 staining (Supplemental Figs. 2A and 2B, top). The relative lack of LAT1 signal in the untreated group may be linked to the heterogeneous distribution of viable green fluorescent protein–expressing tumor cells within the tumor mass.
FIGURE 6.
Immunohistochemistry of LAT1 and GLUT1 expression for untreated mice (A) and mice that began treatment at week 2 (B) or week 3 (C) after tumor implantation. Expression for each stain is shown as maximum-intensity projection separately and as composite with green fluorescent protein (green) and DAPI nuclear stain (blue) (×63; 20-μm scale bar).
DISCUSSION
18F-FDOPA is an aromatic amino acid PET tracer that is effective for imaging gliomas and neuroendocrine tumors (19,20). In a study by Dimitrakopoulou-Strauss et al., 18F-FDOPA and 18F-FDG were shown to complement each other in the detection of metastatic melanoma in pretreated patients (25). 18F-FDOPA uptake by cancer cells is thought to be mediated primarily by LAT1, making 18F-FDOPA a promising candidate for imaging LAT1 activity in vivo. Because melphalan uptake is also mediated by LAT1, we used 18F-FDOPA PET as a surrogate reporter of melphalan therapy efficacy in a preclinical, immunocompetent MM model. We evaluated 18F-FDOPA and 18F-FDG uptake parameters, including TLA, MTV, and SUVmax, in vivo in unilateral subcutaneously implanted 5TGM1 tumors in C57BL/KaLwRij mice, which served as a model for extramedullary MM. Importantly, uptake of 18F-FDOPA correlated strongly with LAT1 surface expression, and a significant therapy-induced decrease in SUVmax, TLA, and total uptake relative to untreated tumor was shown for 18F-FDOPA.
Preclinical 18F-FDOPA PET/CT showed demonstrable differences in tumor uptake among the untreated group and the 2 treated groups. Immunohistochemistry on the week 2 treated group suggested that decreasing tumor size and increasing viable tumor fraction were linked to increasing LAT1 expression (Figs. 6A and 6B, top). To further validate changes in expression of LAT1, CD98 staining was performed. However, CD98 also forms heterodimers with other amino acid transporters, including members of the LAT family (14). Additionally, CD98 expression is implicated in increased vascular density (Supplemental Figs. 2A and 2B, bottom) (26). The correlation between vascular density and LAT1 expression is corroborated by preclinical 11C-methionine PET studies on gliomas and brain tumors (27). 18F-FDOPA metrics also correlated with melphalan sensitivity, with the MTV for 18F-FDOPA showing a moderate concordance with the 18F-FDG clinical reference standard (Table 2). The reduction in 18F-FDOPA uptake indicated the sensitivity of 18F-FDOPA PET/CT to melphalan cytotoxicity.
The effect of aggressive melphalan therapy on total uptake and SUVmax was greater for 18F-FDG than for 18F-FDOPA (Figs. 4B and 4C). The 5TGM1 cell line is highly glucose-avid and aggressive relative to several other human and murine myeloma cell lines. This avidity, coupled with minimal differences in GLUT1 surface density between untreated and treated tumors, may explain the difference in overall uptake of 18F-FDG relative to 18F-FDOPA in this tumor model. 18F-FDG SUVmax and total uptake were also significantly higher in tumors than in nontumor tissue in treated animals. This effect may be partially explained by the recruitment of glucose-avid macrophages and other immune cells to the tumor by therapy-induced inflammation. Nevertheless, 18F-FDG PET/CT accurately identified overall response, whereas 18F-FDOPA PET/CT highlighted melphalan-sensitive tumor populations, and the reduction in MTV in the treated group, compared with the untreated group, was greater for 18F-FDOPA than for 18F-FDG.
The differences in 18F-FDOPA and 18F-FDG uptake induced by the aggressive therapy regimen may be overstated because of several factors, including variable tumor viability, variable immunologic response, and the homogeneous expression of LAT1 in the viable tumor volume. To address these concerns, we performed longitudinal 18F-FDOPA and 18F-FDG PET/CT on established tumors treated with melphalan (Fig. 1B). For 18F-FDOPA, there were no significant differences in MTV, SUVmax, or total uptake during the imaging period (Fig. 5B and Supplemental Fig. 1), but TLA increased 2.4-fold between baseline and the first week of therapy and then remained unchanged at the second week (Supplemental Fig. 1B). Indeed, immunohistochemistry showed that LAT1 expression in this treated group did not differ qualitatively from that in the untreated group, suggesting therapy-induced stabilization of LAT1 expression within the tumor environment (Fig. 6C). By contrast, 18F-FDG SUVmax and total uptake rebounded to pretreatment levels after the first week of therapy, indicating a reduction in tumor-killing effect by the second week and stabilized tumor viability (Supplemental Figs. 1C and 1D). These results suggest that functional imaging with 18F-FDOPA and 18F-FDG PET/CT may be linked to tumor viability and melphalan therapy response.
Use of indirect metabolic markers such as TLA and tracer uptake as potential parameters sensitive to changes in cancer stage has been established in the literature. TLA and TLG, although derived from similar SUV data, provided results different from total uptake, because of the selective volumetric information contained within the MTV. TLA is a crucial semiquantitative parameter that may provide a surrogate measurement for viable tumor fraction. TLG is a more mechanistic measurement that represents the tracer uptake mediated by the glucose transport proteins and the subsequent intracellular trapping of 18F-FDG after phosphorylation by hexokinases. Although phosphorylated 18F-FDG is unable to enter glycolysis further downstream, TLG can provide information on the changing GLUT1-mediated metabolism during disease progression and after therapeutic intervention. Indeed, in a study by McDonald et al., 18F-FDG TLG, MTV, and SUVmax and the number of focal lesions strongly correlated with MM stage and with progression-free and overall survival (28). Our results highlight the discordance in the changes in TLA and TLG in response to melphalan therapy in established tumors. Therefore, 18F-FDG and 18F-FDOPA might be used to assess tumor response to melphalan during early and late stages, respectively.
This study was a proof-of-concept investigation into 18F-FDOPA PET imaging of MM and the correlation between 18F-FDOPA findings and melphalan efficacy in an extramedullary MM tumor model. There are several promising findings from this study, including the correlation of 18F-FDOPA uptake and 18F-FDG uptake with tumor viability and early response to melphalan therapy, respectively. Imaging studies on other human and murine myeloma cell lines and on animal models with different LAT1 expression and melphalan sensitivity would be helpful to corroborate the trends seen in these data. In vitro studies of melphalan-resistant myeloma cell lines have shown that efflux transporters are predominantly linked to melphalan resistance (29). Therefore, determining the expression of efflux transporters at various time points during melphalan therapy would also provide important information about treatment-mediated transient changes in influx and efflux transporters. Finally, further investigation into 18F-FDOPA uptake and washout mechanisms, with metabolite fate analyses and competitive inhibition of 18F-FDOPA intracellular uptake, can provide the means to develop strong predictive models of melphalan sensitivity with 18F-FDOPA PET/CT.
CONCLUSION
This study represents one of the first investigations linking amino acid–based imaging in MM to therapy response, via the correlation of 18F-FDOPA PET/CT to melphalan sensitivity and LAT1 expression. 18F-FDOPA PET/CT provided viable and complementary imaging of MM and melphalan therapy efficacy in this tumor model. Finally, uptake of 18F-FDG and 18F-FDOPA in established tumors was discordant early after treatment initiation, indicating the tracers’ independent mechanisms and their individual applications for assessing response to different stages of melphalan therapy.
DISCLOSURE
This research was funded primarily by NCI grants R01 CA176221 and U54 CA199092. We also acknowledge support via grants P50 CA094056, P30 CA091842, and K08CA154790 from the NCI; grant DE-SC0012737 from the U.S. Department of Energy; and the MIR Facilities Fund 18-007 for pilot imaging. No other potential conflict of interest relevant to this article was reported.
Supplementary Material
Acknowledgments
Gail Sudlow assisted with subcutaneous injections and tissue sectioning; John Engelbach, with the setup and acquisition of MR images; and Wadha Alyami, with the preliminary data collection.
REFERENCES
- 1.Palumbo A, Anderson K. Multiple myeloma. N Engl J Med. 2011;364:1046–1060. [DOI] [PubMed] [Google Scholar]
- 2.Becker N. Epidemiology of multiple myeloma. In: Moehler T, Goldschmidt H, eds. Multiple Myeloma. New York, NY: Springer; 2011:25–35. [Google Scholar]
- 3.Brenner H, Gondos A, Pulte D. Recent major improvement in long-term survival of younger patients with multiple myeloma. Blood. 2008;111:2521–2526. [DOI] [PubMed] [Google Scholar]
- 4.Cancer stat facts: myeloma. Surveillance, Epidemiology, and End Results Program website. https://seer.cancer.gov/statfacts/html/mulmy.html. Accessed May 30, 2018.
- 5.Palumbo A, Sezer O, Kyle R, et al. International Myeloma Working Group guidelines for the management of multiple myeloma patients ineligible for standard high-dose chemotherapy with autologous stem cell transplantation. Leukemia. 2009;23:1716–1730. [DOI] [PubMed] [Google Scholar]
- 6.Waage A, Gimsing P, Fayers P, et al. Melphalan and prednisone plus thalidomide or placebo in elderly patients with multiple myeloma. Blood. 2010;116:1405–1412. [DOI] [PubMed] [Google Scholar]
- 7.Facon T, Mary JY, Hulin C, et al. Melphalan and prednisone plus thalidomide versus melphalan and prednisone alone or reduced-intensity autologous stem cell transplantation in elderly patients with multiple myeloma (IFM 99–06): a randomised trial. Lancet. 2007;370:1209–1218. [DOI] [PubMed] [Google Scholar]
- 8.Kim DK, Kanai Y, Choi HW, et al. Characterization of the system L amino acid transporter in T24 human bladder carcinoma cells. Biochim Biophys Acta. 2002;1565:112–121. [DOI] [PubMed] [Google Scholar]
- 9.Lin J, Raoof DA, Thomas DG, et al. L-type amino acid transporter-1 overexpression and melphalan sensitivity in Barrett’s adenocarcinoma. Neoplasia. 2004;6:74–84. [DOI] [PMC free article] [PubMed] [Google Scholar]
- 10.Isoda A, Kaira K, Iwashina M, et al. Expression of L-type amino acid transporter 1 (LAT1) as a prognostic and therapeutic indicator in multiple myeloma. Cancer Sci. 2014;105:1496–1502. [DOI] [PMC free article] [PubMed] [Google Scholar]
- 11.Bhutia YD, Babu E, Ramachandran S, Ganapathy V. Amino acid transporters in cancer and their relevance to “glutamine addiction”: novel targets for the design of a new class of anticancer drugs. Cancer Res. 2015;75:1782–1788. [DOI] [PubMed] [Google Scholar]
- 12.Yanagida O, Kanai Y, Chairoungdua A, et al. Human L-type amino acid transporter 1 (LAT1): characterization of function and expression in tumor cell lines. Biochim Biophys Acta. 2001;1514:291–302. [DOI] [PubMed] [Google Scholar]
- 13.Napolitano L, Scalise M, Galluccio M, Pochini L, Albanese LM, Indiveri C. LAT1 is the transport competent unit of the LAT1/CD98 heterodimeric amino acid transporter. Int J Biochem Cell Biol. 2015;67:25–33. [DOI] [PubMed] [Google Scholar]
- 14.Wagner CA, Lang F, Broer S. Function and structure of heterodimeric amino acid transporters. Am J Physiol Cell Physiol. 2001;281:C1077–C1093. [DOI] [PubMed] [Google Scholar]
- 15.Altman BJ, Stine ZE, Dang CV. From Krebs to clinic: glutamine metabolism to cancer therapy. Nat Rev Cancer. 2016;16:619–632. [DOI] [PMC free article] [PubMed] [Google Scholar]
- 16.Agarwal A, Chirindel A, Shah BA, Subramaniam RM. Evolving role of FDG PET/CT in multiple myeloma imaging and management. AJR. 2013;200:884–890. [DOI] [PubMed] [Google Scholar]
- 17.Cavo M, Terpos E, Nanni C, et al. Role of 18F-FDG PET/CT in the diagnosis and management of multiple myeloma and other plasma cell disorders: a consensus statement by the International Myeloma Working Group. Lancet Oncol. 2017;18:e206–e217. [DOI] [PubMed] [Google Scholar]
- 18.Youland RS, Kitange GJ, Peterson TE, et al. The role of LAT1 in 18F-DOPA uptake in malignant gliomas. J Neurooncol. 2013;111:11–18. [DOI] [PMC free article] [PubMed] [Google Scholar]
- 19.Schwarzenberg J, Czernin J, Cloughesy TF, et al. Treatment response evaluation using 18F-FDOPA PET in patients with recurrent malignant glioma on bevacizumab therapy. Clin Cancer Res. 2014;20:3550–3559. [DOI] [PMC free article] [PubMed] [Google Scholar]
- 20.Becherer A, Szabó M, Karanikas G, et al. Imaging of advanced neuroendocrine tumors with 18F-FDOPA PET. J Nucl Med. 2004;45:1161–1167. [PubMed] [Google Scholar]
- 21.Mori Y, Shimizu N, Dallas M, et al. Anti-α4 integrin antibody suppresses the development of multiple myeloma and associated osteoclastic osteolysis. Blood. 2004;104:2149–2154. [DOI] [PubMed] [Google Scholar]
- 22.Ulaner GA, Goldman DA, Corben A, et al. Prospective clinical trial of 18F-fluciclovine PET/CT for determining the response to neoadjuvant therapy in invasive ductal and invasive lobular breast cancers. J Nucl Med. 2017;58:1037–1042. [DOI] [PMC free article] [PubMed] [Google Scholar]
- 23.Vanderhoek M, Perlman SB, Jeraj R. Impact of the definition of peak standardized uptake value on quantification of treatment response. J Nucl Med. 2012;53:4–11. [DOI] [PMC free article] [PubMed] [Google Scholar]
- 24.Zaidi AU, Enomoto H, Milbrandt J, Roth KA. Dual fluorescent in situ hybridization and immunohistochemical detection with tyramide signal amplification. J Histochem Cytochem. 2000;48:1369–1375. [DOI] [PubMed] [Google Scholar]
- 25.Dimitrakopoulou-Strauss A, Strauss LG, Burger C. Quantitative PET studies in pretreated melanoma patients: a comparison of 6-[18F]fluoro-L-dopa with 18F-FDG and 15O-water using compartment and noncompartment analysis. J Nucl Med. 2001;42:248–256. [PubMed] [Google Scholar]
- 26.Liao Z, Cantor JM. Endothelial cells require CD98 for efficient angiogenesis-brief report. Arterioscler Thromb Vasc Biol. 2016;36:2163–2166. [DOI] [PMC free article] [PubMed] [Google Scholar]
- 27.Okubo S, Zhen HN, Kawai N, Nishiyama Y, Haba R, Tamiya T. Correlation of L-methyl-11C-methionine (MET) uptake with L-type amino acid transporter 1 in human gliomas. J Neurooncol. 2010;99:217–225. [DOI] [PubMed] [Google Scholar]
- 28.McDonald JE, Kessler MM, Gardner MW, et al. Assessment of total lesion glycolysis by 18F FDG PET/CT significantly improves prognostic value of GEP and ISS in myeloma. Clin Cancer Res. 2017;23:1981–1987. [DOI] [PMC free article] [PubMed] [Google Scholar]
- 29.Kühne A, Tzvetkov MV, Hagos Y, Lage H, Burckhardt G, Brockmoller J. Influx and efflux transport as determinants of melphalan cytotoxicity: resistance to melphalan in MDR1 overexpressing tumor cell lines. Biochem Pharmacol. 2009;78:45–53. [DOI] [PubMed] [Google Scholar]
Associated Data
This section collects any data citations, data availability statements, or supplementary materials included in this article.


