Abstract
Fluorochloridone (FLC) is a herbicide used worldwide that is thought to be safe. However, due to its potential genotoxicity, cytotoxicity, and even systematic toxicity, there are increasing concerns about human exposure to this compound. Thus, the metabolism and bioactivation of FLC was investigated. After oral administration to mice, 27 metabolites were identified by ultrahigh performance liquid chromatography-electrospray ionization-quadrupole time-of-flight-mass spectrometry and with further structural identification by nuclear magnetic resonance spectroscopy. Hydroxylation and oxidative dechlorination were the major phase I pathways, while glutathione (GSH) and N-acetylcysteine conjugations were two major phase II pathways, indicating the formation of a reactive intermediate. In vitro microsomal and cytosolic studies revealed that a GSH conjugate (M13) was the predominant metabolite of FLC formed through a nucleophilic SN2 substitution of 3-Cl by GSH; this pathway is NADPH independent and accelerated by glutathione S-transferase (GST). Further, a kinetic study showed that M13 formation in both human liver microsomes and cytosols obeyed typical Michaelis-Menten kinetics. The maximum clearance (Vmax/Km) of GSH conjugation in human liver microsomes was approximately 5.5-fold higher than human liver cytosol, thus implying that microsomal GST was mainly responsible for M13 formation. These findings are important for understanding the potential hazard of human exposure to FLC.
Graphical Abstract
INTRODUCTION
Agrochemicals, including pesticides and fertilizers, are used to increase the agricultural productivity and crop yields.1 However, their pervasive use in farming can result in a negative impact on the environment.2 The prevalent exposure of the populations to these substances has caused concerns over their potential health consequences.
Carotenoids play an important role in many physiological processes in plants. A lack of carotenoid synthesis may lead to typical bleaching symptoms, tissues blight, and death inplants.3 Phytoene desaturase (PDS) is a key enzyme for the photosynthetic apparatus of green plants and is involved in carotenoid biosynthesis. Therefore, PDS inhibitors are used as bleaching herbicides.4 Fluorochloridone (FLC), (3RS,4RS;3RS,4SR)-3-chloro-4-chloromethyl-1-(α,α,α-tri-fluoro-m-tolyl)-2-pyrrolidone, belongs to the PDH bleaching herbicide family and is a selective herbicide that is widely applied, especially in Asia and North America, in the control of many broadleaf weeds and annual grasses in cereal, sunflower, and potato crops, among others. FLC is absorbed by roots and stems and causes bleaching of the leaves through interference with carotenoid biosynthesis.5–8
According to the European Food Safety Authority (EFSA), FLC does not cause genotoxicity or neurotoxicity nor is it a carcinogen.9,10 While there is consensus that the FLC is safe, its possible genetic and cytotoxic effects, as well as systematic toxicity, have been studied.11–14 Recent work suggested that FLC and its two commercial formulations are able to induce single-strand DNA breaks in Chinese Hamster Ovary K1 (CHO-K1) cells.10 Furthermore, FLC could be considered a potential endocrine disruptor because it induces adverse effects in the reproductive functions and hormonal systems of male rats. The target organs of FLC as a potential endocrine disruptor in male rats are the testis and epididymis.9,10 Changes in body weights, hematology, serum chemistry, and organ weight ratios were observed in a long-term toxicity study in rats. Notably, testis and epididymis lesions were consistently observed by histopathological observations at the 45 and 90 days of dosing and the last recovery day.14 The potential risks of FLC to humans are largely unknown and need to be evaluated further.
The EFSA report also indicated that FLC undergoes extensive metabolism in rats and rabbits. The excretion rate of unchanged FLC was less than 1.5% of the applied dose.9 However, the complete metabolite profile of FLC remains unclear, and the nature of the enzymes responsible for its metabolism and elimination have not been investigated. In the present study, ultrahigh performance liquid chromatography-electrospray ionization-quadrupole time-of-flight-mass spec-trometry (UHPLC-ESI-QTOFMS) combined with nuclear magnetic resonance (NMR) spectroscopy was used to determine the pathways of FLC metabolism, including the complete metabolic profile and the involvement of specific enzymes.
MATERIALS AND METHODS
Materials.
Fluorochloridone, NADPH, and glutathione (GSH) were purchased from Sigma-Aldrich (St. Louis, MO). Human liver microsomes (HLM) from a pool of 33 donors (Catalog. 452161) were purchased from BD Gentest Corp (Woburn, MA). Human liver cytosols (HLC) from a pool of 46 donors (Catalog. HMCYPL) were purchased from GIBCO (ThermoFisher Scientific, MA). The recombinant enzymes CYP1A1, CYP1A2, CYP1B1, CYP2B6, CYP2C8, CYP2C9, CYP2C19, CYP2D6, CYP2E1, CYP3A4, and CYP3A5, produced in baculovirus were purchased from BD Gentest. Pooled mouse liver microsomes (MLM) and cytosols (MLC) were prepared from male C57BL/6 mouse liver homogenates by differential ultracentrifugation.15
Animals.
Male C57BL/6 mice from Charles River Laboratories (Wilmington, MA) were housed in a temperature-and humidity-controlled vivarium under a 12 h light/dark cycle with ad libitum access to food and water. All animal husbandry protocols were in accordance with the NIH Guide for the Care and Use of Laboratory Animals. All mouse studies were performed in accordance with an animal study protocol approved by the National Cancer Institute Animal Care and Use Committee. Additional details on the mouse study are provided in the Supporting Information.
In Vitro Incubations.
The incubation system (200 μL) contained 100 mM phosphate buffer solution (pH = 7.4), 1.0 mg·mL−1 microsomes or cytosols, 5 mM MgCl2, 5 mM GSH, and 20 or 100 μM FLC. The mixture was preincubated at 37°C for 3 min and initiated with 2 mM NADPH. The reaction was stopped by an aliquot of 200 μL of ice-cold acetonitrile after 60 min. After centrifugation at 14 000 × g for 10 min, a 5 μL aliquot of the supernatant was injected into a UHPLC-ESIQTOFMS. The in vitro incubation system for recombinant human CYPs was similar to that used for the liver microsomes, except that the microsomes were substituted with 50 nM recombinant cDNA-expressed CYPs. The reaction time was 60 min, and metabolites were analyzed using UHPLC-ESIQTOFMS.
Kinetic Analysis of GSH Transferase in Microsomes and Cytosols.
The incubations for the kinetic analyses of microsomes and cytosols were performed typically using nine concentrations (range, 10–2000 μM) of FLC at protein concentrations of 0.2 mg/mL for 30 min. The results were obtained from three replicates in different incubations, and all the data were expressed as means ± SD. The data were transformed, and Eadie-Hofstee curves were plotted to help identify kinetic models. The Michaelis-Menten equation was used to calculate the kinetic parameters by nonlinear least-squares regression analysis by use of Prism 6.0 GraphPad Software: V = Vmax × S/(Km + S), where V is the reaction velocity, Vmax is the maximum velocity, Km is the Michaelis constant (substrate concentration at 0.5 Vmax), and S is the substrate concentration.
UHPLC-ESI-QTOFMS and UHPLC-ESI-TQMS Analysis.
Profiling and identification of metabolites were performed on an Acquity UHPLC/Premier Q-TOF MS (Waters Corp.) with an electrospray ionization source. An Acquity UHPLC system coupled with a XEVO triple-quadrupole tandem mass spectrometer (Waters Corporation) was used for quantitation. Additional methodological details are provided in the Supporting Information.
RESULTS AND DISCUSSION
Metabolite Characterization in Mice.
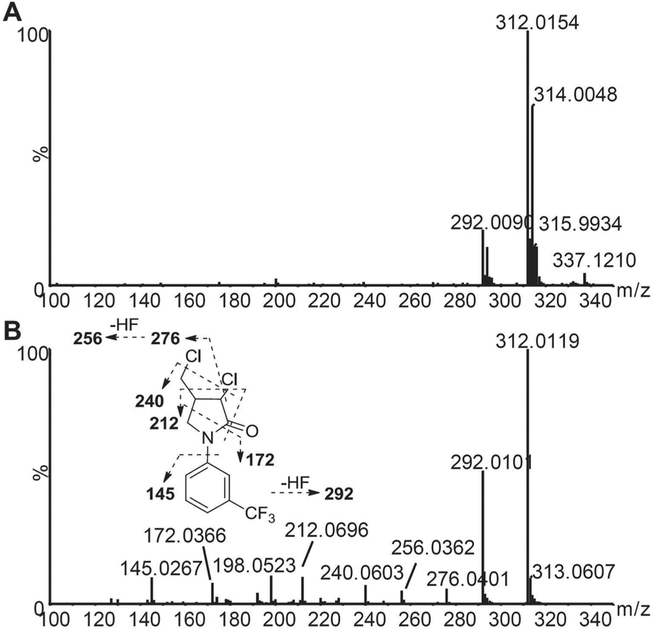
The identities of the metabolites were elucidated based on their accurate mass, isotope pattern, chromatographic, and MS/MS fragmentation comparisons with the parent compound. The chromatographic and MS fragmentation behaviors of FLC were first investigated. FLC eluted at 6.6 min and exhibited triplet protonated molecular ions at m/z 312.015/314.005/315.993 in the positive ion mode due to the presence of two chlorine atoms in the molecule (Figure 1A). In the MS/MS spectrum, FLC gave fragments at m/z 292.010, 276.040, 256.036, 240.060, 212.070, 198.052, 172.037, and 145.027, with the fragmentation pattern shown in Figure 1B. Typically, the major fragment ions were produced by losses of hydrogen fluoride (20.006 Da) and hydrogen chloride (35.977 Da) at carbon 3.
Figure 1.
Q-TOF mass spectra of fluorochloridone in the ESI+ mode. (A) MS spectrum. (B) MS/MS spectrum and fragmentation pattern.
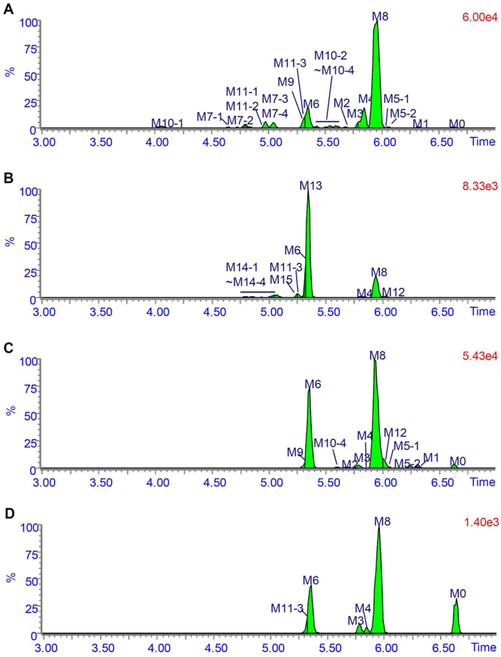
The metabolic profiles of FLC in mice urine, bile, feces, and serum after a single oral administration of 50 mg/kg FLC are shown in Figure 2. The metabolic profiles of FLC in mice on a lower dose of 5 mg/kg are similar (Figure S1), although less metabolites were detected due to the limits of sensitivity. The chromatographic peak at 6.6 min was assigned to unchanged FLC (M0) because its retention time and mass spectral fragmentation pattern were identical to those of reference FLC. Table 1 and Table S1 summarize the possible FLC metabolites, including their retentions times, measured accurate [M + H]+, and proposed elemental compositions. These metabolites were designated as M1 to M15 according to their m/z-values. The characteristic mass spectral fragmentation ions and the proposed structures are listed in Table S2.
Figure 2.
Metabolic profiles of fluorochloridone in urine (A), bile (B), and feces (C) collected at 0 to 24 h postdose and serum samples (D) collected at 4 h postdose. Mice received a single oral administration of 50 mg·kg−1 fluorochloridone.
Table 1.
UHPLC-ESI-QTOFMS Data for Fluorochloridone Metabolites Detected in Microsomes
| no. | metabolic pathway | Rt (min) | measured [M + H]+ | formula | error (ppm) | matrices |
|---|---|---|---|---|---|---|
| M0 | parent | 6.62 | 312.019 | C12H10Cl2F3NO | 5.3 | U, F, S |
| M1 | reductive dechlorination | 6.32 | 278.057 | C12H11ClF3NO | 3.9 | U, F |
| M2 | oxidative dechlorination of 3-Cl | 5.67 | 294.053 | C12H11ClF3NO2 | 5.7 | U, F |
| M3 | oxidative dechlorination of 6-Cl | 5.78 | 294.052 | C12H11ClF3NO2 | 5.3 | U, F, S |
| M4 | oxidative dechlorination of 6-Cl to carboxylic acid | 5.84 | 308.032 | C12H9ClF3NO3 | 5.2 | U, B, F, S |
| M5–1 | hydroxylation | 6.05 | 328.014 | C12H10Cl2F3NO2 | 6.2 | U, F |
| M5–2 | hydroxylation | 6.24 | 328.011 | C12H10Cl2F3NO2 | −2.4 | U, F |
| M6 | substitution of chlorine with cysteine | 5.35 | 397.060 | C15H16ClF3N2O3S | 0.9 | U, B, F, S |
| M7–1 | substitution of chlorine with cysteine and hydroxylation | 4.64 | 413.056 | C15H16ClF3N2O4S | 1.8 | U |
| M7–2 | substitution of chlorine with cysteine and hydroxylation | 4.80 | 413.059 | C15H16ClF3N2O4S | 8.9 | U |
| M7–3 | substitution of chlorine with cysteine and hydroxylation | 4.98 | 413.056 | C15H16ClF3N2O4S | 2.6 | U |
| M7–4 | substitution of chlorine with cysteine and hydroxylation | 5.04 | 413.056 | C15H16ClF3N2O4S | 1.4 | U |
| M8 | substitution of chlorine with N-acetylcysteine | 5.96 | 439.074 | C17H18ClF3N2O4S | 8.5 | U, B, F, S |
| M9 | substitution of chlorine with glycerylcysteine | 5.30 | 454.085 | C17H19ClF3N3O4S | 8.6 | U, F |
| M10–1 | substitution of chlorine with N-acetylcysteine and hydroxylation | 4.06 | 455.069 | C17H18ClF3N2O5S | 7.9 | U |
| M10–2 | substitution of chlorine with N-acetylcysteine and hydroxylation | 5.43 | 455.068 | C17H18ClF3N2O5S | 6.4 | U |
| M10–3 | substitution of chlorine with N-acetylcysteine and hydroxylation | 5.54 | 455.068 | C17H18ClF3N2O5S | 5.7 | U |
| M10–4 | substitution of chlorine with N-acetylcysteine and hydroxylation | 5.59 | 455.068 | C17H18ClF3N2O5S | 6.4 | U, F |
| M11–1 | oxidative dechlorination of 3-Cl and glucuronidation | 4.98 | 470.081 | C18H19ClF3NO8 | −4.1 | U |
| M11–2 | oxidative dechlorination of 3-Cl and glucuronidation | 5.19 | 470.082 | C18H19ClF3NO8 | −2.0 | U |
| M11–3 | oxidative dechlorination of 6-Cl and glucuronidation | 5.32 | 470.086 | C18H19ClF3NO8 | 6.8 | U, B, S |
| M12 | N-acetylcysteine conjugation | 6.02 | 473.034 | C17H17Cl2F3N2O4S | 4.6 | B, F |
| M13 | substitution of chlorine with glutathione | 5.35 | 583.125 | C22H26ClF3N4O7S | 1.9 | B, S |
| M14–1 | substitution of chlorine with glutathione and hydroxylation | 4.81 | 599.122 | C22H26ClF3N4O8S | 4.4 | B |
| M14–2 | substitution of chlorine with glutathione and hydroxylation | 4.85 | 599.118 | C22H26ClF3N4O8S | −1.8 | B |
| M14–3 | substitution of chlorine with glutathione and hydroxylation | 4.94 | 599.123 | C22H26ClF3N4O8S | 7.0 | B |
| M14–4 | substitution of chlorine with glutathione and hydroxylation | 5.04 | 599.121 | C22H26ClF3N4O8S | 3.9 | B |
| M15 | glutathione conjugation | 5.40 | 617.083 | C22H25Cl2F3N4O7S | −4.2 | B |
Urine.
In addition to the parent FLC, a total of 19 metabolites were detected in the urinary metabolic profiles (Figure 2A). M1 was proposed to be a reductive-dechlorinated metabolite based on the mass shift of 32.962 Da. M2 and M3 were assumed to be oxidative-dechlorinated metabolites. Due to the electron withdrawing effect of the amide group, 3-OH more easily loses a water molecule to form a carbonium fragment ion at m/z 276.047. Thus, M2 was identified as 3-OH-dechlorofluorochloridone and M3 was 4-hydroxylmethyldechlorofluorochloridone. M4 produced a characteristic neutral loss of formic acid (46.006 Da) upon MS/MS fragmentation, indicating that M4 was a carboxylic metabolite of M3. M5–1 and M5–2 exhibited protonated molecules at m/z 328.012, which are 15.995 Da higher than that of FLC, in line with hydroxylated metabolites. The occurrence of a fragment ion at m/z 145.028 suggested an unchanged trifluorophenyl group. Other fragments ions at m/z 308.010, 292.035, 274.030, 256.060, and 228.054 were all ~16 Da higher than the corresponding fragments ions of FLC, indicating that they are 5-hydroxyl metabolites. In addition, because of the electron donating effect of aminoacyl, no dehydrated ion was observed for these two aliphatic-hydroxyl metabolites. After hydroxylation, a new chiral center at carbon 5 was generated. M5–1 and M5–2 were a pair of diastereomeric conjugates; thus, two chromatographic peaks were observed.
All the other metabolites detected were phase II conjugates. According to the accurate masses and MS/MS fragmentation patterns shown in Table 1, Table S1, and Table S2, M7, M8, and M9 were identified as dechlorinated cysteine, N-acetylcysteine (NAC), or glycerylcysteine conjugates of FLC, respectively. A diagnostic fragment ion appeared at m/z 308.012, whose formation is attributed to cleavage of the cysteinyl C-S bond, implying the presence of a thioether motif. Likewise, M7–1−M7–4 and M10–1−M10–4 were dechlorinated cysteine and NAC conjugates of M5–1 and M5–2, respectively. M11–1, M11–2, and M11–3 were glucuronide conjugates of oxidative-dechlorinated FLC based on the observation of the base peak at m/z 294.051 formed by a 176.032 Da neutral loss of glucuronic acid in their MS/MS spectra. The occurrence of fragment ion at m/z 276.039 indicated that M11–1 and M11–2 were originated from M2, and M11–3 was derived from M3. According to the urine MS chromatogram shown in Figure 2A, and the UV chromatogram (Figure S2A), the major components in urine were the carboxylic metabolite M4, dechlorinated cysteine conjugate M6, and dechlorinated NAC conjugate M8.
Bile.
A total of 11 metabolites were detected in the bile metabolic profiles (Figure 2B). The retention times and MS/MS mass spectra of these metabolites were compared with those detected in urine. The carboxylic metabolite M4 was the only phase I metabolite detected, and M6, M8, and M11–3 were also excreted into bile. M12 to M15 were newly identified metabolites. M12 exhibited a protonated ion at m/z 473.034, with an elemental composition of C17H17Cl2F3N2O4S, which was one chlorine more and one hydrogen less than that of M8, suggesting that the chlorine atom still existed in the structure of M12. Therefore, M12 was consistent with the attachment of the NAC moiety to the parent FLC. M13 and M14–1−M14–4 were dechlorinated GSH conjugates of FLC and hydroxylated FLC, respectively, and M15 was a GSH conjugate of FLC, based on mass shifts and elemental compositions. Thus, a series of specific GSH conjugate ions were produced via neutral losses of glycine (75.032 Da), pyroglutamic acid (129.043 Da), glutamine (146.069 Da), and γ-glutamyl-dehydroalanyl-glycine (273.096 Da).16 These results further supported the structural assignments for the GSH conjugates. According to the bile MS chromatogram shown in Figure 2B and the UV chromatogram (Figure S2B), the dechlorinated GSH conjugate of FLC M13 was the predominant metabolite in bile. Other major metabolites include the carboxylic metabolite M4 and dechlorinated cysteine conjugate M6.
Feces.
A total of 11 metabolites, along with parent FLC, were detected in the extracts of fecal homogenates. Based on the MS chromatogram shown in Figure 2C and UV chromatogram (Figure S2C), M6 and M8 were the major FLC-related components, followed by M5–1 and M5–2. Phase I metabolites M1 to M4 and other phase II conjugates M9, M10–4, and M12 were also detected as minor components.
Serum.
A total of 6 metabolites were detected in serum, with M6 and M8 as the major circulating metabolites, followed by the unmetabolized FLC. Phase I M3 and M4 and phase II conjugates M11–3 and M13 were minor metabolites. It is widely accepted that circulating metabolites may contribute to toxicity of a compound.17,18 Thus, more attention should be paid to M6 and M8 in future studies of FLC because of their potentially high systematic exposure.
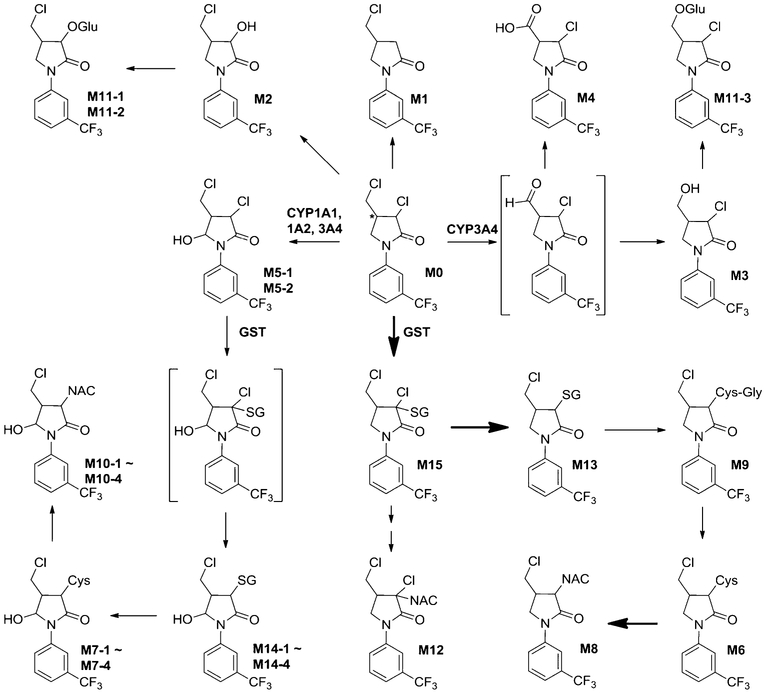
The proposed metabolic map of FLC in mice is depicted in Scheme 1. UHPLC-TQMS was applied to quantify FLC in mice (Table S3). The concentrations of FLC in serum at 4 and 24 h post-dose were 0.941 ± 0.220 and 0.053 ± 0.025 μM, respectively, for the low dose group and 8.02 ± 2.81 and 0.285 ± 0.076 μM, respectively, for the high dose group. The 24-h excretion rates of FLC in urine (0.122−0.0134%) and feces (1.21−1.40%) were very low, and even undetectable in bile, implying that FLC was efficiently absorbed from the gut and extensively metabolized in mice. Dechlorination combined with GSH, NAC, or cysteine conjugation (M13, M8, and M6) was the primary route for FLC disposition. The detection of a series of glycerylcysteine, cysteine, and NAC conjugates indicates that these conjugates in mice were derived from tripeptide GSH conjugates via the classic mercapturate pathway mediated by multiple enzymes including γ-glutamylcysteine transpeptidase, dipeptidase, and N-acetyl transferase.19–21 The identification of many thioether conjugates of FLC demonstrated the high reactivities of FLC to the nucleophiles and the formation of potentially harmful reactive intermediate in vivo.
Scheme 1.
Proposed Metabolic Pathways of Fluorochloridone in Mice
Besides the abundant thioether conjugates detected, the carboxylic metabolite M4 was also a major phase I metabolite and found at a relatively high level in urine and bile. Its formation required the oxidative dechlorination first to form an aldehyde intermediate, followed by further oxidation to the carboxylic acid. Oxidative dechlorination, also called hydrolytic dechlorination, is a common metabolic pathway for chlorinated compounds.22,23
In Vitro Biotransformation and Bioactivation of FLC by Liver Microsomes.
To more fully determine the enzymes that carry out FLC biotransformation, HLM metabolism of FLC was studied. Representative chromatograms of the microsomal incubations with or without HLM or NADPH are illustrated in Figure S3 and summarized in Table S4. Approximately 30% of the parent compound was consumed in HLM incubations supplemented with NADPH, and three oxidative metabolites were generated, including 4-hydroxylmethyldechlorofluorochloridone (M3), carboxylic metabolite (M4), and 5-hydroxylfluorochloridone (M5–1 and M5–2). The coincubation of FLC with GSH, NADPH, and HLM allowed for 40% more consumption of FLC and the detection of three GSH conjugates, dechlorinated GSH conjugates of FLC (M13) and hydroxylated FLC (M14–1 and M14–4). In the absence of NADPH (Figure 2C), only M13 was detected with an identical amount as found in the NADPH-supplemented system, suggesting that the formation of M13 was CYP independent. HLM and MLM incubations yielded similar metabolic profiles toward FLC, which demonstrates that mice may be a suitable animal model to predict FLC metabolism and toxicity in humans.
Characterization of the GSH Conjugate of Fluorochloridone.
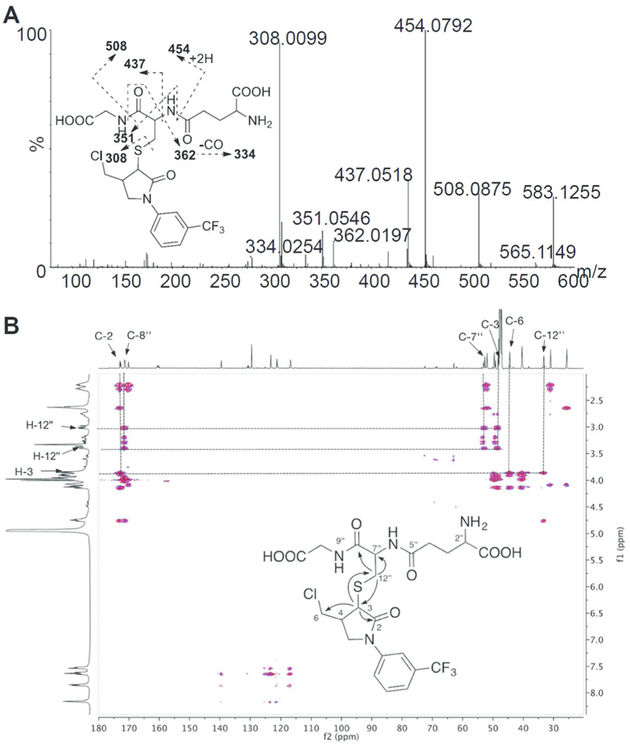
As noted above, dechlorinated GSH conjugate of FLC (M13, FLC-SG) was the major metabolite identified in mice and after microsomal incubations with FLC. To determine the region of modification in the M13 molecule, an FLC-SG metabolite was separated and purified from a scaled-up MLM incubation. HR-MS and two-dimensional NMR data were used to fully characterize its structure. First, FLC-SG displayed a protonated molecular peak at m/z 583.124 ([M + H]+) corresponding to a molecular formula of C22H26ClF3N4O7S, indicating that the chlorine atom in fluorochloridone had been substituted by GSH. In the MS/MS spectrum, a series of fragment ions at m/z 508.088, 454.080, 437.052, 362.020, 351.055, 334.025, and 308.010 formed by the cleavages within the GS moiety were observed (Figure 3A). While mass spectrometry provides a molecular formula for FLC-SG, its chemical structure and site of conjugation cannot be determined by MS data alone. To elucidate the structure of the conjugate, a standard suite of NMR experiments including 1H and 13C NMR spectra, and 2D 1H–1H COSY, HSQC, and HMBC experiments were recorded and analyzed. 1H and 13C chemical shift assignments were made by interpretation of the 1H and 13C NMR spectra combined with the HSQC data and are summarized in Table S5 and Figure S4A-D. The structure of the conjugate was determined by interpretation of the COSY and HMBC data as follows. The 1H–1H COSY spectrum (Figure S4E) showed four coupled units or spin systems (Figure S4F) that could in turn be connected to one another by the 2- and 3-bond 1H–13C correlations observed in the HMBC spectrum (Figure 3B). The correlations from H-3 to C-12″ of GSH and from H-12″ to C-3 of FLC confirmed that the chlorine atom on the pyrrolidine ring of FLC was substituted by the sulfur atom of the thiol group in GSH yielding the structure shown in Figure 3B.
Figure 3.
MS/MS spectrum (A) and HMBC spectrum (B) of isolated fluorochloridone GSH conjugate.
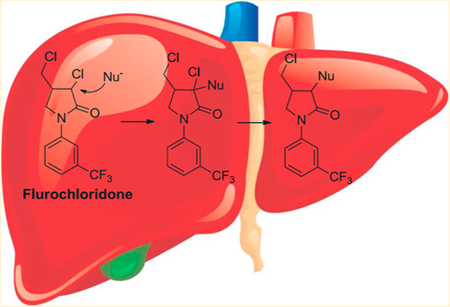
It appears that GSH conjugation takes place via nucleophilic substitution of the chlorine atom by GSH to form M13. Because M15, which still has 3-Cl in its structure, was also detected in vivo, M13 formation is considered to be an SN2 reaction with the chlorine atom serving as an intramolecular leaving group. Usually, the intermediate is very unstable and hard to capture. However, for FLC, the electron-withdrawing group of the amide can stabilize the intermediate M15 and make it detectable. This type of nucleophilic SN2 substitution by GSH is also observed for other chlorinated compounds, such as alachlor, metalachlor, and propachlor.24
Identification of CYPs Involved in FLC Oxidative Metabolism.
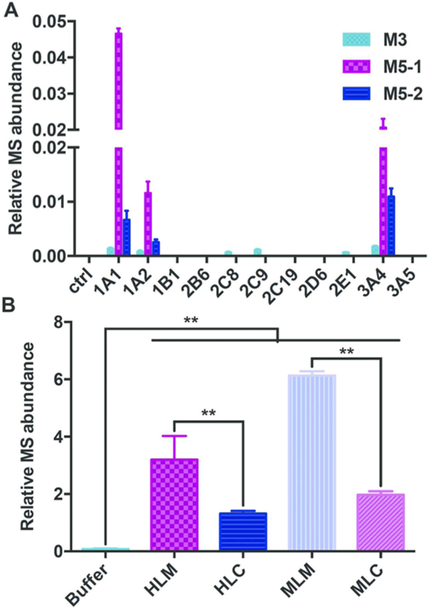
Identification of the enzymes involved in FLC metabolism is helpful for deciphering the biotransformation pathways that facilitate a more complete understanding of an interindividual response to xenobiotics. The catalytic activities of a panel of human recombinant CYP isozymes in oxidizing FLC were then examined, revealing that oxidative biotransformation of FLC was carried out by CYP1A1, 1A2, 2C8, 2C9, 2E1, and 3A4 through oxidative dechlorination at 6-Cl to form M3 (Figure 4A). Likewise, the hydroxylation (M5–1 and M5–2) was catalyzed by CYP1A1, 1A2, and 3A4. The highest rates of M3, M5–1, and M5–2 production were observed in the incubations with CYP3A4, 1A1, and 3A4, respectively. Based on their average hepatic expression, CYP3A4 was assumed to be the principle CYP mediating FLC oxidative metabolism. Notably, CYP3A4 is a major enzyme involved in the xenobiotic metabolism, and its activity can be influenced by pregnane X receptor (PXR) inducers of CYP3A4, rifampicin and dexamethasone,25 and the inhibitors of CYP3A4, ketoconazole and grapefruit juice.26,27 Additionally, aryl hydrocarbon receptor (AhR) agonists, such as omeprazole, can markedly increase the expression of CYP1A1 and CYP1A2.28 Exposure to cigarette smoke also induces CYP1A1 in human liver and lung tissues.29,30 Therefore, all of these will affect the metabolic fate of FLC in vivo. Individual differences in these enzyme activities also could result in different metabolic rates of FLC and thus the different responses to FLC toxicities.
Figure 4.
Formation of M3, M5–1, and M5–2 in incubations of fluorochloridone with recombinant human CYPs (A) and formation of M13 in buffer, HLM, HLC, MLM, and MLC (B). Data are presented as means ± SD. One-way ANOVA with Tukey’s correction: **P < 0.01.
The carboxylic metabolite M4 was not formed by recombinant CYPs. However, the generation of M3 and M4 is supposed to be associated with the same oxidative dechlorination pathway through an aldehyde intermediate, which could be reduced to produce the alcohol metabolite M3 or could alternatively be oxidized to the carboxylic metabolite M4. The commercial recombinant CYPs all contain CYP oxidoreductase to support their activities, and thus M3 was detected in the current study. Aldehyde dehydrogenase, alcohol dehydrogenase, and aldehyde oxidase were reported to be involved in the oxidation of aldehyde intermediate to carboxylic acid.31 The exact enzyme that catalyzes M4 formation needs further investigation.
Role of Glutathione Transferase in the Formation of the GSH Conjugate of Fluorochloridone.
To probe the role of glutathione S-transferase (GST) in M13 formation, the GSH conjugation of FLC was investigated in buffer, MLM, MLC, HLM, and HLC (Figure 4B). In buffer, a trace amount of M13 was detected; in the presence of microsomes or cytosols, the yield of M13 was significantly increased (P < 0.01). The formation of M13 in microsomes was more than 2-fold higher than that in cytosols. These findings indicated that the SN2 substitution of 3-Cl by GSH proceeded in a nonenzymatic manner but could be accelerated by both microsomal and cytosolic GST, whereas microsomal GST had the higher specific activity. The chlorine atom in FLC probably has an interaction with the GST, assisting in orientating the substrate relative to GSH.
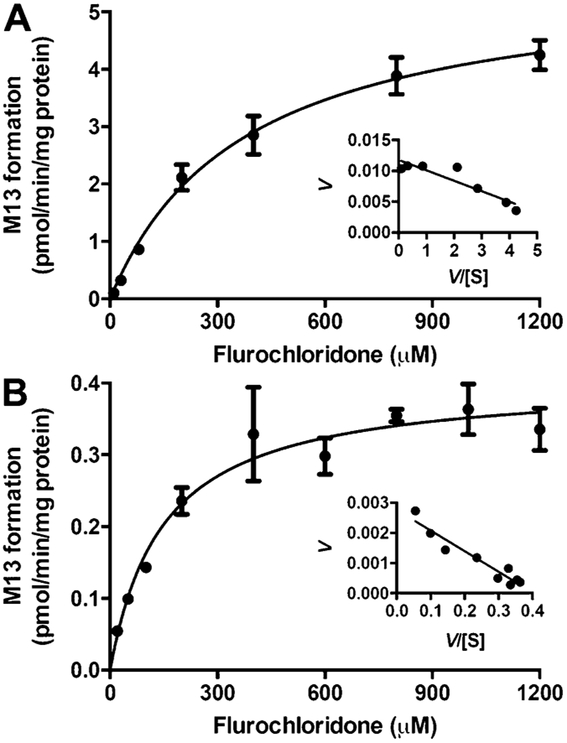
Kinetic analysis of GSH conjugation in MLM, MLC, HLM, and HLC was conducted using a wide range of FLC concentrations (20–2000 μM). A Michaelis-Menten kinetic model was best fitted to M13 formation by microsomes and cytosols, as evidenced by the Eadie-Hofstee plot (Figure 5 and Figure S5). All the apparent enzyme kinetic parameters are summarized in Table 2. In HLM and HLC, although HLM showed lower affinity with a higher Km value than HLC (374 vs 148 μM), the maximum conjugation rate (Vmax) in HLM is much faster (5.63 vs 0.404 pmol·min−1·mg protein−1). Therefore, the maximum clearance (Vmax/Km) of GSH conjugation in HLM was approximately 5.5-fold higher than HLC (15.1 vs 2.73 mL ·min−1·mg protein−1). In MLM and MLC, MLM showed a higher affinity (367 vs 2014 μM) and faster maximum conjugation rate (9.5 vs 4.65 pmol·min−1·mg protein−1), and thus the maximum clearance in MLM was approximately 11.2-fold higher than MLC (25.9 vs 2.31 mL· min−1·mg protein−1). All these data supported the conclusion that microsomal GST, rather than cytosolic GST, was responsible for FLC-SG formation.
Figure 5.
Enzyme kinetics of GSH conjugation by HLM (A) and HLC (B) fitted by Michaelis-Menten kinetic model. Eadie-Hofstee plots are shown as insets. Data were obtained from three replicates.
Table 2.
Apparent Kinetic Parameters of FLC-SG Formation Using Microsomes and Cytosolsa
| parameters | HLM | MLM | HLC | MLC |
|---|---|---|---|---|
| Vmax (pmol·min−1·mg protein−1) | 5.63 | 9.50 | 0.404 | 4.65 |
| Km (μM) | 374 | 367 | 148 | 2010 |
| Vmax/Km (mL·min−1·mg protein−1) | 15.1 | 25.9 | 2.73 | 2.31 |
| R2 | 0.983 | 0.964 | 0.930 | 0.973 |
Enzyme apparent kinetic parameters were calculated by Michaelis-Menten kinetics.
Implications in FLC Toxicity.
To evaluate the toxicity of FLC, mice were fed on the diet containing 0.5% FLC or control diet for 10 days. Alanine transaminase (ALT), a biochemical marker of hepatoxicity, was elevated significantly (Figure S6A). The aqueous peroxide and triglycerides were both slightly increased, indicative of mild oxidative injury and steatosis induced by FLC (Figure S6B,C).
FLC can be conjugated with GSH by GST. GSH is an important antioxidant in fungi, plants, animals, and humans, that prevents damage to important cellular components that are caused by reactive oxygen species such as free radicals and peroxides.32 Abundant FLC-SG formation may lead to the GSH depletion and correspondingly result in increased oxidative stress in vivo. Indeed, the liver aqueous peroxide, an indicator of oxidative stress, was induced by prolonged FLC treatment (Figure S6B). In addition, the GSTs are generally accepted to be important in detoxifying xenobiotics in mammals, plants, insects, bacteria, and fungi33 and were implicated in the detoxification of various environmental contaminants such as herbicides and other persistent organic pollutants.24,34 The current study proved that FLC is highly reactive as it can form the GSH conjugate only in buffer without GST catalysis. Moreover, the GST superfamily is composed of multiple isozymes with significant evidence of functional polymorphic variation in humans.35 Hence, FLC is likely to alkylate macromolecules in vivo (e.g., protein, nucleic acids, etc.) through covalent binding in addition to the conjugation with GSH and thus could pose a risk to human health.
Furthermore, the carboxylic metabolite M4 was another major metabolite, formed via bioactivation to an aldehyde intermediate. The aldehyde formed endogenously by intermediary metabolism is known to be hepatotoxic.31,36,37 Alcohol consumption is a major cause of fatty liver due to the production of toxic metabolites including aldehydes during alcohol metabolism in liver.38–40 This most commonly occurs with chronic consumption. The current study showed that FLC induces mild liver steatosis due in part to slightly increasing hepatic triglycerides in mice fed a diet containing 0.5% FLC for 10 days (Figure S6C). Further studies will be needed to fully understand the correlation between the occurrence of fatty liver by prolonged FLC exposure and its oxidative dechlorination metabolism pathway. Understanding the metabolism and bioactivation mechanisms of FLC as well as their potential links to its toxicity require additional investigation.
In conclusion, FLC was easily absorbed and extensively metabolized in mice. The metabolites identified were mainly derived from the hydroxylation, oxidative dechlorination, and GSH and NAC conjugations. In vitro studies proved that a GSH conjugate was the predominant metabolite of FLC and was formed via a nucleophilic SN2 substitution mechanism. This bioactivation pathway was independent of NADPH and could be accelerated by GST. The potential safety issues regarding FLC need further evaluation. Understanding the correlation between bioactivation and toxicity will provide an important theoretical basis for determining the toxicology of fluorochloridone FLC and related herbicides.
Supplementary Material
ACKNOWLEDGMENTS
This study was supported by the National Natural Science Foundation of China (Grant No. 81373040) and the NIH Intramural Research Program (NIDDK and NCI). J.S. was supported by the Shanghai Institute for Food and Drug Control, Shanghai Food and Drug Administration.
Footnotes
ASSOCIATED CONTENT
Supporting Information
The Supporting Information is available free of charge on the ACS Publications website at DOI: 10.1021/acs.est.6b02113.
Supplemental experimental section, supplemental Tables S1-S5, and supplemental Figures S1-S6 (PDF)
The authors declare no competing financial interest.
REFERENCES
- (1). Bolognesi C Genotoxicity of pesticides: a review of human biomonitoring studies. Mutat. Res., Rev. Mutat. Res 2003, 543 (3), 251–72. [DOI] [PubMed] [Google Scholar]
- (2). WHO Public health impact of pesticides used in agriculture. 1990. [Google Scholar]
- (3). Bendich A Recent advances in clinical research involving carotenoids. Pure Appl. Chem 1994, 66 (5), 1017–1024. [Google Scholar]
- (4). Liu MY; Shi DQ Design, synthesis, and herbicidal activities of 3-aryl-4-substituted-5-[3-(trifluoromethyl) phenoxy]-1, 2, 4-triazoles. Journal of Heterocyclic Chemistry 2014, 51, E335–E339. [Google Scholar]
- (5). Theodoridis G Fluorine-containing agrochemicals: an overview of recent developments. Adv. Fluorine Sci 2006, 2, 121–175. [Google Scholar]
- (6). Klicova S; Sebanek J; Hudeova M; Vitkova H; Vlasinova H The effect of fluridone and flurochloridone on the incidence of albinism in pea (Pisum sativum) and on the abscission of leaves of privet (Ligustrum vulgare). Rostlinna Vyroba 2002, 48, 255–260. [Google Scholar]
- (7). Lay M; Henstrand J; Lawrence S; Cromartie T In Studies on the mode of action of the herbicide fluorochloridone, Proc. Br. Crop. Prot. Conf.-Weeds, 1985; 1985; pp 179–186. [Google Scholar]
- (8). Lay M-M; Niland AM The herbicidal mode of action of R-40244 and its absorption by plants. Pestic. Biochem. Physiol 1983, 19, 337–343. [Google Scholar]
- (9). Peer review report to the conclusion regarding the peer review of the pesticide risk assessment of the active substance flurochloridone. EFSA 2010, 8, 1869–1935. [Google Scholar]
- (10). Conclusion on the peer review of the pesticide risk assessment of confirmatory data submitted for the active substance flurochloridone. EFSA 2013, 11, 3116–3125.10.2903/j.efsa.2013.3116 [Google Scholar]
- (11). Nikoloff N; Soloneski S; Larramendy ML Genotoxic and cytotoxic evaluation of the herbicide flurochloridone on Chinese hamster ovary (CHO-K1) cells. Toxicol. In Vitro 2012, 26, 157–63. [DOI] [PubMed] [Google Scholar]
- (12). Nikoloff N; Larramendy ML; Soloneski S Assessment of DNA damage, cytotoxicity, and apoptosis in human hepatoma (HepG2) cells after flurochloridone herbicide exposure. Food Chem. Toxicol 2014, 65, 233–41. [DOI] [PubMed] [Google Scholar]
- (13). Nikoloff N; Larramendy ML; Soloneski S Comparative evaluation in vitro of the herbicide flurochloridone by cytokinesis-block micronucleus cytome and comet assays. Environ. Toxicol 2014, 29, 884–92. [DOI] [PubMed] [Google Scholar]
- (14). Zhang S; Cheng X; Wang Y; Fan J; Li R; Zhou S; Liu S; Shi J; Sun J; Hu Y; Xu C; Wu C; Chang X; Tang L; Zhou Z Ninety day toxicity and toxicokinetics of fluorochloridone after oral administration in rats. Int. J. Environ. Res. Public Health 2015, 12, 4942–66. [DOI] [PMC free article] [PubMed] [Google Scholar]
- (15). Meijer J; Bergstrand A; DePierre JW Preparation and characterization of subcellular fractions from the liver of C57B1/6 mice, with special emphasis on their suitability for use in studies of epoxide hydrolase activities. Biochem. Pharmacol 1987, 36 (7), 1139–1151. [DOI] [PubMed] [Google Scholar]
- (16). Xie C; Zhong D; Chen X A fragmentation-based method for the differentiation of glutathione conjugates by high-resolution mass spectrometry with electrospray ionization. Anal. Chim. Acta 2013, 788, 89–98. [DOI] [PubMed] [Google Scholar]
- (17). Smith DA; Obach RS Metabolites: have we MIST out the importance of structure and physicochemistry? Bioanalysis 2010, 2, 1223–1233. [DOI] [PubMed] [Google Scholar]
- (18). Luffer-Atlas D The early estimation of circulating drug metabolites in humans. Expert Opin. Drug Metab. Toxicol 2012, 8, 985–997. [DOI] [PubMed] [Google Scholar]
- (19). Xie C; Zhou J; Guo Z; Diao X; Gao Z; Zhong D; Jiang H; Zhang L; Chen X Metabolism and bioactivation of famitinib, a novel inhibitor of receptor tyrosine kinase, in cancer patients. Br. J. Pharmacol 2013, 168, 1687–706. [DOI] [PMC free article] [PubMed] [Google Scholar]
- (20). Diao X; Pang X; Xie C; Guo Z; Zhong D; Chen X Bioactivation of 3-n-butylphthalide via sulfation of its major metabolite 3-hydroxy-NBP: mediated mainly by sulfotransferase 1A1. Drug Metab. Dispos 2014, 42, 774–81. [DOI] [PubMed] [Google Scholar]
- (21). Jian W; Yao M; Zhang D; Zhu M Rapid detection and characterization of in vitro and urinary N-acetyl-L-cysteine conjugates using quadrupole-linear ion trap mass spectrometry and polarity switching. Chem. Res. Toxicol 2009, 22, 1246–1255. [DOI] [PubMed] [Google Scholar]
- (22). Van Dyke RA Dechloriation mechanisms of chlorinated olefins. Environ. Health Perspect 1977, 21, 121. [DOI] [PMC free article] [PubMed] [Google Scholar]
- (23). Briggs M; Briggs M The chemistry and metabolism of drugs and toxins: an introduction to xenobiochemistry; Elsevier: 2014. [Google Scholar]
- (24). Pérez S; Farkas M; Barceló D; Aga DS Characterization of glutathione conjugates of chloroacetanilide pesticides using ultra-performance liquid chromatography/quadrupole time-of-flight mass spectrometry and liquid chromatography/ion trap mass spectrometry. Rapid Commun. Mass Spectrom 2007, 21, 4017–4022. [DOI] [PubMed] [Google Scholar]
- (25). Luo G; Cunningham M; Kim S; Burn T; Lin J; Sinz M; Hamilton G; Rizzo C; Jolley S; Gilbert D CYP3A4 induction by drugs: correlation between a pregnane X receptor reporter gene assay and CYP3A4 expression in human hepatocytes. Drug Metab. Dispos 2002, 30, 795–804. [DOI] [PubMed] [Google Scholar]
- (26). Fukuda K; Ohta T; Oshima Y; Ohashi N; Yoshikawa M; Yamazoe Y Specific CYP3 A4 inhibitors in grapefruit juice: furocoumarin dimers as components of drug interaction. Pharmacogenetics 1997, 7, 391–396. [DOI] [PubMed] [Google Scholar]
- (27). Newton DJ; Wang RW; Lu A Cytochrome P450 inhibitors. Evaluation of specificities in the in vitrometabolism of therapeutic agents by human liver microsomes. Drug Metab. Dispos 1995, 23, 154–158. [PubMed] [Google Scholar]
- (28). Köhle C; Bock KW Coordinate regulation of Phase I and II xenobiotic metabolisms by the Ah receptor and Nrf2. Biochem. Pharmacol 2007, 73, 1853–1862. [DOI] [PubMed] [Google Scholar]
- (29). Hukkanen J; Pelkonen O; Hakkola J; Raunio H Expression and regulation of xenobiotic-metabolizing cytochrome P450 (CYP) enzymes in human lung. Crit. Rev. Toxicol 2002, 32, 391–411. [DOI] [PubMed] [Google Scholar]
- (30). Villard PH; Hcrber R; Seéreée EM; Attolini L; Magdalou J;Lacarelle B Effect of Cigarette Smoke on UDP-Glucuronosyltransferase Activity and Cytochrome P450 Content in Liver, Lung and Kidney Microsomes in Mice. Pharmacol. Toxicol 1998, 82 (2), 74–79. [DOI] [PubMed] [Google Scholar]
- (31). O’Brien PJ; Siraki AG; Shangari N Aldehyde sources, metabolism, molecular toxicity mechanisms, and possible effects on human health. Crit. Rev. Toxicol 2005, 35, 609–662. [DOI] [PubMed] [Google Scholar]
- (32). Pompella A; Visvikis A; Paolicchi A; De Tata V; Casini AF The changing faces of glutathione, a cellular protagonist. Biochem. Pharmacol 2003, 66, 1499–1503. [DOI] [PubMed] [Google Scholar]
- (33). Sheehan D; Meade G; Foley VM; Dowd CA Structure, function and evolution of glutathione transferases: implications for classification of non-mammalian members of an ancient enzyme superfamily. Biochem. J 2001, 360, 1–16. [DOI] [PMC free article] [PubMed] [Google Scholar]
- (34). Pflugmacher S; Schröder P; Sandermann H Taxonomic distribution of plant glutathione S-transferases acting on xenobiotics. Phytochemistry 2000, 54 (3), 267–273. [DOI] [PubMed] [Google Scholar]
- (35). Lo H-W; Ali-Osman F Genetic polymorphism and function of glutathione S-transferases in tumor drug resistance. Curr. Opin. Pharmacol 2007, 7 (4), 367–374. [DOI] [PubMed] [Google Scholar]
- (36). Kapetanovic IM; Torchin CD; Strong JM; Yonekawa WD; Lu C; Li AP; Dieckhaus CM; Santos WL; Macdonald TL; Sofia RD; Kupferberg HJ Reactivity of atropaldehyde, a felbamate metabolite in human liver tissue in vitro. Chem.-Biol. Interact 2002, 142, 119–134. [DOI] [PubMed] [Google Scholar]
- (37). Walsh JS; Reese MJ; Thurmond LM The metabolic activation of abacavir by human liver cytosol and expressed human alcohol dehydrogenase isozymes. Chem.-Biol. Interact 2002, 142, 135–154. [DOI] [PubMed] [Google Scholar]
- (38). Niemelä O; Parkkila S; Juvonen RO; Viitala K; Gelboin HV; Pasanen M Cytochromes P450 2A6, 2E1, and 3A and production of protein-aldehyde adducts in the liver of patients with alcoholic and non-alcoholic liver diseases. J. Hepatol 2000, 33, 893–901. [DOI] [PubMed] [Google Scholar]
- (39). Nagy LE Molecular aspects of alcohol metabolism: transcription factors involved in early ethanol-induced liver injury. Annu. Rev. Nutr 2004, 24, 55–78. [DOI] [PubMed] [Google Scholar]
- (40). Dey A; Cederbaum AI Alcohol and oxidative liver injury. Hepatology 2006, 43, S63–S74. [DOI] [PubMed] [Google Scholar]
Associated Data
This section collects any data citations, data availability statements, or supplementary materials included in this article.


