Abstract

Subject Categories: Cancer; DNA Replication, Repair & Recombination
The authors contacted EMBO reports in May 2017 to correct one figure. Routine image analysis by the journal uncovered further inconsistencies. Following further analysis, the journal has agreed to correct the following panels and legends.
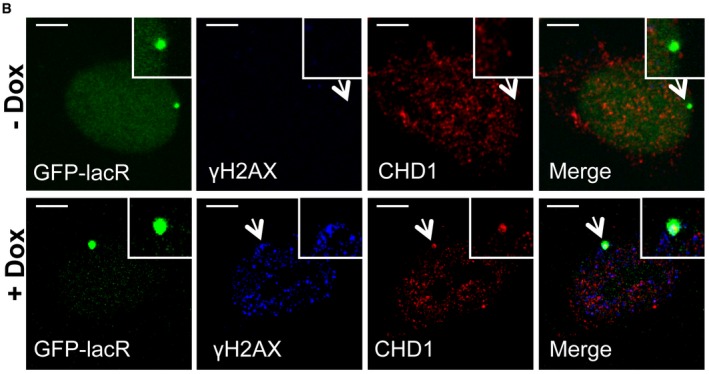
Figure 1B
The authors note that they regret having chosen the incorrect representative image of +Dox in Fig 1B. The experimental setup was similar to Fig EV1B except that the staining was for human CHD1. The I‐SceI expression was induced by Doxycycline which is indicated as Dox in the figure and mentioned in the Materials and Methods (section “Cell culture and siRNA transfection”). The corrected figure is shown here.
Figure 1.

Corrected figure.
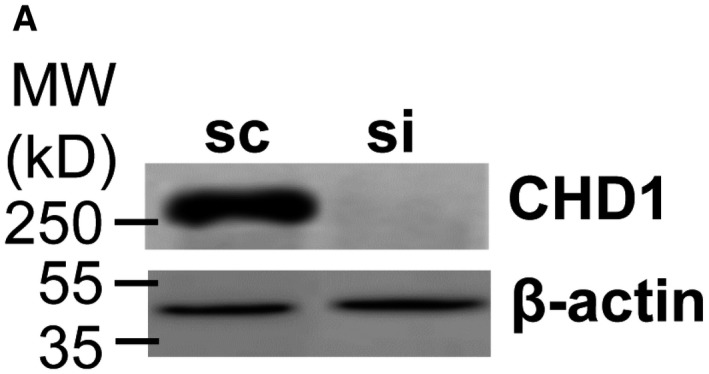
Figure EV3A
The authors declare that they mixed up the source data when preparing Figs EV1E and EV3A, and that the same data were shown twice. Figure EV3A should have shown the knockdown efficiency for CHD1 in HeLa cells. The corrected figure is shown here.
Figure EV3.

Corrected figure. Source data are available online for this figure.
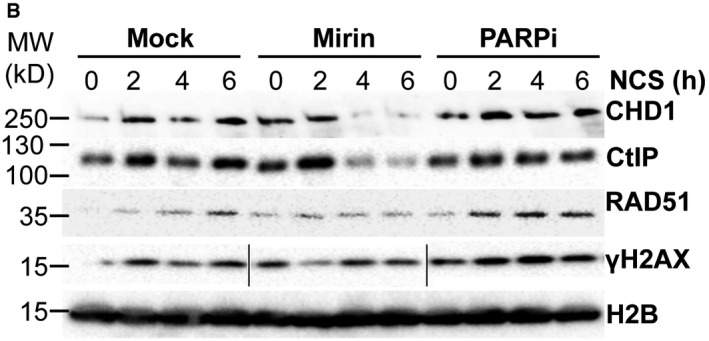
Figure EV5B
The authors declare that they used the same samples on different gels in Fig EV5B, but they state that they used a different loading order for γH2AX than on the other gels, and spliced the gel to match the loading order of the other gels. The authors correct the legend for Fig EV5B to state: “PC3 cells were pretreated with DMSO, mirin (50 μM), or veliparib (20 μM, PARPi) for 1 h prior to NCS treatment for 2, 4, or 6 h. Chromatin fractions were analyzed by Western blot for the recruitment of CHD1, CtIP, RAD51, and γH2AX, which was rearranged to match the loading order of the other gels”. The corrected figure is shown here. The cut bands are highlighted in a box.
Figure EV5.

Corrected figure. Source data are available online for this figure.
Modified figure legends
The same H2B loading controls were used between Figs 1F and 4B (PC3 cells), EV1D and EV4B (VCaP cells), and EV1E and EV4C (U2OS cells). The loading controls belong to each respective pair of experiments and were run at the same time. Therefore, the authors showed the same loading controls across figures without noting this in the figure legends.
Figure EV1C
The authors provided source data for Fig EV1C that show the entire field of the representative images, with an arrow indicating the exact cell represented in the paper. These data are now presented as Appendix Fig S1, and the source data are available in LSM format. The legend for Fig EV1C is updated to state: “PLA with γH2AX/CHD1 or γH2AX/53BP1 in mock or siCHD1 (SmartPool) transfected PC3 cells after 2 h NCS treatment. Scale bar 10 μm. The full field for these cells is shown in the new Appendix Fig S1”.
All authors agree with the statements made. The authors apologize for their oversight and for any confusion that may have been caused.
Supporting information
Appendix
Source Data for Expanded View and Appendix
Associated Data
This section collects any data citations, data availability statements, or supplementary materials included in this article.
Supplementary Materials
Appendix
Source Data for Expanded View and Appendix


