Abstract
Determination of molecular weight parameters of native and, in particular, technical lignins are based on size exclusion chromatography (SEC) approaches. However, no matter which approach is used, either conventional SEC with a refractive index detector and calibration with standards or multi‐angle light scattering (MALS) detection at 488 nm, 633 nm, 658 nm, or 690 nm, all variants can be severely erroneous. The lack of calibration standards with high structural similarity to lignin impairs the quality of the molar masses determined by conventional SEC, and the typical fluorescence of (technical) lignins renders the corresponding MALS data rather questionable. Application of MALS detection at 785 nm by using an infrared laser largely overcomes those problems and allows for a reliable and reproducible determination of the molar mass distributions of all types of lignins, which has been demonstrated in this study for various and structurally different analytes, such as kraft lignins, milled‐wood lignin, lignosulfonates, and biorefinery lignins. The topics of calibration, lignin fluorescence, and lignin UV absorption in connection with MALS detection are critically discussed in detail, and a reliable protocol is presented. Correction factors based on MALS measurements have been determined for commercially available calibration standards, such as pullulan and polystyrene sulfonate, so that now more reliable mass data can be obtained also if no MALS system is available and these conventional calibration standards have to be resorted to.
Keywords: infrared laser, kraft lignin, lignosulfonate, multi-angle light scattering, size exclusion chromatography
Introduction
Although many readers might see it as unnecessary repetition or a waste of their precious time—we still would like to recapitulate the role of lignin as the second most abundant natural polymer and as one of the main constituents of green plants. However, we do this only to emphasize one obvious discrepancy once more: that between lignin's abundance, both in nature and as a product of industrial processes, and its underutilization. Many statements about lignin being “energetically utilized” are confessions that come disguised as proud claims, but we still do not know how to utilize lignin on a large scale more properly than burning it. Apart from the evident structural differences and chemical properties in comparison to cellulose, this utilization aspect also fundamentally distinguishes these two most important organic compounds on earth. Although cellulose is the basis of entire industrial branches and economies worldwide, and every schoolkid will be able to name cellulosic products, lignin still ekes out a shadowy existence in comparison to its bright companion. This limited understanding of lignin is even more reflected in a simple and common confusion regarding the substance itself. The term lignin has usually been used to denote both the natural wood constituent and the technical product, and only recently the term “technical lignins” for the latter type has found its way into pertinent literature. Although we recognize the need of paper mills to be energetically autarkic, we also acknowledge the many efforts worldwide to employ lignin as a source of valuable chemicals. Additionally, we think it is still safe to claim that the vast amounts of technical lignins generated annually by the global pulp and paper industries are still awaiting viable ideas for large‐scale and general utilization.1
The molar mass of natural lignin is largely unknown as no methods exist to extract lignin from biomass without significant modification—mostly degradation—which is especially true for lignin from wood. The understanding of the molar mass of lignin has changed over the last few decades from the concept of a very large molecule2, 3, 4, 5, 6, 7 providing three‐dimensional support for the comparatively flexible cellulose molecule, to the theory of a very low molar mass lignin, where some evidence suggests it consists merely of linear oligomers with not more than approximately ten monomeric units.8 Besides the difficulty of isolating unaltered lignin from lignocellulosic biomass, the correct analysis of the absolute molar mass is the second problem, which has not yet been solved in a general way for most lignins. This issue comes into play in the case of technical lignins in particular, for which the severe structural changes during pulping add to the natural variability of the ligneous starting material and make their structure and molecular weight data even more difficult to assess precisely.
State‐of‐the‐art routine methods for molar mass determination of polymers in mass ranges similar to those approximated for lignin comprise mass spectrometric techniques, such as electrospray ionization mass spectrometry (ESI‐MS) or matrix‐assisted laser desorption/ionization mass spectrometry (MALDI‐MS). These methods also include size exclusion chromatography (SEC, also known by the synonymously used term gel permeation chromatography, GPC) with molar mass sensitive detection that is based either on viscometry and universal calibration or light scattering techniques. Less available techniques, such as ultracentrifugation,9, 10 small‐angle X‐ray scattering, or neutron scattering11, 12 have also been applied.13
MALDI‐MS is unfortunately only applicable to narrow fractions of lignin with low dispersity. In some cases, MALDI was successfully applied to isolated narrow lignin fractions14, 15 but it has not yet evolved into a generally applicable routine method for different types of lignin.16, 17 ESI‐MS also has some inherent problems to grasp lignin as a whole: the analyte cannot be ionized uniformly owing to its rather heterogeneous chemical nature so that usually only smaller fragments are detected, and larger molecules are suppressed. Furthermore, the correct assignment of the detected fraction is still a major challenge if it has just to rely on mass spectra without getting additional input from complementary methods, such as nuclear magnetic resonance (NMR) spectroscopy.18, 19
The classical approach for molar mass determination of lignins is sample fractionation using SEC combined with ultraviolet (UV) or refractive index (RI) detection.20 Because no lignin SEC standards are available, the molar mass is assessed based on narrow polystyrene (PS) standards or PS sulfonate (PSS) standards in the case of lignosulfonates. To avoid any confusion, we would like to point out that polystyrene is insoluble in DMSO, but PSS can be dissolved.21 Our point assumes that, among the suitable standard compounds commercially available, these polymers structurally resemble the lignin molecules most closely. However, applying this calibration approach shows that the hydrodynamic radii of lignin and PSS molecules, which are the basis of the SEC elution behavior, are not sufficiently comparable. This difference results from the different molecular structure and its arrangement in solution and causes considerable deviations between the true lignin molar mass and the values obtained according to the calibration approach.22 Generally, the molar mass determined by SEC with PSS standard calibration leads to significantly underestimated molar mass values compared with those obtained by small‐angle X‐ray (SAXS) and neutron (SANS) scattering techniques.23 Application of viscometry and universal calibration helps to some extent but does not fully overcome this problem, because viscometry is not an absolute method for molar mass determination as molar mass is not measured directly and the universal calibration approach requires the absence of any non‐SEC secondary separation mechanisms.24, 25, 26
Nevertheless, the calibration approach also offers some benefits. SEC with classical calibration is the cheapest available technique to estimate the molar masses of lignins as it requires only one detector, that is, UV or RI, and the calibration standards are readily available from commercial suppliers. In addition, the knowledge of exact molar mass data is often unnecessary in daily work with relative data being sufficient for a comparison of samples.
Application of light scattering, in the most advanced case, multi‐angle light scattering (MALS), allows the determination of absolute molar mass. The term absolute means that there is a theoretically derived relationship between the molar mass and the intensity of light scattered by macromolecules in a diluted solution, meaning no calibration standards are required, and only the specific refractive index increment at chemical equilibrium (dn/dc)μ has to be accurately known. A certain limitation of the MALS technique appears when a sample exhibits UV absorption and fluorescence close to the laser wavelength applied. The latter point is quite important as lignins fluoresce that might cause extremely overestimated values as the fluorescence radiation interferes with the scattered laser light in the MALS detector.27, 28, 29, 30 Some examples are found in literature presenting lignin weight‐average molar masses (M w) up to 400 000 g mol−1 in SEC‐MALS analysis with the overestimation caused by this fluorescence problem.27, 28, 29, 30
If technical lignins from the kraft process are to be analyzed, the errors originating from fluorescence issues become more critical. The process conditions during kraft pulping result in the formation of various chromophores and condensed structures,31 including a broad range of fluorescing moieties (conjugated aromatic and quinoid systems). The fluorescence of these structures covers the whole wavelength range of MALS detectors (488–690 nm). To our knowledge, no mild procedure exists to remove or quench this fluorescence or to prevent the underlying UV absorption, at least not without significantly changing the molar mass distribution of the lignin to be analyzed. The fluorescence interference can be partly reduced by applying narrow bandwidth filters that are transparent only for the light wavelength of the MALS detector. However, the filters do not solve the fluorescence problem completely. The filters have a certain bandwidth of 10 or 20 nm, and thus a part of the fluorescent light from lignin passes through filters at the laser wavelengths available in MALS detectors (488 nm, 633 nm, 658 nm, and 690 nm). This is particularly true for kraft lignins. The MALS instruments with a red laser (633–690 nm) equipped with narrow band filters can be completely sufficient only in case of selected lignosulfonates and mildly extracted lignins, which have a reduced number of fluorescent groups.32, 33, 34, 35
In this paper, we introduce MALS with an infrared (IR) laser as a method of more accurate molar mass determination of lignins. The approach minimizes the fluorescence and absorption issues in a general way, and it works well with all types of lignins and, for the first time, kraft lignins. More exact numbers for molar masses of lignins will not only contribute to our general understanding of lignin structure but evidently are a prerequisite to future lignin utilization efforts. As the infrared MALS instrument might not be readily available in most industrial and academic research labs, we have determined correction factors for commercially available PSS and pullulan standards. These correction factors can now be used together with the conventional calibration‐based approaches to obtain more realistic values for lignin molar masses.
Results and Discussion
Shortcomings and limitations of conventional approaches to molar mass characterization of technical lignins
The most prevalent approach to molar mass characterization of technical lignins, SEC, suffers from one major problem—the absence of reliable calibration standards, that is, standards that are structurally similar to lignin itself. In fact, the standards soluble in DMSO, pullulan, poly(ethylene glycol), poly(methyl methacrylate),22, 36, 37 are linear polymers with hydrodynamic volumes, and therefore elution behavior, that is rather incomparable to the more compact lignin molecules. A contribution of possible non‐SEC separation mechanisms, besides interaction of the lignin with the column packing, must be considered because branched macromolecules have a general tendency of being delayed by anchoring in the pores of SEC packing. As a consequence of such interactions and/or anchoring, the elution may not be governed purely by steric exclusion. Calculated statistical moments of molar mass distributions derived from the calibration with these standards must significantly differ from the (unknown) true values. Up to now, it was impossible to improve the existing methodology because narrow molar mass lignin standards have been simply not available commercially.
Other polymers with somewhat higher structural similarity to technical lignin, such as sodium poly(styrene sulfonate) (Na‐PSS) as a calibrant for lignosulfonates, cannot always be easily implemented in SEC characterization owing to their limited solubility in the most commonly utilized organic mobile phases. Recently, a simple protocol employing a Na‐PSS protonation procedure has been proposed allowing for the complete dissolution of protonated PSS in DMSO.21 Considering that DMSO is a universal solvent system capable of dissolving almost all lignin types, the SEC setup with DMSO as the eluent and PSS‐based calibration represents a reasonable approach to lignosulfonate characterization. However, the errors in lignin molar mass calculations, as a result of the structural dissimilarities between calibrant and analyte, remain quite large.1, 32 This can easily be visualized by superimposing the molar mass versus elution volume plots of synthesized lignin model compounds and PSS standards (Figure 1).
Figure 1.
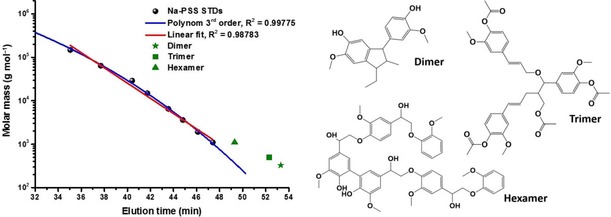
Illustration of the difference in the elution behavior between oligomeric lignin model compounds and Na‐PSS standards.
As shown in Figure 1, the use of PSS‐based calibration always results in an underestimation of the true lignin molar masses, independent of the regression curves applied to fit the data to the standards. Nevertheless, it must be admitted that despite the complications, calibration with standards is still the method of choice for molar mass characterization of lignins, simply because of the lack of better alternatives that would be able to provide more precise results.
The determination of the molar mass of polymers absorbing incident light and emitting fluorescence
Lignin samples, in particular, technical lignins, show absorption of light in the ultraviolet and the visible (Vis) range as well as a broad fluorescence, almost independent of the excitation wavelength. The absorption of laser light by the sample analyzed in a light scattering experiment—or in MALS—distorts the outcome by underestimating the amount of scattered light and calls for a correction. To decide if the sample absorbs light, the signal of the laser forward monitor (FM) of the detector can serve as an indicator and correction tool. While the laser monitor (LM) reports the intensity of the incident laser energy, the FM measures the light intensity after the flow cell. For non‐absorbing samples, the outputs of LM and FM are ideally the same whereas absorbing samples reduce the light intensity available for light scattering. This is shown in Figure 2 for a typical lignin sample (kraft lignin) measured with two different MALS detectors operating at 658 nm and 785 nm. The absorption of the incident light is visible from the signal of FM. In the case of infrared light (785 nm), the absorption is significantly lower although not completely eliminated.
Figure 2.
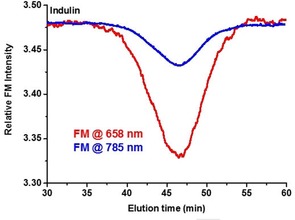
Signals of the FM recorded upon analysis of a kraft lignin sample (Indulin) with MALS detectors operating at 658 nm (red line) and in the infrared region at 785 nm (blue line).
In the case of a UV/Vis‐active sample, a part of the incident energy is absorbed, and the light energy inducing scattering is thus lower compared with the non‐absorbing polymers. Consequently, the intensity of the scattered light is also reduced, and the molar mass calculated from the scattering intensity is underestimated. Correction for changed light intensities is automatically affected in the case of MALS detectors used in this study. Changes in laser flux are monitored by the LM, and changes induced by the analytes’ light absorption are reported by the FM. Relating the diminished intensity of scattered light, in the case of absorbing samples, to the full laser power would result in underestimated deduced values. Note that in the case of highly absorbing samples, the scattering signal can be severely reduced or even completely disappear if it is related to the LM only, but not the FM. Therefore, in the case of light‐absorbing samples, the scattered light intensity must be based on the intensity of the FM, that is, the detector positioned after the flow cell. This way the loss of the incident energy is compensated for, and the scattering intensity is related to the light intensity decreased by sample absorption (Figure 3). For samples that do not absorb incident light, the results obtained with and without consideration of the FM are virtually identical. Figure 3, left, shows this effect for a non‐absorbing milled‐wood lignin (MWL) sample.
Figure 3.
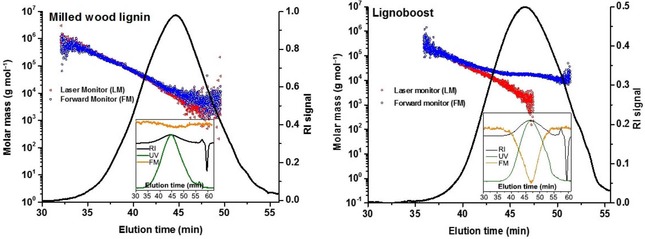
Effect of using the LM and FM in MALS detection. Left: A non‐absorbing sample (pine milled‐wood lignin) . Results based on LM and FM are largely identical. Right: Lignoboost kraft lignin with absorption at 785 nm. Usage of the LM alone produces faulty results because of sample absorption, which can be compensated for by using the FM. Insets show the absorption in relation to the corresponding RI peak.
Absorption of incident light may not necessarily indicate the occurrence of fluorescence, but if present, the intensity of fluorescent light may be markedly higher than that of scattered light itself, which results in an overestimation of molar mass. There are two ways of eliminating fluorescence. They are: (i) fluorescence filters transparent solely for the wavelength of the incident light (±10 nm) and (ii) by using a MALS detector operating at a wavelength that does not induce the fluorescence.
The UV/Vis absorption of lignin reaches a maximum at 280 nm and slowly decreases with higher wavelengths. It is still significant in the region of 650–660 nm, and further drops towards the infrared region. Fluorescence emission by excitation through the laser used for the MALS measurement follows the same trend, becoming less intense with increasing excitation wavelengths. Using higher laser wavelengths thus implies smaller fluorescence effects.
It should be mentioned that the approach of increasing the laser wavelength to get less fluorescence distortion is not completely new in lignin analysis. It has been utilized in Raman spectroscopy, where a near‐IR laser source with photon energy below the electronic transition energy of lignin helped to resolve problems related to lignin fluorescence.38
The efficiency of the methods for fluorescence suppression, that is, fluorescence narrow band filters and infrared laser, is demonstrated in Figure 4, which shows a typical lignin MALS measurement affected by fluorescence.
Figure 4.
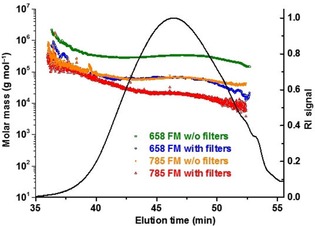
Molar mass vs. elution time plots of a kraft lignin (Indulin AT) measured with different MALS systems: MALS at 658 nm without filters (green), MALS at 658 nm equipped with fluorescence filters (blue), MALS with an infrared laser at 785 nm without filters (orange), and MALS at 785 nm with filters (red). The RI chromatogram is shown as an overlay (black curve).
From Figure 4, it is evident that the molar mass versus elution time plots tend towards lower molar masses from the laser at 658 nm with no fluorescence filters to the infrared laser with fluorescence filters. An interesting finding is that the molar mass plots roughly overlap at the very beginning of the chromatograms (except for the 658 nm laser without filters). This overlap can be explained as follows: the intensity of fluorescence is directly proportional to the concentration of eluting molecules whereas the intensity of the scattered light is directly proportional to the product of concentration times molar mass. At the very beginning of the chromatogram, where the concentration of eluting molecules is low but their molar mass is high, the scattered light dominates, and fluorescence effects are very minor. The molar masses are correct or just slightly affected by the fluorescence. With increasing elution time, the concentration increases whereas the molar mass decreases and thus the fluorescence becomes increasingly prominent and the molar masses are increasingly overestimated. As a consequence, the z‐average molar mass (Mz), which emphasizes the fractions with high molar mass, can be expected to be the most accurate molar mass moment of fluorescent polymers measured by MALS.
Another conclusion from Figure 4 is that the minimum molar mass at the end of the chromatogram acquired with the infrared MALS equipped with filters is approximately 104 g mol−1. According to the elution times of model lignin molecules shown in Figure 1, one would expect molar mass values on the order of several hundred g mol−1 at the end of a chromatogram. This suggests that the effect of fluorescence is not fully eliminated, not even in the case of the infrared laser equipped with fluorescence filters.
The fact that the molar masses at the beginning of the chromatogram are not affected by the fluorescence can now be used for an extrapolation of the molar mass versus elution time plot and thus an approximation of the true molar mass distribution. As the extrapolation is an uncertain procedure, the elution position of a standard compound, such as one of the model lignin oligomers shown in Figure 1, can be used as a test for the quality of the extrapolation. The extrapolation procedure is demonstrated in Figure 5 for the Indulin sample.
Figure 5.
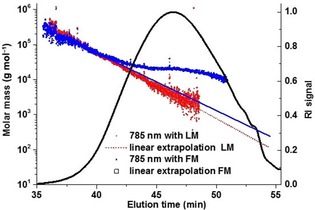
Molar mass distribution of a kraft lignin (Indulin AT) measured on a MALS with an infrared laser (785 nm) with LM and FM. Additional correction by extrapolation from the high molar mass region was applied to both methods, LM measurement (dotted line) and FM measurement (solid line). The RI chromatogram is shown as an overlay (black curve).
Using the FM instead of the LM results in markedly less linear plots in the bulk part of the distribution, indicating that the fluorescence of Indulin is not even fully eliminated with an infrared laser and filters (Figure 5, red line).
The cumulative molar mass distribution plots corresponding to the plots in Figures 4 and 5 are given in Figure 6. The distribution curves overlap at the region of very high molar masses no matter what setup was used for the measurement, which proves that the lignin samples contain fractions with molar masses up to approximately 106 g mol−1. On the other hand, the distribution proves the presence of much smaller molecules with molar masses around 103 g mol−1 as expected.
Figure 6.
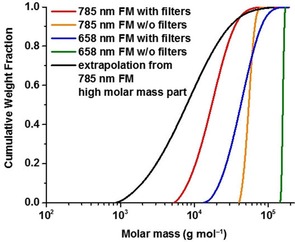
Cumulative molar mass distribution plots of Indulin AT measured with different MALS systems: 658 nm without filters (green), at 658 nm equipped with fluorescence filters (blue), at 785 nm without filters (orange), and at 785 nm with filters (red), and MALS at 785 nm with filters, FM and extrapolation according to Figure 4 (black). The molar mass averages from extrapolated data are shown in Table 2.
Figure 7 shows the molar mass versus elution time plots of different lignin samples including a model lignin (dehydrogenation polymer; DHP), which was synthesized by enzymatically induced dehydrogenative polymerization of lignin precursor compounds. We have used DHP based on coniferyl alcohol to have a polymeric, non‐fluorescent lignin model at hand. The DHP is prepared under very mild, ambient conditions avoiding extreme pH and temperatures. The overlap of the plots for the model DHP and milled‐wood lignin indicates that for only slightly fluorescent lignins, such as milled‐wood lignin, the infrared MALS with fluorescence filters is fully sufficient to completely reduce fluorescence effects. For strongly fluorescent samples, such as Indulin, the data indicate that the regions of medium and long elution times are affected by the residual fluorescence, and only the extrapolation procedure yields correct results. Other lignins, such as soda lignin, Organosolv (OSL), or even lignosulfonates (LS) yield curves not extremely different from kraft lignin or milled‐wood lignin (MWL).
Figure 7.
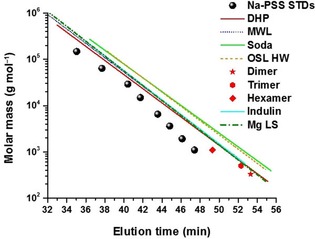
Comparison of calibration lines derived from SEC‐MALS (785 nm) with the extrapolation approach for different lignin types in comparison to the PSS standards and lignin model compounds. Data for lignin dimers and oligomers are given as single dots.
Determination of the refractive index (RI) increment (dn/dc)μ
The application of MALS detection to any polymer requires a correct refractive index increment at chemical equilibrium (dn/dc)μ. The dn/dc number is a discrete value for a given polymer in a given solvent at a certain wavelength of measurement. The precise knowledge of dn/dc is essential for the accurate determination of the molar mass by MALS because this value is part of the Zimm equation, which is the basis of calculating the weight‐average molar mass. However, the dn/dc determination at 785 nm is challenging owing to the absence of commercially available RI detectors operating at this wavelength. Therefore, the analysis of the dn/dc values for lignin samples was carried out at 658 nm. Data on wavelength dependence of dn/dc are available in the literature for several polymers39, 40, 41 and protein42, 43 systems. For all examined samples, the dn/dc was shown to be dependent on the reciprocal square of the wavelength according to the Cauchy relation: dn/dc=A+B/λ 2, with A and B being constants.
According to this equation, variations in dn/dc values are smaller at higher wavelengths, as large λ values result in a low absolute (B/λ 2) parameter. This leads to just a few‐percent difference (1–3 %) between the values measured with lasers operating in red and infrared regions. In the case of online MALS measurements, small changes of x % in dn/dc cause the same x % error in the calculated molar masses.44, 45 Therefore, the possible errors in a calculated M w originating from the dn/dc inaccuracy in this study are considered to be non‐significant.
To minimize possible errors in the calculation of statistical moments, we determined the dn/dc value for each type of lignin prior to analysis in the SEC‐MALS systems. The (dn/dc)μ values were determined by using the online approach (based on 100 % sample mass recovery from the columns), and the accuracy of the injection system was determined independently. The SEC columns, in this case, play the role of a “dialysis chamber”, and the (dn/dc)μ values determined from the RI peak are equivalent to those obtained according to the offline dialysis approach.46, 47 The results of the measurements are shown in Table 1.
Table 1.
The (dn/dc)μ of different lignin samples in DMSO/LiBr (0.5 %).
| Sample | (dn/dc)μ [a] [mL g−1] |
|---|---|
| Indulin AT | 0.1515 |
| Lignoboost | 0.1550 |
| Soda Sarkanda | 0.1503 |
| OSL HW | 0.1394 |
| OSL Alcell | 0.1666 |
| Ammonium LS | 0.1352 |
| Magnesium LS | 0.1349 |
| Sodium LS | 0.1187 |
| MWL | 0.1050 |
| DHP | 0.1179 |
[a] From 100 % mass recovery.
From our measurements of different technical lignins, a certain “clustering” of the (dn/dc)μ values was evident (Table 1), the main factor of influence being the pulping process by which the lignins were obtained. Different kraft lignins (Lignoboost and Indulin) yield very similar (dn/dc)μ values, also all lignosulfonates from different processes fall in a similar range. DHP and MWL, on the other hand, differed significantly from the technical lignins, and so did the grass lignin (Soda Sarkanda). However, Organosolv lignins (OSL HW or OSL Alcell) did not show a good agreement in their (dn/dc)μ, reflecting that conditions and media of their production must have been rather different.
The (dn/dc)μ—being a constant for a polymer at otherwise constant conditions—can well be different for very low molecular weight fractions or oligomers of that chemical species.48 As technical lignins represent complex heterogeneous systems, which often contain a large portion of degraded lignin macromolecules with low molar masses, the dn/dc values were measured for different lignin fractions isolated by ultrafiltration. The results of the measurements demonstrate that the (dn/dc)μ value increases significantly up to a molar mass of about 2000 g mol−1, and stays constant above this mass range (Figure 8). Complete lignin samples are rare to have molar masses below this critical value although fractions of such low molar mass might be contained. In practice, this (dn/dc)μ effect will only become prominent when the lignin sample is very degraded and low in overall molar mass. In all other cases, the molar mass extrapolation from the high molar mass end will compensate for (dn/dc)μ changes in the low molar mass region.
Figure 8.
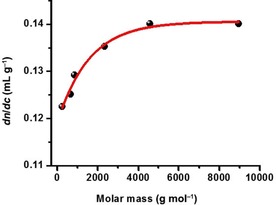
Dependency of the (dn/dc)μ on the molar mass of lignin fractions. Example shows lignin fractions obtained from a kraft lignin by ultrafiltration.
The repeatability of the SEC‐MALS 785 nm measurements was tested by repeated injections of various lignin samples over the period of one week. The tests showed only negligible changes in the calculated molar masses (M w=14 100±500 g mol−1, M n=6000±300 g mol−1 for Indulin; M w=33 000±600 g mol−1, M n=1700±300 g mol−1 for sodium LS), demonstrating a good system stability (Figure S1 in the Supporting Information).
In summary, the SEC‐MALS 785 nm approach combined with fluorescence filters and extrapolation down from high molar masses can be considered as the most accurate method for the molar mass analysis of technical lignins currently available. Table 2 provides example data of several technical lignins analyzed according to this approach. In addition to various lignin samples, Table S1 in the Supporting Information lists molar mass averages obtained for several fractions of a kraft lignin obtained by ultrafiltration. The molar mass averages determined by MALS at the wavelength of 658 nm, which has been commonly used so far, and those obtained by conventional SEC calibrated with sulfonated polystyrene are also listed there for the sake of comparison.
Table 2.
Molar mass averages for different lignin types measured by SEC‐MALS at 785 nm with fluorescence filters and absorption correction.
| Sample | M n [103 g mol−1] | M w [103 g molM‐>1] | M z [103 g mol−1] | M w/M n |
|---|---|---|---|---|
| Indulin AT | 6.0 | 14 | 42 | 2.4 |
| LignoBoost | 3.4 | 16 | 42 | 3.8 |
| Soda Sarkanda | 3.6 | 19 | 59 | 5.3 |
| OSL HW | 3.3 | 10 | 25 | 3.1 |
| Ammonium LS | 6.7 | 55 | 319 | 8.1 |
| Magnesium LS | 6.2 | 44 | 172 | 7.1 |
| Sodium LS | 1.7 | 33 | 1204 | 19.7 |
| MWL | 5.5 | 27 | 127 | 4.9 |
| DHP | 4.8 | 26 | 160 | 5.5 |
| Biolignin | 3.0 | 187 | 1956 | 62.3 |
Correction factors for conventional calibration curves obtained from commercial standards
Based on the results of this paper, the most appropriate and accurate way of determining the molar masses of lignins and technical lignins is the use of a MALS detector equipped with a 785 nm laser applying an elaborated procedure, which in some places might be regarded as overly complex or too tedious. Also, the required equipment will not be available in every laboratory although it finds its way also into lignin laboratories.49 To make the advantages of the method—better accuracy and avoidance of known error sources—generally available, we propose correction factors for conventional calibrations (which are based on commercially available, but less suitable standards). This way the accuracy of the current MALS 785 nm measurements can also be reached if such a MALS 785 nm is not at hand. These calibrations might be useful for many laboratories dealing with lignin characterization or lignin chemistry because the established calibration methods can be used further on and running systems do not have to be changed whereas their inherent errors are minimized by the application of the correction factors. To use the correction factors, the same eluent, that is, DMSO with 0.5 % LiBr, has to be used on a similar set of columns with comparable column material.
The correction was performed based on the results for a kraft lignin (Indulin AT) as it is very well characterized and a representative type of technical lignin, and for MWL. To allow for a correction of the conventional calibration curves through the MALS 785 nm data, Equation (1) was solved for PSS and pullulan, the calibration standards soluble in the eluent system. Such correcting correlations of MALS data to standards were also shown to be efficient for cellulose.50, 51 Figure 9 provides a graphical representation of the corrected calibration for PSS and pullulan. The correction factors obtained, q and p [Eq. (1)], for different standards as well as M w correction factors for different calibrations are shown in Table 3.
| (1) |
Figure 9.
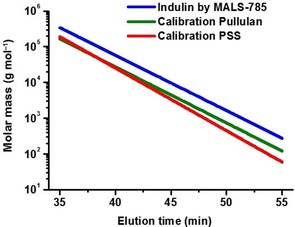
Correction of conventional PSS and pullulan calibration curves by correction factors based on MALS 785 nm measurements of Indulin lignin.
Table 3.
Correction factors (by MALS 785 nm) for conventional calibrations based on PSS and pullulan and resulting corrected molar mass values for kraft lignin (Indulin).
| Correction factor | PSS | Pullulan |
|---|---|---|
| q factor | 1.523 | 0.915 |
| p factor | 0.771 | 1.103 |
| slope of linear calibration | −0.17 | −0.16 |
| intercept of linear calibration | 11.42 | 10.71 |
The errors produced with conventional calibrations can be estimated this way. However, any linear calibration function to derive molar mass values can be corrected similarly by the implementation of the correction factors given in Table 3.
The correction of the PSS‐derived calibration data to available oligomeric model compounds is not feasible owing to the absence of high molar mass lignin model structures. An attempt to perform corrections of PSS‐derived calibration considering just the available oligomeric substances would introduce an additional deviation of the outcome values rather than making them more precise.52
Conclusions
The current way of MALS detection at laser wavelengths of 488 nm, 633 nm, 658 nm, or 690 nm cannot be considered a reliable approach to the molar mass determination of technical lignins, and in particular, not for highly fluorescent and UV/Vis absorbing kraft lignins. Although sample absorption can be efficiently counteracted by using the FM of the MALS devices, there is currently no way to eliminate the effects of lignin fluorescence that severely distorts the MALS results. Lignin fluorescence was seen to be less pronounced in the very high molar mass part of all lignins, but severe in the low and medium molecular weight ranges.
A SEC‐MALS system with an infrared laser operating at 785 nm and using fluorescence filters elegantly overcomes this problem and provides reliable results for all different types of lignins, including kraft lignins, which are notoriously troublesome regarding fluorescence and absorption. Any residual fluorescence can be corrected for by extrapolation of the molar mass data from the beginning of the chromatogram (high molar mass range) towards the end of the chromatogram (medium and low molar mass range). The absorption problem can be eliminated by referencing with the FM. Thus, the optimized method was shown to have higher accuracy, leading to molar mass values, which are closer to reality than those from any current alternative.
The present study also addressed the inaccuracy resulting from the structural dissimilarity between technical lignin samples and the calibration standards used to calculate the molar mass parameters from RI detection. Correlation factors for commercially available PSS and pullulan standards were calculated based on the molar masses measured by the SEC‐MALS 785 nm approach. These standards now allow for obtaining more reliable data also if no MALS system is available and classical calibration techniques have to be resorted to. Chemical modification and derivatizations of lignins can have a strong effect on the corresponding hydrodynamic radius for this case a direct analysis by SEC‐MALS will be the method of choice.
In general, the molar mass of technical lignins is higher than previous data from calibration with standards suggested, although it ranged in the same order of magnitude. Auto‐fluorescence of lignins upon conventional MALS detection produces severely overestimated molecular weight values, a danger that has now been eliminated with the MALS 785 nm approach. With the current study, we hope to place a general and reliable characterization method for the molecular weight of natural and technical lignins at the analytical chemists’ disposal—and for the first time—a method undisturbed by fluorescence and independent of calibration with non‐lignin‐like standards.
We are very positive about presenting the SEC‐MALS system to become a standard tool in lignin characterization, especially when considering the skyrocketing interest in technical lignins in connection with worldwide attempts of lignin utilization in biorefinery scenarios.
Experimental Section
Chemicals and lignin samples
The following chemicals were obtained from Sigma–Aldrich Handels GmbH, Darmstadt, Germany: LS lignosulfonic acid sodium salt (average M w≈54 000, M n≈6000 g mol−1), lithium bromide (≥99 %), and dimethyl sulfoxide (HPLC grade). PSS sodium salt and pullulan standards were obtained from Polymer Standard Service (PSS, Mainz, Germany). Technical lignin samples were kindly provided by associated companies: two softwood kraft lignins—Indulin AT (MeadWestvaco Corp., USA), Lignoboost (Innventia/RISE, Sweden), and soda lignin—Sarkanda (Granit S.A., Switzerland); two Organosolv lignins—OSL HW, hardwood (Fraunhofer CBP, Germany), and OSL Alcell, mixed hardwood (Repap, Canada); two lignosulfonates from different sulfite processes—Ammonium LS (Borregaard, Norway) and Magnesium spruce LS (Lenzing, Austria). Biolignin is based on wheat straw Organosolv processing (CIMV, France). Purified pine milled wood lignin (MWLp) was extracted according to the original procedure53 and purified according to the protocol described by Balakshin et al.54 DHP and trimer as side products of coniferyl alcohol polymerization were obtained according to the literature.55 A hexameric lignin model compound was obtained according to Kilpeläinen et al.56
Sample preparation for SEC analysis
All lignin samples as well as standards were dissolved in DMSO/LiBr (0.5 % w/v) at 10 mg mL−1, shaken overnight, and filtered through a 0.45 μm PTFE filter prior to analysis. In case of lignosulfonates, the samples were purified by means of adsorption on XAD‐7 resin.57 Solubilization of PSS standards in DMSO was achieved by pretreatment with cation‐exchange resin according to literature.21
SEC‐MALS instrumental setup
SEC analysis was performed by using an Ultimate 3000 autosampler, column oven, UV detector (all Thermo Fisher Scientific Inc., Waltham, MA, USA) equipped with a Dionex HPLC Pump Series P580 (Dionex Softron GmbH, Germering, Germany), Dawn HELEOS I MALS detectors with lasers operating at either 658 or 785 nm, and an Optilab T‐rEX differential refractive index detector, λ=633 nm (all Wyatt Technology, Santa Barbara, CA, USA). Both MALS detectors were equipped with 18 photodiodes at different measuring angles, with narrow band pass filters (±10 nm for the respective wavelength used, installed on every second photodiode). The separation was performed with an Agilent PolarGel M guard column (7.5×50 mm) and three PolarGel M columns 7.5×300 mm (5 μm particle size). The columns were kept at 35 °C. The SEC system was operated under the following conditions: 0.5 mL min−1 flow rate; 10 μL injection volume; 65 min run time. Data evaluation used ASTRA software, version 6.1.
Determination of (dn/dc)μ values
The determination of the specific refractive index increment at a constant chemical potential (dn/dc)μ of lignin samples in DMSO/LiBr (0.5 % w/v) was performed by using the online approach by integration of the RI peak area after sample elution from the columns assuming 100 % sample mass recovery. The actual volume injected by the autosampler used was measured by Rhodamine B UV dye and an external calibration curve.
Conflict of interest
The authors declare no conflict of interest.
Supporting information
As a service to our authors and readers, this journal provides supporting information supplied by the authors. Such materials are peer reviewed and may be re‐organized for online delivery, but are not copy‐edited or typeset. Technical support issues arising from supporting information (other than missing files) should be addressed to the authors.
Supplementary
Acknowledgements
We would like to gratefully acknowledge the financial support of the “FLIPPR” project, supported by the Austrian Research Promotion Agency, FFG, and the associated companies SAPPI, MONDI, Heinzel Pulp, and Norske Skog. Dr. Scherrers (Wyatt Technology Europe, Dernbach, Germany) is acknowledged for technical support and Dr. Oberlerchner, BOKU, for fruitful discussions. The authors would like to thank Dr. M. Balakshin, BOKU and Aalto University, Finland, for providing the MWL sample.
G. Zinovyev, I. Sulaeva, S. Podzimek, D. Rössner, I. Kilpeläinen, I. Sumerskii, T. Rosenau, A. Potthast, ChemSusChem 2018, 11, 3259.
Contributor Information
Prof. Thomas Rosenau, Email: thomas.rosenau@boku.ac.at.
Prof. Antje Potthast, Email: antje.potthast@boku.ac.at
References
- 1. Rinaldi R., Jastrzebski R., Clough M. T., Ralph J., Kennema M., Bruijnincx P. C. A., Weckhuysen B. M., Angew. Chem. Int. Ed. 2016, 55, 8164–8215; [DOI] [PMC free article] [PubMed] [Google Scholar]; Angew. Chem. 2016, 128, 8296–8354. [Google Scholar]
- 2. Freudenberg K., Nature 1959, 183, 1152–1155. [DOI] [PubMed] [Google Scholar]
- 3. Glasser W. G., Glasser H. R., Macromolecules 1974, 7, 17–27. [Google Scholar]
- 4. Nimz H., Angew. Chem. Int. Ed. Engl. 1974, 13, 313–321; [Google Scholar]; Angew. Chem. 1974, 86, 336–344. [Google Scholar]
- 5. Adler E., Wood Sci. Technol. 1977, 11, 169–218. [Google Scholar]
- 6. Sakakibara A., Wood Sci. Technol. 1980, 14, 89–100. [Google Scholar]
- 7. Ralph J., Lundquist K., Brunow G., Lu F., Kim H., Schatz P. F., Marita J. M., Hatfield R. D., Ralph S. A., Christensen J. H., Boerjan W., Phytochem. Rev. 2004, 3, 29–60. [Google Scholar]
- 8. Crestini C., Melone F., Sette M., Saladino R., Biomacromolecules 2011, 12, 3928–3935. [DOI] [PubMed] [Google Scholar]
- 9. Obiaga T. I., Wayman M., J. Appl. Polym. Sci. 1974, 18, 1943–1952. [Google Scholar]
- 10. Harding S. E., Adams G. G., Almutairi F., Alzahrani Q., Erten T., Kök M. S., Gillis R. B. Methods in Enzymology, 2015, 562, 391–439. [DOI] [PubMed] [Google Scholar]
- 11. Vainio U., Maximova N., Hortling B., Laine J., Stenius P., Simola L. K., Gravitis J., Serimaa R., Langmuir 2004, 20, 9736–9744. [DOI] [PubMed] [Google Scholar]
- 12. Salentinig S., Schubert M., Biomacromolecules 2017, 18, 2649–2653. [DOI] [PubMed] [Google Scholar]
- 13. Gidh A. V., Decker S. R., Vinzant T. B., Himmel M. E., Williford C., J. Chromatogr. A 2006, 1114, 102–110. [DOI] [PubMed] [Google Scholar]
- 14. Jacobs A., Dahlman O., Nord. Pulp Pap. Res. J. 2000, 15, 120–127. [Google Scholar]
- 15. Rönnols J., Jacobs A., Aldaeus F., Holzforschung 2017, 71, 563–570. [Google Scholar]
- 16. Mattinen M.-L., Suortti T., Gosselink R., Argyropoulos D. S., Evtuguin D., Suurnäkki A., de Jong E., Tamminen T., BioResources 2008, 3, 549–565. [Google Scholar]
- 17. Richel A., Vanderghem C., Simon M., Wathelet B., Paquot M., Anal. Chem. Insights 2012, 7, 79–89. [DOI] [PMC free article] [PubMed] [Google Scholar]
- 18. Evtuguin D. V., Domingues P., Amado F. L., Neto C. P., Correia A. J. F., Holzforschung 1999, 53, 525–528. [Google Scholar]
- 19. Banoub J. H., Benjelloun-Mlayah B., Ziarelli F., Joly N., Delmas M., Rapid Commun. Mass Spectrom. 2007, 21, 2867–2888. [DOI] [PubMed] [Google Scholar]
- 20. Gellerstedt G. in Methods in Lignin Chemistry (Eds.: S. Y. Lin, C. W. Dence) Springer, Berlin, 1992, pp. 487–497. [Google Scholar]
- 21. Sulaeva I., Zinovyev G., Plankeele J.-M., Sumerskii I., Rosenau T., Potthast A., ChemSusChem 2017, 10, 629–635. [DOI] [PubMed] [Google Scholar]
- 22. Ringena O., Lebioda S., Lehnen R., Saake B., J. Chromatogr. A 2006, 1102, 154–163. [DOI] [PubMed] [Google Scholar]
- 23. Harton S. E., Pingali S. V., Nunnery G. A., Baker D. A., Walker S. H., Muddiman D. C., Koga T., Rials T. G., Urban V. S., Langan P., ACS Macro Lett. 2012, 1, 568–573. [DOI] [PubMed] [Google Scholar]
- 24. Glasser W. G., Davé V., Frazier C. E., J. Wood Chem. Technol. 1993, 13, 545–559. [Google Scholar]
- 25. Dong D., Fricke A. L., Polymer 1995, 36, 2075–2078. [Google Scholar]
- 26. Qushmua E. A., Gary G. A., Richard B. G., Tabot M. D. B., Kök M. S., Fong E., Richard A. H., van Dam Jan E. G., Gosselink R. J. A., Arthur J. R., Harding S. E., Holzforschung 2016, 70, 117–125. [Google Scholar]
- 27. Merkle G., Auerbach S., Burchard W., Lindner A., Wegener G., J. Appl. Polym. Sci. 1992, 45, 407–415. [Google Scholar]
- 28. Mikame K., Funaoka M., Polym. J. 2006, 38, 592–596. [Google Scholar]
- 29. Demesa A. G., Laari A., Turunen I., Sillanpää M., Chem. Eng. Technol. 2015, 38, 2270–2278. [Google Scholar]
- 30. Kouisni L., Paleologou M., Gagné A., Landry E., Romeh A. A., Alassuity A. S., Al-Hakim A. in Proceedings the 6th Nordic Wood Biorefinery Conference (Ed.: E. Hytönen), VTT Technical Research Centre of Finland Ltd, Helsinki, 2015, pp. 289–294. [Google Scholar]
- 31. Falkehag S. I., Marton J., Adler E., Adv. Chem. Ser. 1966, 59, 75–89. [Google Scholar]
- 32. Fredheim G. E., Braaten S. M., Christensen B. E., J. Chromatogr. A 2002, 942, 191–199. [DOI] [PubMed] [Google Scholar]
- 33. Braaten S. M., Christensen B. E., Fredheim G. E., J. Wood Chem. Technol. 2003, 23, 197–215. [Google Scholar]
- 34. Contreras S., Gaspar A. R., Guerra A., Lucia L. A., Argyropoulos D. S., Biomacromolecules 2008, 9, 3362–3369. [DOI] [PubMed] [Google Scholar]
- 35. Qian Y., Deng Y., Guo Y., Yi C., Qiu X., Holzforschung 2013, 67, 265–271. [Google Scholar]
- 36. Asikkala J., Tamminen T., Argyropoulos D. S., J. Agric. Food Chem. 2012, 60, 8968–8973. [DOI] [PubMed] [Google Scholar]
- 37. Dong D., Fricke A. L., J. Appl. Polym. Sci. 1993, 50, 1131–1140. [Google Scholar]
- 38. Larsen K. L., Barsberg S., J. Phys. Chem. B 2010, 114, 8009–8021. [DOI] [PubMed] [Google Scholar]
- 39. Carlfors J., Rymdén R., Eur. Polym. J. 1982, 18, 933–937. [Google Scholar]
- 40. Coto B., Escola J. M., Suárez I., Caballero M. J., Polym. Test. 2007, 26, 568–575. [Google Scholar]
- 41. Huglin M. B., O'Donohue S. J., Radwan M. A., Eur. Polym. J. 1989, 25, 543–547. [Google Scholar]
- 42. Zhao H., Brown P. H., Schuck P., Biophys. J. 2011, 100, 2309–2317. [DOI] [PMC free article] [PubMed] [Google Scholar]
- 43. Perlmann G. E., Longsworth L. G., J. Am. Chem. Soc. 1948, 70, 2719–2724. [DOI] [PubMed] [Google Scholar]
- 44. Striegel A. M., Chromatographia 2017, 80, 989–996. [DOI] [PMC free article] [PubMed] [Google Scholar]
- 45. Podzimek S. in Light Scattering, Size Exclusion Chromatography and Asymmetric Flow Field Flow Fractionation, Wiley, Hoboken, 2011, pp. 37–98. [Google Scholar]
- 46. Berkowitz S. A., J. Liq. Chromatogr. 1983, 6, 1359–1373. [Google Scholar]
- 47. Brüssau R., Goetz N., Mächtle W., Stölting J., Tenside Surfactants Deterg. 1991, 28, 396–496. [Google Scholar]
- 48.“Synthetic Polymers”: Mori S., Barth H. G. in Size Exclusion Chromatography (Eds.: S. Mori, H. G. Barth), Springer, Berlin, 1999; pp. 131–153. [Google Scholar]
- 49. Singh R., Hu J., Regner M. R., Round J. W., Ralph J., Saddler J. N., Eltis L. D., Sci. Rep. 2017, 7, 42121. [DOI] [PMC free article] [PubMed] [Google Scholar]
- 50. Berggren R., Berthold F., Sjöholm E., Lindström M., J. Appl. Polym. Sci. 2003, 88, 1170–1179. [Google Scholar]
- 51. Oberlerchner J. T., Vejdovszky P., Zweckmair T., Kindler A., Koch S., Rosenau T., Potthast A., J. Chromatogr. A 2016, 1471, 87–93. [DOI] [PubMed] [Google Scholar]
- 52. Lange H., Rulli F., Crestini C., ACS Sustainable Chem. Eng. 2016, 4, 5167–5180. [Google Scholar]
- 53. Bjorkman A., Sven. Papperstidn. 1965, 59, 477–485. [Google Scholar]
- 54. Balakshin M., Capanema E., Gracz H., Chang H. M., Jameel H., Planta 2011, 233, 1097–1110. [DOI] [PubMed] [Google Scholar]
- 55. Cathala B., Saake B., Faix O., Monties B., J. Chromatogr. A 2003, 1020, 229–239. [DOI] [PubMed] [Google Scholar]
- 56. Kilpeläinen I., Tervilä-Wilo A., Peräkylä H., Matikainen J., Brunow G., Holzforschung 1994, 48, 381–386. [Google Scholar]
- 57. Sumerskii I., Korntner P., Zinovyev G., Rosenau T., Potthast A., RSC Adv. 2015, 5, 92732–92742. [Google Scholar]
Associated Data
This section collects any data citations, data availability statements, or supplementary materials included in this article.
Supplementary Materials
As a service to our authors and readers, this journal provides supporting information supplied by the authors. Such materials are peer reviewed and may be re‐organized for online delivery, but are not copy‐edited or typeset. Technical support issues arising from supporting information (other than missing files) should be addressed to the authors.
Supplementary


