

Abstract
The oxidation of montelukast is mainly mediated by cytochrome P450 (CYP) 2C8, but other mechanisms may contribute to its disposition. In healthy volunteers, we investigated the effects of two widely used P2Y12 inhibitors on montelukast pharmacokinetics. Clopidogrel (300 mg on day 1 and 75 mg on day 2) increased the area under the plasma concentration–time curve (AUC) of montelukast 2.0‐fold (90% confidence interval (CI) 1.72–2.28, P < 0.001) and decreased the M6:montelukast AUC0‐7h ratio to 45% of control (90% CI 40–50%, P < 0.001). Prasugrel (60 mg on day 1 and 10 mg on day 2) had no clinically meaningful effect on montelukast pharmacokinetics. Our results imply that clopidogrel is at least a moderate inhibitor of CYP2C8, but prasugrel is not a clinically relevant CYP2C8 inhibitor. The different interaction potentials of clopidogrel and prasugrel are important to consider when antiplatelet therapy is planned for patients at risk for polypharmacy with CYP2C8 substrates.
Study Highlights.
WHAT IS THE CURRENT KNOWLEDGE ON THE TOPIC?
☑ The CYP2C8 inhibitor gemfibrozil increases the AUC of CYP2C8 substrate montelukast over 4‐fold. Recent studies indicate that UGT1A3 is also involved in montelukast disposition, and a role for OATP1B1 has been suggested. Clopidogrel is a metabolism‐dependent inhibitor of CYP2C8, which does not inhibit CYP3A4 or OATP1B1 to a clinically relevant extent.
WHAT QUESTION DID THIS STUDY ADDRESS?
☑ This study investigated the effects of clopidogrel and prasugrel on the pharmacokinetics of montelukast to characterize the usefulness of montelukast as a CYP2C8 probe substrate, and to find out if prasugrel affects CYP2C8 activity.
WHAT THIS STUDY ADDS TO OUR KNOWLEDGE
☑ Clopidogrel is at least a moderate CYP2C8 inhibitor and approximately doubles the exposure to montelukast. Prasugrel does not increase montelukast concentrations and is not a significant inhibitor of CYP2C8.
HOW THIS MIGHT CHANGE CLINICAL PHARMACOLOGY OR TRANSLATIONAL SCIENCE
☑ Different interaction potentials of clopidogrel and prasugrel should be taken into consideration when antiplatelet therapy is prescribed to patients who are treated with CYP2C8 substrate drugs.
Montelukast is a cysteinyl leukotriene receptor 1 antagonist widely used in the treatment of asthma.1, 2, 3 Montelukast has an oral bioavailability of 60–70%, is highly (about 99.8%) bound to plasma proteins, and is extensively metabolized. Montelukast 1,2 diol (M6) is its major primary metabolite in human plasma. M6 is further oxidized to montelukast dicarboxylic acid (M4), which is the predominant metabolite in bile (Figure 1).4, 5, 6 The biotransformation of montelukast to M6, and its subsequent metabolism to M4, are mainly mediated by cytochrome P450 (CYP) 2C8, whereas the contributions of CYP2C9, CYP3A4, and other CYP enzymes to the overall metabolism of montelukast are of small importance at clinically relevant concentrations in vitro, and in healthy subjects in vivo.7, 8, 9 Therefore, montelukast has been suggested as a selective CYP2C8 probe substrate for drug interaction studies.7, 10, 11 Recent studies in vitro and in animals, however, have shown that the uridine 5′‐diphospho‐glucuronosyltransferase (UGT) 1A3 enzyme, and the organic anion transporting polypeptides (OATPs), a family of hepatic influx transporters, can contribute to the hepatic elimination of montelukast.12, 13 A prospective pharmacogenomic study in humans by Hirvensalo et al. implied that UGT1A3 plays an important role in the elimination of montelukast, and that montelukast is not a sensitive OATP1B1 substrate.14
Figure 1.
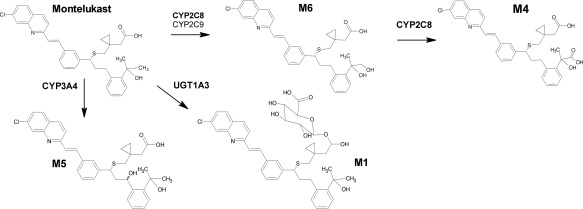
Biotransformation pathways of montelukast and the chemical structures of montelukast and its metabolites M6, M4, M5, and M1. CYP, cytochrome P450; UGT, uridine 5′‐diphospho‐glucuronosyltransferase.
The secondary acyl‐β‐D‐glucuronide metabolite of the antiplatelet agent clopidogrel has recently been found to act as a time‐dependent inhibitor of CYP2C8 in vitro.14 Consequently, clopidogrel has caused marked changes in the pharmacokinetics of the CYP2C8 substrates repaglinide and pioglitazone in vivo.15, 16, 17 In contrast, it seems that clopidogrel is not a clinically relevant inhibitor of CYP3A4 or OATP1B1, because it does not cause meaningful alterations in the exposure to pitavastatin or simvastatin, which are sensitive substrates of OATP1B1, and of CYP3A4 and OATP1B1, respectively.17, 18, 19
Newer adenosine diphosphate (ADP) receptor antagonists, such as prasugrel, have become an option for clopidogrel in some patient groups.20, 21 Similar to clopidogrel, prasugrel belongs to the thienopyridine class and its antiplatelet effect is mediated by a sequentially formed active metabolite that binds covalently to the P2Y12 ADP receptor.22 However, prasugrel has not been examined in relation to its CYP2C8 inhibitory potential in a clinical setting. Several essential drugs are metabolized by CYP2C8, and antiplatelet drugs are widely used in patient populations at risk for polypharmacy. Therefore, comparison of prasugrel and clopidogrel as perpetrators in CYP2C8‐mediated drug interactions is clinically important.
To this end, we conducted a randomized, three‐phase crossover study on the effect of prasugrel and clopidogrel on the pharmacokinetics of montelukast. In addition, we carried out physiologically based pharmacokinetic (PBPK) modeling to evaluate the potential mechanisms of the clopidogrel‐montelukast interaction and the degree of interaction during long‐term treatment.
RESULTS
Effect of clopidogrel on montelukast pharmacokinetics
Compared with placebo, clopidogrel increased the concentrations of parent montelukast and delayed the formation of its main primary M6 metabolite (Table 1 and Figure 2). Clopidogrel increased the AUC0‐∞ of montelukast 2.0‐fold (P < 0.001, 90% CI of geometric mean ratio 1.72‐2.28) and prolonged its mean elimination t ½ from 4.5 to 8.2 h (P < 0.001, 1.82‐fold, 90% CI 1.70‐1.95). Clopidogrel did not have a statistically significant impact on the C max or t max of montelukast, when compared with placebo.
Table 1.
Pharmacokinetic variables of montelukast and its metabolites in 12 healthy volunteers, who ingested 10 mg of montelukast after an oral pretreatment with 300 mg clopidogrel on day 1, and 75 mg clopidogrel on day 2, or 60 mg of prasugrel on day 1, and 10 mg of prasugrel on day 2, or two corresponding doses of placebo
| Variable | Placebo phase (control) | Clopidogrel phase | Prasugrel phase |
|---|---|---|---|
| Montelukast | |||
| C max (ng/mL) | 447 (27) | 439 (30) | 396 (34) |
| Ratio to control (90% CI) | 0.98 (0.82–1.18) | 0.89 (0.76–1.04) | |
| t max (h) | 3.5 (1.0–5.0) | 4.5 (3.0–7.0) | 3.0 (2.0–5.0) |
| t ½ (h) | 4.51 (18) | 8.20 (17) | 5.16 (20) |
| Ratio to control (90% CI) | 1.82 (1.70–1.95)*** | 1.15 (1.04–1.27)* | |
| AUC0–∞ (ng·h/mL) | 3020 (28) | 5990 (34) | 2800 (35) |
| Ratio to control (90% CI) | 1.98 (1.72–2.28)*** | 0.93 (0.82–1.04) | |
| M6 | |||
| C max (ng/mL) | 17.7 (32) | 10.4 (41) | 15.6 (50) |
| Ratio to control (90% CI) | 0.59 (0.50–0.69)*** | 0.88 (0.75–1.04) | |
| t max (h) | 4.0 (3.0–5.0) | 9.0 (4.0–12.0)** | 4.0 (3.0–5.0) |
| t ½ (h) | 4.97 (17) | 9.92 (18) | 5.40 (15) |
| Ratio to control (90% CI) | 2.00 (1.83–2.18)*** | 1.09 (1.01–1.17) | |
| AUC0–7h (ng·h/mL) | 77.1 (36) | 38.8 (50) | 68.6 (50) |
| Ratio to control (90% CI) | 0.50 (0.39–0.64)*** | 0.89 (0.72–1.10) | |
| AUC0–∞ (ng·h/mL) | 143 (46) | 228 (46) | 130 (62) |
| Ratio to control (90% CI) | 1.60 (1.40–1.83)*** | 0.91 (0.78–1.07) | |
| M6:montelukast AUC0–7h ratio | 0.0399 (21) | 0.0178 (39) | 0.0393 (28) |
| Ratio to control (90% CI) | 0.45 (0.40–0.50)*** | 0.99 (0.91–1.07) | |
| M5a | |||
| C max (ng/mL) | 1.13 (33) | 1.06 (54) | 0.92 (47) |
| Ratio to control (90% CI) | 0.93 (0.72–1.22) | 0.82 (0.68–0.98) | |
| t max (h) | 4.0 (2.0–5.0) | 5.0 (4.0–7.0) | 4.0 (2.0–5.0) |
| AUC0–7h (ng·h/mL) | 4.63 (40) | 4.31 (61) | 3.60 (60) |
| Ratio to control (90% CI) | 0.93 (0.70–1.24) | 0.78 (0.60–1.01) | |
| M1 | |||
| C max (ng/mL) | 7.01 (63) | 9.30 (70) | 7.89 (44) |
| Ratio to control (90% CI) | 1.33 (1.00–1.76) | 1.13 (0.84–1.50) | |
| t max (h) | 2.0 (1.0–4.0) | 3.0 (2.0–4.0) | 2.5 (1.0–4.0) |
| t ½ (h) | 1.39 (15) | 4.45 (32) | 1.32 (26) |
| Ratio to control (90% CI) | 3.21 (2.70–3.82)*** | 0.95 (0.87–1.05) | |
| AUC0–∞ (ng·h/mL) | 25.2 (52) | 57.9 (73) | 27.5 (43) |
| Ratio to control (90% CI) | 2.30 (1.84–2.86)*** | 1.09 (0.91–1.30) | |
| M1:montelukast AUC0–∞ ratio | 0.0083 (41) | 0.0097 (56) | 0.0098 (46) |
| Ratio to control (90% CI) | 1.16 (0.96–1.40) | 1.18* (1.05–1.33) |
Data are given as geometric mean with geometric coefficient of variation, except for t max, which is given as median with range. The geometric mean ratios between the two phases are given with 90% confidence intervals. C max, peak plasma concentration; t max, time to C max; t ½, half‐life; AUC, area under the plasma concentration–time curve.
*P < 0.05 vs. placebo, **P < 0.005 vs. placebo, ***P < 0.001 vs. placebo.
Figure 2.
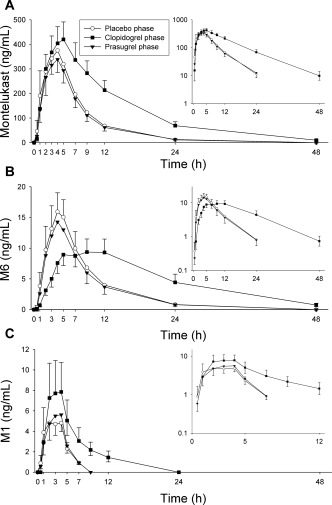
The effect of clopidogrel (300 mg on day 1, followed by 75 mg on day 2) and prasugrel (60 mg on day 1, followed by 10 mg on day 2) on the plasma concentrations of montelukast (a), and its metabolites M6 (b) and M1 (c). On day 1 of clopidogrel, prasugrel, and placebo phases, montelukast (10 mg) was administered to 12 healthy individuals 1 h after the first dose of pretreatment. Data are presented as geometric means with 90% CI. For clarity, some error bars have been omitted. Insets depict the same data on a semilogarithmic scale.
Clopidogrel prolonged the t max of the montelukast main metabolite M6 from 4.0 to 9.0 h (Table 1 and Figure 2). Additionally, in the clopidogrel phase the AUC0‐7h and AUC0‐∞ of M6 were 50% (P < 0.001, 90% CI 39–64%) and 160% (P < 0.001, 90% CI 140–183%) of those during the placebo phase, respectively. Furthermore, the M6:montelukast AUC0‐7h ratio was decreased to 45% (P < 0.001, 90% CI 40–50%) of that during the placebo phase. Quantitatively, the second most important metabolite of montelukast in plasma was its acyl‐β‐D‐glucuronide M1. The AUC0‐∞ of M1 was increased 2.3‐fold (P < 0.001, 90% CI 1.84–2.86) by clopidogrel, but the M1:montelukast AUC0‐∞ ratio was not significantly altered. Moreover, clopidogrel prolonged the t ½ of M1 from 1.4 to 4.5 h (P < 0.001, 3.21‐fold, 90% CI 2.70–3.82). Due to the very low plasma concentrations of M5a, its t ½ could not be estimated reliably. However, no meaningful changes were observed in the AUC0‐7h or C max of M5a.
Effect of prasugrel on montelukast pharmacokinetics
Prasugrel had no effect on the AUC0‐∞ of montelukast, when compared with placebo (geometric mean ratio 0.93, 90% CI 0.82–1.04; Table 1, Figure 2). The M6:montelukast AUC0‐7h ratio during the prasugrel phase was also unchanged, i.e., 99% (90% CI 91–107%) of that during the placebo phase. However, prasugrel slightly prolonged the t ½ of montelukast from 4.5 to 5.2 h (P = 0.034, 1.15‐fold, 90% CI 1.04–1.27). Additionally, the M1:montelukast AUC0‐∞ ratio was increased to 118% of that during the placebo phase (P = 0.033, 90% CI 105–133%). Otherwise, no changes in the pharmacokinetic variables of montelukast or its metabolites were observed.
Clopidogrel and prasugrel
The plasma concentrations of clopidogrel, prasugrel, and their metabolites peaked at around 1 h after the ingestion of clopidogrel and prasugrel (Figure 3, Table 2), i.e., close to the time of montelukast ingestion. There was 2–3‐fold interindividual variation in the C max, AUC0‐13h, and t ½ of parent clopidogrel, and up to 6‐fold variation in those of its active cis‐5‐thiol, carboxylic acid, and acyl‐β‐D‐glucuronide metabolites. There were no significant correlations between the C max or AUC0‐13h of clopidogrel acyl‐β‐D‐glucuronide, and the fold‐change in the montelukast AUC0‐∞ or M6:montelukast AUC0‐7h ratio (data not shown). The pharmacokinetics of prasugrel active (R‐138727) and inactive (R‐95913) metabolites also varied greatly between individuals.
Figure 3.
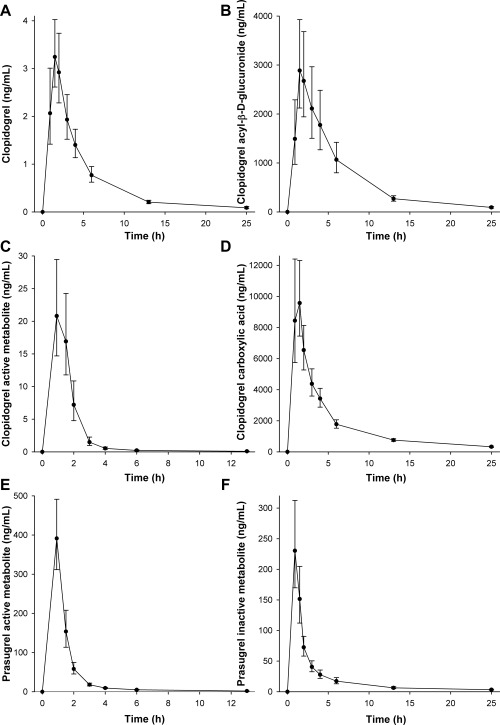
The mean plasma concentrations of clopidogrel (a), clopidogrel acyl‐β‐D‐glucuronide (b), clopidogrel active cis‐5‐thiol metabolite (c), clopidogrel carboxylic acid (d) after clopidogrel 300 mg, and those of prasugrel active (R‐138727) metabolite, and prasugrel inactive (R‐95913) metabolite after prasugrel 60 mg in 12 healthy volunteers. A single oral dose of 10 mg montelukast was administered 1 h after clopidogrel or prasugrel. Data are presented as geometric means with 90% CI.
Table 2.
Pharmacokinetic variables of clopidogrel, clopidogrel active cis 5‐thiol metabolite, clopidogrel carboxylic acid, clopidogrel acyl‐β‐D‐glucuronide, and prasugrel active and inactive metabolites in 12 healthy volunteers after 300 mg of clopidogrel or 60 mg prasugrel, which were ingested 1 h before montelukast on day 1
| Variable | Clopidogrel or prasugrel phase |
|---|---|
| Clopidogrel | |
| C max (ng/mL) | 3.53 (2.56–7.15) |
| t max (h) | 1.5 (0.92–2.0) |
| t ½ (h) | 4.8 (3.6–8.3) |
| AUC0‐13h (ng·h/mL) | 13.2 (9.25–22.9) |
| Clopidogrel active metabolite | |
| C max (ng/mL) | 23.4 (12.6–80.1) |
| t max (h) | 0.92 (0.92–1.5) |
| t ½ (h) | 3.4 (0.84–4.8) |
| AUC0‐13h (ng·h/mL) | 32.0 (17.0–101) |
| Clopidogrel carboxylic acid | |
| C max (ng/mL) | 11,500 (7,410–19,700) |
| t max (h) | 0.92 (0.92–1.5) |
| t ½ (h) | 7.3 (5.8–9.2) |
| AUC0‐13h (ng·h/mL) | 38,500 (22,000–53,400) |
| Clopidogrel acyl‐β‐D‐glucuronide | |
| C max (ng/mL) | 3,290 (1,470–9,680) |
| t max (h) | 1.5 (0.92–3.0) |
| t ½ (h) | 4.6 (3.9–6.6) |
| AUC0‐13h (ng·h/mL) | 16,200 (7,030–34,200) |
| Prasugrel active metabolite (R‐138727) | |
| C max (ng/mL) | 428 (210–865) |
| t max (h) | 0.92 (0.92–0.92) |
| t ½ (h) | 3.9 (3.2–5.5) |
| AUC0‐13h (ng·h/mL) | 495 (249–1090) |
| Prasugrel inactive metabolite (R‐95913) | |
| C max (ng/mL) | 240 (105–692) |
| t max (h) | 0.92 (0.92–1.5) |
| t ½ (h) | 7.1 (6.0–9.2) |
| AUC0‐13h (ng·h/mL) | 495 (247–1140) |
Data are given as median with range. C max, peak plasma concentration; t max, time to C max; t ½, half‐life; AUC, area under the plasma concentration–time curve.
PBPK modeling and simulations
Two PBPK models for clopidogrel were refined and validated on the basis of previously published models and drug interaction data on selected CYP2C8, CYP3A4, and OATP1B1 substrates (Supplementary Methods and Results, Tables S1–S3, and Figures S1–S4). The clopidogrel models differed with respect to the unbound hepatocyte‐to‐plasma ratio and OATP1B1 Ki of clopidogrel acyl‐β‐D‐glucuronide, which were 8 and 0.1 μM (“clopidogrel 8”), and 25 and 5.45 μM (“clopidogrel 25”). Thereafter, two alternative models for montelukast were constructed: “montelukast A” (perfusion‐limited liver model) and “montelukast B” (permeability‐limited liver model with OATP1B1 transport), where CYP2C8 was the main enzyme involved in the metabolism of montelukast. To explore the clopidogrel–montelukast interaction, the fraction of montelukast dose metabolized by CYP2C8 was varied between 0.55 and 0.80. The interaction with the “clopidogrel 25” model could be adequately predicted when the fraction metabolized by CYP2C8 (fm,CYP2C8) of montelukast was 0.55–0.70 with both montelukast models (Figure 4). However, while the “clopidogrel 8” performed equally well with the “montelukast A” model, it overpredicted the interaction with the “montelukast B” model using these fm,CYP2C8 values (Table S3). Simulations of the effects of long‐term dosing of 75 mg clopidogrel once daily on the plasma concentrations of montelukast predicted on average a 1.5–2‐fold increase in montelukast dose interval AUC during steady‐state conditions (Figure 4).
Figure 4.
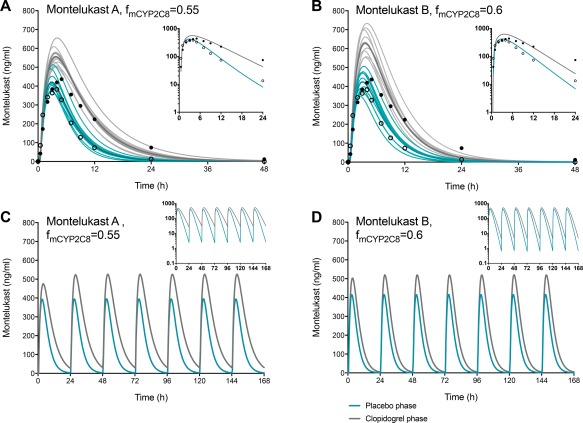
Physiologically based pharmacokinetic simulations of the effects of clopidogrel on montelukast pharmacokinetics using the “clopidogrel 25” model and the montelukast models A (perfusion‐limited liver model) (a,c) and B (permeability‐limited liver model with OATP1B1 transport) (b,d), here with fmCYP2C8 values of 0.55–0.60. The upper panel shows simulations of 10 independent trials with the same design as the present clinical study. Individual trials are shown as thin lines, and their means as the thick blue (placebo phase) and gray (clopidogrel phase) lines. Circles refer to clinical data from the present study. The lower panel shows simulations of the effect of clopidogrel on the plasma concentrations of montelukast when clopidogrel 75 mg and montelukast 10 mg montelukast are coadministered to a North European Caucasian population representative daily. In the “clopidogrel 25” model, the acyl‐β‐D‐glucuronide metabolite has an unbound hepatocyte‐to‐plasma concentration ratio of 25 and OATP1B1 Ki of 5.45 μM (Supplementary Methods and Results; Table S1).
Genotypes
One of the subjects had the CYP2C8*1/*2 genotype, two had the CYP2C8*1/*3 genotype, and the other nine had the CYP2C8*1/*1 genotype. There were no apparent CYP2C8 genotype‐dependent differences between the subjects in montelukast pharmacokinetics or the increase in the AUC of montelukast by clopidogrel (data not shown). One of the subjects had the UGT1A3*1/*1 genotype, one had the UGT1A3*2/*2 genotype, one had the UGT1A3*3/*3 genotype, and one had the UGT1A3*1/*3 genotype, while the other eight subjects had the UGT1A3*1/*2 genotype. In all three study phases, there was a trend for greater montelukast AUC in the three UGT1A3*2 noncarriers than in the nine subjects carrying the UGT1A3*2 allele, and the highest AUCs were observed in two noncarriers during the clopidogrel phase (Figure 5). There were five subjects with the CYP2C19*1/*17 genotype, and they did not have significantly different AUC0‐13h values of clopidogrel cis‐5‐thiol, carboxylic acid, or acyl‐β‐D‐glucuronide, when compared with the remaining seven subjects, who had the CYP2C19*1/*1 genotype (data not shown). In addition, one of the subjects had the CES1 c.428G/A genotype, while all the other subjects had the c.428G/G genotype.
Figure 5.
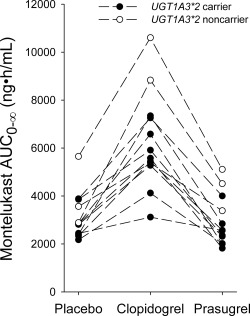
The individual montelukast area under the plasma concentration time curves from zero to infinity (AUC0‐∞) in 12 healthy subjects after ingestion of 10 mg of montelukast in a crossover study during placebo, clopidogrel, and prasugrel phases. Montelukast was ingested 1 h after placebo, clopidogrel 300 mg, or prasugrel 60 mg on day 1. Solid circles indicate individuals carrying the UGT1A3*2 allele (n = 9) and open circles indicate UGT1A3*2 noncarriers (n = 3).
DISCUSSION
Montelukast has been suggested as a CYP2C8 probe substrate due to the central role of CYP2C8 in its oxidative metabolism and its sensitivity to the effect of the strong CYP2C8 inhibitor gemfibrozil.7, 8, 9, 10 Clopidogrel, specifically its acyl‐β‐D‐glucuronide metabolite, has been discovered to inhibit CYP2C8, whereas prasugrel has not been studied in relation to its potential to interact with CYP2C8 substrates in humans.15, 16, 17 To compare the effects of clopidogrel and prasugrel on CYP2C8 activity, we administered clopidogrel, prasugrel, or placebo together with montelukast. Our results are clinically very important, as they distinguish the interaction risks of prasugrel vs. clopidogrel as perpetrators with respect to CYP2C8 enzyme.
In the current study, clopidogrel significantly increased the exposure of montelukast, consistent with inhibition of the CYP2C8‐mediated metabolism of montelukast. The AUC0‐∞ of montelukast was doubled and its t ½ was prolonged from 4.5 to 8.2 h by clopidogrel. The impact of clopidogrel on montelukast pharmacokinetics is similar, but weaker from that of gemfibrozil. Both caused a decrease in the AUC0‐7h of M6 and the M6:montelukast AUC0‐7h ratio, and an increase in the AUC0‐∞ of M6.7, 8 These observations can be rationalized by the major role of CYP2C8 in the metabolism of both montelukast and the primary metabolite M6.7, 8, 9 The more pronounced increase in the AUC of montelukast by gemfibrozil than by clopidogrel is the only conspicuous difference between the effects of these two CYP2C8 inhibitors.7, 8 Overall, the current results corroborate the usefulness of montelukast as a possible CYP2C8 model substrate. Furthermore, the AUC0‐∞ of M1 was increased more than 2‐fold by clopidogrel. As there was no change in the M1:montelukast AUC0‐∞ ratio, it is obvious that the increases in the AUC and t ½ of M1 by clopidogrel are mainly secondary to the corresponding changes in the pharmacokinetics of montelukast.
In contrast to clopidogrel, prasugrel did not cause any clinically meaningful changes in the pharmacokinetics of montelukast or its metabolites. Compared to placebo, there was a barely statistically significant 15% prolongation in the t ½ of montelukast and 18% increase in the M1:montelukast AUC0‐∞ ratio in the prasugrel phase. The highest clinically approved prasugrel dose (60 mg loading dose) was administered 1 h before ingestion of montelukast, thus likely representing the worst‐case clinical scenario for drug interaction between prasugrel and montelukast. Of note, the AUC of montelukast and the M6:montelukast AUC0‐7h ratio were unchanged by prasugrel, indicating that prasugrel is not a clinically relevant CYP2C8 inhibitor.
Antiplatelet pharmacotherapy is typically used in patient populations that often receive multiple medications. Therefore, the different potentials of prasugrel and clopidogrel to interact with substrates of CYP2C8 can be clinically very important. CYP2C8 is crucial or at least significant for the metabolism of several drugs, e.g., for amodiaquine, paclitaxel, imatinib, daprodustat, pioglitazone, rosiglitazone, repaglinide, loperamide, dasabuvir, enzalutamide, and selexipag. As clopidogrel and prasugrel can both be used in the same indications, the current findings imply that prasugrel is a safer alternative than clopidogrel concerning its CYP2C8‐mediated drug–drug interaction potential.
The metabolism of montelukast is complex and a quantitative evaluation of its metabolic routes is challenging in vitro, due to its own inhibitory effect on CYP2C8 (Ki 9 nM at microsomal protein concentration 0.25 mg/mL), and its high affinity to both plasma and microsomal proteins. In humans, montelukast is not a significant inhibitor of CYP2C8,23 because its unbound concentrations in plasma (and tissues) are in the low nanomolar range, at the highest. Along with its major primary metabolite M6, several less important metabolites have been identified, including M5a, M5b, sulfoxide (M2), phenol (M3), and α‐hydroxy (M7) metabolites, and the acyl‐β‐D‐glucuronide metabolite M1.9, 12, 24 Clinical studies and in vitro studies with typical therapeutic montelukast concentrations (<0.1 μM) indicate that CYP2C8‐mediated biotransformation from montelukast to M6 and subsequently to its secondary metabolite M4 is a dominant pathway in montelukast elimination.5, 7, 8, 9 An in vitro study suggested that the glucuronidation of montelukast to M1 by UGT1A3 could significantly contribute to the total elimination of montelukast.12 In addition, Varma et al. recently reported, based on in vitro results, PBPK modeling, and in vivo experiments in rats and cynomolgus monkeys, that hepatic uptake transporters, e.g., OATP1B1/1B3, have an important role in the pharmacokinetics and drug–drug interactions of montelukast.13 Moreover, clarithromycin, a CYP3A4 and possible OATP1B1/1B3 inhibitor, has been observed to cause a 2.4‐fold increase in montelukast AUC,25 albeit the same study reported a 30–40% decrease in montelukast exposure by fluconazole, which lacks a convincing mechanistic explanation.25 The recent pharmacogenomic study by Hirvensalo et al. demonstrated that UGT1A3 can account for up to 35–60% of montelukast metabolism, depending on the UGT1A3 genotype, and suggested that OATP1B1 is not of major importance in the pharmacokinetics of parent montelukast.14 It should be noted, however, that the role of hepatic influx transporters in montelukast disposition cannot be completely ruled out based on pharmacogenomic data alone.
In previous studies, gemfibrozil has increased the AUC of montelukast (about 4.5‐fold) slightly more than that of pioglitazone (about 3‐fold).26, 27, 28 In the present study, the effect of clopidogrel on the AUC of montelukast (2.0‐fold) was not greater than its previously reported effect on pioglitazone AUC (2.0–2.1‐fold).10, 16, 17 A possible explanation for this discordance is interindividual variability in the extent of interaction and differences in study populations between the studies. In the current study, the proportion of subjects carrying the UGT1A3*2 allele associated with increased montelukast clearance,14 was high (9 out of 12). Accordingly, the average fraction of montelukast metabolized by CYP2C8 may have been smaller in the participants of the present study than in the general population or in the subjects of the previous studies with gemfibrozil and montelukast. This may partially explain the relatively small observed effect of clopidogrel on montelukast AUC. In any case, the current results strongly suggest that clopidogrel is a weaker CYP2C8 inhibitor than gemfibrozil and that montelukast and pioglitazone are approximately equally sensitive CYP2C8 probe substrates. Montelukast undergoes complex disposition that makes it suboptimal, yet in some instances a useful CYP2C8 probe substrate. The applicability of montelukast as a CYP2C8 probe substrate can be rationalized due to its good safety profile and the CYP2C8‐mediated biotransformation pathway of parent montelukast to its primary M6 metabolite, and that to the secondary M4 metabolite.
In order to evaluate the roles of CYP2C8 inhibition and other potential mechanisms in the clopidogrel–montelukast interaction, we constructed PBPK models on clopidogrel and gemfibrozil as perpetrators of interaction, and montelukast and several other CYP2C8, CYP3A4, and OATP1B1 substrate drugs as victims (Supplementary Methods and Results). Overall, the present and previous findings could be explained by models where the contribution of CYP2C8 to the total elimination of montelukast was about 50% or more, and where alternative elimination mechanisms were involved, particularly the active hepatocyte influx of montelukast. Accordingly, the previously documented marked increase in montelukast AUC by gemfibrozil could be partially explained by inhibition of OATPs or other hepatic influx transporters. In vitro, gemfibrozil is an inhibitor of several OATPs and NTCP.29 Based on our sensitivity analysis, on the other hand, the effect of clopidogrel can be explained by inhibition of CYP2C8 by increasing the fm,CYP2C8 of montelukast and decreasing the hepatocyte‐to‐plasma ratio of clopidogrel acyl‐β‐D‐glucuronide, or vice versa. Increasing the inhibition of OATP1B1 in the clopidogrel models, however, easily leads to overestimation of montelukast and other victim drug AUCs.
In conclusion, clopidogrel, but not prasugrel, markedly inhibits the CYP2C8‐mediated biotransformation of montelukast and its major metabolite M6. The different interaction potentials of these P2Y12 inhibitors are important to consider when antiplatelet therapy is planned for patients at risk for polypharmacy with CYP2C8 substrates. Based on a PBPK model, long‐term treatment with clopidogrel almost doubles the exposure to montelukast, suggesting that montelukast and pioglitazone are about equally sensitive to CYP2C8 inhibition, but neither of them is fully selective as a CYP2C8 probe substrate.
METHODS
Subjects and study design
Twelve healthy nonsmoking volunteers (seven women, five men; age range, 19–31 years; body mass index range, 20.2–33.0 kg/m2) participated in the study after giving written informed consent. Their health was confirmed by medical history, clinical examination, and routine laboratory tests before entering the study. All participants had normal blood platelet counts and hemoglobin values. None of the subjects used oral contraceptives or other continuous medication.
The study protocol was approved by the Coordinating Ethics Committee of the Helsinki and Uusimaa Hospital District (record number 56/13/03/00/2015), and the Finnish Medicines Agency, Fimea (EudraCT number 2015‐000369‐30). In a randomized, placebo‐controlled, three‐phase crossover study, the subjects ingested as 2‐day pretreatment either placebo (Placebo tablets, University Pharmacy, Helsinki, Finland), clopidogrel (300 mg on day 1 followed by 75 mg on day 2; Plavix, Sanofi‐Aventis, Paris, France), or prasugrel (60 mg on day 1 followed by 10 mg on day 2; Efient, Eli‐Lilly, Houten, Netherlands) at 8 am with 150 mL water. Between the phases, there was a washout period of 2 weeks. On day 1 of pretreatment, 10 mg montelukast (Singulair 10 mg tablet, Merck Sharp Dohme, Haarlem, Netherlands) was administered at 9 am. On the days of montelukast ingestion, the volunteers had fasted overnight, and a standard warm meal was served 3 h, and snacks 7 and 10 h after the administration of montelukast. The use of grapefruit products was not allowed for 1 week before and during the study, and the use of other drugs from 1 week before to 1 week after the study.
Sampling
Timed venous blood samples were drawn before the administration of pretreatment, and 5 min before and 0.5, 1, 2, 3, 4, 5, 7, 9, 12, 24, and 48 h after the administration of montelukast. The blood samples were collected into ethylenediaminetetraacetic acid (EDTA) containing tubes, which were placed on ice immediately after sampling. Plasma was separated within 30 min and stored at –70°C until analysis. The samples for the determination of clopidogrel, prasugrel, and their metabolites were treated with 2‐bromo‐3′‐methoxyacetophenone within 30 sec of blood sample collection in whole‐blood EDTA samples, in order to derivatize the active metabolites of clopidogrel and prasugrel, as previously described.30
Determination of drug concentrations
The concentrations of plasma montelukast, montelukast acyl‐β‐D‐glucuronide (M1), montelukast 1,2‐diol (M6), and 21(S)‐hydroxy montelukast (M5a) were analyzed using a Nexera X2 liquid chromatography instrument (Shimadzu, Kyoto, Japan) interfaced with a 5500 Qtrap tandem mass spectrometer (AB Sciex, Toronto, ON, Canada). Prior to quantification, the plasma sample was purified from proteins and phospholipids using a Phree phospholipid removal system (Phenomenex, Torrance, CA) according to the manufacturer's instructions. Briefly, the plasma sample was mixed with acetonitrile containing 1% formic acid and internal standards (1:3 v/v) and drawn through the Phree cartridge. The chromatographic separation was achieved on a reversed‐phase Kinetex C18 analytical column (75·2.1 mm internal diameter, 2.6 μm particle size; Phenomenex) using 2 mM ammonium acetate (pH 4.0) adjusted with 98% formic acid (A) and acetonitrile (B) as a mobile phase. The gradient profile was set as follows: a linear increase from 35% B to 62% B over 2.2 min, held at 62% B for 2 min, a gradient from 62% B to 95% B over 0.6 min, and maintained at 95% B for 1.4 min followed by a reversion to the initial conditions. The mass spectrometer was operated in a positive electrospray ionization mode (ESI+) employing scheduled multiple reaction monitoring (MRM) for the optimal dwell time for each analyte. Corresponding deuterated reference compound served as an internal standard for each target, except for M6, which utilized montelukast‐d6. The target mass‐to‐charge ratios (m/z) for montelukast, M1, M6, and M5a were 586 to 422, 762 to 422, 602 to 438, and 602 to 147, and the lower limits of quantification (LLQ) were 2.0, 0.5, 0.2, and 0.25 ng/mL, respectively. The day‐to‐day coefficient of variation (CV) at the lowest quality control levels were as follows (n = 6): 8.7% for montelukast (10 ng/mL), 7.6% for M1 (1.0 ng/mL), 7.6% M6 for (1.0 ng/mL), and 5.9% for M5a (0.5 ng/mL).
The concentrations of plasma clopidogrel, clopidogrel acyl‐β‐D‐glucuronide, clopidogrel carboxylic acid, and clopidogrel active cis‐5‐thiol metabolite, and plasma prasugrel metabolites, R‐138727 and R‐95913, were measured using the 5500 Qtrap liquid chromatography tandem mass spectrometry system, as previously described.30, 31 In short, the plasma proteins were precipitated with acetonitrile containing the deuterium‐labeled internal standards, and the plasma extract was reconstituted with the mobile phase. The target compounds were separated using a reversed phase chromatography followed by quantification with the MRM technique. The day‐to‐day CV was below 15% at relevant concentrations for all analytes, and their LLQs were as previously described.18, 31
Pharmacokinetics
The peak plasma concentration (C max), time to C max (t max), area under the plasma concentration‐time curve from time 0 to 7 h (AUC0‐7h), AUC0‐∞, and half‐life (t ½) were calculated for montelukast and its metabolites by standard noncompartmental methods using Phoenix WinNonlin, v. 6.4 (Certara, Princeton, NJ). In addition, AUC0‐13h was calculated for clopidogrel and its metabolites, and the primary R‐95913 (inactive) and secondary R‐138727 (active) metabolites of prasugrel.
Genotyping
Buffy coats were prepared from 9 mL whole‐blood EDTA samples after plasma separation. Genomic DNA was extracted from the buffy coats using the Maxwell 16 LEV Blood DNA Kit on a Maxwell 16 Research automated nucleic acid extraction system (Promega, Madison, WI). The participants were genotyped for the CYP2C8*2 (rs11572103), *3 (rs10509681 and rs11572080), and *4 (rs1058930), CYP2C19*2 (rs4244285), *3 (rs4986893), *8 (rs41291556), and *17 (rs12248560), UGT1A3*2 (rs3821242 and rs6431625), *3 (rs3821242), and *6 (rs3821242, rs6431625, and rs45449995), and CES1 c.428G>A (rs71647871) alleles with commercially available or custom TaqMan assays with OpenArray technology on a QuantStudio 12K Flex real‐time polymerase chain reaction system (Life Technologies, Carlsbad, CA).
Statistical analysis
Based on the pharmacokinetic results of previous drug interaction studies with montelukast, 12 subjects were estimated to be adequate to detect a 30% change in the AUC of montelukast between the control (placebo), clopidogrel, and prasugrel phases, with a power of at least 80% (α level 5%). The results are expressed as geometric means and geometric mean ratios with geometric CV or 90% confidence intervals (CIs) unless stated otherwise. Logarithmic transformation was used for pharmacokinetic variables, except t max, before statistical analysis. The pharmacokinetic variables were compared by repeated‐measures analysis of variance with treatment phase as a within‐subjects and treatment sequence as a between‐subjects factor, with pairwise comparisons with the Fisher's least significant difference method. The t max data were compared using the Wilcoxon signed rank test. P‐values below 0.05 were considered statistically significant. Statistical analyses were performed using SPSS Statistics for Windows v. 22.0 (IBM, Armonk, NY).
PBPK modeling
In order to clarify the mechanisms of the clopidogrel–montelukast interaction and to predict the magnitude of the interaction during continuous treatment with the standard dosing of clopidogrel, PBPK models were composed in the Simcyp Population‐Based Simulator (V15.1; Simcyp, UK) as described in the Supplementary Methods and Results online.
AUTHOR CONTRIBUTIONS
M.K.I., A.T., A.M.F., M.Ne., P.J.N., M.Ni., and J.T.B. wrote the article; M.K.I., A.T., A.M.F., M.Ne., P.J.N., M.Ni., and J.T.B. designed the research; M.K.I., A.T., A.M.F., M.Ne., P.J.N., M.Ni., and J.T.B. performed the research; M.K.I., A.T., A.M.F., M.Ne., P.J.N., M.Ni., and J.T.B. analyzed the data.
CONFLICT OF INTEREST
The authors declare no conflicts of interest.
Supporting information
Supporting Information
Supporting Information
Supporting Information
Supporting Information
Supporting Information
Supporting Information
Supporting Information
Supporting Information
Supporting Information
ACKNOWLEDGMENTS
The study was supported by grants from the Academy of Finland (Grant decision 278123, 2014), and the Helsinki University Central Hospital Research Fund (Helsinki, Finland). The authors thank Eija Mäkinen‐Pulli, and Lisbet Partanen for their skillful technical assistance.
References
- 1. Altman, L.C. et al. A placebo‐controlled, dose‐ranging study of montelukast, a cysteinyl leukotriene‐receptor antagonist. Montelukast Asthma Study Group. J. Allergy Clin. Immunol. 102, 50–56 (1998). [DOI] [PubMed] [Google Scholar]
- 2. Lipworth, B.J. Leukotriene‐receptor antagonists. Lancet 353, 57–62 (1999). [DOI] [PubMed] [Google Scholar]
- 3. Reiss, T.F. , Chervinsky, P. , Dockhorn, R.J. , Shingo, S. , Seidenberg, B. & Edwards, T.B. Montelukast, a once‐daily leukotriene receptor antagonist, in the treatment of chronic asthma: a multicenter, randomized, double‐blind trial. Montelukast Clinical Research Study Group. Arch. Intern. Med. 158, 1213–1220 (1998). [DOI] [PubMed] [Google Scholar]
- 4. Cheng, H. et al. Pharmacokinetics, bioavailability, and safety of montelukast sodium (MK‐0476) in healthy males and females. Pharm. Res. 13, 445–448 (1996). [DOI] [PubMed] [Google Scholar]
- 5. Balani, S.K. et al. Metabolic profiles of montelukast sodium (Singulair), a potent cysteinyl leukotriene1 receptor antagonist, in human plasma and bile. Drug Metab. Dispos. 25, 1282–1287 (1997). [PubMed] [Google Scholar]
- 6. US Food and Drug Administration . Center for Drug Evaluation and Research. Pharmacology review(s) for Singulair <http://www.accessdata.fda.gov/drugsatfda_docs/nda/98/020829s000_Singular_Pharma.pdf> (1998).
- 7. Karonen, T. , Neuvonen, P.J. & Backman, J.T. CYP2C8 but not CYP3A4 is important in the pharmacokinetics of montelukast. Br. J. Clin. Pharmacol. 73, 257–267 (2012). [DOI] [PMC free article] [PubMed] [Google Scholar]
- 8. Karonen, T. , Filppula, A. , Laitila, J. , Niemi, M. , Neuvonen, P.J. & Backman, J.T. Gemfibrozil markedly increases the plasma concentrations of montelukast: a previously unrecognized role for CYP2C8 in the metabolism of montelukast. Clin. Pharmacol. Ther. 88, 223–230 (2010). [DOI] [PubMed] [Google Scholar]
- 9. Filppula, A.M. , Laitila, J. , Neuvonen, P.J. & Backman, J.T. Reevaluation of the microsomal metabolism of montelukast: major contribution by CYP2C8 at clinically relevant concentrations. Drug Metab. Dispos. 39, 904–911 (2011). [DOI] [PubMed] [Google Scholar]
- 10. Backman, J.T. , Filppula, A.M. , Niemi, M. & Neuvonen, P.J. Role of cytochrome P450 2C8 in drug metabolism and interactions. Pharmacol. Rev. 68, 168–241 (2016). [DOI] [PubMed] [Google Scholar]
- 11. VandenBrink, B.M. , Foti, R.S. , Rock, D.A. , Wienkers, L.C. & Wahlstrom, J.L. Evaluation of CYP2C8 inhibition in vitro: utility of montelukast as a selective CYP2C8 probe substrate. Drug Metab. Dispos. 39, 1546–1554 (2011). [DOI] [PubMed] [Google Scholar]
- 12. Cardoso Jde, O. , Oliveira, R.V. , Lu, J.B. & Desta, Z. In vitro metabolism of montelukast by cytochrome P450s and UDP‐glucuronosyltransferases. Drug Metab. Dispos. 43, 1905–1916 (2015). [DOI] [PMC free article] [PubMed] [Google Scholar]
- 13. Varma, M.V. et al. Transporter‐mediated hepatic uptake plays an important role in the pharmacokinetics and drug‐drug interactions of montelukast. Clin. Pharmacol. Ther. 101, 406–415 (2017). [DOI] [PubMed] [Google Scholar]
- 14. Hirvensalo, P. et al. Comprehensive pharmacogenomic study reveals an important role of UGT1A3 in montelukast pharmacokinetics. Clin. Pharmacol. Ther. doi: 10.1002/cpt.891. (2017) [Epub ahead of print]. [DOI] [PMC free article] [PubMed] [Google Scholar]
- 15. Tornio, A. et al. Glucuronidation converts clopidogrel to a strong time‐dependent inhibitor of CYP2C8: a phase II metabolite as a perpetrator of drug‐drug interactions. Clin. Pharmacol. Ther. 96, 498–507 (2014). [DOI] [PubMed] [Google Scholar]
- 16. Itkonen, M.K. , Tornio, A. , Neuvonen, M. , Neuvonen, P.J. , Niemi, M. & Backman, J.T. Clopidogrel markedly increases plasma concentrations of CYP2C8 substrate pioglitazone. Drug Metab. Dispos. 44, 1364–1371 (2016). [DOI] [PubMed] [Google Scholar]
- 17. Kim, S.J. et al. Clarification of the mechanism of clopidogrel‐mediated drug‐drug interaction in a clinical cassette small‐dose study and its prediction based on in vitro information. Drug Metab. Dispos. 44, 1622–1632 (2016). [DOI] [PubMed] [Google Scholar]
- 18. Itkonen, M.K. , Tornio, A. , Neuvonen, M. , Neuvonen, P.J. , Niemi, M. & Backman, J.T. Clopidogrel has no clinically meaningful effect on the pharmacokinetics of the organic anion transporting polypeptide 1B1 and cytochrome P450 3A4 substrate simvastatin. Drug Metab. Dispos. 43, 1655–1660 (2015). [DOI] [PubMed] [Google Scholar]
- 19. Neuvonen, P.J. , Niemi, M. & Backman, J.T. Drug interactions with lipid‐lowering drugs: mechanisms and clinical relevance. Clin. Pharmacol. Ther. 80, 565–581 (2006). [DOI] [PubMed] [Google Scholar]
- 20. Wiviott, S.D. et al. Prasugrel versus clopidogrel in patients with acute coronary syndromes. N. Engl. J. Med. 357, 2001–2015 (2007). [DOI] [PubMed] [Google Scholar]
- 21. Wallentin, L. et al. Ticagrelor versus clopidogrel in patients with acute coronary syndromes. N. Engl. J. Med. 361, 1045–1057 (2009). [DOI] [PubMed] [Google Scholar]
- 22. Farid, N.A. et al. The disposition of prasugrel, a novel thienopyridine, in humans. Drug Metab. Dispos. 35, 1096–1104 (2007). [DOI] [PubMed] [Google Scholar]
- 23. Jaakkola, T. , Backman, J.T. , Neuvonen, M. , Niemi, M. & Neuvonen, P.J. Montelukast and zafirlukast do not affect the pharmacokinetics of the CYP2C8 substrate pioglitazone. Eur. J. Clin. Pharmacol. 62, 503–509 (2006). [DOI] [PubMed] [Google Scholar]
- 24. Chiba, M. , Xu, X. , Nishime, J.A. , Balani, S.K. & Lin, J.H. Hepatic microsomal metabolism of montelukast, a potent leukotriene D4 receptor antagonist, in humans. Drug Metab. Dispos. 25, 1022–1031 (1997). [PubMed] [Google Scholar]
- 25. Hegazy, S.K. , Mabrouk, M.M. , Elsisi, A.E. & Mansour, N.O. Effect of clarithromycin and fluconazole on the pharmacokinetics of montelukast in human volunteers. Eur. J. Clin. Pharmacol. 68, 1275–1280 (2012). [DOI] [PubMed] [Google Scholar]
- 26. Jaakkola, T. , Backman, J.T. , Neuvonen, M. & Neuvonen, P.J. Effects of gemfibrozil, itraconazole, and their combination on the pharmacokinetics of pioglitazone. Clin. Pharmacol. Ther. 77, 404–414 (2005). [DOI] [PubMed] [Google Scholar]
- 27. Aquilante, C.L. et al. Impact of the CYP2C8 *3 polymorphism on the drug‐drug interaction between gemfibrozil and pioglitazone. Br. J. Clin. Pharmacol. 75, 217–226 (2013). [DOI] [PMC free article] [PubMed] [Google Scholar]
- 28. Deng, L.J. , Wang, F. & Li, H.D. Effect of gemfibrozil on the pharmacokinetics of pioglitazone. Eur. J. Clin. Pharmacol. 61, 831–836 (2005). [DOI] [PubMed] [Google Scholar]
- 29. Tornio, A. , Neuvonen, P.J. , Niemi, M. & Backman, J.T. Role of gemfibrozil as an inhibitor of CYP2C8 and membrane transporters. Expert Opin. Drug Metab. Toxicol. 13, 83–95 (2017). [DOI] [PubMed] [Google Scholar]
- 30. Delavenne, X. , Basset, T. , Zufferey, P. , Malouk, N. , Laporte, S. & Mismetti, P. Ultra‐performance LC MS/MS method for quantification of clopidogrel active metabolite. J. Sep. Sci. 33, 1968–1972 (2010). [DOI] [PubMed] [Google Scholar]
- 31. Holmberg, M.T. et al. Effect of grapefruit juice on the bioactivation of prasugrel. Br. J. Clin. Pharmacol. 80, 139–145 (2015). [DOI] [PMC free article] [PubMed] [Google Scholar]
Associated Data
This section collects any data citations, data availability statements, or supplementary materials included in this article.
Supplementary Materials
Supporting Information
Supporting Information
Supporting Information
Supporting Information
Supporting Information
Supporting Information
Supporting Information
Supporting Information
Supporting Information