 Electrical conductors are made from flat grid clusters of copper using mixed-valency and supramolecular interactions between the enveloping organic ligands.
Abstract
A hierarchical tandem assembly – coordination, oligomerisation and supramolecular organization – is identified using MALDI-TOF of the solid products of the solvothermal reaction of 5,5′-pyridyl-3,3′-bi-1H-pyrazole with CuSO4·5H2O in CH3OH–CH3CN. The initial coordination leads to a [3×3] [CuI4CuII5(L)6] (SO4)·2CH3OH (Cu9) grid followed by oligomerisation to a 3×[3×3] [CuI6CuII21(L)18(CN)6(SO4)](SO4)2·8CH3CN (Cu27) grid through bridging sulfate and in situ generated cyanide with time and subsequent supramolecular organization. The isolated silvery lustrous crystals, Cu9 and Cu27, are good electrical conductors, with conductivities of 3.2 × 10⁻² and 5.4 × 10⁻³ S cm–1, respectively, due to the mixed valency. Their magnetic properties are dominated by antiferromagnetic interactions. DFT and band structure calculations confirm their valence distribution and semiconducting behavior. The planarity of the large 3×[3×3] Cu27 and its electro-activity renders it suitable for the development of large surface area molecular devices.
Introduction
Hierarchical assembly is involved in many processes.1,2 These processes use recognition and supramolecular matching of chemical pairs to help with the organization.3–5 In chemistry the acquired knowledge from biology is used in the design of organic dendrimers, polymers and molecular machines and extended to coordination compounds as well as metal–organic frameworks.6–10 In physics the modelling of nanostructures on surfaces is a major active area of development as is patterning for logic circuits.11 Although hierarchical assembly processes have been recognized in chemistry, tandem ones are rarely evoked.12,13
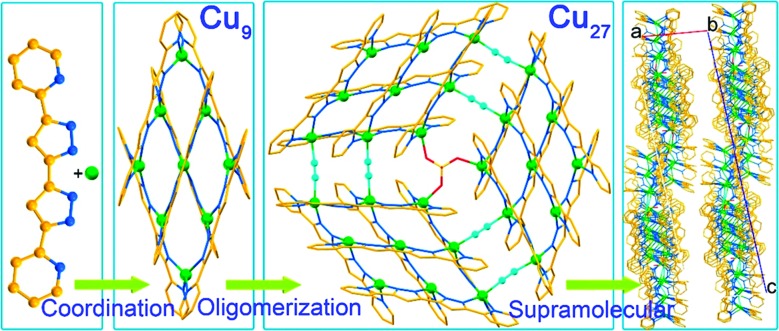
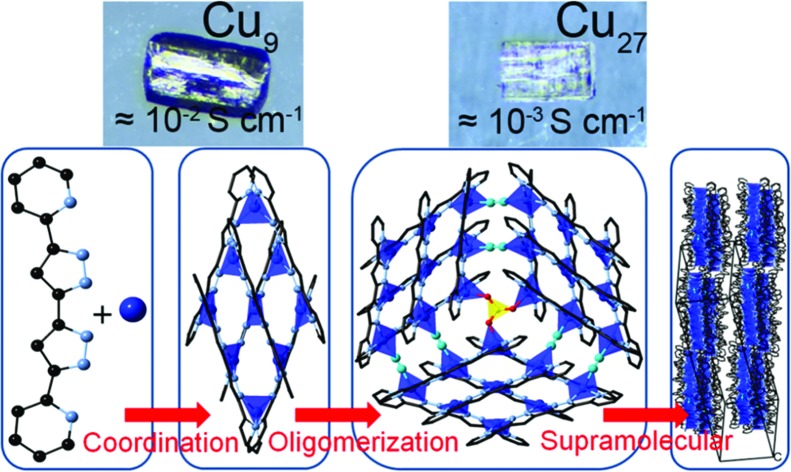
In the course of studying the coordination complexes obtained from different copper salts with planar multidentate 5,5′-pyridyl-3,3′-bi-1H-pyrazole, rich in π-electrons, by solvothermal reactions in different solvents, we have isolated several series of complexes of variable nuclearities and valencies. One series contains rugby-ball hexamers where the valence of the copper ions varies from CuII6 to CuICuII5 and CuI2CuII4 depending on the anions.14 While the former monovalent compound is an insulator, those with mixed CuI/CuII are semiconductors. Other crystalline variants were obtained by tuning the solvents and the time of the solvothermal treatment. Using MALDI-TOF of the solids at different periods of the reaction, we have identified a hierarchical tandem assembly starting from the coordination of the ingredients to form [3×3] [CuI4CuII5(L)6](SO4)·2CH3OH (Cu9) followed by its oligomerisation to a giant 3×[3×3] [CuI6CuII21(L)18(μ2-CN)6(μ3-SO4)](SO4)2·8CH3CN (Cu27) disk and finally its supramolecular arrangement into a crystalline solid (Fig. 1). The two solids Cu9 and Cu27 were isolated from pure methanol and a mixture of methanol and acetonitrile, respectively.
Fig. 1. The three-step tandem hierarchy in obtaining Cu27 from Cu (green), 5,5′-pyridyl-3,3′-bi-1H-pyrazole (rust and blue) and sulphate (red and yellow) and cyanide (cyan) bridges viaCu9.
Herein, we report their crystal structures (Tables 1, S1, and S2†) and characterization using powder diffraction (Fig. S1†), infrared and photoelectron spectroscopies and thermogravimetry (Fig. S2†) together with an experimental study of their electrical, magnetic and optical properties. DFT and band structure calculations were performed to understand the valence distribution and the unusual electrical conductivity. Considerable differences in the electrical and magnetic properties were observed which depend on the average oxidation state of the copper ions. The results are quite exceptional for this series of materials where the central metal moieties provide variable carriers, where their electronic densities and magnetic moments increase with the number of metals and their valences, while the organic ligands interact with those of neighbouring units creating bands favouring electron-transfer.13 This particular distribution of charges and spins is quite unique in rendering these solids electrically conducting.
Table 1. Crystallographic data and structure refinement details for Cu9 and Cu27.
| Cu9 | Cu27 | |
| Formula | C98H68Cu9N36O6S | C310H204Cu27N122O12S3 |
| Fw | 2449.80 | 7641.69 |
| Space group | C2/c | P21/n |
| a/Å | 32.700(18) | 14.7327(3) |
| b/Å | 10.890(6) | 47.3434(8) |
| c/Å | 30.813(17) | 51.2702(8) |
| β/° | 114.970(7) | 97.581(2) |
| V/Å3 | 9947(9) | 35 448.2(11) |
| Z | 4 | 4 |
| D c/g cm–3 | 1.630 | 1.432 |
| T/K | 150(2) | 150(2) |
| F(000) | 4900 | 14 292 |
| R int | 0.059 | 0.065 |
| R 1 a [I ≥ 2σ(I)] | 0.070 | 0.066 |
| wR2 b (all data) | 0.214 | 0.141 |
| GoF | 1.00 | 1.02 |
a R 1 = Σ||Fo| – |Fc||/Σ|Fo|.
bwR2 = [Σw(Fo2 – Fc2)2/Σw(Fo2)2]1/2.
Results and discussion
Synthesis
The planar multidentate pyridine–pyrazole ligand H2L was synthesized by slight modification of a previously reported procedure.14–16 Solvothermal reaction of the ligand, neutralized with triethylamine, with cupric sulphate in methanol leads to silvery hexagonal crystals of the nonanuclear [CuI4CuII5(L)6](SO4)·2CH3OH (Cu9), whereas that in a mixture of methanol and acetonitrile leads to silvery square blocks of the heptacosanuclear [CuI6CuII21(L)18(μ2-CN)6(μ3-SO4)](SO4)2·8CH3CN (Cu27).
Crystal structures
The structure of Cu9 has a planar nonanuclear [3×3] grid core of copper atoms enveloped by six organic ligands, three above the metal plane and three below. The ligands are almost perpendicular to the metal plane and three on one face are parallel to each other but the other three are almost orthogonal to those on the opposite face. There are slight differences in ligand and metal coordination depending on the positions of the copper atoms and their valences while the crystal symmetry of the cluster is satisfied. The grid is highly deviated from a square in order to accommodate the chelating distances of the coordinating nitrogen pairs and the flattened tetrahedron of CuII. Cu9 crystallizes in the monoclinic C2/c space group and the molecular unit includes nine Cu atoms (CuI4CuII5), six L2– ligands, one SO42– anion and two free methanol molecules. The nine metal ions can be categorized into three types: the four corner ones (Cu5, Cu5′, Cu4 and Cu6) each have four nitrogen atoms from two pyridines and two pyrazoles, while the four in the middle of the edges (Cu1, Cu3, Cu3′, and Cu1′) have four nitrogen atoms from one pyridine and three pyrazoles, and the central one (Cu2) has four nitrogen atoms from four pyrazoles (Fig. 1). All the copper ions have a [CuN4] coordination sphere and are connected by N···N bridges. The average Cu–N bond lengths are [Cu1–N] = [Cu2–N] = [Cu3–N] = 1.96, [Cu4–N] = [Cu6–N] = 1.99 and [Cu5–N] = 2.02 Å. They indicate that Cu4, Cu5, Cu5′ and Cu6 are Cu(i), while Cu1, Cu2, Cu3, Cu1′ and Cu3′ are Cu(ii).
The ligands on each face stand in an offset parallel arrangement. The intramolecular π···π distances are rather short (3.3–3.5 Å) (Fig. S3†), indicating the presence of strong π···π interactions. The ligands between adjacent molecules are stacked through offset π···π bond-over-ring mode. The molecules form staircase-like one-dimensional (1D) arrays running along the b-axis with a face-to-face distance of 3.32 Å, suggesting strong interaction. Intermolecular H-bonds (Table S2†) between the 1D-arrays extend them into 2D layers in the ac-plane (Fig. S4 and S5 and Table S3†).
Cu27 is an oligomer of three Cu9 with a 3×[3×3] heptacosanuclear structure with a distorted grid core of copper atoms enveloped by eighteen organic ligands and combined with one sulphate and six cyanide bridges. It has a pseudo-trigonal symmetry of three Cu9 held together by a SO4 sitting centrally on the C3-axis and six bridging cyanide ions between the edges (Fig. S3†). The twenty-seven metal ions can be categorized into four types: the three corner ones (Cu9, Cu18, and Cu27) have four nitrogen atoms from two pyridines and two pyrazoles, and the average Cu–N bond lengths are [Cu9–N] = 2.03, [Cu18–N] = 2.01, and [Cu27–N] = 2.04 Å. The angles are ∠N18–Cu9–N36 = 120.2° (∠N54–Cu18–N72 = 128.6°, ∠N90–Cu27–N108 = 122.7°) and ∠N17–Cu9–N35 = 157.0° (∠N53–Cu18–N71 = 161.4°, ∠N89–Cu27–N107 = 157.3°). Their geometries are closer to a tetrahedron; thus, they are assigned to cuprous ions. The six atoms (Cu6, Cu15, Cu24, Cu8, Cu17, and Cu26) in the middle of the edges are four-coordinated ones with one pyridine and three pyrazoles and the average Cu–N bond lengths are [Cu6–N] = [Cu24–N] = [Cu8–N] = [Cu17–N] = [Cu26–N] = 1.97 and [Cu15–N] = 1.95 Å. The angles are ∠N12–Cu6–N34 = 132.37° (∠N47–Cu15–N69 = 128.1°, ∠N84–Cu24–N106 = 129.5°), ∠N11–Cu6–N33 = 170.5° (∠N48–Cu15–N70 = 170.7°, ∠N84–Cu24–N106 = 170.3°), ∠N16–Cu8–N30 = 130.6° (∠N52–Cu17–N66 = 132.7°, ∠N88–Cu26–N102 = 135.1°), and ∠N15–Cu8–N29 = 170.5° (∠N51–Cu17–N65 = 170.3°, ∠N87–Cu26–N101 = 169.0°). Their geometries are more planar; thus, they are assigned to cupric ions. The central ones (Cu5, Cu14, and Cu23) have four nitrogen atoms from four pyrazoles. The average Cu–N bond lengths are [Cu5–N] = 2.03, [Cu14–N] = 2.01, and [Cu23–N] = 2.04 Å. The angles are ∠N18–Cu9–N36 = 120.2° (∠N54–Cu18–N72 = 128.6°, ∠N90–Cu27–N108 = 122.7°) and ∠N17–Cu9–N35 = 157.0° (∠N53–Cu18–N71 = 161.4°, ∠N89–Cu27–N107 = 157.3°). Their geometries are close to a tetrahedron, and thus they are assigned to cuprous ions (Fig. 1).
The intramolecular π···π distances remain short in the range 3.3–3.4 Å and C–H···π distances of 2.60–2.89 Å are short and lie in the bc-plane. The adjacent molecules are stacked through the strong, offset π···π interaction with a face-to-face distance of 3.35 Å to furnish staircase-like one-dimensional (1D) arrays running along the b-axis (Fig. S4†). Intermolecular C–H···π between the 1D-arrays extend them into 2D layers in the bc-plane (Fig. S5 and S6 and Table S3†). These 2D layers form 3D supramolecular frameworks by using acetonitrile molecules and sulphate anions.
MALDI-TOF
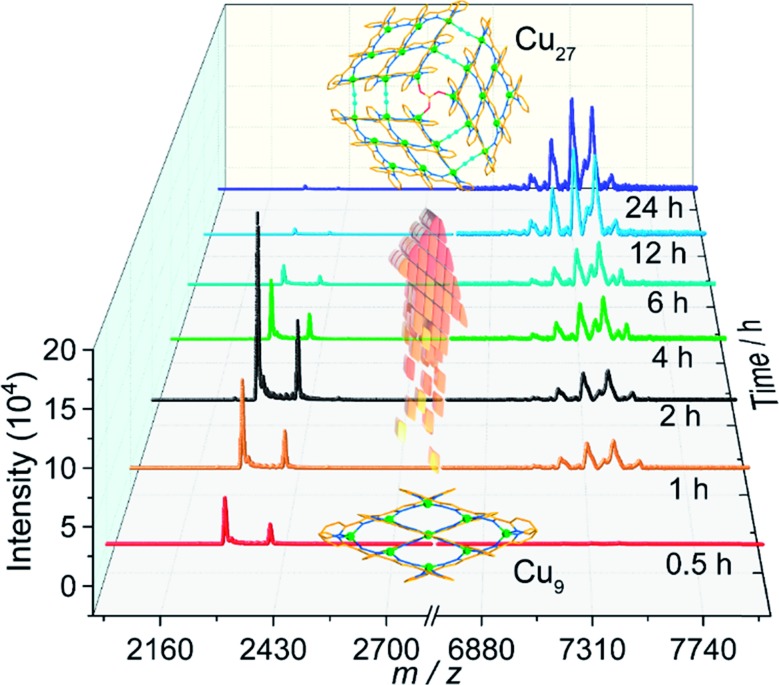
While Cu9 was isolated as crystals in pure methanol, the presence of acetonitrile was found to be indispensable for the crystallization of Cu27. It was therefore necessary to understand the relation between the two compounds. We therefore studied the MALDI-TOF MS of the solids formed from a mixture of methanol and acetonitrile as a function of time (Fig. 2).
Fig. 2. MALDI-TOF mass spectra of the solid products as a function of time of solvothermal treatment.
For the solids, by 30 minutes only peaks assignable to Cu9 were located for the black product. Their intensities increase up to 2 hours when the peaks for Cu27 start to appear. The quantity of the Cu27 then increases at the expense of Cu9 with time. Even after 24 hours there is still a trace of Cu9 but the bulk comprises crystals suitable for crystallography. It is therefore clear from a mechanistic point of view that the initial step is the coordination of the ligand to give the [3×3] Cu9 grid cluster and with time the Cu9 units are oligomerized to the 3×[3×3] Cu27 cluster with the help of bridging SO4 and in situ generated cyanide ions. The final step is the crystallization using the supramolecular interactions. It is worth noting that crystals of Cu27 are insoluble in organic solvents compared to those of Cu9. Interestingly, Cu9 is obtained starting from different copper salts and different solvents but Cu27 is obtained only in the presence of SO4 and acetonitrile. The three step hierarchical process is new in the chemistry of oligomerisation of clusters.
X-ray photoelectron spectroscopy and spin density calculations
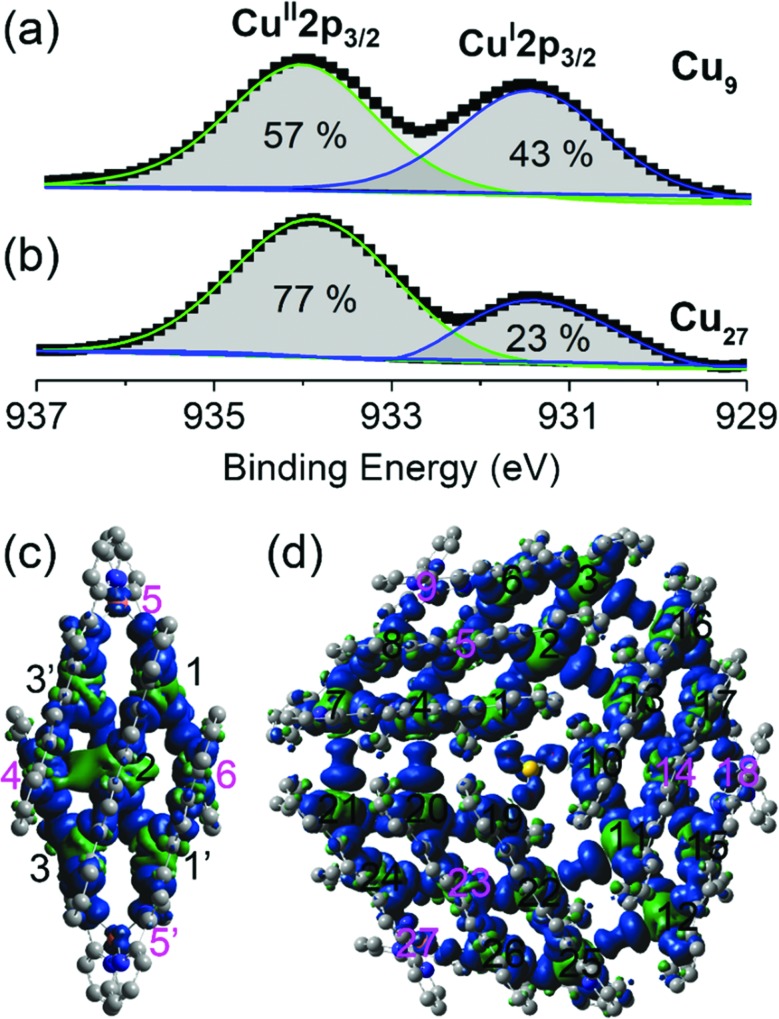
The valence states of the copper ions and their proportions in the compounds were determined from X-ray photoelectron spectroscopy. The 2p1/2 and 2p3/2 peaks are characterized by doublets for both Cu9 and Cu27. The energies of the 2p3/2 doublet are 934.8 and 931.9 eV (Fig. 3), corresponding to CuII and CuI, respectively.17 A similar observation was made for the 2p1/2 peaks. Analysis of the areas of these two peaks gave CuI : CuII ratios of 43 : 57 and 23 : 77 respectively, consistent with the calculated balance of charge of the formula and crystallographic findings of 4CuI : 5CuII and 2CuI : 7CuII for Cu9 and Cu27. It is noted that the complete structural characterization from single crystals of the mixed valence of a common molecular brick is quite rare. The presence of different valences is very interesting in view of charge delocalization and thus band-filling. They are consequently reflected in the conductivity, which is also important in magnetic properties because of the similar structure with different numbers of spin carriers. In contrast to crystallographic data, XPS gives a more accurate definition of the valence states of the compounds and confirms that they belong to Class II of the mixed-valence classification.18
Fig. 3. Cu-2p3/2 valence band XPS spectra of (a) Cu9 and (b) Cu27. Spin density distributions (green is positive and blue is negative) for (c) Cu9 and (d) Cu27. The black labels are for Cu(ii) and the pink labels are for Cu(i).
Spin density calculations were performed for the two compounds built from the experimentally determined geometries with H atom optimization (Fig. 3 and Table S4†).19 We find that they are centred principally on the Cu atoms with some delocalization on the coordinated nitrogen atoms. Very little spin density is diffused onto the carbon atoms of the organic ligands. The oxidation states were evaluated by the localized orbital bonding analysis (LOBA) method within Mutliwfn and the results are presented in Table S4.† 20 The results indicated that Cu4, Cu5, Cu5′ and Cu6 are Cu(i), and the remaining copper ions are Cu(ii) in Cu9 and Cu5, Cu9, Cu14, Cu18, Cu23 and Cu27 are Cu(i), while all the other copper ions are Cu(ii) in Cu27.
Electrical conductivity
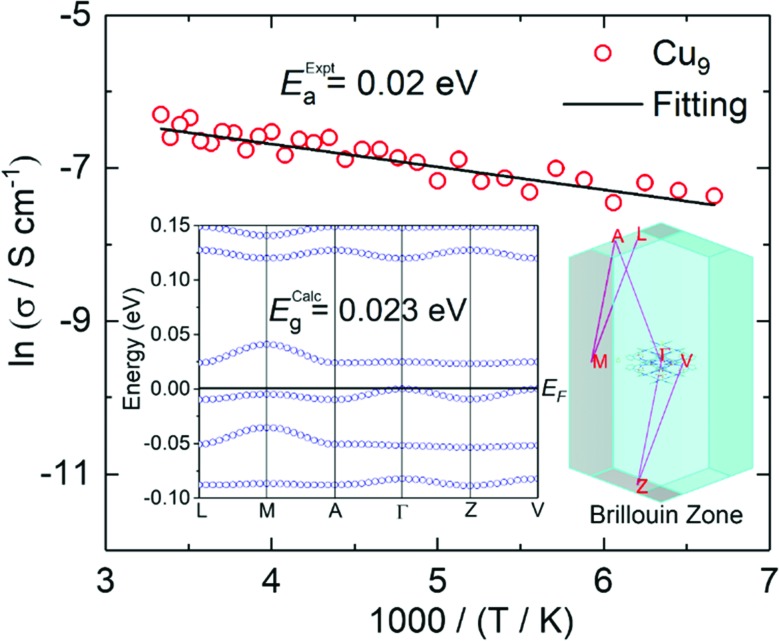
The high absorption and silvery lustre of the crystals are consistent with the mixed-valence found and therefore, they are expected to be conducting (Fig. S7†). Gold wires were attached on the surface using silver paste for two-probe resistance and I–V measurements at different temperatures. Measurements on single crystals of Cu9 found a room temperature conductivity of 3.2 × 10⁻² S cm–1 along the ab-plane (almost parallel to the plane of the molecules) and 4.3 × 10⁻⁸ S cm–1 perpendicular to it. The temperature dependence of the resistivity in the ab-plane follows an Arrhenius behaviour with a fairly low activation energy of 0.02 eV. Measurements for single crystals of Cu27 found a slightly lower room temperature conductivity of 10–3 S cm–1 along the bc-plane of the molecules but a higher one of 10–5 S cm–1 perpendicular to it (Fig. 4). The crystals of Cu27 lose the solvents with time and the temperature dependence measurement was hampered due to the vacuum needed for the cryostat. Monitoring the crystals under an optical microscope during the solvent evaporation reveals a limited stability and appearance of cleavages after dryness, presumably between the layers (Fig. S8†). The observed values of conductivity are quite promising for such molecules where charge becomes mobile within the solid through supramolecular π···π interactions as is the low activation energy in the case of Cu9.
Fig. 4. Arrhenius plot of ln(resistance) versus scaled inverse temperature (red circles represent experimental data and the black line is the linear fit). Inset: calculated band structure and Brillouin zone.
Magnetic properties and electron paramagnetic resonance
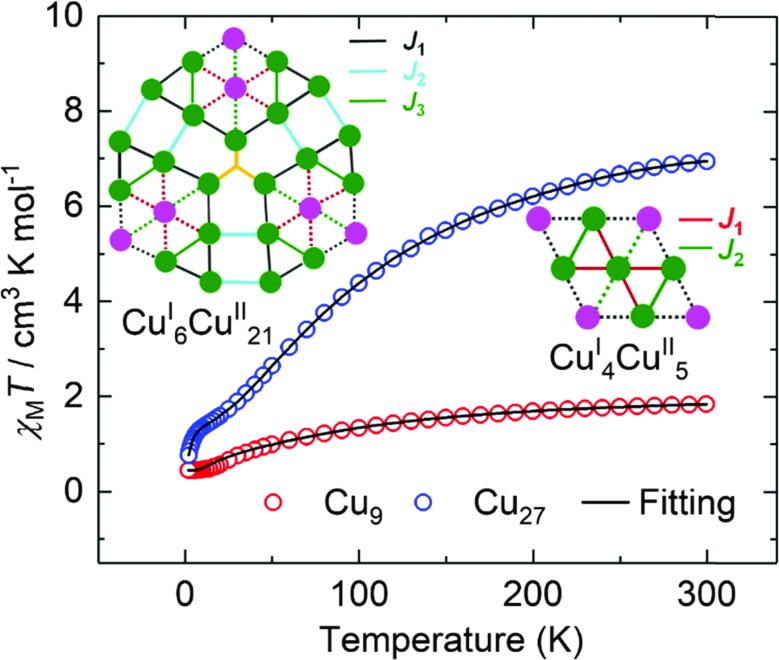
The temperature dependences of the magnetic moments, represented by the product of susceptibility and temperature, for the two compounds are shown in Fig. 5. We caution that loss of solvent for Cu27 may have taken place but the molecular structure and valence state are not altered. The values of χMT at 300 K for the polycrystalline samples are 1.88 and 6.94 cm3 mol–1 K for Cu9 and Cu27, respectively. Curie–Weiss fits for data above 150 K gave respectively C = 2.26 and 9.53 cm3 mol–1 K and θ = –70 and –110 K. From the Curie constants the average g-value is 2.19 ± 0.01, which is reasonable for Cu2+. The EPR spectra of polycrystalline samples are characterized by broad resonances (ΔHpp = 172 G and g = 2.06 (Cu9) and 580 G and g = 2.10 (Cu27)) (Fig. S9†). The large negative Weiss constants indicate strong antiferromagnetic coupling between the nearest neighbouring Cu(ii) ions. The temperature dependences of the susceptibility were modelled using the Hamiltonian given in equations (ESI†) giving, for Cu9, g = 2.15, J1 = –28.3 cm–1 and J2 = –27.8 cm–1.21 For Cu27, due to the large number of Cu(ii) and the limitation of computer ability, it is impossible to apply the irreducible tensor operator method used in PHI. By modifying the LOOP code22 of the Algorithms and Libraries for Physical Simulations (ALPS) project,23 we herein coupled the Genetic Algorithm with the Quantum Monte Carlo (GA-QMC) method to search for the global optimal parameters.24 Essentially, the entire spin exchange network per cluster (Fig. 5) was simplified to a 3 J model (see the Hamiltonian operator in the ESI†). In view of the large number of atoms per cluster and the considerable π···π supramolecular interaction, a temperature-independent paramagnetism (TIP) parameter and intercluster interaction (zJ) were respectively considered. After 200 iterations, the simulation yielded one set of optimal parameters: J1 = –4.9 cm–1, J2 = –210.7 cm–1, J3 = –3.8 cm–1, g = 2.19, TIP = 0.00 cm3 mol–1, zJ = 0.01 cm–1, and R = 4.25 × 10⁻⁵ (R = ∑[(χMT)obs – (χMT)calcd]2/∑[(χMT)obs]2). The values of the moments are direct electron counts and give support to the XPS and crystallography results while the excellent fits suggest that a localized moment picture is an adequate representation. Interestingly, the exchange through the C N bridge is the strongest compared to those through the N N bridge. The reduction in the values of the exchange interactions within the Cu9 segments of Cu27 may be due to the effect of the strong field of the bridging cyanide groups.
Fig. 5. The temperature dependence of χMT for Cu9 (red circles) and Cu27 (blue circles), measured in a field of 1.0 kOe. The solid black lines are the best fits (see text).
Optical properties
The optical properties of the compounds in the limiting region of 200–2000 nm were studied by diffuse reflectance measurements on the powdered samples in BaSO4. The spectra, shown in Fig. S10,† present an edge in each case where a linear extrapolation was used to estimate the band gap. Surprisingly, considering the crude approximated extrapolation, there is a general trend in the spectra. The band-gaps were 0.03 and 0.25 eV for Cu9 and Cu27, respectively, which are close to those found by conductivity measurements and band structure calculations.
Conclusions
A hierarchical tandem assembly, including coordination to nonanuclear [3×3] Cu9, its oligomerisation to a giant 3×[3×3] Cu27 cluster and finally the supramolecular organization into crystals, is achieved. The second step was revealed by MALDI-TOF and confirmed by single crystal diffraction. The oligomerisation step is facilitated by the presence of sulphate and in situ generated cyanide from acetonitrile. The oligomerisation is not observed in their absence. Their mixed-valence states were confirmed by X-ray photoelectron spectroscopy and the metallic lustre of the crystals is compatible with the fairly high electrical conductivities with three orders of magnitude anisotropy. The structure–electrical property relationship suggests that the π···π interaction between neighbouring molecules is the ingredient for the electron-transfer resulting in high conductivity and low activation energy. However, the magnetic susceptibility fittings to localized moment models are a clear indication that these two compounds belong to Class II of the mixed-valence classification. Furthermore, the experimental results are in good agreement with those estimated from DFT and band-structure calculations. Such large planar electroactive clusters which are highly absorbing in the visible region should be suitable for large surface area devices for harvesting light for energy purposes.
Experimental
Materials
All chemicals and solvents were obtained from commercial sources and utilized without further purification.
[CuI4CuII5(L)6](SO4)·2CH3OH (Cu9)
A CH3OH (8 mL, AR-grade ≥ 99.7%) solution of CuSO4·5H2O (28.0 mg, 0.112 mmol) and H2L (21.5 mg, 0.075 mmol) was adjusted to pH ≈ 8 with Et3N in a 15 mL Pyrex vial which was then tightly capped and heated at 140 °C for 24 h. After the autoclave was cooled to 30 °C at a rate of 5 °C h–1, the black needle shaped crystals of Cu9 were collected within one hour, washed with methanol, and dried in air (yield: 15.2 mg, 46% based on the ligand). ESI-MS (positive mode, CH3OH): m/z: 1144.97 (C96H60N36Cu9)2+. Elemental analysis (%) calculated for C98H68N36O6SCu9: C, 48.05; H, 2.80; N, 20.58; found: C, 48.56; H, 2.98; N, 20.22. Infrared (KBr, cm–1): 3412(m), 3098(m), 1616(s), 1588(w), 1532(m), 1456(s), 1324(m), 1166(s), 1128(s), 1052(m), 986(m), 788(s), 612(m).
[CuI6CuII21(L)18(CN)6(SO4)](SO4)2·8CH3CN (Cu27)
A suspension of CuSO4·5H2O (28.0 mg, 0.112 mmol) and H2L (21.5 mg, 0.075 mmol) in a mixture of 4 mL CH3OH and 4 mL CH3CN was adjusted to pH ≈ 8 with Et3N, filtered, and divided into two equal parts. The first part was slowly concentrated in air to give a black powder of a Cu9 complex which was only identified by ESI-MS. The second part was placed in a 15 mL Pyrex vial which was tightly capped and heated at 140 °C for 24 h. After the autoclave was cooled at a rate of 5 °C h–1 to 30 °C, black square block shaped crystals of Cu27 were collected, washed with ethanol, and dried in air (yield: 32.0 mg, 53% based on the ligand). MALDI-TOF (positive mode): m/z: 7313.25 {[CuI6CuII21(L)18(CN)6(SO4)](SO4)2}+. Elemental analysis (%) calculated for C310H204Cu27N122O12S3: C, 48.72; H, 2.69; N, 22.36; found: C, 48.53; H, 2.51; N, 22.65. Infrared (KBr, cm–1): 2174(w), 2104(w), 1604(s), 1562(m), 1524(w), 1450(s), 1436(s), 1348(s), 1242(w), 1154(m), 1108(w), 1048(m), 988(m), 774(s), 714(m).
Measurements
The C, H and N microanalyses were carried out with a Vario Micro Cube elemental analyzer. Thermogravimetric analyses (TGA) were performed on a NETZSCH STA 449 F3 Jupiter TGA instrument in flowing N2 at a heating rate of 5 °C per minute in the range of 40 to 800 °C. Samples for infrared (IR) were prepared as KBr pellets, and spectra were recorded in the 400–4000 cm–1 range using a Vector 22 Bruker spectrophotometer. UV-Vis-NIR spectra were recorded in diffuse reflectance mode on a UV-3600 Shimadzu spectrometer. Powder X-ray diffraction (PXRD) patterns were recorded at 293 K on a D8 ADVANCE (Cu Kα1, λ = 1.54056 Å; Kα2, λ = 1.54439 Å) powered at 40 kV and 40 mA. The powder samples were prepared by crushing the crystals and the PXRD scanned from 5 to 50° at a rate of 5° min–1. Calculated PXRD patterns were generated using Mercury 3.9.25 Mass spectra were recorded with an LCQ Fleet instrument for ESI-MS and an ultrafleXtreme TOF/TOF for MALDI-TOF/TOF mass spectrometry. Electron paramagnetic resonance (EPR) spectra were recorded on a Bruker ER-420 spectrometer with a 100 kHz magnetic field in the X band at room temperature (RT). X-ray photoelectron spectroscopy (XPS) studies were performed using a Thermo Fisher ESCALAB 250 X-ray photoelectron spectrometer (powered at 150 W) using Al Kα radiation (λ = 8.357 Å). Magnetisation measurements for polycrystalline samples were performed on a Quantum Design MPMS-SQUID-VSM magnetometer in the temperature range from 1.8 to 300 K for direct current (dc) applied fields ranging from 0 to 70 kOe. Diamagnetic corrections were calculated using Pascal's constants,26 and an experimental correction for the diamagnetic sample holder was applied. Temperature-dependent electrical conductivities and I–V curves were measured using a Keithley 4200 semiconductor parameter analyser using single crystal samples by the two-probe method using silver paste and gold wire contacts.
X-ray structure determination
The single-crystal X-ray diffraction data for Cu9 and Cu27 were collected on a Bruker D8 VENTURE diffractometer with a PHOTON 100 CMOS detector equipped with a Mo-target X-ray tube (λ = 0.71073 Å) at T = 150 K by using the φ–ω scan technique. Data were corrected for absorption using the empirical method SADABS.27 The structures were solved using SHELXT28 and refined using the full-matrix least-squares procedures within the SHELXTL software package.29 All non-hydrogen atoms were refined with anisotropic displacement parameters. The hydrogen atoms were generated geometrically (C–H = 0.95 Å) using the riding model. For all structures, the guest molecules were further confirmed by thermogravimetric analyses (TGA). It was not possible to resolve diffuse electron density residuals (enclosed solvent molecules). The co-crystallized solvent molecules were squeezed with the SQUEEZE facility from PLATON:30 8CH3CN for Cu27 (per asymmetric unit). Crystallographic information for all the complexes is presented in Table 1. Selected bond distances and angles are given in the ESI.† The crystallographic information files have been deposited at The Cambridge Crystallographic Data Centre with references ; 1844367 (Cu9) and ; 1844368 (Cu27); they can be obtained from ; http//:www.ccdc.cam.ac.uk/data_request/cif.
DFT calculations
All theoretical calculations were carried out at the DFT level of theory using the hybrid B3LYP/6-31g* exchange–correlation functional31–33 as implemented in the Gaussian 09 program.34 A quadratic convergence method was employed in the SCF process.35 The triple-ζ quality basis set proposed by Ahlrichs and coworkers has been used for all atoms.36 Calculations were performed on the complexes built from the experimentally determined geometries with H atom optimization.
Band structure calculations
To gain a good insight into the electrical and optical properties, we performed first-principles electronic structure calculations for Cu9 based on density functional theory with generalized gradient approximation (GGA) in the form of the Perdew–Burke–Ernzerhof (PBE) functional for exchange–correlation potential.37 We used the Cambridge Serial Total Energy Package (CASTEP),38 which is a self-consistent-field method (tolerance 5.0 × 10⁻⁵ eV per atom) in conjunction with plane-wave basis sets with a cut-off energy of 517 eV using OTFG ultrasoft pseudopotentials in reciprocal space.39 Calculations were performed starting with the crystal structure data of Cu9 at 150(2) K without optimization. The first Brillouin zone was sampled with a grid spacing of 0.005 Å–1 for wave functions and 0.05 Å–1 for the density of states (DOS) on the basis of the Monkhorst–Pack special k-point scheme.40
Conflicts of interest
There are no conflicts to declare.
Supplementary Material
Acknowledgments
This work was supported by the National Basic Research Program of China (2018YFA0306004) and the National Natural Science Foundation of China (No. 21631006). M. K. was funded by the Centre National de la Recherche Scientifique (CNRS), France. We thank the staff of the BL17B beamline of the National Facility for Protein Science Shanghai (NFPS) at the Shanghai Synchrotron Radiation Facility (SSRF), for assistance with X-ray data collection and Dr Zhenyi Zhang of Bruker (Beijing) Scientific Technology Co., Ltd., for help with structure refinement.
Footnotes
†Electronic supplementary information (ESI) available. CCDC 1844367 and 1844368. For ESI and crystallographic data in CIF or other electronic format see DOI: 10.1039/c8sc02851f
References
- Love J. C., Estroff L. A., Kriebel J. K., Nuzzo R. G., Whitesides G. M. Chem. Rev. 2005;105:1103–1169. doi: 10.1021/cr0300789. [DOI] [PubMed] [Google Scholar]
- Lopes W. A., Jaeger H. M. Nature. 2001;414:735–738. doi: 10.1038/414735a. [DOI] [PubMed] [Google Scholar]
- He Y., Ye T., Su M., Zhang C., Ribbe A. E., Jiang W., Mao C. Nature. 2008;452:198–201. doi: 10.1038/nature06597. [DOI] [PubMed] [Google Scholar]
- Ayme J.-F., Lehn J.-M. Adv. Inorg. Chem. 2018;71:3–78. [Google Scholar]
- Barboiu M., Stadler A.-M., Lehn J.-M. Angew. Chem., Int. Ed. 2016;55:4130–4154. doi: 10.1002/anie.201505394. [DOI] [PubMed] [Google Scholar]
- Kim Y., Mayer M. F., Zimmerman S. C. Angew. Chem., Int. Ed. 2003;42:1121–1126. doi: 10.1002/anie.200390295. [DOI] [PubMed] [Google Scholar]
- Teng P., Niu Z., She F., Zhou M., Sang P., Gray G. M., Verma G., Wojtas L., van der Vaart A., Ma S., Cai J. J. Am. Chem. Soc. 2018;140:5661–5665. doi: 10.1021/jacs.7b11997. [DOI] [PMC free article] [PubMed] [Google Scholar]
- Coskun A., Banaszak M., Astumian R. D., Stoddart J. F., Grzybowski B. A. Chem. Soc. Rev. 2012;41:19–30. doi: 10.1039/c1cs15262a. [DOI] [PubMed] [Google Scholar]
- Xie L. S., Sun L., Wan R., Park S. S., DeGayner J. A., Hendon C. H., Dincă M. J. Am. Chem. Soc. 2018;140:7411–7414. doi: 10.1021/jacs.8b03604. [DOI] [PubMed] [Google Scholar]
- Sun L., Hendon C. H., Park S. S., Tulchinsky Y., Wan R., Wang F., Walsh A., Dincă M. Chem. Sci. 2017;8:4550–4557. doi: 10.1039/c7sc00647k. [DOI] [PMC free article] [PubMed] [Google Scholar]
- Barth J. V., Costantini G., Kern K. Nature. 2005;437:671–679. doi: 10.1038/nature04166. [DOI] [PubMed] [Google Scholar]
- Deng Y.-K., Su H.-F., Xu J.-H., Wang W.-G., Kurmoo M., Lin S.-C., Tan Y.-Z., Jia J., Sun D., Zheng L.-S. J. Am. Chem. Soc. 2016;138:1328–1334. doi: 10.1021/jacs.5b11736. [DOI] [PubMed] [Google Scholar]
- Guo L.-Y., Su H.-F., Kurmoo M., Tung C.-H., Sun D., Zheng L.-S. J. Am. Chem. Soc. 2017;139:14033–14036. doi: 10.1021/jacs.7b08679. [DOI] [PubMed] [Google Scholar]
- Yu F., Li J., Cao Z.-H., Kurmoo M., Zuo J.-L. Inorg. Chem. 2018;57:3443–3450. doi: 10.1021/acs.inorgchem.8b00243. [DOI] [PubMed] [Google Scholar]
- Janculev J., Podolesov B. God. Zb., Filoz. Fak. Univ., Skopje, Prir.-Mat. Oddel. 1958;11:47–49. [Google Scholar]
- Terashima S., Newton G. N., Shiga T., Oshio H. Inorg. Chem. Front. 2015;2:125–128. [Google Scholar]
- Wu Z.-L., Wang C.-H., Zhao B., Dong J., Lu F., Wang W.-H., Wang W.-C., Wu G.-J., Cui J.-Z., Cheng P. Angew. Chem., Int. Ed. 2016;55:4938–4942. doi: 10.1002/anie.201508325. [DOI] [PubMed] [Google Scholar]
- Robin M. B., Day P. Adv. Inorg. Chem. Radiochem. 1968;10:247–422. [Google Scholar]
- Vosko S. H., Wilk L., Nusair M. Can. J. Phys. 1980;58:1200–1211. [Google Scholar]
- Lu T., Chen F. J. Comput. Chem. 2012;33:580–592. doi: 10.1002/jcc.22885. [DOI] [PubMed] [Google Scholar]
- Chilton N. F., Anderson R. P., Turner L. D., Soncini A., Murray K. S. J. Comput. Chem. 2013;34:1164–1175. doi: 10.1002/jcc.23234. [DOI] [PubMed] [Google Scholar]
- Sandvik A. W. Phys. Rev. B: Condens. Matter Mater. Phys. 1999;59:R14157–R14160. [Google Scholar]
- Albuquerque A. F., Alet F., Corboz P., Dayal P., Feiguin A., Fuchs S., Gamper L., Gull E., Gürtler S., Honecker A., Igarashi R., Körner M., Kozhevnikov A., Läuchli A., Manmana S. R., Matsumoto M., McCulloch I. P., Michel F., Noack R. M., Pawłowski G., Pollet L., Pruschke T., Schollwöck U., Todo S., Trebst S., Troyer M., Werner P., Wessel S. J. Magn. Magn. Mater. 2007;310:1187–1193. [Google Scholar]
- Forrest S. Science. 1993;261:872–878. doi: 10.1126/science.8346439. [DOI] [PubMed] [Google Scholar]
- Mercury CSD 3.9 (Build RC1), CCDC, 2016.
- Bain G. A., Berry J. F. J. Chem. Educ. 2008;85:532–536. [Google Scholar]
- Sheldrick G. M., SADABS—Bruker AXS Area Detector Scaling and Absorption, 2008. [Google Scholar]
- Sheldrick G. M. Acta Crystallogr., Sect. A: Found. Adv. 2015;A71:3–8. doi: 10.1107/S2053273314026370. [DOI] [PMC free article] [PubMed] [Google Scholar]
- Sheldrick G. M. Acta Crystallogr., Sect. C: Struct. Chem. 2015;C71:3–8. doi: 10.1107/S2053229614024218. [DOI] [PMC free article] [PubMed] [Google Scholar]
- van der Sluis P., Spek A. L. Acta Crystallogr., Sect. A: Found. Crystallogr. 1990;46:194–201. [Google Scholar]
- Becke A. D. Phys. Rev. A: At., Mol., Opt. Phys. 1988;38:3098–3100. doi: 10.1103/physreva.38.3098. [DOI] [PubMed] [Google Scholar]
- Lee C. T., Yang W. T., Parr R. G. Phys. Rev. B: Condens. Matter Mater. Phys. 1988;37:785–789. doi: 10.1103/physrevb.37.785. [DOI] [PubMed] [Google Scholar]
- Becke A. D. J. Chem. Phys. 1993;98:5648–5652. [Google Scholar]
- Frisch M. J., Trucks G. W., Schlegel H. B., Scuseria G. E., Robb M. A., Cheeseman J. R., Scalmani G., Barone V., Mennucci B., Petersson G. A., Nakatsuji H., Caricato M., Li X., Hratchian H. P., Izmaylov A. F., Bloino J., Zheng G., Sonnenberg J. L., Hada M., Ehara M., Toyota K., Fukuda R., Hasegawa J., Ishida M., Nakajima T., Honda Y., Kitao O., Nakai H., Vreven T., Montgomery Jr J. A., Peralta J. E., Ogliaro F., Bearpark M., Heyd J. J., Brothers E., Kudin K. N., Staroverov V. N., Kobayashi R., Normand J., Raghavachari K., Rendell A., Burant J. C., Iyengar S. S., Tomasi J., Cossi M., Rega N., Millam J. M., Klene M., Knox J. E., Cross J. B., Bakken V., Adamo C., Jaramillo J., Gomperts R., Stratmann R. E., Yazyev O., Austin A. J., Cammi R., Pomelli C., Ochterski J. W., Martin R. L., Morokuma K., Zakrzewski V. G., Voth G. A., Salvador P., Dannenberg J. J., Dapprich S., Daniels A. D., Farkas Ö., Foresman J. B., Ortiz J. V., Cioslowski J. and Fox D. J., Gaussian 09, rev. B.01, Gaussian, Inc., Wallingford CT, 2009.
- Bacskay G. B. Chem. Phys. 1981;61:385–404. [Google Scholar]
- Schäfer A., Huber C., Ahlrichs R. J. Chem. Phys. 1994;100:5829–5835. [Google Scholar]
- Perdew J. P., Burke K., Ernzerhof M. Phys. Rev. Lett. 1996;77:3865–3868. doi: 10.1103/PhysRevLett.77.3865. [DOI] [PubMed] [Google Scholar]
- Clark S. J., Segall M. D., Pickard C. J., Hasnip P. J., Probert M. I. J., Refson K., Payne M. C. Z. Kristallogr. 2005;220:567–570. [Google Scholar]
- Fei Z., Shi Y., Pu L., Gao F., Liu Y., Sheng L., Wang B. G., Zhang R., Zheng Y. D. Phys. Rev. B: Condens. Matter Mater. Phys. 2008;78:201402. [Google Scholar]
- Monkhorst H. J., Pack J. D. Phys. Rev. B: Solid State. 1976;13:5188–5192. [Google Scholar]
Associated Data
This section collects any data citations, data availability statements, or supplementary materials included in this article.


