Abstract
The proto-oncogene Bcl3 induces survival and proliferation in cancer cells; however, its function and regulation in ovarian cancer (OC) remain unknown. Here, we show that Bcl3 expression is increased in human OC tissues. Surprisingly, however, we found that in addition to promoting survival, proliferation, and migration of OC cells, Bcl3 promotes both constitutive and interferon-γ (IFN)-induced expression of the immune checkpoint molecule PD-L1. The Bcl3 expression in OC cells is further increased by IFN, resulting in increased PD-L1 transcription. The mechanism consists of an IFN-induced, Bcl3- and p300-dependent PD-L1 promoter occupancy by Lys-314/315 acetylated p65 NF-κB. Blocking PD-L1 by neutralizing antibody reduces proliferation of OC cells overexpressing Bcl3, suggesting that the pro-proliferative effect of Bcl3 in OC cells is partly mediated by PD-L1. Together, this work identifies PD-L1 as a novel target of Bcl3, and links Bcl3 to IFNγ signaling and PD-L1-mediated immune escape.
Keywords: oncogene, transcription regulation, ovarian cancer, immunology, interferon, Bcl3, PD-L1
Introduction
The proto-oncogene Bcl3 is a member of IκB family that was first identified in patients with chronic lymphocytic leukemia (1, 2). However, unlike other IκB proteins in cancer cells, Bcl3 is a predominantly nuclear protein, which contains a transactivation domain, and can be recruited to NF-κB-responsive promoters, resulting in transcriptional activation or repression, depending on the subunit composition of NF-κB complexes, and other transcription factors and regulators present in the transcription complexes (3–9). High expression of Bcl3 has been reported in a number of hematological malignancies (10–16), as well as in several solid tumors, including breast cancer, nasopharyngeal carcinoma, and colorectal and cervical cancer (17–23). Consistent with its oncogenic function, Bcl3 can transform cells and induce their proliferation and tumor growth (24). Recent studies have shown that miR-125b, which targets Bcl3, is down-regulated in ovarian cancer (OC)2 tissues (25, 26), suggesting an increased Bcl3 expression in ovarian cancer. However, the Bcl3 expression in OC has not been investigated, and its function in OC cells remains unknown.
Epithelial ovarian cancer (EOC) is the most common gynecological cancer in women, with poor survival and high mortality rates. As many other types of cancer, EOC is characterized by an increased activity of the transcription factor NF-κB (27–29), which promotes expression of anti-apoptotic and pro-angiogenic genes. However, recent studies have shown that in addition to inducing expression of anti-apoptotic and pro-inflammatory genes, NF-κB induces transcription of the immune checkpoint molecule, programmed death ligand 1 (PD-L1; B7-H1, CD274) (30–35). PD-L1 expression on tumor cells is induced by interferon-γ (IFN). By binding to programmed cell death-1 (PD-1) expressed on cytotoxic T cells, PD-L1 then induces T cell apoptosis and tolerance, thus inhibiting the antitumor immunity. However, tumor PD-L1 has also tumor-intrinsic effects that include increased cancer cell survival and proliferation, regulation of tumor glucose utilization, and inhibition of autophagy (36–38). PD-L1 is expressed on the surface of OC cells, and its increased expression correlates with poor prognosis in OC patients (38–41); however, the mechanisms that regulate the PD-L1 expression in OC cells are not known.
Here, we show that Bcl3 expression is increased in human EOC tissues, and Bcl3 overexpression promotes survival, proliferation, and migration of OC cells. Remarkably, however, our results show that in addition to promoting survival and proliferation, Bcl3 induces both constitutive and IFN-induced PD-L1 expression in OC cells. The mechanism consists of Bcl3- and p300-mediated recruitment of Lys-314/315 acetylated p65 NF-κB to the PD-L1 promoter in IFN-treated cells. In OC cells overexpressing Bcl3, neutralization of the induced PD-L1 decreases cell proliferation, indicating that the pro-proliferative effect of Bcl3 is partly mediated by PD-L1. These data identify PD-L1 as a novel target of Bcl3, and suggest that in addition to promoting cell proliferation, Bcl3 regulates immune escape in cancer cells.
Results
Bcl3 expression is increased in human OC tissues, and promotes survival, proliferation, and migration of OC cells
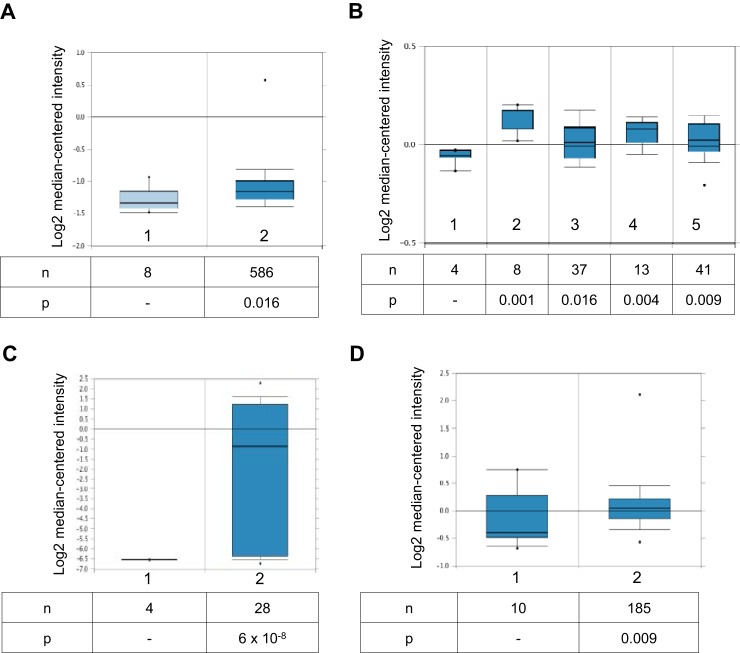
Expression of miR-125b, which targets Bcl3, is down-regulated in OC tissues (25, 26). However, it is not known whether Bcl3 gene expression is increased in ovarian cancer. To evaluate the Bcl3 expression in OC tissues, we analyzed Bcl3 levels using the Oncomine database (https://www.oncomine.org/resource/login.html).3 Analysis of the TCGA dataset containing 586 ovarian serous cystadenocarcinoma, the most common type of EOC, revealed a significantly (fold-change = 1.131, p = 0.016) increased Bcl3 expression compared with normal ovary tissues (Fig. 1A). In addition, analysis of Hendrix dataset (42) showed a significantly increased Bcl3 expression in ovarian clear cell adenocarcinoma (n = 8, fold-change = 1.123, p = 0.001), ovarian endometrioid adenocarcinoma (n = 37, fold-change = 1.060, p = 0.016), ovarian mucinous adenocarcinoma (n = 13, fold-change = 1.095, p = 0.004), and ovarian serous adenocarcinoma (n = 41, fold-change = 1.565 p = 0.009), compared with normal ovary tissues (Fig. 1B). Interestingly, there was a dramatic increase in the Bcl3 expression in ovarian serous surface papillary carcinoma (n = 28, fold-change = 23.955, p = 6 × 10⁻⁸) in the Welsh (43) dataset (Fig. 1C). In addition, Bcl3 was increased in ovarian carcinoma in the Bonome (n = 185, fold-change = 1.361, p = 0.009; Fig. 1D) (44) dataset. Together, analysis of four different public datasets containing 26 control ovarian tissues and 898 OC samples has shown a statistically increased Bcl3 gene expression in OC tissues (p ≤ 0.016).
Figure 1.
Bcl3 gene expression is increased in human OC tissues. A, expression of Bcl3 mRNA in normal ovary tissues (column 1) and ovarian serous cystadenocarcinoma (column 2). Data were retrieved from The Cancer Genome Atlas (TCGA) Oncomine data set. B, Bcl3 mRNA levels in normal ovary tissues (column 1), ovarian clear cell adenocarcinoma (column 2), ovarian endometrioid adenocarcinoma (column 3), ovarian mucinous adenocarcinoma (column 4), and ovarian serous adenocarcinoma (column 5). Data were retrieved from the Hendrix Ovarian Statistics (42) dataset. C, Bcl3 expression in normal ovary tissues (column 1) and ovarian serous surface papillary carcinoma tissues (column 2) retrieved from the Welsh dataset (43). D, Bcl3 expression in normal ovary tissues (column 1) and in ovarian carcinoma (column 2) retrieved from the Bonome dataset (44).
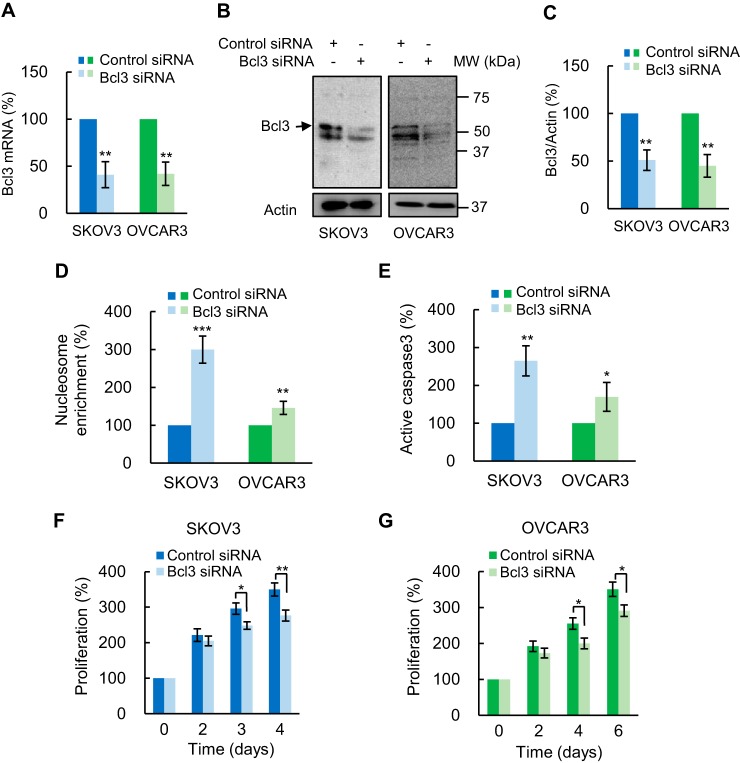
To explore the functional significance of Bcl3 in OC cells, we first examined the effect of Bcl3 suppression on OC cell apoptosis, proliferation, and migration. Suppression of Bcl3 by siRNA decreased Bcl3 mRNA (Fig. 2A) and protein (Fig. 2, B and C) levels in SKOV3 and OVCAR3 cells by about 50% compared with control scramble siRNA. Of note, in whole cell extracts (WCE) of OC cells, Bcl3 runs as a doublet of an approximate 50 kDa on SDS gels (Fig. 2B), consistent with previous reports demonstrating Bcl3 phosphorylation (24, 45–47). Importantly, Bcl3 suppression significantly increased apoptosis, evaluated by nucleosome release into the cytoplasm (Fig. 2D) (48) and by caspase-3 assay (Fig. 2E), and decreased proliferation of SKOV3 (Fig. 2F) and OVCAR3 (Fig. 2G) cells. Furthermore, Bcl3 suppression by siRNA significantly reduced migration of OC cells (Fig. 3).
Figure 2.
Bcl3 suppression induces apoptosis and reduces proliferation of OC cells. A, Bcl3 mRNA analyzed by quantitative RT-PCR in SKOV3 and OVCAR3 cells transfected with control and Bcl3 siRNA (n = 4). B, Bcl3 Western blotting in WCE prepared from SKOV3 and OVCAR3 cells transfected with control and Bcl3 siRNA. C, densitometric evaluation of Bcl3 protein levels shown in B. The Bcl3 densities were normalized to actin. Apoptosis measured by cytoplasmic nucleosome enrichment assay (D), and caspase-3 activity (E) in SKOV3 and OVCAR3 cells transfected with control or Bcl3 siRNA. Cell proliferation was measured by CellTiter 96 One Solution cell proliferation assay in SKOV3 (F) and OVCAR3 (G) cells transfected with control or Bcl3 siRNA. The values represent the mean ± S.E. of four experiments; *, p < 0.05; **, p < 0.01; ***, p < 0.001 compared with cells transfected with the corresponding control siRNA.
Figure 3.
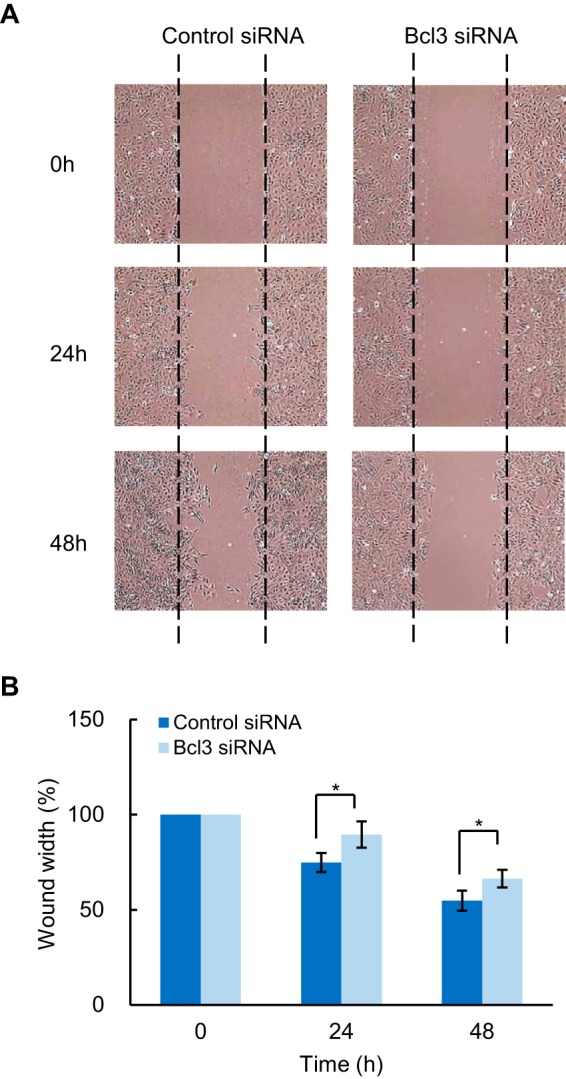
Bcl3 suppression inhibits migration of OC cells. A, SKOV3 cells transfected with control or Bcl3 siRNA were subjected to wound healing assay. Representative photographs at the indicated times from three independent experiments performed in triplicates are shown. Magnification: ×10. B, the wound width was measured in five random fields using ImageJ software by normalizing the average wound width at 24 and 48 h to the average wound width at 0 h. The samples were measured in triplicates and expressed as mean ± S.E.
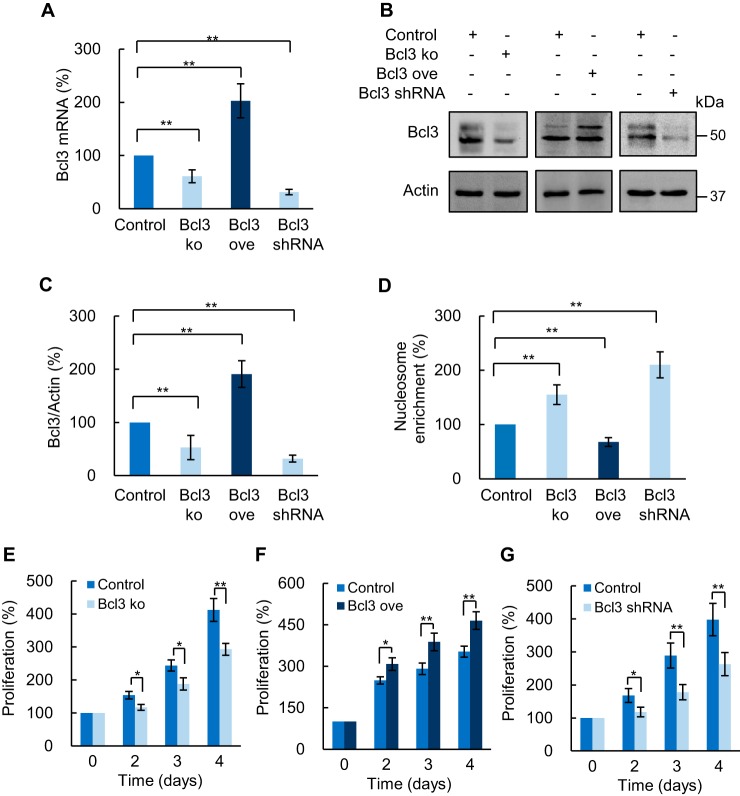
To validate the above data, we suppressed and overexpressed Bcl3 in SKOV3 cells using CRISPR knockout and activation plasmids. Suppression of Bcl3 by CRISPR/Cas9 reduced both Bcl3 mRNA (Fig. 4A) and protein levels (Fig. 4, B and C). Importantly, Bcl3 suppression significantly increased apoptosis (Fig. 4D) and decreased proliferation (Fig. 4E) in SKOV3 cells. Conversely, Bcl3 overexpression decreased apoptosis (Fig. 4D) and increased cell proliferation (Fig. 4F). To confirm these data, we generated SKOV3 cells stably transfected with Bcl3 shRNA. Compared with the control SKOV3 cell line transfected with empty expression vector, SKOV3 cells stably transfected with Bcl3 shRNA express significantly decreased Bcl3 mRNA (Fig. 4A) and protein (Fig. 4, B and C) levels. Importantly, these cells exhibit increased apoptosis (Fig. 4D) and reduced proliferation (Fig. 4G) compared with control SKOV3 cells. These data demonstrate that Bcl3 promotes OC cell survival, migration, and proliferation.
Figure 4.
Bcl3 overexpression induces survival and proliferation of OC cells. A, RT-PCR of Bcl3 mRNA in SKOV3 cells transfected with CRISPR knockout (KO), overexpression (ove) plasmid, or stably transfected with Bcl3 shRNA. B, Western blotting of Bcl3 in WCE prepared from SKOV3 cells transfected with control, Bcl3 KO, Bcl3 ove plasmids, or stably transfected with Bcl3 shRNA. C, densitometric evaluation of Bcl3 protein levels shown in B; the Bcl3 densities were normalized to actin, and expressed as % compared with cells transfected with control plasmid. D, apoptosis measured by nucleosome enrichment assay in SKOV3 cells transfected with control, Bcl3 KO, Bcl3 ove plasmid, and stably transfected with Bcl3 shRNA. Cell proliferation was measured by CellTiter 96 One Solution cell proliferation assay in SKOV3 cells transfected with (E) Bcl3 KO, (F) Bcl3 ove plasmid, or (G) stably transfected with Bcl3 shRNA. The values represent the mean ± S.E. of three experiments; *, p < 0.05; **, p < 0.01; ***, p < 0.001 compared with cells transfected with the corresponding control plasmid.
Bcl3 mediates constitutive PD-L1 expression in OC cells
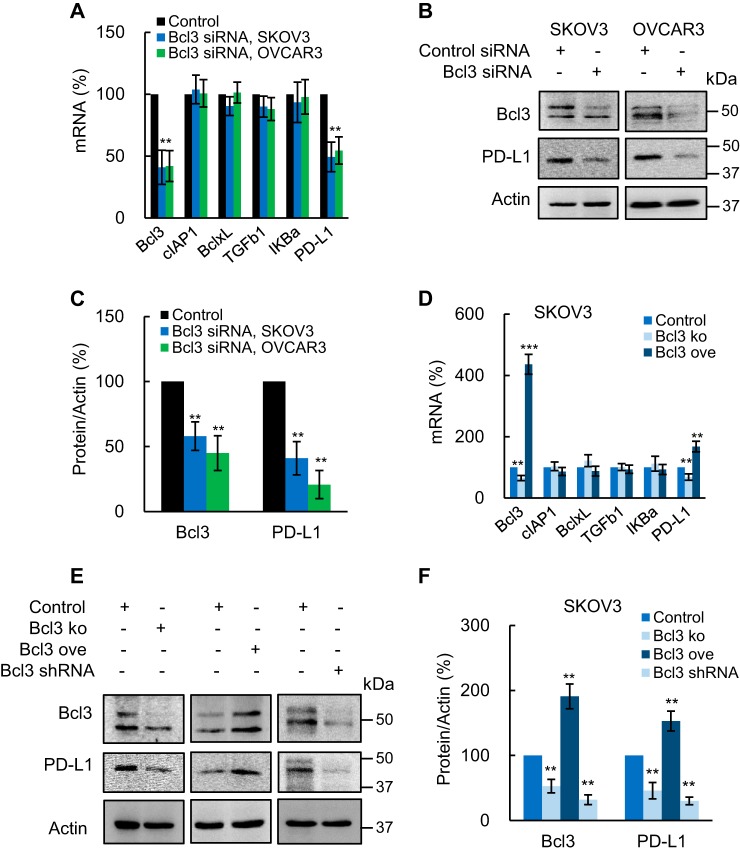
Because Bcl3 regulates NF-κB-dependent transcription, we analyzed expression of NF-κB-dependent genes cIAP1, BclxL, TGFβ1, and IκBα in SKOV3 and OVCAR3 cells transfected with Bcl3 siRNA. In addition, because PD-L1 promotes OC growth and cell proliferation (38, 49), and is regulated by NF-κB (30–35), we wondered whether Bcl3 might regulate PD-L1 expression in OC cells. Remarkably, whereas Bcl3 suppression by siRNA did not have a substantial effect on cIAP1, BclxL, TGFβ1, and IκBα mRNA levels, it significantly reduced PD-L1 expression in SKOV3 and OVCAR3 cells (Fig. 5A). In addition, Bcl3 suppression by siRNA significantly decreased the intracellular PD-L1 protein levels in both cell types (Fig. 5, B and C).
Figure 5.
Bcl3 promotes constitutive PD-L1 expression in OC cells. A, expression of NF-κB-dependent genes measured by RT-PCR in SKOV3 and OVCAR3 cells transfected with control and Bcl3 siRNA. B, Western blotting of Bcl3, PD-L1, and control actin in WCE from SKOV3 and OVCAR3 cells transfected with control and Bcl3 siRNA. C, densitometric evaluation of Bcl3 and PD-L1 protein levels shown in B; Bcl3 and PD-L1 densities were normalized to actin, and expressed as % compared with cells transfected with the control plasmids. D, RT-PCR of NF-κB-dependent genes in SKOV3 cells transfected with control, Bcl3 KO, or Bcl3 ove plasmids. E, Western blotting of Bcl3 and PD-L1 in WCE from SKOV3 cells transfected with control, Bcl3 KO, Bcl3 ove plasmids, or stably transfected with Bcl3 shRNA. For cells stably transfected with Bcl3 shRNA, the same gel as in Fig. 4B was used and the membrane was re-probed with PD-L1 antibody (the same images for Bcl3 and actin were used as in Fig. 4B). F, densitometric evaluation of Bcl3 and PD-L1 protein levels shown in E; Bcl3 and PD-L1 densities were normalized to actin, and expressed as % compared with cells transfected with control plasmids. The values represent the mean ± S.E. of three experiments.
To confirm these results, we analyzed PD-L1 expression in SKOV3 cells transfected with Bcl3 CRISPR knockout and activation plasmids. Although Bcl3 suppression by CRISPR knockout did not have a significant effect on cIAP1, BclxL, TGFβ1, and IκBα mRNA levels, it significantly reduced PD-L1 mRNA (Fig. 5D). Conversely, Bcl3 overexpression increased PD-L1 mRNA in SKOV3 cells, but not expression of cIAP1, BclxL, TGFβ1, or IκBα (Fig. 5D). Bcl3 suppression by CRISPR knockout also significantly decreased the intracellular PD-L1 levels, whereas Bcl3 overexpression increased the PD-L1 protein expression in SKOV3 cells (Fig. 5, E and F). Importantly, SKOV3 cells stably transfected with Bcl3 shRNA express significantly reduced PD-L1 protein levels (Fig. 5, E and F). Together, these results indicate that Bcl3 promotes constitutive PD-L1 expression in OC cells.
IFN induces Bcl3 expression in OC cells
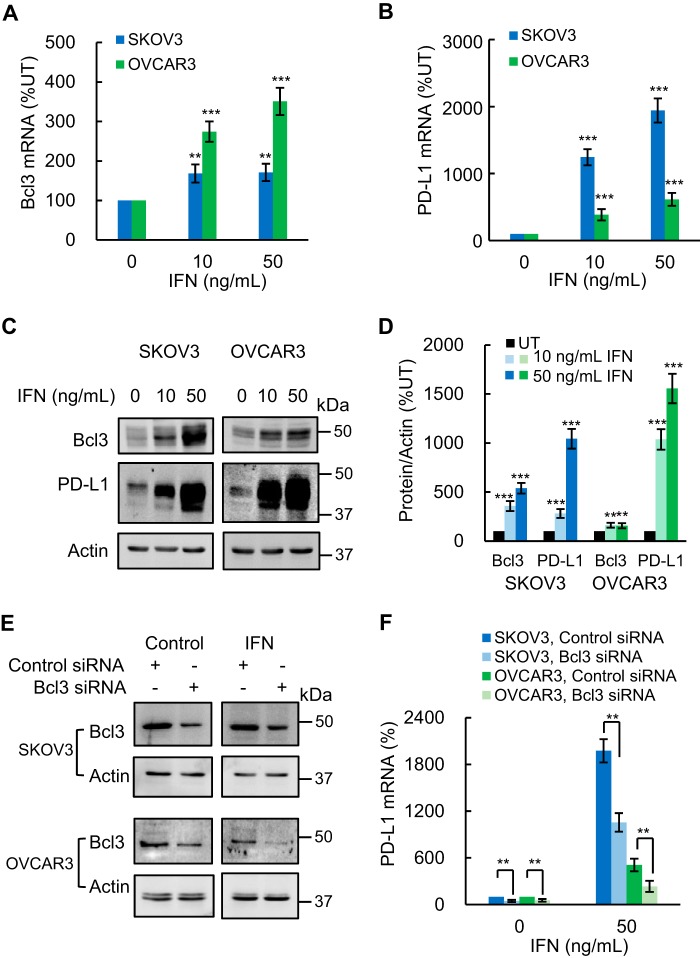
PD-L1 expression on tumor cells, including OC cells, is induced by IFN produced by CD8 T cells (50–52). Because our data showed that Bcl3 promotes PD-L1 expression in OC cells (Fig. 5), we asked whether IFN might regulate the Bcl3 expression. In this regard, Bcl3 expression was reported to be up-regulated by pro-inflammatory cytokines including TNFα, IL-1β, and IL-6 (20). However, to our knowledge, there is no available evidence showing that IFN induces Bcl3 expression. Indeed, human recombinant IFN significantly increased Bcl3 mRNA levels in SKOV3 and OVCAR3 cells (Fig. 6A). In addition, in agreement with a previous study demonstrating increased surface expression of PD-L1 in IFN-treated OC cells (52), IFN significantly increased PD-L1 mRNA levels in both OC cell lines (Fig. 6B). Importantly, IFN also increased intracellular Bcl3 and PD-L1 protein levels in SKOV3 and OVCAR3 cells (Fig. 6, C and D). Together, these data demonstrated that IFN induces Bcl3 expression in OC cells, and suggested a link between IFN, Bcl3, and PD-L1 signaling.
Figure 6.
IFN induces Bcl3 expression, resulting in increased PD-L1 expression in OC cells. A and B, RT-PCR of Bcl3 (A) and PD-L1 (B) mRNA in SKOV3 and OVCAR3 cells incubated 48 h with increasing IFN. C, Western blotting of Bcl3 and PD-L1 in WCE of SKOV3 and OVCAR3 cells incubated 48 h with IFN. D, densitometric evaluation of Bcl3 and PD-L1 protein levels shown in C; Bcl3 and PD-L1 densities were normalized to actin, and expressed as % compared with untreated (UT) cells. E, Western blotting of Bcl3 in WCE from IFN-treated SKOV3 and OVCAR3 cells transfected with control and Bcl3 siRNA. F, PD-L1 mRNA in IFN-treated SKOV3 and OVCAR3 cells transfected with control and Bcl3 siRNA. The values represent the mean ± S.E. of three experiments.
Bcl3 mediates IFN-induced PD-L1 expression in OC cells
Having shown that Bcl3 promotes the basal PD-L1 expression in OC cells (Fig. 5), and that IFN increases the intracellular levels of Bcl3 and PD-L1 (Fig. 6, A–D), we wanted to determine whether Bcl3 mediates also the IFN-induced PD-L1 expression in OC cells. To this end, we analyzed PD-L1 expression in IFN-treated SKOV3 and OVCAR3 cells transfected with control and Bcl3 siRNA. Bcl3 suppression (Fig. 6E) significantly attenuated the IFN-induced PD-L1 expression in SKOV3 and OVCAR3 cells (Fig. 6F), indicating that Bcl3 mediates the IFN-induced PD-L1 expression in OC cells.
IFN induces PD-L1 promoter occupancy by p65, Lys-314/315 acetylated p65, and p300
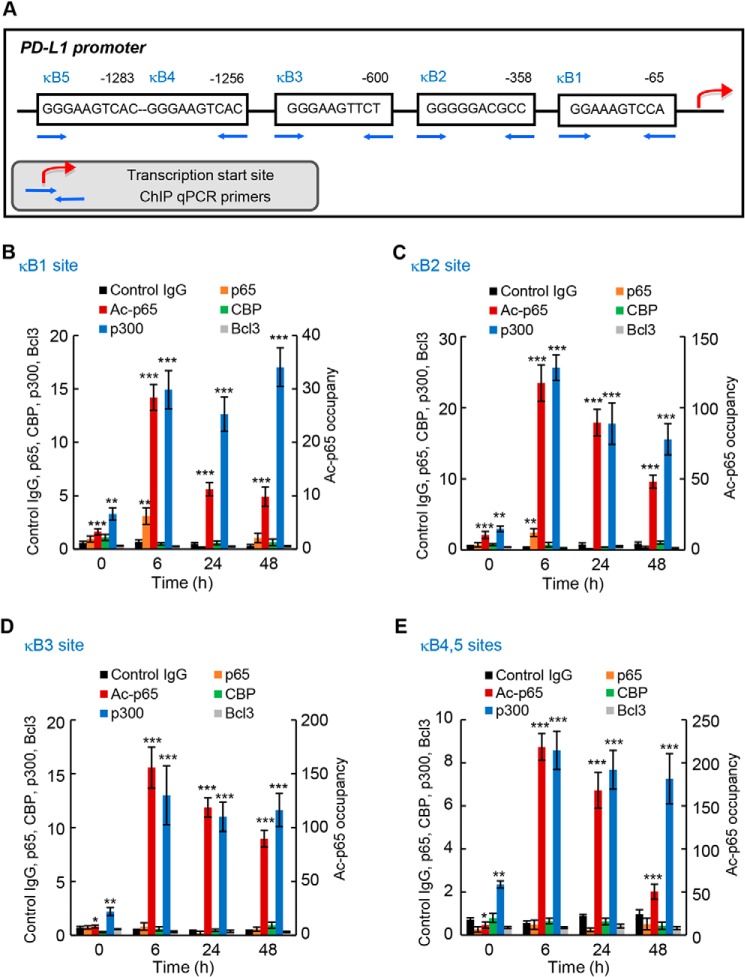
Because recent studies have shown that PD-L1 expression is regulated by p65 NF-κB (30–35), we wanted to determine whether the Bcl3-mediated PD-L1 expression in IFN-treated OC cells is associated with an increased p65 promoter occupancy. Furthermore, because Lys-314/315 acetylation of p65 regulates its transcriptional activity in OC cells (53), we analyzed the PD-L1 promoter occupancy by Lys-314/315 ac-p65. The human PD-L1 promoter contains several putative NF-κB–binding sites: κB1 site (GGAAAGTCCA) (30) located at position −65 upstream from the transcription start site (TSS), κB2 site (GGGGGACGCC) (34) located −358 from TSS, κB3 site (GGGAAGTTCT) located −600 from TSS (30), and κB4/κB5 sites containing an identical putative NF-κB binding sequence (GGGAAGTCAC) located −1256 and −1283 from TSS (Fig. 7A). So far, p65 recruitment to the κB2 site has been demonstrated in non-small cell lung cancer and triple negative breast cancer cells (34, 35), and p65 was also recruited to the κB3 site in lipopolysaccharide-stimulated macrophages (30). However, it is not known whether NF-κB binds to the κB1 and/or κB4/κB5 sites, or whether NF-κB occupies the PD-L1 promoter in OC cells.
Figure 7.
IFN induces PD-L1 promoter occupancy by p65, Lys-314/315 acetylated p65, and p300 in OC cells. A, schematic illustration of NF-κB–binding sites in human PD-L1 promoter, and ChIP primers used in the ChIP assay. B–E, recruitment of p65, Lys-314/315 ac-p65, CBP, p300, and Bcl3 to PD-L1 κB1 (B), κB2 (C), κB3 (D), and κB4/κB5 sites (E) in IFN (50 ng/ml)-treated SKOV3 cells was analyzed by ChIP and quantified by real-time PCR; ChIP using control IgG is also shown. Each condition (antibody used at each time point) represents ∼1.25 × 10⁵ cells. The data are presented as fold-difference in occupancy of the particular protein at the particular locus compared with the human IGX1A (SA Biosciences) locus, and represent the mean ± S.E. of three experiments. Asterisks denote a statistically significant (*, p < 0.05; **, p < 0.01; ***, p < 0.001) change compared with ChIP using control IgG at the corresponding time.
Thus, we first analyzed using chromatin immunoprecipitation (ChIP) whether p65 and Lys-314/315 ac-p65 are recruited to the PD-L1 κB1, κB2, κB3, and κB4/κB5 sites (Fig. 7A) in IFN-treated SKOV3 cells. Compared with ChIP using control IgG, we detected a statistically significant recruitment of p65 to κB1 (Fig. 7B) and κB2 (Fig. 7C) sites in 6-h IFN-treated cells, even though this occupancy was relatively low. We did not observe any significant recruitment of p65 to κB3 (Fig. 7D) and κB4/κB5 (Fig. 7E) sites. Intriguingly, however, IFN induced a robust recruitment of Lys-314/315 ac-p65, which regulates the specificity of NF-κB-dependent transcription (54, 55), to all κB sites in the PD-L1 promoter (Fig. 7, B–E).
To determine whether the increased PD-L1 promoter occupancy by Lys-314/315 ac-p65 is associated with an increased occupancy of a histone acetyltransferase (HAT), we analyzed recruitment of the HATs cAMP-response element-binding protein (CBP) and p300, known to acetylate p65 (56). Although CBP was not significantly recruited, p300 was heavily recruited to all κB sites in the PD-L1 promoter, and this recruitment was further enhanced by IFN treatment (Fig. 7, B–E). In addition, we tested whether the PD-L1 promoter is occupied by Bcl3; however, we did not observe any significant recruitment (Fig. 7, B–E).
Bcl3 and p300 mediate IFN-induced Lys-314/315 ac-p65 recruitment to PD-L1 promoter
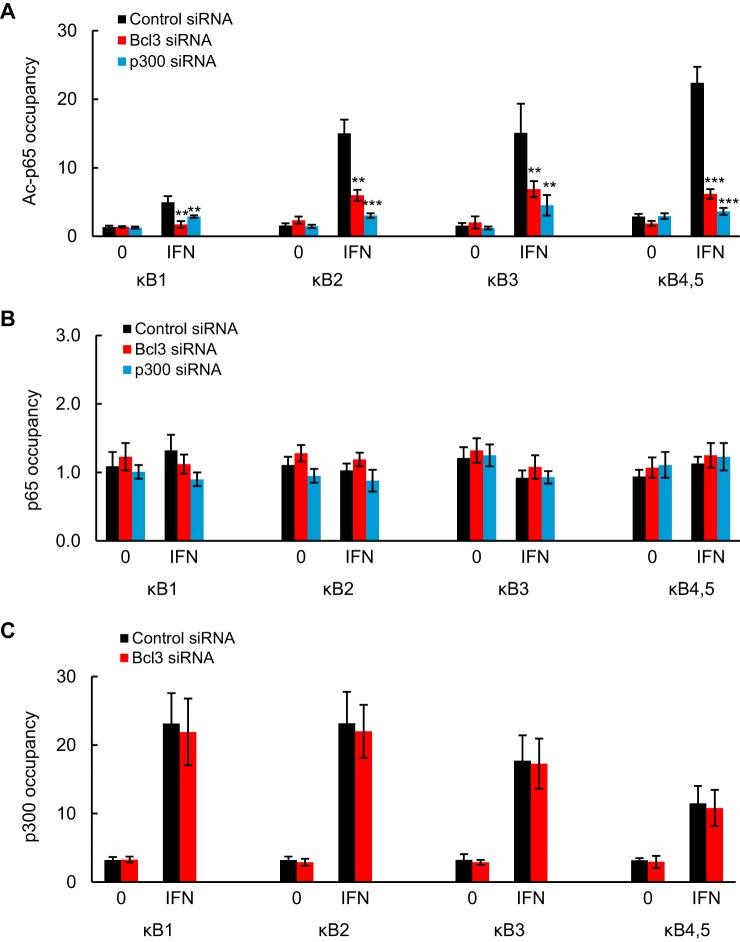
Even though Bcl3 was not directly recruited to PD-L1 promoter, we wanted to test whether it might mediate the IFN-induced Lys-314/315 ac-p65, p65, and p300 occupancy. In addition, because p300 was recruited to the PD-L1 promoter, we analyzed whether it might facilitate the Lys-314/315 ac-p65 promoter occupancy. To this end, we measured Lys-314/315 ac-p65, p65, and p300 recruitment to PD-L1 promoter in SKOV3 cells transfected with control, Bcl3, and p300 siRNA and treated with IFN (0 and 50 ng/ml) for 6 h. Interestingly, both Bcl3 and p300 silencing significantly suppressed the IFN-induced PD-L1 promoter occupancy by Lys-314/315 ac-p65 (Fig. 8A). In contrast, p65 recruitment to PD-L1 promoter was not Bcl3- or p300-dependent (Fig. 8B); however, given the relatively low occupancy of p65 at the PD-L1 promoter, it was difficult to accurately assess the role of Bcl3 and p300 in p65 recruitment. The occupancy of p300 at the PD-L1 promoter in both untreated and IFN-treated cells was also not suppressed by Bcl3 silencing (Fig. 8C), indicating that p300 resides on the PD-L1 promoter even in the absence of Bcl3. Together, these data suggest that the PD-L1 promoter in OC cells is permanently occupied by p300, and upon IFN stimulation, Bcl3 facilitates Lys-314/315 p65 acetylation and promoter occupancy, resulting in increased PD-L1 transcription.
Figure 8.
Bcl3 and p300 mediate Lys-314/315 ac-p65 occupancy at PD-L1 promoter in IFN-treated OC cells. A–C, ChIP of PD-L1 promoter occupancy by Lys-314/315 ac-p65 (A), p65 (B), and p300 (C) in SKOV3 cells transfected with control, Bcl3, and p300 siRNA, and treated 6 h with IFN (0 and 50 ng/ml). Each condition represents ∼0.25 × 10⁵ cells. The data are presented as fold-difference in occupancy of the particular protein at the particular locus compared with the human IGX1A (SA Biosciences) locus, and represent the mean ± S.E. of three experiments. Asterisks denote a statistically significant (*, p < 0.05; **, p < 0.01; ***, p < 0.001) change compared with cells transfected with control siRNA.
PD-L1 mediates Bcl3 pro-proliferative effect in OC cells
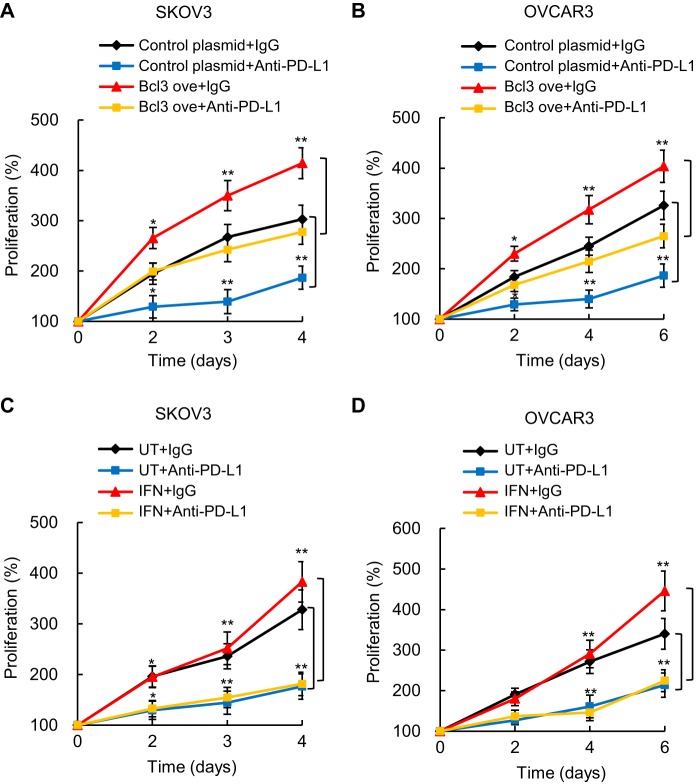
Because in addition to suppressing the anti-tumor activity of cytotoxic T cells, tumor PD-L1 has tumor-intrinsic effects (36–38), we asked whether the Bcl3 pro-proliferative effect in OC cells might be mediated by PD-L1. To address this question, we analyzed proliferation of SKOV3 and OVCAR3 cells transfected with Bcl3 overexpression or control plasmids, in the presence of PD-L1 neutralizing antibody, or isotype-matched control IgG. The results demonstrated that compared with control IgG, PD-L1 neutralizing antibody significantly reduced proliferation of SKOV3 cells, both in cells transfected with control plasmid, and in cells transfected with Bcl3 overexpression plasmid (Fig. 9A). Similar results were observed in OVCAR3 cells (Fig. 9B), indicating that the pro-proliferative effect of Bcl3 in OC cells is partly mediated by PD-L1.
Figure 9.
Bcl3-increased proliferation of OC cells is mediated by PD-L1. Cell proliferation of SKOV3 (A) and OVCAR3 (B) cells was measured by CellTiter 96 One Solution cell proliferation assay in cells transfected with control or Bcl3 overexpression plasmids, measured in the presence of PD-L1 neutralizing antibody, or control IgG1. Cell proliferation of IFN-treated (0 and 50 ng/ml) SKOV3 (C) and OVCAR3 (D) cells was measured in the presence of PD-L1 neutralizing antibody or control IgG1. The values represent the mean ± S.E. of three experiments; *, p < 0.05; **, p < 0.01; ***, p < 0.001 compared with cells treated with the control IgG1.
Because IFN increases the Bcl3 expression in OC cells (Fig. 6), and promotes OC tumor growth in mice (52), we tested whether OC cell proliferation in IFN-treated cells also depends on PD-L1. Incubation of SKOV3 (Fig. 9C) and OVCAR3 (Fig. 9D) cells with IFN in the presence of control IgG increased cell proliferation, but this effect was observed only during later incubation times. Importantly, the OC cell proliferation in IFN-treated cells was significantly reduced in the presence of PD-L1 neutralizing antibody. These data are consistent with the recent in vivo study by Abiko et al. (52) demonstrating that the IFN-induced OC tumor growth is PD-L1 dependent. Together, these results indicate that IFN induces Bcl3 expression, resulting in the increased PD-L1 transcription and OC cell proliferation (Fig. 10).
Figure 10.
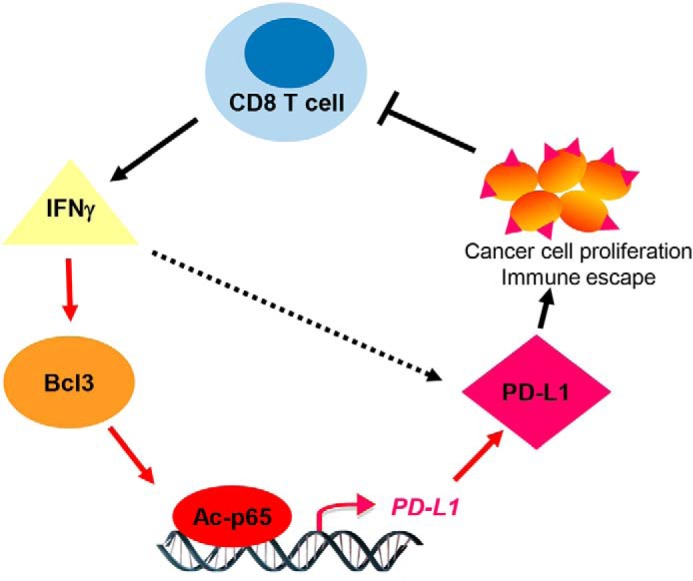
Proposed model of IFN-induced Bcl3 expression, resulting in increased PD-L1 promoter occupancy by Lys-314/315 ac-p65, and increased PD-L1 expression and proliferation in OC cells. Findings from this study are indicated by red arrows.
Discussion
Our study shows, rather surprisingly, that in addition to promoting cell survival and proliferation, the proto-oncogene Bcl3 induces expression of PD-L1 in ovarian cancer cells. In addition, our findings demonstrate that Bcl3 expression is increased in OC tissues, and is induced by IFN in OC cells. The mechanism of how Bcl3 induces PD-L1 transcription in IFN-stimulated cells involves an increased, Bcl3- and p300-dependent recruitment of Lys-314/315 ac-p65 to PD-L1 promoter. Because blocking PD-L1 with neutralizing antibody reduces proliferation of OC cells overexpressing Bcl3 or treated with IFN, these results suggest that the pro-proliferative effect of Bcl3 in OC cells is partly mediated by PD-L1. Together, these data link Bcl3 to IFNγ and PD-L1 signaling, and suggest that in addition to mediating cell survival and proliferation, Bcl3 promotes immune escape in cancer cells (Fig. 10).
Bcl-3 was originally identified as a candidate proto-oncogene up-regulated in B-cell chronic lymphocytic leukemia (1, 2); later studies demonstrated its increased expression also in other hematological malignancies, as well as in several types of solid cancer (10–23). The link between Bcl3 overexpression and malignant transformation was suggested to stem from its transcriptional up-regulation of cyclin D1 (57), increased expression of HDM2, the main negative regulator of p53 (58), and regulation of DNA damage response (59). In addition, recent studies have shown that Bcl3 induces expression of pro-inflammatory cytokines IL-8 and IL-17 in cutaneous T cell lymphoma cells (16), and TGFβ signaling in breast cancer (60). Our present findings demonstrate that Bcl3 promotes expression of PD-L1, indicating that in addition to regulating NF-κB-dependent genes involved in cell survival and proliferation, Bcl3 controls genes involved in immune escape. However, the regulation of NF-κB-dependent transcription by Bcl3 is gene specific; whereas Bcl3 induces transcription of PD-L1, it does not have a significant effect on the expression of NF-κB-regulated genes cIAP1, BclxL, TGFβ1, or IκBα, in OC cells (Fig. 5).
What determines the specificity of the transcriptional regulation by Bcl3? Because Bcl3 contains a transactivation domain, it can modulate transcription depending on the transcription factors and co-regulators present in the transcription complexes (6–9, 16, 61, 62). In this context, Bcl3 was shown to interact with the NF-κB subunits p50 and p52, the AP-1 transcription factors c-Jun and c-Fos, STAT1, STAT3, PPARγ, class I histone deacetylases, and the HATs CBP and p300 (6–9, 16, 22, 24, 57, 62–66). Our results demonstrate that even though Bcl3 is not directly recruited to the PD-L1 promoter, it mediates, together with the HAT p300 present at the PD-L1 promoter (Fig. 7), the promoter occupancy by Lys-314/315 acetylated p65 NF-κB in IFN-treated OC cells (Fig. 8A). Interestingly, previous studies have reported that acetylation of p65 at Lys-314/315 is mediated by p300, and results in a gene-specific regulation of NF-κB-dependent genes in TNF-stimulated cells (54, 55). Together, our data support a model in which the PD-L1 promoter in OC cells is occupied by p300, and upon IFN stimulation, Bcl3 promotes PD-L1 transcription by facilitating the promoter-specific occupancy by Lys-314/315 ac-p65. Future studies should determine whether IFN induces p65 acetylation on Lys-314/315 by p300, and/or whether it induces histone deacetylases's removal. In addition, it will be interesting to determine whether the high promoter occupancy by Lys-314/315 ac-p65 in IFN-treated OC cells is unique for PD-L1, or whether IFN induces Lys-314/315 ac-p65 recruitment to other NF-κB-dependent promoters as well.
Little is known about the signaling pathways inducing Bcl3 expression in cancer cells. In line with the reported induction of Bcl3 by p65 NF-κB (68), Bcl3 expression was shown to be up-regulated by pro-inflammatory cytokines including TNFα, IL-1, and IL-6 (20). Our study is the first to demonstrate that the Bcl3 expression is induced also by IFNγ (Fig. 6). The induction of Bcl3 by IFN is intriguing, especially because our data also show that the IFN-induced Bcl3 expression promotes expression of PD-L1 in IFN-stimulated cells (Fig. 6), thus linking Bcl3 to IFN and PD-L1 signaling.
Increased PD-L1 expression in OC tissues promotes tumor growth (39–41), but the regulation of PD-L1 expression in OC cells is little understood. Our study demonstrates that the PD-L1 expression in OC cells is regulated by the proto-oncogene Bcl3. Analysis of four different public datasets, together containing 26 control ovarian tissues and 898 OC samples, has revealed that the Bcl3 gene expression is statistically increased in OC tissues (p ≤ 0.016; Fig. 1). Interestingly, the Bcl3 expression was most significantly increased in ovarian serous surface papillary carcinoma (Fig. 1C) (43). Even though the sample size was relatively small, these data suggest that this type of OC has a significantly higher Bcl3 expression compared with other types of OC. Alternatively, as the tumor samples are often heterogeneous, a subset of cancer cells may express higher levels of Bcl3. It will be important to correlate these data in future with Bcl3 protein levels in individual cells. In addition, because the Bcl3 transcriptional activity is regulated by phosphorylation (24, 45–47), future studies should analyze the phosphorylation status of nuclear Bcl3 in OC tissues.
In addition to inhibiting anti-tumor cytotoxic T cells, the tumor-expressed PD-L1 has tumor-intrinsic effects that include the regulation of cancer cell survival and proliferation, autophagy, and regulation of glucose metabolism and mTOR signaling (36–38). Our results show that Bcl3 has prosurvival and pro-proliferative effects in OC cells (Figs. 2–4). However, because blocking the Bcl3-induced PD-L1 by neutralizing antibody decreases proliferation in Bcl3-overexpressing cells (Fig. 9), these data indicate that the Bcl3 prosurvival effect in OC cells is, at least partly, mediated by the Bcl3-up-regulated PD-L1. In summary, our study identifies PD-L1 as a novel target of Bcl3, indicating that Bcl3 regulates not only cancer cell proliferation and survival, but also immune escape.
Experimental procedures
Cell culture
Human ovarian cancer SKOV3 and OVCAR3 cells were obtained from the American Type Culture Collection (ATCC, Rockville, MD). Cells were cultured (5 × 10⁵ cells/ml) in 6-well plates in RPMI 1640 medium (Invitrogen) supplemented with 10% heat-inactivated fetal bovine serum (FBS; Invitrogen) and antibiotics at 37 °C with 5% CO2 as described (53). For treatment with IFNγ, human recombinant IFNγ (285-IF-100; R&D Systems, Minneapolis, MN) was reconstituted in sterile water. Cell viability was measured by using trypan blue exclusion.
Transfection with siRNA and CRISPR knockout and overexpression plasmids
Human Bcl3 (sc-29789) and nonsilencing (sc-37007) siRNAs were obtained from Santa Cruz Biotechnology (Santa Cruz, CA). Prior to transfection, 2 × 10⁵ cells were seeded into a 6-well plate and incubated in a humidified 5% CO2 atmosphere at 37 °C in antibiotic-free RPMI medium supplement with 10% FBS for 24 h to about 80% confluence. For each transfection, 80 pmol of either nonsilencing siRNA control or Bcl3 siRNA were used. Cells were transfected 7 h in transfection medium with siRNA transfection reagent according to the manufacturer's instructions (Santa Cruz Biotechnology). After transfection, fresh medium with antibiotics was added, and cells were grown for 24 h before treatment.
Bcl3 CRISPR/Cas9 knockout (KO) plasmid (sc-400740), control CRISPR/Cas9 plasmid (sc-418922), Bcl-3 CRISPR activation plasmid (sc-400740-ACT), and control CRISPR activation plasmid (sc-437275) were obtained from Santa Cruz Biotechnology. Prior to transfections, 2 × 10⁵ cells were seeded into a 6-well plate and incubated in antibiotic-free RPMI medium supplement with 10% FBS for 24 h to 80% confluence. For each transfection, 3 μg of Bcl3 CRISPR/Cas9 KO or activation plasmids, or the corresponding control plasmids were used. Cells were transfected 24 h in plasmid transfection medium according to the manufacturer's instructions (Santa Cruz Biotechnology). After transfection, fresh medium with antibiotics was added, and cells were grown for 24 h before treatment.
For stable transfection, Bcl3 shRNA (sc-29789-SH) and control shRNA (sc-108060) plasmids were obtained from Santa Cruz Biotechnology. For each transfection, 2 μg of Bcl3 shRNA or control shRNA plasmid were used, and cells were transfected using shRNA plasmid transfection medium (sc-108062) and transfection reagent (sc-108061) according to the manufacturer's instructions (Santa Cruz Biotechnology). Transfected colonies were selected using 3 μg/ml of puromycin.
Apoptosis, cell proliferation, and PD-L1 neutralization assays
Apoptosis was evaluated using a cell death detection ELISA kit that quantifies release of nucleosomes into the cytoplasm (Cell Death Detection ELISAPLUS, Roche Applied Science) (48), and by measuring caspase 3 activity using a human active caspase 3 ELISA kit (ab181418, Abcam, Cambridge, MA).
Cell proliferation was measured by CellTiter 96 One Solution Cell Proliferation Assay (Promega, Madison, WI). Transfected cells were seeded into 96-well plates at a density of 5000 cells/100 μl of medium, and incubated at 37 °C. At the indicated time points, 20 μl of CellTiter 96 One Solution Reagent was added to each well, incubated for 4 h at 37 °C, and absorbance at 490 nm was measured.
For PD-L1 neutralization experiments, transfected cells were incubated in the presence of 500 nm anti-PD-L1 (CD274) neutralizing IgG1κ antibody (catalog 71213; BPS Bioscience, San Diego, CA) or isotype control IgG1κ antibody (catalog 14-4714-82; Thermo Fisher Scientific), and cell proliferation was measured as described above.
Wound healing assay
SKOV3 cells were seeded in 6-well plates (2 × 10⁵ cells/well) and transfected with control or Bcl3 siRNA as described above. Once the cells became confluent, a wound area was created by scraping the cell monolayer with a sterile 200-μl pipette tip. After washing twice with PBS, RPMI medium without FBS was added to the wells. The scratch area was monitored under a phase-contrast microscope at 0, 24, and 48 h after transfection. The wound width was measured in five random fields using ImageJ software. All samples were tested in triplicates.
Real-time RT-PCR
Total RNA was isolated using RNeasy mini-kit (Qiagen, Valencia, CA). The iScript one-step RT-PCR kit with SYBR Green (Bio-Rad) was used as a Supermix and 20 ng/μl of RNA was used as template on a Bio-Rad MyIQ Single Color Real-Time PCR Detection System (Bio-Rad). The primers used for quantification of human Bcl3, PD-L1, cIAP1, BclxL, TGFβ1, IκBα, p65, and actin mRNA were purchased from SA Biosciences (Frederick, MD). The mRNA values are expressed as a percentage of control or untreated samples, which were arbitrarily set as 100%.
Western blot analysis
WCE were prepared as described previously (48, 53). Denatured proteins were separated on 12% denaturing polyacrylamide gels and transferred to nitrocellulose membrane (Hybond C; Amersham Biosciences). Membranes were blocked with a 5% (w/v) nonfat dried milk solution containing 10 mm Tris-Cl, pH 7.5, 140 mm NaCl, 1.5 mm MgCl2, and 0.1% Tween 20 (TBSTM), and incubated with Bcl3 (23959–1-AP; Proteintech, Rosemont, IL) or PD-L1 (E1L3N; Cell Signaling, Danvers, MA) antibodies diluted in TBSTM. After washing, the membranes were incubated with horseradish peroxidase-labeled secondary antibodies and the labeled proteins were detected using the ECL detection system (Amersham Biosciences). To confirm equivalent amounts of loaded proteins, the membranes were stripped and re-probed with control anti-actin antibody as described (48, 53).
Chromatin immunoprecipitation (ChIP)
ChIP analysis was performed as described (67). Briefly, proteins and DNA were cross-linked by formaldehyde, and cells were washed and sonicated. The lysates were centrifuged (15,000 × g, 10 min, 4 °C), and the supernatant extracts were diluted with ChIP dilution buffer and pre-cleared with Protein A/G-agarose (Santa Cruz Biotechnology) for 2 h at 4 °C. Immunoprecipitations were performed overnight at 4 °C, using p65 (MAB3026; Sigma), Lys-314/315 acetylated p65 (HW136; Signalway Antibody, College Park, MD), CBP (sc-7300; Santa Cruz Biotechnology), p300 (sc-585; Santa Cruz Biotechnology), Bcl3 (23959–1-AP; Proteintech), and control IgG (sc-2025) antibodies that were pre-incubated (6 h, 4 °C) with Protein A/G-agarose, and the immune complexes were collected by centrifugation (150 × g, 5 min, 4 °C), washed, and extracted with 1% SDS, 0.1 m NaHCO3. After reversing the cross-linking, proteins were digested with proteinase K, and the samples were extracted with phenol/chloroform, followed by precipitation with ethanol. Immunoprecipitated DNA was analyzed by real-time PCR (25 μl reaction mixture) using the iQ SYBR Green Supermix and the Bio-Rad MyIQ Single Color Real-Time PCR Detection System (Bio-Rad). Each immunoprecipitation was performed at least three times using different chromatin samples, and the occupancy was calculated by using the human IGX1A negative control primers (SA Biosciences, Frederick, MD), which detect specific genomic ORF-free DNA sequence that does not contain a binding site for any known transcription factors. The results were calculated as fold-difference in occupancy of the particular protein at the particular locus compared with the IGX1A locus.
The PD-L1 primers used for real-time PCR were as follows: PDL1-κB1: forward, 5′-CTTTATTCCTAGGACACCAACACT-3′ and reverse, 5′-CAAGGCAGCAAATCCAGTTT-3′; PDL1-κB2: forward, 5′-TGGGTCTGCTGCTGACTTTTTA-3′ and reverse, 5′-AGAGGGGTAAGAGCTTAAGGTTAC-3′; PDL1-κB3: forward, 5′-TTCCGCAGCCTTAATCCTTA-3′ and reverse 5′-ACTTCCTCAAAGTTCCTCGACA-3′; PDL1-κB4/κB5: forward, 5′-TGCCACATAATGTCTATATTTTCC-3′ and reverse 5′-CCAGCTCAGATGTTCCTTCTTT-3′.
Statistical analysis
The results represent at least three independent experiments. Numerical results are presented as mean ± S.E. Data were analyzed by using InStat software package (GraphPad, San Diego, CA). Statistical significance was evaluated by using Mann-Whitney U test, and p < 0.05 was considered significant. Levels of significance are indicated as *, p < 0.05; **, p < 0.01; and ***, p < 0.001.
Author contributions
Y. Zou and I. V. data curation; Y. Zou and I. V. formal analysis; Y. Zou and I. V. validation; Y. Zou, M. M. U., S. P., Y. Zhu, A. V., and I. V. investigation; Y. Zou and I. V. visualization; Y. Zou, M. M. U., S. P., Y. Zhu, P. B., A. V., and I. V. methodology; Y. Zou, M. M. U., S. P., Y. Zhu, P. B., A. V., and I. V. writing-review and editing; Y. Zhu, A. V., and I. V. resources; I. V. conceptualization; I. V. supervision; I. V. funding acquisition; I. V. writing-original draft; I. V. project administration.
This work was supported by National Institutes of Health Grant CA202775 (to I. V.). The authors declare that they have no conflicts of interest with the contents of this article. The content is solely the responsibility of the authors and does not necessarily represent the official views of the National Institutes of Health.
Please note that the JBC is not responsible for the long-term archiving and maintenance of this site or any other third party hosted site.
- OC
- ovarian cancer
- EOC
- epithelial ovarian cancer
- WCE
- whole cell extract
- PD-L1
- programmed death ligand 1
- IFN
- interferon-γ
- IL
- interleukin
- TNF
- tumor necrosis factor
- TSS
- transcription start site
- Lys-314/315 ac-p65
- Lys-314/315 acetylated p65
- HAT
- histone acetyltransferase
- CBP
- cAMP-response element-binding protein.
References
- 1. Ohno H., Takimoto G., and McKeithan T. W. (1990) The candidate proto-oncogene bcl-3 is related to genes implicated in cell lineage determination and cell cycle control. Cell 60, 991–997 10.1016/0092-8674(90)90347-H [DOI] [PubMed] [Google Scholar]
- 2. McKeithan T. W., Ohno H., and Diaz M. O. (1990) Identification of a transcriptional unit adjacent to the breakpoint in the 14;19 translocation of chronic lymphocytic leukemia. Genes Chromosomes Cancer 1, 247–255 10.1002/gcc.2870010310 [DOI] [PubMed] [Google Scholar]
- 3. Kerr L. D., Duckett C. S., Wamsley P., Zhang Q., Chiao P., Nabel G., McKeithan T. W., Baeuerle P. A., and Verma I. M. (1992) The proto-oncogene bcl-3 encodes an IκB protein. Genes Dev. 6, 2352–2363 10.1101/gad.6.12a.2352 [DOI] [PubMed] [Google Scholar]
- 4. Wulczyn F. G., Naumann M., and Scheidereit C. (1992) Candidate proto-oncogene bcl-3 encodes a subunit-specific inhibitor of transcription factor NFκB. Nature 358, 597–599 10.1038/358597a0 [DOI] [PubMed] [Google Scholar]
- 5. Bours V., Franzoso G., Azarenko V., Park S., Kanno T., Brown K., and Siebenlist U. (1993) The oncoprotein Bcl-3 directly transactivates through κB motifs via association with DNA-binding p50B homodimers. Cell 72, 729–739 10.1016/0092-8674(93)90401-B [DOI] [PubMed] [Google Scholar]
- 6. Franzoso G., Bours V., Azarenko V., Park S., Tomita-Yamaguchi M., Kanno T., Brown K., and Siebenlist U. (1993) The oncoprotein Bcl-3 can facilitate NFκB-mediated transactivation by removing inhibiting p50 homodimers from select κB sites. EMBO J. 12, 3893–3901 [DOI] [PMC free article] [PubMed] [Google Scholar]
- 7. Fujita T., Nolan G. P., Liou H. C., Scott M. L., and Baltimore D. (1993) The candidate proto-oncogene bcl-3 encodes a transcriptional coactivator that activates through NF-κB p50 homodimers. Genes Dev. 7, 1354–1363 10.1101/gad.7.7b.1354 [DOI] [PubMed] [Google Scholar]
- 8. Nolan G. P., Fujita T., Bhatia K., Huppi C., Liou H. C., Scott M. L., and Baltimore D. (1993) The bcl-3 proto-oncogene encodes a nuclear IκB-like molecule that preferentially interacts with NFκB p50 and p52 in a phosphorylation-dependent manner. Mol. Cell Biol. 13, 3557–3566 10.1128/MCB.13.6.3557 [DOI] [PMC free article] [PubMed] [Google Scholar]
- 9. Zhang Q., Didonato J. A., Karin M., and McKeithan T. W. (1994) BCL3 encodes a nuclear protein which can alter the subcellular location of NFκB proteins. Mol. Cell Biol. 14, 3915–3926 10.1128/MCB.14.6.3915 [DOI] [PMC free article] [PubMed] [Google Scholar]
- 10. McKeithan T. W., Takimoto G. S., Ohno H., Bjorling V. S., Morgan R., Hecht B. K., Dubé I., Sandberg A. A., and Rowley J. D. (1997) BCL3 rearrangements and t(14;19) in chronic lymphocytic leukemia and other B-cell malignancies: a molecular and cytogenetic study. Genes Chromosomes Cancer 20, 64–72 10.1002/(SICI)1098-2264(199709)20:1%3C64::AID-GCC10%3E3.0.CO%3B2-F [DOI] [PubMed] [Google Scholar]
- 11. Ge B., Li O., Wilder P., Rizzino A., and McKeithan T. W. (2003) NFκB regulates BCL3 transcription in T lymphocytes through an intronic enhancer. J. Immunol. 171, 4210–4218 10.4049/jimmunol.171.8.4210 [DOI] [PubMed] [Google Scholar]
- 12. Mathas S., Jöhrens K., Joos S., Lietz A., Hummel F., Janz M., Jundt F., Anagnostopoulos I., Bommert K., Lichter P., Stein H., Scheidereit C., and Dörken B. (2005) Elevated NFκB p50 complex formation and Bcl-3 expression in classical Hodgkin, anaplastic large-cell, and other peripheral T-cell lymphomas. Blood 106, 4287–4293 10.1182/blood-2004-09-3620 [DOI] [PubMed] [Google Scholar]
- 13. Martin-Subero J. I., Wlodarska I., Bastard C., Picquenot J. M., Höppner J., Giefing M., Klapper W., and Siebert R. (2006) Chromosomal rearrangements involving the BCL3 locus are recurrent in classical Hodgkin and peripheral T-cell lymphoma. Blood 108, 402–403 10.1182/blood-2005-09-3843 [DOI] [PubMed] [Google Scholar]
- 14. Courtois G., and Gilmore T. D. (2006) Mutations in the NFκB signaling pathway: implications for human disease. Oncogene 25, 6831–6843 10.1038/sj.onc.1209939 [DOI] [PubMed] [Google Scholar]
- 15. Brenne A. T., Fagerli U. M., Shaughnessy J. D. Jr, Våtsveen T. K., Rø T. B., Hella H., Zhan F., Barlogie B., Sundan A., Børset M., and Waage A. (2009) High expression of BCL3 in human myeloma cells is associated with increased proliferation and inferior prognosis. Eur. J. Haematol. 82, 354–363 10.1111/j.1600-0609.2009.01225.x [DOI] [PMC free article] [PubMed] [Google Scholar]
- 16. Chang T. P., and Vancurova I. (2014) Bcl3 regulates pro-survival and pro-inflammatory gene expression in cutaneous T-cell lymphoma. Biochim. Biophys. Acta 1843, 2620–2630 10.1016/j.bbamcr.2014.07.012 [DOI] [PMC free article] [PubMed] [Google Scholar]
- 17. Cogswell P. C., Guttridge D. C., Funkhouser W. K., and Baldwin A. S. Jr. (2000) Selective activation of NFκB subunits in human breast cancer: potential roles for NFκB2/p52 and for Bcl-3. Oncogene 19, 1123–1131 10.1038/sj.onc.1203412 [DOI] [PubMed] [Google Scholar]
- 18. Thornburg N. J., Pathmanathan R., and Raab-Traub N. (2003) Activation of NFκB p50 homodimer/Bcl-3 complexes in nasopharyngeal carcinoma. Cancer Res. 63, 8293–8301 [PubMed] [Google Scholar]
- 19. Puvvada S. D., Funkhouser W. K., Greene K., Deal A., Chu H., Baldwin A. S., Tepper J. E., and O'Neil B. H. (2010) NF-κB and Bcl-3 activation are prognostic in metastatic colorectal cancer. Oncology 78, 181–188 10.1159/000313697 [DOI] [PMC free article] [PubMed] [Google Scholar]
- 20. Maldonado V., and Melendez-Zajgla J. (2011) Role of Bcl-3 in solid tumors. Mol. Cancer 10, 152 10.1186/1476-4598-10-152 [DOI] [PMC free article] [PubMed] [Google Scholar]
- 21. Wakefield A., Soukupova J., Montagne A., Ranger J., French R., Muller W. J., and Clarkson R. W. (2013) Bcl3 selectively promotes metastasis of ERBB2-driven mammary tumors. Cancer Res. 73, 745–755 10.1158/0008-5472.CAN-12-1321 [DOI] [PubMed] [Google Scholar]
- 22. Wu J., Li L., Jiang G., Zhan H., and Wang N. (2016) B-cell CLL/lymphoma 3 promotes glioma cell proliferation and inhibits apoptosis through the oncogenic STAT3 pathway. Int. J. Oncol. 49, 2471–2479 10.3892/ijo.2016.3729 [DOI] [PubMed] [Google Scholar]
- 23. Zhao H., Wang W., Zhao Q., Hu G., Deng K., and Liu Y. (2016) BCL3 exerts an oncogenic function by regulating STAT3 in human cervical cancer. Onco. Targets Ther. 9, 6619–6629 10.2147/OTT.S118184 [DOI] [PMC free article] [PubMed] [Google Scholar]
- 24. Viatour P., Dejardin E., Warnier M., Lair F., Claudio E., Bureau F., Marine J. C., Merville M. P., Maurer U., Green D., Piette J., Siebenlist U., Bours V., and Chariot A. (2004) GSK3-mediated BCL-3 phosphorylation modulates its degradation and oncogenicity. Mol. Cell 16, 35–45 10.1016/j.molcel.2004.09.004 [DOI] [PubMed] [Google Scholar]
- 25. Guan Y., Yao H., Zheng Z., Qiu G., and Sun K. (2011) MiR-125b targets BCL3 and suppresses ovarian cancer proliferation. Int. J. Cancer 128, 2274–2283 10.1002/ijc.25575 [DOI] [PubMed] [Google Scholar]
- 26. Luo S., Wang J., Ma Y., Yao Z., and Pan H. (2015) PPARγ inhibits ovarian cancer cells proliferation through upregulation of miR-125b. Biochem. Biophys. Res. Commun. 462, 85–90 10.1016/j.bbrc.2015.04.023 [DOI] [PubMed] [Google Scholar]
- 27. Huang S., Robinson J. B., Deguzman A., Bucana C. D., and Fidler I. J. (2000) Blockade of NFκB signaling inhibits angiogenesis and tumorigenicity of human ovarian cancer cells by suppressing expression of vascular endothelial growth factor and interleukin 8. Cancer Res. 60, 5334–5339 [PubMed] [Google Scholar]
- 28. Mabuchi S., Ohmichi M., Nishio Y., Hayasaka T., Kimura A., Ohta T., Saito M., Kawagoe J., Takahashi K., Yada-Hashimoto N., Sakata M., Motoyama T., Kurachi H., Tasaka K., and Murata Y. (2004) Inhibition of NFκB increases the efficacy of cisplatin in in vitro and in vivo ovarian cancer models. J. Biol. Chem. 279, 23477–23485 10.1074/jbc.M313709200 [DOI] [PubMed] [Google Scholar]
- 29. Annunziata C. M., Stavnes H. T., Kleinberg L., Berner A., Hernandez L. F., Birrer M. J., Steinberg S. M., Davidson B., and Kohn E. C. (2010) Nuclear factor κB transcription factors are coexpressed and convey a poor outcome in ovarian cancer. Cancer 116, 3276–3284 10.1002/cncr.25190 [DOI] [PMC free article] [PubMed] [Google Scholar]
- 30. Huang G., Wen Q., Zhao Y., Gao Q., and Bai Y. (2013) NF-κB plays a key role in inducing CD274 expression in human monocytes after lipopolysaccharide treatment. PLoS ONE 8, e61602 10.1371/journal.pone.0061602 [DOI] [PMC free article] [PubMed] [Google Scholar]
- 31. Peng J., Hamanishi J., Matsumura N., Abiko K., Murat K., Baba T., Yamaguchi K., Horikawa N., Hosoe Y., Murphy S. K., Konishi I., and Mandai M. (2015) Chemotherapy induces programmed cell death-ligand 1 overexpression via the nuclear factor-κB to foster an immunosuppressive tumor microenvironment in ovarian cancer. Cancer Res. 75, 5034–5045 10.1158/0008-5472.CAN-14-3098 [DOI] [PubMed] [Google Scholar]
- 32. Gowrishankar K., Gunatilake D., Gallagher S. J., Tiffen J., Rizos H., and Hersey P. (2015) Inducible but not constitutive expression of PD-L1 in human melanoma cells is dependent on activation of NF-κB. PLoS ONE 10, e0123410 10.1371/journal.pone.0123410 [DOI] [PMC free article] [PubMed] [Google Scholar]
- 33. Lim S. O., Li C. W., Xia W., Cha J. H., Chan L. C., Wu Y., Chang S. S., Lin W. C., Hsu J. M., Hsu Y. H., Kim T., Chang W. C., Hsu J. L., Yamaguchi H., Ding Q., et al. (2016) Deubiquitination and stabilization of PD-L1 by CSN5. Cancer Cell 30, 925–939 10.1016/j.ccell.2016.10.010 [DOI] [PMC free article] [PubMed] [Google Scholar]
- 34. Bouillez A., Rajabi H., Jin C., Samur M., Tagde A., Alam M., Hiraki M., Maeda T., Hu X., Adeegbe D., Kharbanda S., Wong K. K., and Kufe D. (2017) MUC1-C integrates PD-L1 induction with repression of immune effectors in non-small-cell lung cancer. Oncogene 36, 4037–4046 10.1038/onc.2017.47 [DOI] [PMC free article] [PubMed] [Google Scholar]
- 35. Maeda T., Hiraki M., Jin C., Rajabi H., Tagde A., Alam M., Bouillez A., Hu X., Suzuki Y., Miyo M., Hata T., Hinohara K., and Kufe D. (2018) MUC1-C induces PD-L1 and immune evasion in triple-negative breast cancer. Cancer Res. 78, 205–215 10.1158/0008-5472.CAN-17-1636 [DOI] [PMC free article] [PubMed] [Google Scholar]
- 36. Azuma T., Yao S., Zhu G., Flies A. S., Flies S. J., and Chen L. (2008) B7-H1 is a ubiquitous antiapoptotic receptor on cancer cells. Blood 111, 3635–3643 10.1182/blood-2007-11-123141 [DOI] [PMC free article] [PubMed] [Google Scholar]
- 37. Chang C. H., Qiu J., O'Sullivan D., Buck M. D., Noguchi T., Curtis J. D., Chen Q., Gindin M., Gubin M. M., van der Windt G. J., Tonc E., Schreiber R. D., Pearce E. J., and Pearce E. L. (2015) Metabolic competition in the tumor microenvironment is a driver of cancer progression. Cell 162, 1229–1241 10.1016/j.cell.2015.08.016 [DOI] [PMC free article] [PubMed] [Google Scholar]
- 38. Clark C. A., Gupta H. B., Sareddy G., Pandeswara S., Lao S., Yuan B., Drerup J. M., Padron A., Conejo-Garcia J., Murthy K., Liu Y., Turk M. J., Thedieck K., Hurez V., Li R., Vadlamudi R., and Curiel T. J. (2016) Tumor-intrinsic PD-L1 signals regulate cell growth, pathogenesis, and autophagy in ovarian cancer and melanoma. Cancer Res. 76, 6964–6974 10.1158/0008-5472.CAN-16-0258 [DOI] [PMC free article] [PubMed] [Google Scholar]
- 39. Hamanishi J., Mandai M., Iwasaki M., Okazaki T., Tanaka Y., Yamaguchi K., Higuchi T., Yagi H., Takakura K., Minato N., Honjo T., and Fujii S. (2007) Programmed cell death 1 ligand 1 and tumor-infiltrating CD8+ T lymphocytes are prognostic factors of human ovarian cancer. Proc. Natl. Acad. Sci. U.S.A. 104, 3360–3365 10.1073/pnas.0611533104 [DOI] [PMC free article] [PubMed] [Google Scholar]
- 40. Abiko K., Mandai M., Hamanishi J., Yoshioka Y., Matsumura N., Baba T., Yamaguchi K., Murakami R., Yamamoto A., Kharma B., Kosaka K., and Konishi I. (2013) PD-L1 on tumor cells is induced in ascites and promotes peritoneal dissemination of ovarian cancer through CTL dysfunction. Clin. Cancer Res. 19, 1363–1374 10.1158/1078-0432.CCR-12-2199 [DOI] [PubMed] [Google Scholar]
- 41. Maine C. J., Aziz N. H., Chatterjee J., Hayford C., Brewig N., Whilding L., George A. J., and Ghaem-Maghami S. (2014) Programmed death ligand-1 over-expression correlates with malignancy and contributes to immune regulation in ovarian cancer. Cancer Immunol. Immunother. 63, 215–224 10.1007/s00262-013-1503-x [DOI] [PMC free article] [PubMed] [Google Scholar]
- 42. Hendrix N. D., Wu R., Kuick R., Schwartz D. R., Fearon E. R., and Cho K. R. (2006) Fibroblast growth factor 9 has oncogenic activity and is a downstream target of Wnt signaling in ovarian endometrioid adenocarcinomas. Cancer Res. 66, 1354–1362 10.1158/0008-5472.CAN-05-3694 [DOI] [PubMed] [Google Scholar]
- 43. Welsh J. B., Zarrinkar P. P., Sapinoso L. M., Kern S. G., Behling C. A., Monk B. J., Lockhart D. J., Burger R. A., and Hampton G. M. (2001) Analysis of gene expression profiles in normal and neoplastic ovarian tissue samples identifies candidate molecular markers of epithelial ovarian cancer. Proc. Natl. Acad. Sci. U.S.A. 98, 1176–1181 10.1073/pnas.98.3.1176 [DOI] [PMC free article] [PubMed] [Google Scholar]
- 44. Bonome T., Levine D. A., Shih J., Randonovich M., Pise-Masison C. A., Bogomolniy F., Ozbun L., Brady J., Barrett J. C., Boyd J., and Birrer M. J. (2008) A gene signature predicting for survival in suboptimally debulked patients with ovarian cancer. Cancer Res. 68, 5478–5486 10.1158/0008-5472.CAN-07-6595 [DOI] [PMC free article] [PubMed] [Google Scholar]
- 45. Bundy D. L., and McKeithan T. W. (1997) Diverse effects of BCL3 phosphorylation on its modulation of NFκB p52 homodimer binding to DNA. J. Biol. Chem. 272, 33132–33139 10.1074/jbc.272.52.33132 [DOI] [PubMed] [Google Scholar]
- 46. Nishikori M., Ohno H., Haga H., and Uchiyama T. (2005) Stimulation of CD30 in anaplastic large cell lymphoma leads to production of NFκB p52, which is associated with hyperphosphorylated Bcl-3. Cancer Sci. 96, 487–497 10.1111/j.1349-7006.2005.00078.x [DOI] [PMC free article] [PubMed] [Google Scholar]
- 47. Wang V. Y., Li Y., Kim D., Zhong X., Du Q., Ghassemian M., and Ghosh G. (2017) Bcl3 phosphorylation by Akt, Erk2, and IKK is required for its transcriptional activity. Mol. Cell 67, 484–497 10.1016/j.molcel.2017.06.011 [DOI] [PMC free article] [PubMed] [Google Scholar]
- 48. Juvekar A., Manna S., Ramaswami S., Chang T. P., Vu H. Y., Ghosh C. C., Celiker M. Y., and Vancurova I. (2011) Bortezomib induces nuclear translocation of IκBα resulting in gene-specific suppression of NFκB-dependent transcription and induction of apoptosis in CTCL. Mol. Cancer Res. 9, 183–194 10.1158/1541-7786.MCR-10-0368 [DOI] [PMC free article] [PubMed] [Google Scholar]
- 49. Duraiswamy J., Freeman G. J., and Coukos G. (2013) Therapeutic PD-1 pathway blockade augments with other modalities of immunotherapy T-cell function to prevent immune decline in ovarian cancer. Cancer Res. 73, 6900–6912 10.1158/0008-5472.CAN-13-1550 [DOI] [PMC free article] [PubMed] [Google Scholar]
- 50. Freeman G. J., Long A. J., Iwai Y., Bourque K., Chernova T., Nishimura H., Fitz L. J., Malenkovich N., Okazaki T., Byrne M. C., Horton H. F., Fouser L., Carter L., Ling V., Bowman M. R., et al. (2000) Engagement of the PD-1 immunoinhibitory receptor by a novel B7 family member leads to negative regulation of lymphocyte activation. J. Exp. Med. 192, 1027–1034 10.1084/jem.192.7.1027 [DOI] [PMC free article] [PubMed] [Google Scholar]
- 51. Blank C., Brown I., Peterson A. C., Spiotto M., Iwai Y., Honjo T., and Gajewski T. F. (2004) PD-L1/B7H-1 inhibits the effector phase of tumor rejection by T cell receptor (TCR) transgenic CD8+ T cells. Cancer Res. 64, 1140–1145 10.1158/0008-5472.CAN-03-3259 [DOI] [PubMed] [Google Scholar]
- 52. Abiko K., Matsumura N., Hamanishi J., Horikawa N., Murakami R., Yamaguchi K., Yoshioka Y., Baba T., Konishi I., and Mandai M. (2015) IFN-γ from lymphocytes induces PD-L1 expression and promotes progression of ovarian cancer. Br. J. Cancer 112, 1501–1509 10.1038/bjc.2015.101 [DOI] [PMC free article] [PubMed] [Google Scholar]
- 53. Gatla H. R., Zou Y., Uddin M. M., Singha B., Bu P., Vancura A., and Vancurova I. (2017) Histone deacetylase (HDAC) inhibition induces IκB kinase (IKK)-dependent interleukin-8/CXCL8 expression in ovarian cancer cells. J. Biol. Chem. 292, 5043–5054 10.1074/jbc.M116.771014 [DOI] [PMC free article] [PubMed] [Google Scholar]
- 54. Buerki C., Rothgiesser K. M., Valovka T., Owen H. R., Rehrauer H., Fey M., Lane W. S., and Hottiger M. O. (2008) Functional relevance of novel p300-mediated lysine 314 and 315 acetylation of RelA/p65. Nucleic Acids Res. 36, 1665–1680 10.1093/nar/gkn003 [DOI] [PMC free article] [PubMed] [Google Scholar]
- 55. Rothgiesser K. M., Fey M., and Hottiger M. O. (2010) Acetylation of p65 at lysine 314 is important for late NFκB-dependent gene expression. BMC Genomics 11, 22 10.1186/1471-2164-11-22 [DOI] [PMC free article] [PubMed] [Google Scholar]
- 56. Vancurova I., Uddin M. M., Zou Y., and Vancura A. (2018) Combination therapies targeting HDAC and IKK in solid tumors. Trends Pharmacol. Sci. 39, 295–306 10.1016/j.tips.2017.11.008 [DOI] [PMC free article] [PubMed] [Google Scholar]
- 57. Westerheide S. D., Mayo M. W., Anest V., Hanson J. L., and Baldwin A. S. Jr. (2001) The putative oncoprotein Bcl-3 induces cyclin D1 to stimulate G1 transition. Mol. Cell Biol. 21, 8428–8436 10.1128/MCB.21.24.8428-8436.2001 [DOI] [PMC free article] [PubMed] [Google Scholar]
- 58. Kashatus D., Cogswell P., and Baldwin A. S. (2006) Expression of the Bcl-3 proto-oncogene suppresses p53 activation. Genes Dev. 20, 225–235 10.1101/gad.1352206 [DOI] [PMC free article] [PubMed] [Google Scholar]
- 59. Zamora R., Espinosa M., Ceballos-Cancino G., Segura B., Maldonado V., and Melendez-Zajgla J. (2010) Depletion of the oncoprotein Bcl-3 induces centrosome amplification and aneuploidy in cancer cells. Mol. Cancer 9, 223 10.1186/1476-4598-9-223 [DOI] [PMC free article] [PubMed] [Google Scholar]
- 60. Chen X., Cao X., Sun X., Lei R., Chen P., Zhao Y., Jiang Y., Yin J., Chen R., Ye D., Wang Q., Liu Z., Liu S., Cheng C., Mao J., et al. (2016) Bcl3 regulates TGFβ signaling by stabilizing Smad3 during breast cancer pulmonary metastasis. Cell Death Dis. 7, e2508 10.1038/cddis.2016.405 [DOI] [PMC free article] [PubMed] [Google Scholar]
- 61. Wang V. Y., Huang W., Asagiri M., Spann N., Hoffmann A., Glass C., and Ghosh G. (2012) The transcriptional specificity of NF-κB dimers is coded within the κB DNA response elements. Cell Rep. 2, 824–839 10.1016/j.celrep.2012.08.042 [DOI] [PMC free article] [PubMed] [Google Scholar]
- 62. Carmody R. J., Ruan Q., Palmer S., Hilliard B., and Chen Y. H. (2007) Negative regulation of Toll-like receptor signaling by NFκB p50 ubiquitination blockade. Science 317, 675–678 10.1126/science.1142953 [DOI] [PubMed] [Google Scholar]
- 63. Na S. Y., Choi J. E., Kim H. J., Jhun B. H., Lee Y. C., and Lee J. W. (1999) Bcl3, an IκB protein, stimulates activating protein-1 transactivation and cellular proliferation. J. Biol. Chem. 274, 28491–28496 10.1074/jbc.274.40.28491 [DOI] [PubMed] [Google Scholar]
- 64. Dechend R., Hirano F., Lehmann K., Heissmeyer V., Ansieau S., Wulczyn F. G., Scheidereit C., and Leutz A. (1999) The Bcl-3 oncoprotein acts as a bridging factor between NFκB/Rel and nuclear co-regulators. Oncogene 18, 3316–3323 10.1038/sj.onc.1202717 [DOI] [PubMed] [Google Scholar]
- 65. Kim Y. M., Sharma N., and Nyborg J. K. (2008) The proto-oncogene Bcl3, induced by Tax, represses Tax-mediated transcription via p300 displacement from the human T-cell leukemia virus type 1 promoter. J. Virol. 82, 11939–11947 10.1128/JVI.01356-08 [DOI] [PMC free article] [PubMed] [Google Scholar]
- 66. Yang J., Williams R. S., and Kelly D. P. (2009) Bcl3 interacts cooperatively with peroxisome proliferator-activated receptor γ (PPARγ) coactivator 1α to coactivate nuclear receptors estrogen-related receptor alpha and PPARα. Mol. Cell Biol. 29, 4091–4102 10.1128/MCB.01669-08 [DOI] [PMC free article] [PubMed] [Google Scholar]
- 67. Chang T. P., Kim M., and Vancurova I. (2014) Analysis of TGFβ1 and IL-10 transcriptional regulation in CTCL cells by chromatin immunoprecipitation. Methods Mol. Biol. 1172, 329–341 10.1007/978-1-4939-0928-5_30 [DOI] [PubMed] [Google Scholar]
- 68. Brasier A. R., Lu M., Hai T., Lu Y., and Boldogh I. (2001) NFκB-inducible BCL-3 expression is an autoregulatory loop controlling nuclear p50/NFκB1 residence. J. Biol. Chem. 276, 32080–32093 10.1074/jbc.M102949200 [DOI] [PubMed] [Google Scholar]


