Abstract
Small silver clusters that form with short oligonucleotides are distinguished by their strong fluorescence. Previous work showed that red and blue/green emitting species form with the cytosine oligonucleotide dC12. To understand how the bases and base sequence influence cluster formation, the blue/green emitting clusters that form with the thymine-containing oligonucleotides dT12, dT4C4T4, and dC4T4C4 are discussed. With dT12 and dT4C4T4, variations in the solution pH establish that the clusters associate with the N3 of thymine. The small clusters are bound to the larger DNA template, as demonstrated by fluorescence anisotropy, circular dichroism, and fluorescence correlation spectroscopy (FCS) studies. For dT4C4T4, FCS studies showed that approximately 50% of the strands are labeled with the fluorescent clusters. Absorption spectra and the gas dependence of the fluorescence show that nonfluorescent clusters also form following the reduction of the silver cation – oligonucleotide conjugates. Fluorescent cluster formation is favored by oxygen, thus indicating that the DNA-bound clusters are partially oxidized. To elaborate the sequence dependence of cluster formation, dC4T4C4 was studied. Cluster formation depends on the oligonucleotide concentration, and higher concentrations favor a red emitting species. A blue/green emissive species dominates at lower concentrations of dC4T4C4, and it has spectroscopic, physical, and chemical properties that are similar to those of the clusters that form with dT12 and dT4C4T4. These results suggest that cytosine- and thymine-containing oligonucleotides stabilize a preferred emissive silver cluster.
Keywords: silver clusters, fluorescence, DNA templates
Introduction
An important feature of nanomaterials is how the size influences their optical, electronic, magnetic, and chemical properties.1 Clusters are one general classification of metallic nanomaterials and are comprised of 2-20 atoms with radii less than 0.5 nm.2 In this size regime, discrete energy levels emerge from the continuous density of states found in larger nanoparticles and bulk metals. This distinction in the energy level organization has a profound impact on the optical properties of metallic clusters, as illustrated by the greatly enhanced radiative decay rates in clusters. For example, a Au28 species has a fluorescence quantum yield that is over one million times larger than bulk gold.3,4 Smaller noble metal clusters have even larger fluorescence quantum yields in the range 10% – 70%.5 Additionally, they have high photostabilities and large absorption cross sections, thus making them ideal chromophores.
To inhibit agglomeration, a variety of methods have been used, and these have allowed the unique properties of metallic clusters to be characterized.6 In solutions, ligands with electron-rich binding sites complex with clusters and stabilize them against further reactions. For example, dendrimers, peptides, and other capping agents have been used for the bottom-up and top-down synthesis of metal clusters.7,8,9,10,11,12 Nucleic acids also present nitrogen and oxygen functional groups that coordinate with metallic nanomaterials.13,14 Nucleic acids are distinguished from other ligands because they can form and stabilize the nanoparticles as well as assemble more complex nanomaterials via base pairing interactions.14,15,16 Our work utilizes DNA as a scaffold for the synthesis of silver clusters composed of 2-10 atoms. Earlier studies were motivated by the sequence specificity of the interaction of silver clusters with cytosine, and recent studies emphasize the key role of this and other bases for the formation of a range of clusters with distinctive fluorescence spectra.17,18 The present studies consider the role of the bases and the base sequence on the formation of blue/green emitting silver clusters using the oligonucleotides dT12, dT4C4T4, and dC4T4C4. The results indicate that both base interactions and inherent cluster stability determine the types of silver clusters that form with DNA.
Experimental Section
Silver nitrate (204390, Sigma-Aldrich) and sodium borohydride (213462, Sigma-Aldrich) were used as received. The desalted oligonucleotides (Integrated DNA Technologies) were dissolved in deionized water (Elix 10 Water Purification System , Millipore). Buffers with the desired pH contained a total concentration of 5 or 10 mM of the acid/conjugate base. DNA concentrations were determined by absorbance using molar extinction coefficient based on the nearest-neighbor approximation.19 The silver clusters were synthesized by adding AgNO3 to the DNA solutions and then adding NaBH4, followed by vigorous shaking for 1-2 min. The solutions were kept in the dark prior to the spectroscopic measurements. Absorption (Cary 50, Varian), fluorescence (Fluoromax 3, HORIBA Jobin Yvon), and circular dichroism (J-710, Jasco) spectra were acquired using quartz cuvettes with 1 cm pathlengths. In the case of dT4C4T4, the prominent band in the excitation spectrum has a corresponding absorption band. Thus, the fluorescence quantum yield (φf) for this species was measured using the variation fluorescence intensity with the absorbance.20 Quinine sulfate in 0.05 M H2SO4 (φf = 0.51) was used as the reference chromophore21, 22 To determine the effect of oxygen and nitrogen on cluster formation, reactions were conducted at 80-100 psi using a high pressure reaction chamber (Parr Instruments).
The fluorescence anisotropy (r) values were obtained using the expression
| (Eq.1) |
where IVV and IVH are the vertically and horizontally polarized emission of the silver clusters, respectively, with vertically polarized excitation and G is the sensitivity factor of the detection system.23 Each intensity value used in this expression represents the computer averaged values of ten successive measurements. Background fluorescence and scattered light were removed by using a blank solution. All spectral measurements were carried out at 298 K. SYBR Gold (S-11494, Invitrogen/Molecular Probes) complexes with the oligonucleotides were prepared following the protocol from the manufacturer using λex = 490 nm and λem = 530 nm. Tetramethylrhodamine in glycerol at 279K showed a limiting anisotropy of 0.35.24
For fluorescence correlation spectroscopy studies, excitation at 362 nm with an average power of ~30 μW was provided by a frequency-doubled mode-locked Ti:Sapphire laser (MaiTai Broadband, Spectra Physics). A 60× 1.2 NA water immersion microscope objective (UPLAN S APO, Olympus), specifically designed to image water-immersed objects up to 200 microns away from the coverslip, was used in a laser epi-illuminated geometry to excite the sample and collect the fluorescence emission. A 400 nm long-pass dichroic (Chroma Technology Corporation) reflected the 362 nm excitation into the back of the objective and transmit the emission. A 75 μm diameter pinhole located at the image plane of the microscope tube lens (180 mm focal length) was used to spatially filter the emission collected by the objective. The light transmitted through the pinhole was collimated and a 500 nm long-pass filter spectrally filtered the emission. A 50% beam splitter split the filtered emission between two actively-quenched single-photon counting avalanche photodiode (APD) detectors (SPCM-AQR14, Perkin Elmer). The APD detector outputs were cross-correlated using a hardware correlator (ALV 5000E/FAST, ALV GmbH). This approach minimized artifacts in the autocorrelation due to detector after-pulsing and dead-time. Sample droplets were placed on a glass cover slip for analysis. The volume of solvent probed was located ~25 μm above the cover slip, well within the 200 μm working distance of the objective. Due to the highly effective spatial filtering in this setup, background from the cover slip was low. Moreover, spectral discrimination against Raman scattering (385 and 413 nm) and impurity fluorescence was achieved by the large Stokes shift of the DNA/Ag cluster emission. Spectral dispersion of the sample emission confirmed that the fluorescence arises from the clusters. The total background from the borate buffer used for the FCS measurements was 2.5 kHz, which is small compared to the total count rate, ~100 kHz, obtained from the DNA/Ag clusters. To confirm that uncorrelated background emission was not significantly influencing the cluster autocorrelation functions, the stock cluster solution with a ten-fold higher concentration was analyzed (data not shown). As expected, the amplitude of the autocorrelation function decreased by approximately a factor of 10 (11x), and the average count rate increased by approximately the same factor (9x).
A dilute solution of the coumarin dye 7-diethylaminocoumarin-3-carboxylic acid (D1421, Invitrogen/Molecular Probes) in water was used as a reference fluorophore to determine the dimensions of the probe volume using a 3-D Gaussian model:25
| (Eq.2) |
where G(τ)-1 is the fluorescence autocorrelation, τ is the lag time, N is the average number of fluorescent molecules in the probe volume, ω is the transverse radius of the probe volume, z is the length of the probe volume, and τd is the lag time at which the autocorrelation amplitude has decayed to approximately one half of its maximum value, G(0)-1. The probe volume radius is related to the crossing time and the translational diffusion coefficient (D) by:
| (Eq.3) |
The dimensions of the FCS detection volume were determined using the well-established method of fitting the autocorrelation function obtained from a reference fluorophore (coumarin) with a known translational diffusion coefficient.25 Crossing times, τd, of 30 μs for the coumarin dye were obtained for diffusion in aqueous solution. Using a coumarin diffusion coefficient of 410 μm2 sec−1 in water, the calculated dimensions of the detection volume are 0.46 μm for the diameter (2ω) and 3.7 μm for the axial length (2z).26,27,28 The resulting probe volume (π3/2ω2z) was 0.54 fL. To validate this volume, the concentration of a reference coumarin solution was measured to be 100 nM via FCS, which compared favorably with the known concentration of 140 nM. A 50 nm band-pass filter centered at 460 nm was used for the measurement of the coumarin autocorrelation.
The silver cluster autocorrelations were fit with the structure factor, z/ω, constrained to 8. The average count rate per cluster particle under our excitation conditions (~30 uW average power in a 0.46 μm diameter excitation beam giving a time-averaged excitation intensity of ~20 kW/cm2) is obtained from the total count rate on both APD detectors by the average particle number, N. Using the observed total count rate (~130 kHz) and an average number of clusters in the detection volume obtained from FCS (~230), the brightness was in the range of 0.6-0.7 kHz per cluster. The background from the borate buffer solvent under identical excitation conditions was 2.5 kHz. The autocorrelations were collected for 1800 s for the clusters bound to dT4C4T4. The samples were diluted 10-fold in a pH =10.5 borate buffer. The autocorrelation functions were fit to the 3-D Gaussian model (Eq. 2) using the Levenberg-Marquardt least squares minimization algorithm. The autocorrelation data points were weighted in the fit by their standard deviations. The data was collected in 20 runs of 90 s each and the standard deviations of the averaged autocorrelation data points were directly calculated from the data.
Results and Discussion
These studies consider how the bases and base sequence determine the types of silver clusters that form with DNA. To preface these observations, prior studies with dC12 are summarized.17 Silver clusters that form with this oligonucleotide are characterized by their red and blue/green emission bands. The most intense emission is red with λex = 580 nm/λem = 650 nm, and the effect of pH on the intensity of the red emission showed that the clusters bind with the N3 of cytosine. The emission spectra shift with the excitation wavelengths, and this observation suggests that at least two types of red emitting species form. Over time, the intensity of the red emission diminishes while the intensity of a transition at λex = 340 nm/λex = 495 nm increases. Through the use of oxidizing and reducing agents, the red emission was attributed to a fully reduced silver clusters, while the blue/green emission was attributed to an oxidized cluster, which is the focus of the present studies.
Thymine-Rich Oligonucleotides
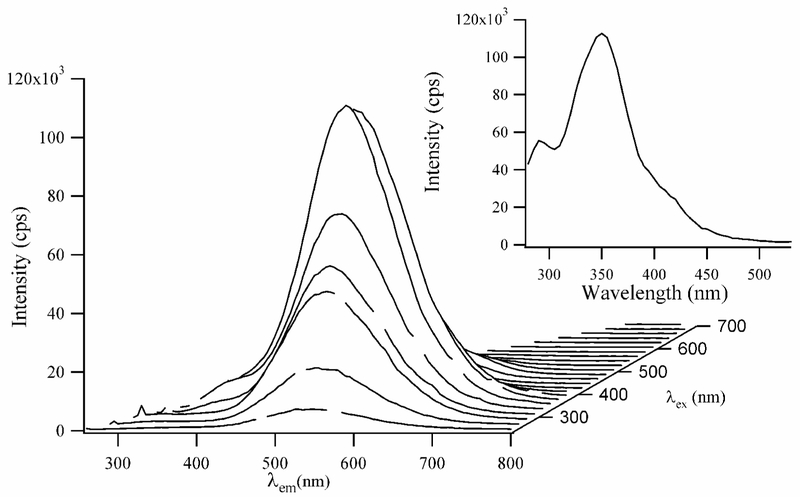
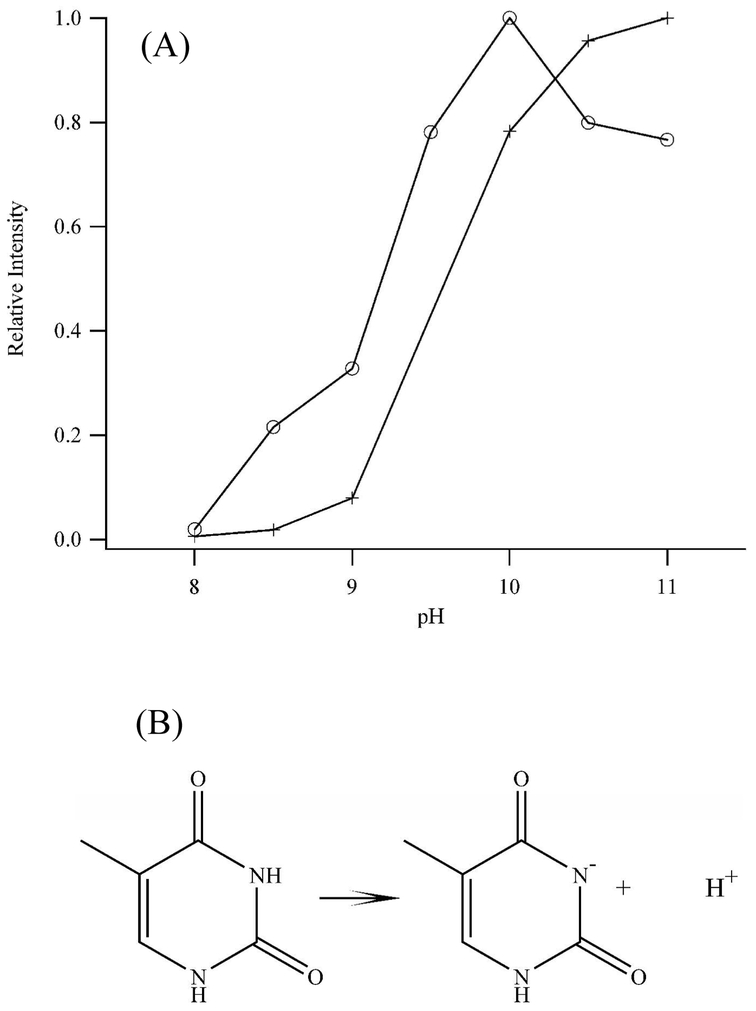
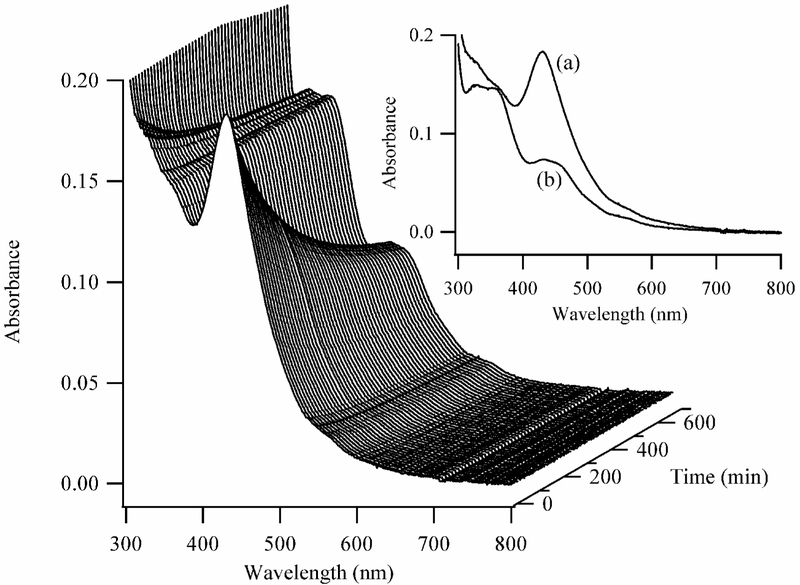
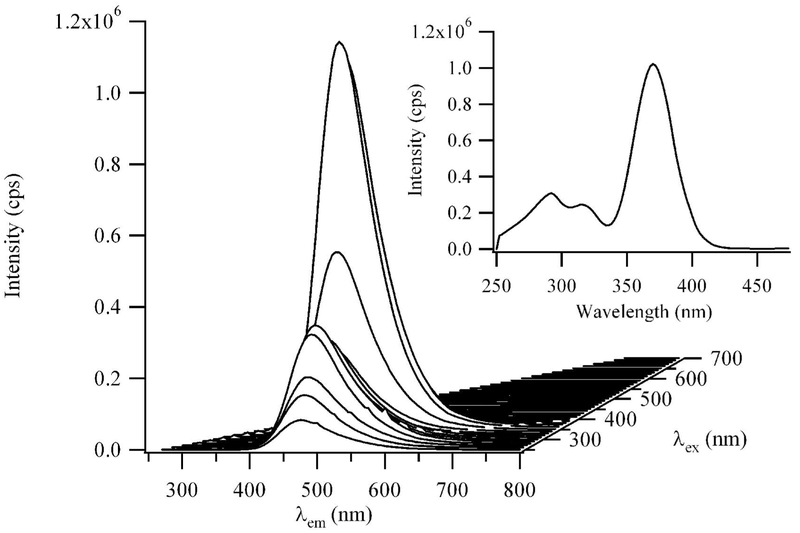
When dT12 is used as the template, green emission is dominant with λex = 350 nm/λem = 540 nm and is stable for several days (Figs. 1 and 1S). The emission depends on pH, and the intensity increases over 100-fold from pH = 8 to 11 with a midpoint at pH « 9.3 (Fig. 2). The similarity of this midpoint to the pKa = 9.7 for the N3 of the thymine base indicates that this deprotonated amine is the binding site for the green emitting cluster.19 The association of silver clusters with amines is expected, given that electron-rich ligands stabilize metal nanoparticles.7 Silver cluster formation is favored by close proximity of silver cations on the DNA template, as evident through variations in the relative stoichiometries of silver and DNA (Fig. 2S). The intensity of the green emission is strongest for a 6 Ag+:dT12 ratio, or 1 Ag+:2 bases. The increase in intensity from lower stoichiometries suggests that formation of the green emitting cluster is limited by the amount of silver. Comprehensive excitation/emission scans showed that no other emissive species form at lower concentrations, thus suggesting that the green emitting species is the favored cluster size even when the concentrations are below 6Ag+:oligonucleotide. At higher stoichiometries, the decreasing fluorescence is attributed to the formation of larger clusters with low fluorescence quantum yields that deplete the number of small, more fluorescent clusters. The formation of other nonemissive clusters is suggested by the absorption spectra (Fig. 3). After adding BH4−, the prominent band develops with λmax = 430 nm, and the absorbance of this band diminishes and the λmax shifts to longer wavelengths with time. The rates of the decreasing absorbance at 430 nm and of the increasing fluorescence at 540 nm are similar, which suggests that these are distinct species that are linked by a chemical reaction (Fig. 4S). No isosbestic point is observed in the absorption spectra, which suggests that other species contribute to the conversion. With sufficient time, the absorbance in the region 320 – 360 nm becomes prominent, and this change is accompanied by the development of the fluorescence species with λex = 350 nm (Fig. 1).
Figure 1.
A composite fluorescence spectrum of 15 μM dT12 with 90 μM Ag+ and 90 μM BH4− in a pH = 10.5 buffer. The emission wavelengths are on the bottom axis and the excitation wavelengths are incremented by 20 nm on the right axis. The spectra were acquired 16 hrs after adding BH4−. The inset excitation spectrum was acquired using λem = 540 nm. The excitation maximum is 350 nm, and weaker transitions are observed at 295 nm and ≈ 420 nm.
Figure 2.
(A) Fluorescence intensities of the λex = 340 nm/λem = 540 nm band of dT12 (open circles) and of the λex = 360 nm/λem = 475 nm band of dT4C4T4 (crosses) as a function of pH. The maximum intensities are 150,000 cps (dT12) and 880,000 cps (dT4C4T4). The decreasing fluorescence of the dT12 samples at higher pH is not dependent on the buffer, as both carbonate and borate buffers demonstrate this behavior. (B) Protonated and deprotonated forms of the N3 of thymine.
Figure 3.
Absorption spectra acquired as a function of time (right axis) for the clusters bound to dT12. The first spectrum in the series was acquired 2 min after the addition of BH4−, and subsequent spectra were acquired at 7 min intervals. The inset shows the spectra of the clusters acquired at 7 (a) and 700 (b) min after the reaction was initiated.
The clusters are bound to the DNA template, as the motion of the clusters is dictated by the oligonucleotide. Steady-state fluorescence anisotropy values are similar for the green emitting silver cluster and for a fluorescent chromophore (SYBR Gold) bound to the same oligonucleotide, which suggests that the motions of the oligonucleotide and the cluster are linked (Table 1).23 Additionally, these anisotropy values are similar to prior measurements of comparably sized oligonucleotides.29 To provide further support for DNA-templated cluster formation, the electronic transitions in the absorption spectra have corresponding transitions in the circular dichroism spectra (Fig. 3S). Because the small silver clusters are inherently achiral, the induced circular dichroism arises because the clusters are associated with DNA.30,31
Table 1.
Fluorescence Anisotropies (r) of the Silver Clusters
| Oligonucleotide |
r (cluster-DNA)c |
r (SYBR Gold- DNA) |
|---|---|---|
| 15 μM dT12a | 0.06 ± 0.01d | 0.08 |
| 15 μM dT4C4T4b | 0.14 ± 0.02d | 0.14 |
| 0.5 μM dC4T4C4c | 0.06 ± 0.01d | 0.1 |
λex = 350 nm/λem = 545 nm, in pH = 10.7 buffer
λex = 370 nm/λem = 475 nm, in pH = 10.7 buffer
λex = 340 nm/λem = 495 nm, in water
Average of 3-4 measurements
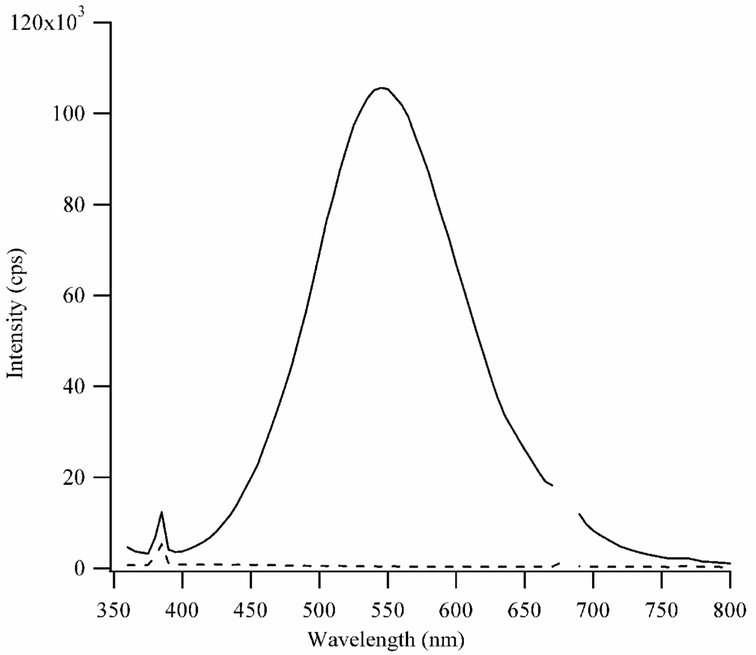
Further support for the formation of nonfluorescent clusters is provided by the oxygen dependence of the fluorescence. The oxidation/reduction potentials of metal clusters differ from the bulk metal, and our results show that nitrogen and oxygen influence the formation of the dT12-bound cluster.32 With O2, the absorption and fluorescence spectra are similar to those obtained in the air-saturated samples (Figs. 5S and 6S). In the presence of N2, no emission is observed, but cluster formation is evident based on the formation of colored solutions (Figs. 4 and 5S). To further explore the role of these gases on cluster formation, N2 and O2 were used sequentially (Fig. 4). The reduction was first conducted in a nitrogen-saturated solution and reacted for 13 hrs to allow sufficient time for cluster formation. The solution was then saturated with oxygen for 24 hrs, after which the green emission recovered to a high level comparable to that observed for the air-saturated solutions. Thus, these results indicate that nonfluorescent and reduced clusters form in nitrogen and that oxygen enables the conversion of the nonfluorescent to fluorescent species. Prior studies with dC12 showed that a reduced red-emitting species converted to an oxidized blue/green-emitting species.17 The absence of red emission with dT12 suggests that these two types of clusters have different stoichiometries.
Figure 4.
Fluorescence spectrum acquired using λex = 340 nm of a 15 μM dT12 with 90 μM Ag+ and 90 μM BH4− sample in a pH = 10.5 buffer. The first spectrum (dotted line) was acquired in a solution saturated with N2. The second spectrum (solid line) was acquired after O2 was introduced.
The importance of thymine on cluster formation is demonstrated by studies with dT4C4T4. The dominant emission occurs at 475 nm with λex = 370 nm and is stable for several days (Figs. 5 and 1S). In the following respects, the clusters that form with dT4C4T4 are similar to those that form with dT12. First, the fluorescence intensity increases by over 200-fold as the pH is changed from 8 to 11 (Fig. 2). The midpoint of the transition (pH « 9.5) is similar to the pKa of the N3 of thymine, again demonstrating that this deprotonated amine complexes with the fluorescent silver clusters. Relative to dT12, the small shift in the transition may reflect that the base context influences the pKa of thymine.33 Second, fluorescence is suppressed by nitrogen and enhanced by oxygen, which suggests that the fluorescent species is oxidized (Fig. 7S). Third, the silver clusters are bound to the DNA template. The electronic transitions of the clusters have corresponding circular dichroism transitions (Fig. 3S). In addition, the fluorescence anisotropy values are comparable for the silver cluster-DNA and SYBR Gold-DNA conjugates (Table I). Fourth, 6 Ag+:oligonucleotide stoichiometries yield the maximum fluorescence for both oligonucleotides, which suggests that a favored cluster size is stabilized by both oligonucleotides (Fig. 2S). One notable difference between the two oligonucleotides is that the clusters that form with dT12 and dT4C4T4 have similar excitation maxima in the fluorescence spectra, but the Stokes shift is smaller for the clusters that form with dT4C4T4. This difference suggests that sequence specific interactions influence the environment and hence the spectral properties of the clusters.
Figure 5.
A composite fluorescence spectrum of 15 μM dT4C4T4 with 90 μM Ag+ and 90 μM BH4− in a pH = 10.5 buffer. The emission wavelengths are on the bottom axis and the excitation wavelengths are on the right axis. The spectra were acquired 16 hrs after adding BH4−. The inset excitation spectrum was acquired using λem = 475 nm. The excitation maximum is 370 nm, and weaker transitions are observed at 292 nm and 316 nm.
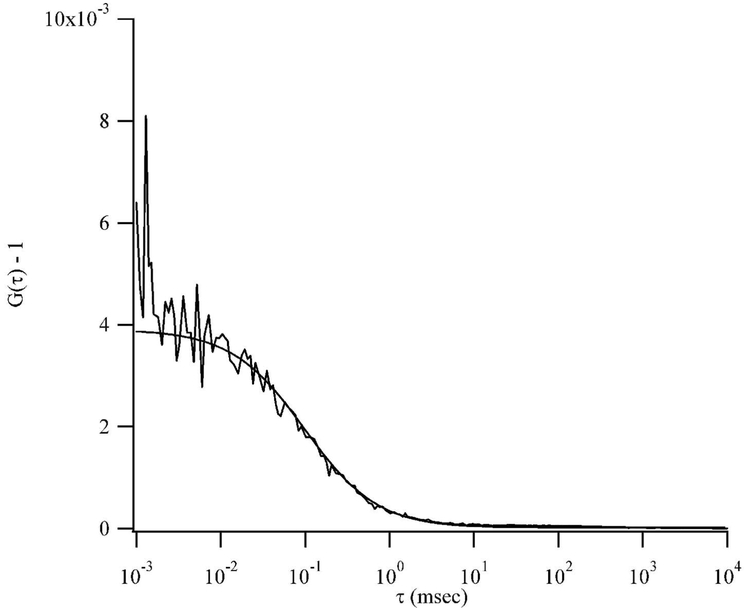
Fluorescence correlation spectroscopy provides information about the concentration and the size of the dT4C4T4-cluster conjugate (Fig. 6). Because Poisson statistics determine the occupancy of the laser probe, the average number of fluorescent species in the probe volume was determined. Using the calibrated volume based on the comarin autocorrelation, the concentration of the emitting species was measured to be 7 μM, which corresponds to ~50% labeling of the DNA strands. The labeling efficiency could be reduced because other less fluorescent species form, as suggested by the presence of other transitions in the absorption spectra (Fig. 3S). The size of the cluster-DNA conjugate is estimated from the transit times through the focused laser beam. As subsequently discussed, photochemical reactions reduce the transit times at higher laser powers. The lowest average power that provided adequate sensitivity was 3 μW, and the transit time was 220 μs and the diffusion coefficient is 240 μm2 sec−1. This value is consistent with the diffusion coefficient measured for a similarly sized thymine oligonucleotide.34
Figure 6.
Fluorescence autocorrelation functions for the clusters attached to dT4C4T4. The smooth lines are weighted fits of the autocorrelations to a 3-D Gaussian model (Eq. 2). The fit parameters are N = 258 and τd= 98 μs.
The photophysical properties of the blue/green emitting cluster that forms with dT4C4T4 are considered because the absorption band is clearly resolved and the wavelengths of the absorption and fluorescence excitation maxima match. The fluorescence quantum yield for this species is 14%, which is consistent with prior measurements of other small noble metal clusters (Fig. 8S).5,18 Using the 7 μM concentration of the clusters from the FCS studies, the extinction coefficient is 14,000 M−1 cm−1, which is lower than cluster-DNA conjugates with longer wavelength emission.18 An estimate of the maximum detection rate, ignoring saturation effects, can be obtained from these spectroscopic parameters and an estimate of the overall fluorescence detection efficiency. Based on an average laser power of 30 μW and a focal radius of 0.23 μm, the emission probability per laser pulse is 0.0014. With an 80 MHz pulse rate and a 5% detection efficiency, the maximum detection rate is 5.6 KHz. The observed detection rate is 0.6 – 0.7 KHz, and two factors that could compete with radiative decay are considered. First, saturation of the excitation transition would reduce the expected count rate at higher excitation powers. In support, the observed cluster emission intensity is sub-linear with respect to the excitation power (Fig. 9S). Second, photoinduced decomposition would reduce the fluorescence. The excitation energy provided by a 362 nm photon is 3.4 eV, which is large compared to the «1 eV bond energy/atom for cationic and neutral silver clusters. 35,36 While DNA is expected to stabilize the cluster, this large difference suggests that photodissociation could be limiting the detection rate. In support, the FCS transit times decrease from 220 to 40 μs as the average excitation power is increased from 3 to 170 μW (data not shown). Prior studies have noted the lack of photostability of blue emitting clusters.18
Cytosine-Rich Oligonucleotides
The properties of the clusters that form with the two thymine-rich oligonucleotides are similar, thus suggesting that a common cluster forms with both templates. Prior studies established that an oxidized cluster with blue/green emission also forms with dC12. To further explore the sequence dependence of cluster formation, dC4T4C4 was used. In contrast with the studies involving dT12 and dT4C4T4, the concentration of dC4T4C4 influences the fluorescence spectra of the clusters. A red emissive species forms with dC4T4C4 as also observed with dC12, and the emission is dominant at the higher concentration of 15 μM oligonucleotide.17 At the lower concentration of 0.5 μM, the only emission band has λex = 340 nm/λem=495 nm (Fig. 10S). The distinct spectra indicate that different species form in these two concentration ranges, and we are currently investigating both concentration and environmental effects on the stoichiometry and spectra of the clusters. In this contribution, we focus on the lower concentrations, as these clusters are most similar to those that form with the other two thymine-rich templates. Besides the spectral similarities, other properties suggest that a common species forms with all the oligonucleotides. First, an oxidized cluster forms with dC4T4C4 (Fig. 10S). The fluorescence intensity is suppressed in a nitrogen-saturated solution and subsequently recovers upon exposure to oxygen. Second, the clusters are comprised of a small number of silver atoms, as indicated by the maximum fluorescence at 8 Ag+:oligonucleotide (Fig. 2S). This stoichiometry is slightly higher than observed with dT12 and dT4C4T4, which may be attributed to higher relative Ag+ concentrations needed to promote association under these dilute conditions. Third, the fluorescence anisotropy values are similar for the cluster and the SYBR Gold, suggesting that both chromophores are attached to a single-stranded DNA template (Table 1). Fourth, the pH dependence of the fluorescence suggests that the bases are involved in stabilizing the clusters (Fig. 10S). The maximum fluorescence occurs at pH ~ 6, which is higher than the pKa for the N3 of cytosine. We are currently investigating whether the sequence context could be influencing this pH dependence.
Conclusions
Two important issues are highlighted by the present and recent studies of silver clusters that form with DNA. First, the bases have a dominant influence on silver cluster formation and stabilization, as the pH dependence of the fluorescence demonstrates that endocyclic amines of the bases are the binding sites of the clusters. Second, specific emissive DNA-silver conjugates are favored, and the present studies consider the blue/green emitting species forms with dT12, dT4C4T4, and dC4T4C4. These cluster-DNA conjugates have similar spectroscopic, physical, and chemical properties, which is consistent with the same species forming with all the oligonucleotide templates. These observations suggest that both base complexation and inherent cluster stability contribute to the types of silver clusters that form with DNA. While the thymine-rich oligonucleotides form only blue/green emitting species, cytosine-rich oligonucleotides also form red emitting species. We are currently investigating the factors that contribute the sequence dependence of the fluorescence.
Supplementary Material
ACKNOWLEDGMENT:
The authors are most appreciative of the comments of the reviewers. JTP gratefully acknowledges the support provided by the National Institutes of Health (R15GM071370 and P20 RR-016461 (from the National Center for Research Resource)), the National Science Foundation (0718588), and the Henry Dreyfus Teacher-Scholar Awards Program. This work was performed, in part, at the Center for Integrated Nanotechnologies, a U.S. Department of Energy, Office of Basic Energy Sciences user facility at Los Alamos National Laboratory (Contract DE-AC52-06NA25396) and Sandia National Laboratories (Contract DE-AC04-94AL85000).
Footnotes
SUPPORTING INFORMATION PARAGRAPH:
The supplemental figures are provided in the supporting information.
REFERNCES:
- 1.Wilcoxon JP; Abrams BL, Synthesis, structure and properties of metal nanoclusters. Chemical Society Reviews 2006, 35, (11), 1162–1194. [DOI] [PubMed] [Google Scholar]
- 2.Kreibig U; Vollmer M, Optical Properties of Metal Clusters. ed.; Springer-Verlag: New York, 1995; Vol. 25. [Google Scholar]
- 3.Link S; Beeby A; FitzGerald S; El-Sayed MA; Schaaff TG; Whetten RL, Visible to infrared luminescence from a 28-atom gold cluster. Journal of Physical Chemistry B 2002, 106, (13), 3410–3415. [Google Scholar]
- 4.Lee D; Donkers RL; Wang G; Harper AS; Murray RW, Electrochemistry and Optical Absorbance and Luminescence of Molecule-like Au38 Nanoparticles. Journal of the American Chemical Society 2004, 126, (19), 6193–6199. [DOI] [PubMed] [Google Scholar]
- 5.Zheng J; Nicovich PR; Dickson RM, Highly Fluorescent Noble-Metal Quantum Dots. Annual Review of Physical Chemistry 2006, 58, 409. [DOI] [PMC free article] [PubMed] [Google Scholar]
- 6.(a) Schulze W; Rabin I; Ertl G, Formation of Light-Emitting Ag2 and Ag3 Species in the Course of Condensation of Ag Atoms with Ar. Chemphyschem 2004, 5, (3), 403–407. [DOI] [PubMed] [Google Scholar]; (b) Eichelbaum M; Rademann K; Hoell A; Tatchev DM; Weigel W; Stöber R; Pacchioni G, Photoluminescence of atomic gold and silver particles in soda-lime silicate glasses. Nanotechnology 2008, 19, (13), 135701. [DOI] [PubMed] [Google Scholar]; (c) Fierro-Gonzalez JC; Hao Y; Gates BC, Gold Nanoclusters Entrapped in the α-Cages of Y Zeolites: Structural Characterization by X-ray Absorption Spectroscopy. Journal of Physical Chemistry C 2007, 111, (18), 6645–6651. [Google Scholar]
- 7.Wilcoxon JP; Abrams BL, Synthesis, structure and properties of metal nanoclusters. Chemical Society Reviews 2006, 35, (11), 1162–1194. [DOI] [PubMed] [Google Scholar]
- 8.(a) Crooks RM; Lemon BI; Sun L; Yeung LK; Zhao MQ, Dendrimer-encapsulated metals and semiconductors: Synthesis, characterization, and applications In Dendrimers Iii: Design, Dimension, Function, ed.; ‘Ed.’∧’Eds.’ 2001; ‘Vol.’ 212, p∧pp 81–135. [Google Scholar]; (b) Zheng J; Dickson RM, Individual water-soluble dendrimer-encapsulated silver nanodot fluorescence. Journal of the American Chemical Society 2002, 124, (47), 13982–13983. [DOI] [PubMed] [Google Scholar]
- 9.Yu J; Patel SA; Dickson RM, In Vitro and Intracellular Production of Peptide-Encapsulated Fluorescent Silver Nanoclusters. Angewandte Chemie International Edition 2007, 46, (12), 1927–2121. [DOI] [PMC free article] [PubMed] [Google Scholar]
- 10.(a) Henglein A; Linnert T; Mulvaney P, Reduction of Ag+ in Aqueous Polyanion Solution - Some Properties and Reactions of Long-Lived Oligomeric Silver Clusters and Metallic Silver Particles. Berichte Der Bunsen-Gesellschaft-Physical Chemistry Chemical Physics 1990, 94, (12), 1449–1457. [Google Scholar]; (b) Treguer M; Rocco F; Lelong G; Le Nestour A; Cardinal T; Maali A; Lounis B, Fluorescent silver oligomeric clusters and colloidal particles. Solid State Sciences 2005, 7, (7), 812–818. [Google Scholar]
- 11.Bertino MF; Sun Z-M; Zhang R; Wang L-S, Facile Syntheses of Monodisperse Ultrasmall Au Clusters. Journal of Physical Chemistry B 2006, 110, (43), 21416–21418. [DOI] [PubMed] [Google Scholar]
- 12.Duan H; Nie S, Etching Colloidal Gold Nanocrystals with Hyperbranched and Multivalent Polymers: A New Route to Fluorescent and Water-Soluble Atomic Clusters. Journal of the American Chemical Society 2007, 129, (9), 2412–2413. [DOI] [PubMed] [Google Scholar]
- 13.(a) Kryachko ES; Remacle F, Complexes of DNA Bases and Watson-Crick Base Pairs with Small Neutral Gold Clusters. Journal of Physical Chemistry B 2005, 109, (48), 22746–22757. [DOI] [PubMed] [Google Scholar]; (b) Kumar A; Mishra PC; Suhai S, Binding of gold clusters with DNA base pairs: A density functional study of neutral and anionic GC-Aun and AT-Aun (n = 4, 8) complexes. Journal of Physical Chemistry A 2006, 110, (24), 7719–7727. [DOI] [PubMed] [Google Scholar]
- 14.Hinds S; Taft BJ; Levina L; Sukhovatkin V; Dooley CJ; Roy MD; MacNeil DD; Sargent EH; Kelley SO, Nucleotide-Directed Growth of Semiconductor Nanocrystals. Journal of the American Chemical Society 2006, 128, (1), 64–65. [DOI] [PubMed] [Google Scholar]
- 15.Berti L; Burley GA, Nucleic acid and nucleotide-mediated synthesis of inorganic nanoparticles. Nature Nanotechnology 2008, 3, (2), 81–87. [DOI] [PubMed] [Google Scholar]
- 16.Liu D; Gugliotti LA; Wu T; Dolska M; Tkachenko AG; Shipton MK; Eaton BE; Feldheim DL, RNA-Mediated Synthesis of Palladium Nanoparticles on Au Surfaces. Langmuir 2006, 22, (13), 5862–5866. [DOI] [PubMed] [Google Scholar]
- 17.Ritchie CM; Johnsen KR; Kiser JR; Antoku Y; Dickson RM; Petty JT, Ag Nanocluster Formation Using a Cytosine Oligonucleotide Template. Journal of Physical Chemistry C 2007, 111, (1), 175–181. [DOI] [PMC free article] [PubMed] [Google Scholar]
- 18.Richards CI; Choi S; Hsiang J-C; Antoku Y; Vosch T; Bongiorno A; Tzeng Y-L; Dickson RM, Oligonucleotide-Stabilized Ag Nanocluster Fluorophores. Journal of the American Chemical Society 2008, 130, (15), 5038–5039. [DOI] [PMC free article] [PubMed] [Google Scholar]
- 19.Bloomfield VA, Crothers DM, and Tinoco J, Ignacio (2000) Nucleic acids: Structures, properties, and functions, University Science Books, Sausaltio, CA. [Google Scholar]
- 20.Williams ATR; Winfield SA; Miller JN, Relative Fluorescence Quantum Yields Using a Computer-Controlled Luminescence Spectrometer. Analyst 1983, 108, (1290), 1067–1071. [Google Scholar]
- 21.Gelernt B; Findeisen A; Stein A; Poole JA, Absolute measurement of the quantum yield of quinine bisulphate. Journal of the Chemical Society - Faraday Transactions 1974, 2, 939–940. [Google Scholar]
- 22.Crosby GA; Demas JN, Measurement of photoluminescence quantum yields. Review. Journal of Physical Chemistry 1971, 75, (8), 991–1024. [Google Scholar]
- 23.Lakowicz JR, Principles of Fluorescence Spectroscopy, Plenum Press, New York, 1983. [Google Scholar]
- 24.Burghardt TP; Lyke JE; Ajtai K, Fluorescence emission and anisotropy from rhodamine dimers. Biophysical Chemistry 1996, 59, (1–2), 119–131. [DOI] [PubMed] [Google Scholar]
- 25.Rigler R; Mets U; Widengren J; Kask P, Fluorescence Correlation Spectroscopy with High Count Rate and Low-Background - Analysis of Translational Diffusion. European Biophysics Journal with Biophysics Letters 1993, 22, (3), 169–175. [Google Scholar]
- 26.The reported diffusion coefficient for a similar dye, Coumarin 440 (MW: 175.2), in 100% MeOH at 25°C is 870 μm2 s−1 (Ref.Error! Bookmark not defined.). This value was corrected for the change in solvent and temperature (Ref. 28). The corrected value of the diffusion of the coumarin dye in water is 410 μm2 sec−1.
- 27.Pappaert K; Biesemans J; Clicq D; Vankrunkelsven S; Desmet G, Measurements of diffusion coefficients in 1-D micro- and nanochannels using shear-driven flows. Lab on a Chip - Miniaturisation for Chemistry and Biology 2005, 5, (10), 1104–1110. [DOI] [PubMed] [Google Scholar]
- 28.Wilke CR; Chang P, Correlation of Diffusion Coefficients in Dilute Solutions. A.I.Ch.E. Journal 1955, 1, (2), 264–270. [Google Scholar]
- 29.(a) Nakamura M; Fukunaga Y; Sasa K; Ohtoshi Y; Kanaori K; Hayashi H; Nakano H; Yamana K, Pyrene is highly emissive when attached to the RNA duplex but not to the DNA duplex: the structural basis of this difference. Nucleic Acids Research 2005, 33, (18), 5887–5895. [DOI] [PMC free article] [PubMed] [Google Scholar]; (b) Juskowiaka B; Galezowskaa E; Zawadzkaa A; Gluszynskaa A; Takenakab S, Fluorescence anisotropy and FRET studies of G-quadruplex formation in presence of different cations. Spectrochimica Acta Part A: Molecular and Biomolecular Spectroscopy 2006, 64, (4), 835–843. [DOI] [PubMed] [Google Scholar]
- 30.Rodger A; Norden B, Circular Dichroism and Linear Dichroism. ed.; Oxford: New York, 1997. [Google Scholar]
- 31.Shemer G; Krichevski O; Markovich G; Molotsky T; Lubitz I; Kotlyar AB, Chirality of Silver Nanoparticles Synthesized on DNA. Journal of the American Chemical Society 2006, 128, (34), 11006–11007. [DOI] [PubMed] [Google Scholar]
- 32.Henglein A, Mulvaney P, and Linnert T (1991) Chemistry of Agn aggregates in aqueous-solution - nonmetallic oligomeric clusters and metallic particles, Faraday Discussions, 31–44. [Google Scholar]
- 33.Acharya S; Barman J; Cheruku P; Chatterjee S; Acharya P; Isaksson J; Chattopadhyaya J, Significant pKa Perturbation of Nucleobases Is an Intrinsic Property of the Sequence Context in DNA and RNA. Journal of the American Chemical Society 2004, 126, (28), 8674 −8681. [DOI] [PubMed] [Google Scholar]
- 34.Doose S; Barsch H; Sauer M, Polymer Properties of Polythymine as Revealed by Translational Diffusion. Biophysical Journal 2007, 93, (4), 1224–1234. [DOI] [PMC free article] [PubMed] [Google Scholar]
- 35.Bonacic-Koutecky V; Pittner J; Boiron M; Fantucci P, An accurate relativistic effective core potential for excited states of Ag atom: An application for studying the absorption spectra of Ag-n and Ag-n(+) clusters. Journal of Chemical Physics 1999, 110, (8), 3876–3886. [Google Scholar]
- 36.Huber KP; Herzberg G, Constants of Diatomics Molecules.; Van Nostrand Reinhold: New York, 1979. [Google Scholar]
Associated Data
This section collects any data citations, data availability statements, or supplementary materials included in this article.


