Abstract
Single-molecule localization microscopy (SMLM), such as stochastic optical reconstruction microscopy and (fluorescence) photoactivated localization microscopy, has enabled superresolution microscopy beyond the diffraction limit. However, the temporal resolution of SMLM is limited by the time needed to acquire sufficient sparse single-molecule activation events to successfully construct a superresolution image. Here, a novel fast SMLM technique is developed to achieve superresolution imaging within a much shortened duration. This technique does not require a faster switching rate or a higher activation density, which may cause signal degradation or photodamage/bleaching, but relies on computational algorithms to reconstruct a high-density superresolution image from a low-density one using the concept of blind image inpainting. Our results demonstrate that the technique reduces the acquisition time by up to two orders of magnitude compared to the conventional method while achieving the same high resolution. We anticipate our technique to enable future real-time live cell imaging with even higher resolution.
OCIS codes: (180.2520) Fluorescence microscopy, (100.3010) Image reconstruction techniques
1. INTRODUCTION
Single-molecule localization microscopy (SMLM), such as stochastic optical reconstruction microscopy (STORM) [1] and (fluorescence) photoactivated localization microscopy [(F)PALM] [2,3], is able to break the diffraction limit in optical fluorescence microscopy. Behind various SMLM methods, there lies a common principle: the localization precision of a single fluorophore is much lower than the width of the point spread function (PSF), given enough photons. To exploit this property, the specimen is labeled with photoswitchable (or photoactivatable) fluorophores, of which only a random sparse subset is fluorescent (on) at a time. After detecting and localizing the activated fluorophores, an artificial subdiffraction image is synthesized from a fluorophore localization list accumulated from different camera frames. In this context, both localization precision and localization density contribute to the spatial resolution of the final subdiffractive image [4], but the latter is always the limiting factor. According to the Nyquist criterion, the minimum required molecular density of localized fluorescent probes in order to achieve a certain spatial resolution needs to be (2∕spatial resolution)D, where D = 1, 2, or 3 for one-dimensional (1D), two-dimensional (2D), or three-dimensional (3D) imaging, respectively [5,6]. In order to ensure that the localization density satisfies the Nyquist criterion, a large number of sequential frames are necessary to acquire, suggesting long acquisition time and thus low imaging speed. This restriction not only limits the time resolution of SMLM but can also result in light-induced perturbations in biological samples. Therefore, there exists a strong demand for fast SMLM techniques.
Currently, there are two types of methods to accelerate the imaging speed without compromising the spatial resolution. One is to apply a fast switching rate, along with high excitation power. Using organic fluorophores and high power lasers, Jones et al. reduced the image acquisition time down to 1–2 s while still maintaining the 3D spatial resolution of 30 nm lateral and 50 nm axial [7]. Huang et al. achieved video-rate SMLM using scientific complementary metal-oxide semiconductor (sCMOS) cameras and a new localization algorithm accounting for the pixel-dependent sCMOS noises [8]. Another popular approach is to increase the activation density at each camera frame so that more molecules can be localized and the required number of frames is thus reduced. Because conventional localization methods fail to resolve such partially overlapping fluorescent spots, several advanced algorithms have been proposed to address this issue [9–16]. Despite the acceleration in imaging speed, these fast SMLM techniques have their limitations: high excitation intensity may increase photodamage, and a fast switching rate can cause signal degradation [11].
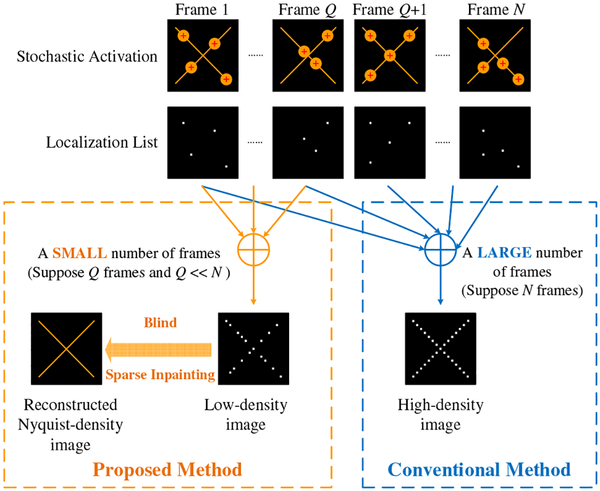
Here we report a novel approach to fast SMLM, which tackles the problem from a different perspective. This approach does not require a faster switching rate or a higher activation density, thereby reducing signal degradation or photodamage/bleaching. The experimental setup and data acquisition remain the same as conventional methods, except that fewer camera frames are acquired, which in turn increases the imaging speed. For conventional SMLM, such a low number of frames causes the density of the fluorophore localization list to be far below the Nyquist criterion (called the low-density image) and the synthesized image to fail in resolving fine structures in the sample. The novelty of the proposed method lies in the capability to recover an image with a resolution that satisfies the Nyquist criterion (called the Nyquist-density image) from the low-density image such that those otherwise unresolvable fine structures can be resolved. It is worth noting that the desired Nyquist-density image is not necessarily the same as the image synthesized by the full fluorophore localization list obtained from a large number of camera frames (called the high-density image) in conventional SMLM. The Nyquist-density image directly reveals the structures of the specimen rather than providing a full fluorophore list because the ultimate goal of SMLM is to visualize the specimen structure.
2. RECONSTRUCTION ALGORITHM
We formulate the problem as an image inpainting task, which restores the unknown pixels based on certain known regions in an image. Specifically, the incomplete fluorophore localization list (from much fewer frames than required in conventional SMLM) is first projected onto a discrete grid whose spacing is one-half of the desired spatial resolution. Each fluorophore location is assigned to its nearest grid and the intensities of different fluorophores in the same grid are summed up. As a result, the localization list is converted to a pixelated image, i.e., a low-density image. The complete fluorophore localization list will generate a high-density image. We further assume that the low-density image partially captures the Nyquist-density image to be reconstructed. Mathematically, the relationship between the vectorized low-density image xQ from the localization list acquired in Q camera frames and the desired Nyquist-density image vector x is modeled as
| (1) |
where PQ is a diagonal matrix with elements of either 1, meaning the information of x is acquired at this location, or 0, meaning the information is missing. When Q is small, the density in xQ is below the Nyquist criterion. With increased Q, a high-density image can be obtained but requires longer acquisition time. Our goal is to reduce the acquisition time by reconstructing a Nyquist-density image x faithfully from its low-density counterpart xQ with a small Q. Figure 1 uses an X-shaped structure as an example to illustrate the difference between the proposed method and the conventional SMLM. It is seen that the proposed method directly reveals the sample structure, while the conventional SMLM shows the localized fluorophores. Ideally, the images from both methods should provide the same capability of resolving fine structures.
Fig. 1.
Schematic comparison of the proposed blind sparse inpainting method with the conventional SMLM method.
To solve Eq. (1), our approach first estimates the unknown measurement matrix PQ (called “blind”) based on the low-density image xQ and then estimates x from xQ. This is different from the conventional inpainting task, where PQ is known a priori. Estimating PQ is challenging because the zero-valued pixels in the low-density image xQ can represent either the grids without any fluorophores such as background (corresponding elements of PQ should be 1) or those with fluorophores but not activated or detected in the acquired Q frames (corresponding elements of PQ should be 0).
To estimate PQ, we set the corresponding diagonal elements of PQ to 1 for locations of either fluorescing molecules captured in Q frames or the background. To determine the locations of fluorescing molecules captured in Q frames, we perform hard-thresholding on the low-density image xQ. Specifically, if the intensity of a pixel is greater than a threshold, then PQ is set to 1 and 0 otherwise. The threshold can be determined from the histogram of xQ to account for the noises and disturbances. To determine the location of the background, we identify a connected group of zero-valued pixels and assume the region as background. It is worth noting that fluorescing molecules in the background or a large region of missed molecules in xQ can both affect the accuracy of PQ and thus the reconstruction accuracy.
After PQ is obtained, we estimate x from xQ, which is still nontrivial because there are infinite possibilities. Prior information has to be exploited as a constraint to obtain a unique reconstruction with good fidelity to the true structures. We employ sparseness as the image prior, which has shown promising performances [17,18] and a theoretical guarantee. Specifically, the desired Nyquist-density image is assumed to be sparse (i.e., have few significant entries) in a transformation domain. As a result, the desired image can be reconstructed from the low-density image by enforcing such sparseness. With this model, the Nyquist-density image is reconstructed by solving an L1 minimization problem:
| (2) |
where λ is a weight parameter and Φ is a sparsifying transform. In the objective function, the first term enforces the sparsity in the transform domain and the second term ensures the data consistency, with || • ||1 and || • ||2 representing L1-norm and L2-norm, respectively.
The sparsifying transform plays an important role and is dependent on the image contents. Here, we employ the curvelet transform [19] because many biological organizations (e.g., cytoskeleton) consist of anisotropic filaments and the curvelet transform uses anisotropic needle-shaped elements that possess superdirectional sensitivity. Such anisotropic features of the curvelet transform are preferred to the isotropic ones of the well-known wavelet transform when representing curve-like features. More details about the curvelet transform can be found in Ref. [19] and Supplement 1.
The weight parameter λ balances the sparsity constraint and data consistency. In general, smaller λ weights the sparsity constraint more, leading to a smoother image, while larger λ penalizes data consistency more, preserving more acquired information. It is difficult to determine the optimal value of λ without any prior information. Although methods have been proposed in the literature to tune λ automatically, we still tune λ manually in our implementation. For all normalized xQ, we find that the reconstruction is insensitive within the neighborhood of λ = 500, which is thereby set as the default value.
The convex optimization problem in Eq. (2) can be solved by any standard linear programming methods. However, most conventional linear programming methods are known to converge slowly. Here, we adopt the alternating direction method of multipliers optimization scheme [20]. The detailed algorithm is described in Supplement 1. We have implemented the algorithm in MATLAB. The code as well as a set of example data are included in Code 1, Ref. [21]. The overall flow chart of the proposed method is provided in Supplement 1.
3. THEORETICAL BASIS
When PQ is given exactly, the image inpainting problem is fundamentally the same as that of compressed sensing [22–25], and the theoretical results can be drawn accordingly. Specifically, the sparse curvelet transform coefficients Φx can be exactly recovered from the reduced measurement xQ using the above L1 minimization problem because the curvelet transform and the random sampling matrix PQ are incoherent [25]. However, in the proposed method, PQ is unknown and its estimation may be inaccurate, which contributes to the major source of reconstruction errors. While theoretical analysis of the error bound is challenging in such a blind scenario, we provide error bounds for the reconstruction in Supplement 1 when the location of the acquired region PQ is known.
It is also worth noting that although compressed sensing (CS)-STORM [11] also uses the concept of compressed sensing, the sensing matrix, the sparse signal to be recovered, and the measurements are completely different. In CS-STORM, compressed sensing is used to reconstruct the molecule localizations for a single camera frame, where the spatial distribution of active molecules is supposed to be sparse. In such case, the sensing matrix describes the convolution operation of the molecule distribution and the PSF. However, in our method, compressed sensing is used to reconstruct a high-density image from a low-density image synthesized using the localization results of multiple camera frames, where the high-density image can be sparsely represented in a certain transformation domain. The sensing matrix is thus a sampling operator denoting the known part of the image. Such difference makes CS-STORM and blind inpainting complementary to each other and thus can be combined to reduce the acquisition time even more.
4. RESULTS
A. Simulation Results
To validate and evaluate our blind inpainting method, we performed simulations using a numerical phantom image as the “ground-truth” specimen. The “true” image was 3072 × 3072 pixels, and the pixel size was 5 nm (nominal spatial resolution was 10 nm). The phantom consisted of 40 equally distributed Gaussian-shaped radial bars, each with a width of approximately 80 nm. The inner ends of these bars were uniformly located on a circle with a radius of 700 nm, which meant the minimum peak-to-peak distance of two adjacent bars was 110 nm. We simulated a localization list by randomly selecting some locations on the radial bars as the activated molecules and recording their coordinates and intensities for each camera frame. The two-dimensional activation density was set to 0.58 μm−2 as in CS-STORM [11]. No multiple activations of molecules were simulated. Because the list was directly obtained from the true image (instead of from diffraction-limited images using localization algorithms), there were no localization errors or background emission. Each location in the list was then projected onto the nearest pixel of an image with a given nominal resolution. Combining the lists from increasing numbers of frames, we synthesized images with increasing density, which described the fluorescence intensity of molecules on a grid. We applied our blind inpainting method on images from different numbers of frames at various nominal resolutions (twice that of the pixel size) in order to understand when the nominal resolution becomes the same as the Nyquist resolution and how many frames are needed for the proposed method to achieve a certain Nyquist resolution.
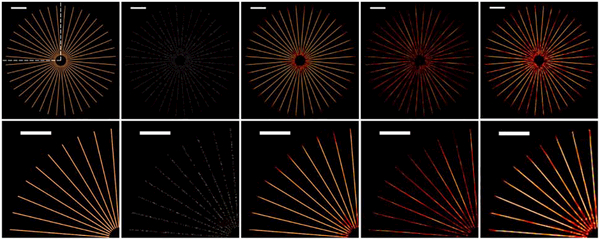
To understand the minimum number of frames needed for the proposed method to recover the structures in the phantom, we applied our blind inpainting algorithm on the low-density images synthesized from different numbers of frames at a nominal resolution (twice that of the pixel size) of 40 nm (see Fig. S3 in Supplement 1). The results in Fig. 2 show that in the case of 40 nm nominal resolution, the blind inpainting reconstruction from 400 frames (~9.3% fluorophores) is visually equivalent to the control high-density image from 4310 frames (100% fluorophores). Such a nominal resolution becomes about the same as the Nyquist resolution. We can thereby claim that blind inpainting needs as few as 400 frames to achieve a resolution of 40 nm.
Fig. 2.
Simulation results showing (from left to right) a high-density image from 4310 frames, a low-density image from 400 frames, blind inpainting reconstructions from 400 frames and 150 frames, all at 40 nm nominal resolution, and blind inpainting reconstruction from 150 frames but at 80 nm nominal resolution. Top: full field of view. Bottom: top-left region. Scale bars: 2 μm.
We also reduced the nominal resolutions with decreasing the number of frames such that the density in the blind inpainting image is high enough to meet the Nyquist criterion (i.e., the nominal resolution is equal to the Nyquist resolution; see Fig. S4 in Supplement 1). Figure 2 shows that at a nominal reconstruction of 40 nm, the blind inpainting image from 150 frames (~3.5% fluorophores) has a density too low to satisfy the Nyquist criterion, whereas at a nominal resolution of 80 nm, the density becomes sufficiently high such that the nominal resolution becomes the Nyquist resolution. Therefore, although the nominal resolution can be chosen to be arbitrarily high, the Nyquist resolution is limited by the labeling density—in this case, the capability of the blind inpainting algorithm to recover the unknown pixels. According to the theoretical results of sparse inpainting [24], when the measurement location is known exactly, the minimum number of known pixels required for exact recovery is proportional to the logarithm of the total number of pixels. Therefore, with smaller pixel size, the blind inpainting method requires more frames to recover the Nyquist-density image. As a rule of thumb, the pixel size is chosen to be half of the desired spatial resolution.
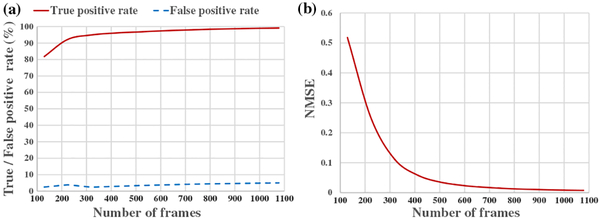
As a means of quantitative evaluation, we calculated the true positive rate and the false positive rate. The true positive rate was defined as the ratio between the number of nonzero pixels in the foreground region that were correctly recovered by blind inpainting and the number of those that were actually in the phantom. The false positive rate was defined as the ratio between the number of falsely recovered nonzero pixels that actually belonged to the background region and the number of those that were actually in the phantom. The true positive rate measures the capability of capturing and recognizing the true structures of the specimen. It can be regarded as the normalized localization density that affects the Nyquist spatial resolution. When the true positive rate reaches 100%, the reconstructed image reaches the Nyquist density and thus the nominal resolution becomes the Nyquist resolution. On the other hand, the false positive rate indicates the level of errors that false locations are generated outside the labeled structure. This type of error mainly occurs near the true molecule locations and thus may degrade the capability of resolving close-by structures. It needs to be low to ensure the structures are resolvable. Because of the randomness in generating the localization list, we performed 50 Monte Carlo simulations and calculated the average true positive rates and false positive rates for the reconstructions from different numbers of frames [Fig. 3(a)]. The true positive rate improves with increasing number of frames, while the false positive rate remains low (mostly below 5%) but not zero due to the errors in estimated PQ. With 400 frames, blind inpainting was able to achieve a true positive rate of 95%, suggesting only a 2.6% loss of Nyquist resolution compared to the nominal resolution. Because the ground truth is known for simulation, we also calculated the normalized mean square error (NMSE) as the number of frames increases, as shown in Fig. 3(b). It is seen that the major improvement occurs when the acquired number of frames increases from 3% to 10%.
Fig. 3.
Simulation results for the case of 40 nm nominal resolution.(a) Plots of true positive and false positive rates with respect to the number of frames. (b) Normalized mean square error curve with respect to the number of frames.
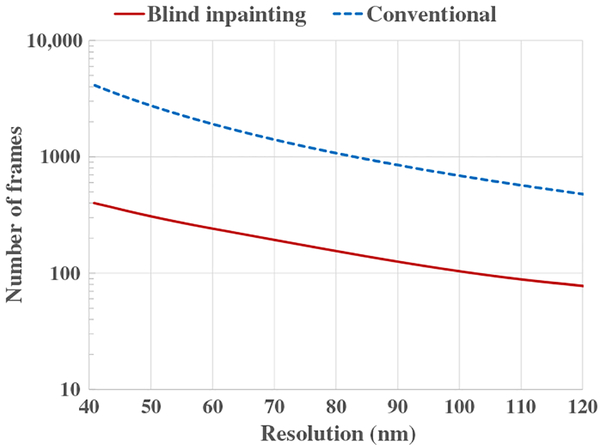
In order to examine how blind inpainting can improve the temporal resolution, we further estimated the required number of frames to achieve a certain Nyquist resolution, which was determined by the minimum number of frames for the blind inpainting reconstruction to reach above 95% in the true positive rate and below 5% in the false negative rate. The curves in Fig. 4 indicate that for Nyquist resolutions of 40 nm to 120 nm, blind inpainting allows a faithful reconstruction of superresolution images with around 10-fold reduction in the number of needed frames.
Fig. 4.
Simulation results. Minimum number of frames to achieve a given Nyquist resolution for the phantom simulation.
B. Experimental Results with Microtubules
We demonstrated the performance of blind inpainting in three sets of experimental microtubule STORM data.
1. Sample Preparation
Immunostaining was performed using BS-C-1 cells (American Type Culture Collection) cultured with Eagle’s Minimum Essential Medium supplemented with 10% fetal bovine serum, penicillin, and streptomycin and incubated at 37°C with 5% CO2. Cells were plated in LabTek 8-well coverglass chambers at ~20; 000 cells per well 18–24 h prior to fixation. The immunostaining procedure for microtubules consisted of fixation for 10 min with 3% paraformaldehyde and 0.1% glutaraldehyde in phosphate buffered saline (PBS), washing with PBS, reduction for 7 min with 0.1% sodium borohydride in PBS to reduce background fluorescence, washing with PBS, blocking and permeabilization for 20 min in PBS containing 3% bovine serum albumin and 0.5% (v/v) Triton X-100 [blocking buffer (BB)], staining for 40 min with a primary antibody [rat anti-tubulin (ab6160, Abcam) for tubulin or rabbit anti-TOM20 (sc-11415, Santa Cruz) for mitochondria] diluted in BB to a concentration of 2 μg/mL, washing with PBS containing 0.2% bovine serum albumin and 0.1% (v/v) Triton X-100 (washing buffer, WB), incubation for 30 min with secondary donkey anti-rat antibodies (~1 − 2 Alexa 647 dyes per antibody) at a concentration of ~2.5 μg∕mL in BB, washing with WB and sequentially with PBS, postfixation for 10 min with 3% paraformaldehyde and 0.1% glutaraldehyde in PBS, and finally washing with PBS.
2. Imaging Setup
Microtubule imaging was performed on an inverted microscope (Nikon Eclipse Ti-U) configured for either total internal reflection fluorescence or oblique incidence excitation. The microscope utilized a 100×, 1.45 NA oil-immersion objective lens (Nikon 100×, 1.45 NA). Activation of the Alexa 647 dye was provided by a 405 nm solid-state laser (CUBE, Coherent) and excitation of the activated dye molecules was provided by a 647 nm solid-state laser (MPB). A 660 nm long-pass dichroic mirror (Z660DCXRU, Chroma) was used to reflect the 405 nm and 647 nm lasers, and the transmitted fluorescence light was passed through a 700/75 emission filter (ET700/75m, Chroma). Fluorescent images were recorded on an electron-multiplying CCD camera (iXon897, Andor).
All imaging was performed in a solution that contained 100 mM Tris (pH 8.0), an oxygen scavenging system[0.5 mg/mL glucose oxidase (Sigma-Aldrich), 40 μg/mL catalase (Roche or Sigma-Aldrich), and 5% (w/v) glucose] and 143 mM beta mercaptoethanol. For 647 nm illumination, an intensity of 2 kW∕cm2 was used. Under this illumination condition, all dye molecules are typically in the fluorescent state initially but rapidly switch to a dark state. All STORM movies were recorded at a frame rate of 60 Hz using home-written Python-based data acquisition software. The movie recording was started once the majority of the dye molecules were switched off and individual fluorescent molecules were clearly discernible. The movies typically consisted of 30,000–100,000 frames. During each movie, a 405 nm laser light (ramped between 0.1 and 2 W∕cm2) was used to activate fluorophores and to maintain a roughly constant density of activated molecules. In STORM imaging of in vitro microtubules, a weak 561 nm laser (~20 W∕cm2) was used to illuminate fiducial markers.
3. Reconstruction Results
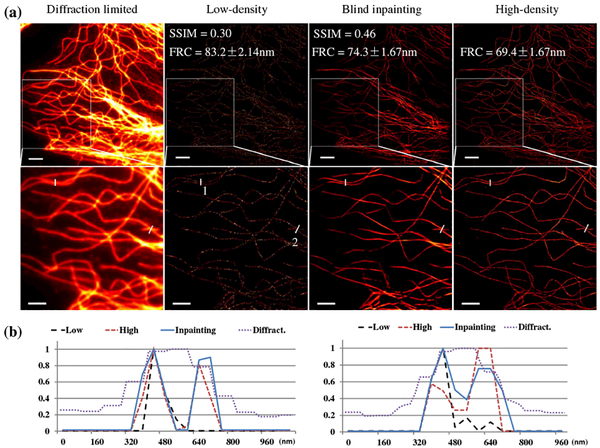
The fluorophore list of fixed microtubules obtained by STORM was converted to a subdiffraction image with a pixel size of 53 nm. For the first dataset, a total of 34,000 camera frames were acquired and the subdiffraction image using all camera frames provided a high-density image that was regarded as a reference for comparison. Blind inpainting was used to recover a Nyquist-density image from a low-density image with much fewer frames. As noted earlier, the high-density image provided as the reference is not the ground truth of the reconstruction; the ground truth is not available in real experiments. Therefore, the NMSE with the reference image is not a proper metric for quantitative evaluation of the reconstruction anymore, as the pixel value difference can be large even for a perfect reconstruction. Instead, we used the mean structural similarity (SSIM) index [26] between the reconstruction and reference as a metric to evaluate the capability of the reconstruction in capturing the structural information in the reference. In addition, the Fourier ring correlation (FRC) [27] was also used to estimate the image resolution. It splits the image into two subsets and computes their correlation in the Fourier domain, and it takes both localization precision and localization density into account without the need for any prior information on the ground truth. Figure 5 shows the image generated by blind inpainting using only 400 frames. The reconstructed image preserves the subdiffraction superresolving capability of the reference high-density image while significantly improving the localization density as compared to the low-density image. In Fig. 5, the larger average SSIM index of the inpainting image than that of the low-density image indicates higher similarities to the reference high-density image. The FRC resolution of inpainting image is comparable to high-density image, which also indicates the proposed method preserves the resolving capabilities. The transversal profiles of adjacent tubulins [Fig. 5(b)] indicate that the spatial resolution of the blind inpainting reconstruction is comparable to that of the high-density image. Note that the images and curves were normalized respectively for better visualization.
Fig. 5.
Results from real microtubule STORM data. (a) Images of the full field of view (top) and a selected region of interest (ROI, bottom). From left to right: diffraction-limited image, low-density STORM image using 400 frames, blind inpainting reconstruction from the 400 frame image, and high-density STORM image taken using 34,000 frames, respectively. Scale bars: 2.5 μm. Pixel size: 53 nm. (b) Line profiles of two segments indicated by the white lines in (a), left for segment 1 and right for segment2. Low: low-density image. High: high-density image. Inpainting: blind inpainting reconstruction. Diffract.: diffraction-limited image.
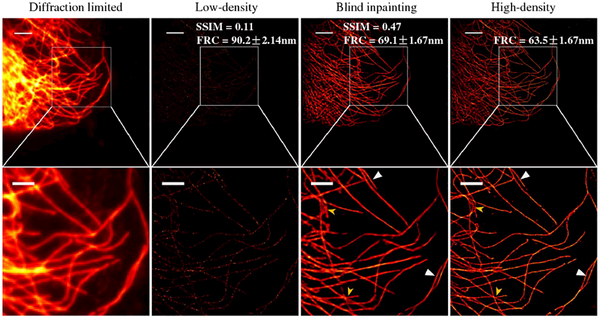
Figure 6 shows the results for another set of microtubule data where a total number of 36,000 camera frames were acquired. The same blind inpainting procedure was followed, and the reconstructed image using only 300 frames was compared against the reference high-density image from 36,000 frames. Blind inpainting had already resolved most close-by fine structures. The high SSIM index of the blind inpainting result indicated high similarities to the reference high-density image, in contrast to the low SSIM of the low-density image. The FRC resolution of the inpainting image is also close to the high-density image. For adjacent tubulins with a relatively large distances, the subdiffractive resolving capability was well preserved (indicated by white arrows) by blind inpainting, whereas dense or close-by features could not be resolved as well as by the high-density reference (indicated by yellow arrows) due to the errors in estimated PQ. Results for a third set of microtubule data can be found in Fig. S5 in Supplement 1.
Fig. 6.
Results from a second set of real microtubule STORM data showing images of the full field of view (top) and selected ROI (bottom). From left to right: diffraction-limited image, low-density STORM image using 300 frames, blind inpainting reconstruction from the 300 frame image, and high-density STORM image using 36,000 frames, respectively. Scale bars: 2.5 μm. Pixel size: 53 nm.
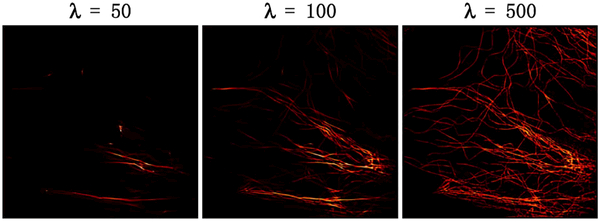
Figure 7 demonstrates how the weight parameter λ in Eq. (2) affects the results. Small λ enforces image sparsity in the curvelet domain, which suppresses the noise and disturbances. However, the areas with low regional localization density can be suppressed as well. Consequently, the reconstruction loses a lot of information. Large λ enforces data consistency but lacks the capability of suppressing the background disturbances, so the reconstruction looks “noisy.” The result of λ 500 balances the resolution and visual effects. The same phenomenon can be observed in other datasets as well. Thus, we adopt λ = 500 as the default value in this paper.
Fig. 7.
Effect of λ on a real STORM dataset. The results of λ = 50 and 100 are seen to lose structural information, while that of λ = 500 maintains the resolution and structure when suppressing noise.
C. Experimental Results with Actin
We also applied blind inpainting on single-molecule data of actin, which is more challenging due to the denser structures.
1. Sample Preparation
To prepare the sample, COS-7 cells were washed in PBS twice, fixed, and permeabilized using 0.3% glutaraldehyde and 0.25% Triton X-100 in a cytoskeleton buffer (CB: 10 mM MES pH 6.1, 150 mM NaCl, 5 mM EGTA, 5 mM glucose, and 5 mM MgCl2) for 2 min in the first step, followed by the second fixation step using 2% glutaraldehyde in CB for 10 min. To reduce the background, they were reduced by 0.1% NaBH4 in PBS for 7 min. Following washing with PBS for 1 hr, they were incubated with ~0.5 μM of Alexa 647-phalloidin at 4°C overnight and briefly washed once with PBS right before STORM imaging.
2. Imaging Setup
Actin imaging was performed on a dual-objective microscope. Briefly, the sample was mounted between two opposing objective lenses (Olympus Super Apochromat UPLSAPO 100×, oil immersion, NA 1.40) by combining the 2D translation stage with a 1D translation stage for 3D control of the sample position. Alexa 647 dyes were excited using the 647 nm line from a Kr/Ar mixed gas laser (Innova 70C Spectrum, Coherent) and activated using the 405 nm solid-state laser (CUBE 405–50C, Coherent). Fluorescence from Alexa647 collected by the two objectives were filtered separately with two 647 nm notch filters (Semrock NF01–543/647) and then imaged on two different areas of the same EMCCD camera (Andor iXon DU-897) at a frame rate of 60 Hz using two pairs of relay lenses. The two split movies from the two objectives were analyzed separately, and after mapping the localizations from the second movie to the coordinates of the first movie, the final image was reconstructed by determining each localization as a weighted average of the coordinates from each movie.
3. Reconstruction Results
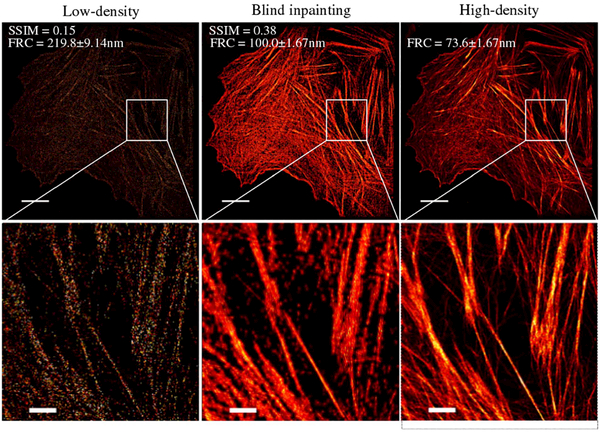
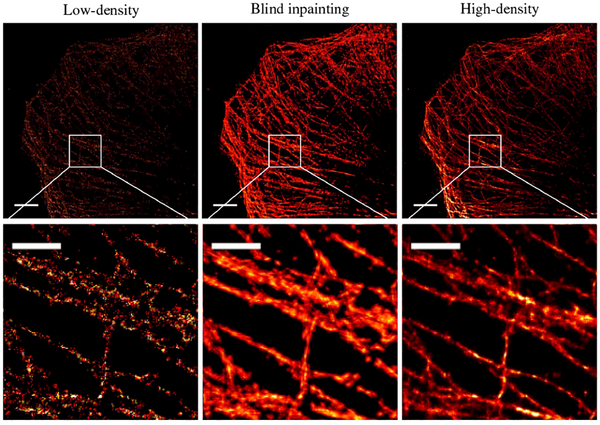
We converted the fluorophore list to a subdiffraction image with a pixel size of 35 nm for actin data. A reference high-density image was generated with 115,000 frames. With as few as 1000 frames, blind inpainting was able to largely recover the structures that are unrecognizable in the low-density image (Fig. 8). The high SSIM index of the inpainting image also indicates high similarities to the high-density image when compared to the low-density image. The FRC resolution of the inpainting image is slightly worse but still comparable to the high-density image. However, some fine features in the high-density STORM image were not yet recapitulated well in the inpainting image because the sparse inpainting model adapts to the dominant high-contrast structures while treating the activations from low-contrast structures as background noise.
Fig. 8.
Results from real actin STORM data showing images of the full field of view (top) and selected ROI (bottom). See Fig. S6 in Supplement 1 for other ROIs. From left to right: low-density STORM image using 1000 frames, blind inpainting reconstruction from the 1000 frame image, and high-density STORM image using 115,000 frames, respectively. Scale bars: 1.25 μm. Pixel size: 35 nm.
D. Experimental Results of Integrating with Existing Fast SMLM Methods
Finally, we applied blind inpainting on a set of single-molecule data of microtubules analyzed by the compressed sensing algorithm [11,16]. The compressed sensing data were published in Ref. [16]. Subdiffraction images with a pixel size of 40 nm were generated from the fluorophore list. The inpainting images from 50 frames recapitulated the features that are separated by a relatively large distance (with respect to the feature size), whereas some close-by features could not be resolved in the inpainting image as well as in the 5000 frame reference image (Fig. 9). This is because the low-density image from CS-STORM has relatively low quality, resulting in inaccurate estimation for the location of the missing data and thus poor image quality for inpainting.
Fig. 9.
Results from real CS-STORM data showing images of the full field of view (top) and selected ROI (bottom). From left to right: low-density STORM image using 50 frames, blind inpainting reconstruction from the 50 frame image, and high-density STORM image using 5000 frames, respectively. Scale bars: 2 μm. Pixel size: 40 nm.
5. CONCLUSION
The above results have proven that blind inpainting is able to recapture the microtubule structures using up to one hundredth of the frames typically needed in STORM, suggesting a potential one to two orders of magnitude of reduction in acquisition time. Results from the actin data have also shown promising potential for time reduction. It is worth noting that a higher reduction in frame number was observed for blind inpainting in experiments than in simulations. While simulation results indicate a reduction factor around 10% (which conforms to the results in the image inpainting field), experimental results demonstrate even higher acceleration rates up to 100-fold. The difference mainly comes from two aspects. On one hand, a single fluorophore may be activated several times and thus generate the same localizations, which is redundant in the inpainting framework. On the other hand, when the pixel size is larger than the spacing between two adjacent fluorophores, several localizations may be projected onto the same pixel, leading to another kind of redundancy. Besides, one may expect to improve the image contrast by accumulating more frames. In conjunction with the existing fast SMLM approaches (e.g., high-density activation such as compressed sensing), blind inpainting can offer further improvement in acquisition time. Although we have only analyzed 2D data, our method can also be applicable to 3D data by employing a 3D sparsifying transform. Moreover, the proposed method can also reduce the time required for scanning-based imaging techniques, such as confocal, two-photon, and stimulated emission depletion microscopy. To make the proposed method better preserve fine features in a variety of cell structures and experimental conditions, future work will improve the accuracy of the PQ estimation in the presence of background noise and will extend the inpainting model to be adaptive to features of different fineness and shapes. While challenging, future work will also investigate some theoretical results on the number of required frames.
Supplementary Material
Acknowledgment.
We thank Zeyu Yu for computing the FRC of the images. Authors L. Y. and S. J. are partly supported by the NSF. Author X. Z. is supported by NIH and HHMI Investigator.
Funding. National Science Foundation (NSF) (CBET-1604531, CBET-1604565); Howard Hughes Medical Institute (HHMI); National Institutes of Health (NIH); Defense Advanced Research Projects Agency (DARPA) (D16AP00108); National Institute of General Medical Sciences (NIGMS) (1R35GM12484601).
Footnotes
See Supplement 1 for supporting content.
REFERENCES
- 1.Rust MJ, Bates M, and Zhuang X, “Sub-diffraction-limit imaging by stochastic optical reconstruction microscopy (STORM),” Nat. Methods 3, 793–796 (2006). [DOI] [PMC free article] [PubMed] [Google Scholar]
- 2.Betzig E, Patterson GH, Sougrat R, Lindwasser OW, Olenych S,Bonifacino JS, Davidson MW, Lippincott-Schwartz J, and Hess HF, “Imaging intracellular fluorescent proteins at nanometer resolution,” Science 313, 1642–1645 (2006). [DOI] [PubMed] [Google Scholar]
- 3.Hess ST, Girirajan TPK, and Mason MD, “Ultra-high resolution imaging by fluorescence photoactivation localization microscopy,” Biophys. J 91, 4258–4272 (2006). [DOI] [PMC free article] [PubMed] [Google Scholar]
- 4.Huang B, Babcock H, and Zhuang X, “Breaking the diffraction barrier: superresolution imaging of cells,” Cell 143, 1047–1058 (2010). [DOI] [PMC free article] [PubMed] [Google Scholar]
- 5.Shannon CE, “Communication in the presence of noise,” Proc. IRE 37, 10–21 (1949). [Google Scholar]
- 6.Shroff H, Galbraith CG, Galbraith JA, and Betzig E, “Live-cell photo-activated localization microscopy of nanoscale adhesion dynamics,” Nat. Methods 5, 417–423 (2008). [DOI] [PMC free article] [PubMed] [Google Scholar]
- 7.Jones SA, Shim SH, He J, and Zhuang X, “Fast, three-dimensional super-resolution imaging of live cell,” Nat. Methods 8, 499–505 (2011). [DOI] [PMC free article] [PubMed] [Google Scholar]
- 8.Huang F, Hartwich TMP, Rivera-Molina FE, Lin Y, Duim WC, Long JJ, Uchil PD, Myers JR, Baird MA, Mothes W, Davidson MW,Toomre D, and Bewersdorf J, “Video-rate nanoscopy using sCMOS camera-specific single-molecule localization algorithms,” Nat. Methods 10, 653–658 (2013). [DOI] [PMC free article] [PubMed] [Google Scholar]
- 9.Holden SJ, Uphoff S, and Kapanidis AN, “DAOSTORM: an algorithm for high-density super-resolution microscopy,” Nat. Methods 8, 279–280 (2011). [DOI] [PubMed] [Google Scholar]
- 10.Quan T, Zhu H, Liu X, Liu Y, Ding J, Zeng S, and Huang Z-L, “High-density localization of active molecules using structured sparse model and Bayesian information criterion,” Opt. Express 19, 16963–16974 (2011). [DOI] [PubMed] [Google Scholar]
- 11.Zhu L, Zhang W, Elnatan D, and Huang B, “Faster STORM using compressed sensing,” Nat. Methods 9, 721–723 (2012). [DOI] [PMC free article] [PubMed] [Google Scholar]
- 12.Mukamel EA, Babcock H, and Zhuang X, “Statistical deconvolution for superresolution fluorescence microscopy,” Biophys. J 102, 2391–2400 (2012). [DOI] [PMC free article] [PubMed] [Google Scholar]
- 13.Huang F, Schwartz SL, Byars JM, and Lidke KA, “Simultaneous multiple-emitter fitting for single molecule super-resolution imaging,” Biomed. Opt. Express 2, 1377–1393 (2011). [DOI] [PMC free article] [PubMed] [Google Scholar]
- 14.Babcock H, Sigal YM, and Zhuang X, “A high-density 3D localization algorithm for stochastic optical reconstruction microscopy,” Opt. Nanoscopy 1, 6 (2012). [DOI] [PMC free article] [PubMed] [Google Scholar]
- 15.Cox S, Rosten E, Monypenny J, Jovanovic-Talisman T, Burnette DT,Lippincott-Schwartz J, Jones GE, and Heintzmann R, “Bayesian localization microscopy reveals nanoscale podosome dynamics,” Nat. Methods 9, 195–200 (2012). [DOI] [PMC free article] [PubMed] [Google Scholar]
- 16.Babcock HP, Moffitt JR, Cao Y, and Zhuang X, “Fast compressed sensing analysis for super-resolution imaging using L1-homotopy,” Opt. Express 21, 28583–28596 (2013). [DOI] [PMC free article] [PubMed] [Google Scholar]
- 17.Elad M, Starck JL, Querre P, and Donoho DL, “Simultaneous cartoon and texture image inpainting using morphological component analysis (MCA),” Appl. Comput. Harmonic Anal 19, 340–358 (2005). [Google Scholar]
- 18.Fadili MJ, Starck JL, and Murtagh F, “Inpainting and zooming using sparse representations,” Comput. J 52, 64–79 (2009). [Google Scholar]
- 19.Candès E, Demanet L, Donoho DL, and Ying L, “Fast discrete curvelet transforms,” Multiscale Model. Simul 5, 861–899 (2006). [Google Scholar]
- 20.Boyd S, Parikh N, Chu E, Peleato B, and Eckstein J, “Distributed optimization and statistical learning via the alternating direction method of multipliers,” Found. Trends Mach. Learn 3, 1–122 (2011). [Google Scholar]
- 21.The implementation of the proposed algorithm and the data to generate Fig. 1, 10.6084/m9.figshare.5229943. [DOI]
- 22.Candès EJ, Romberg JK, and Tao T, “Robust uncertainty principles: exact signal reconstruction from highly incomplete frequency information,” IEEE Trans. Inf. Theory 52, 489–509 (2006). [Google Scholar]
- 23.Donoho DL, “Compressed sensing,” IEEE Trans. Inf. Theory 52, 1289–1306 (2006). [Google Scholar]
- 24.Candès E and Tao T, “Near-optimal signal recovery from random projections: universal encoding strategies?” IEEE Trans. Inform. Theory 52, 5406–5425 (2006). [Google Scholar]
- 25.Candès EJ and Wakin M, “An introduction to compressive sampling,” IEEE Signal Process. Mag 25(2), 21–30 (2008). [Google Scholar]
- 26.Wang Z, Bovik AC, Sheikh HR, and Simoncelli EP, “Image quality assessment: from error visibility to structural similarity,” IEEE Trans. Image Process 13, 600–612 (2004). [DOI] [PubMed] [Google Scholar]
- 27.Nieuwenhuizen RPJ, Lidke KA, Bates M, Puig DL, Grünwald D,Stallinga S, and Rieger B, “Measuring image resolution in optical nanoscopy,” Nat. Methods 10, 557–562 (2013). [DOI] [PMC free article] [PubMed] [Google Scholar]
Associated Data
This section collects any data citations, data availability statements, or supplementary materials included in this article.


