Abstract
Global ecosystem function is highly dependent on climate and atmospheric composition, yet ecosystem responses to environmental changes remain uncertain. Cold, high-latitude ecosystems in particular have experienced rapid warming1, with poorly understood consequences2–4. Here, we use a satellite observed proxy for vegetation cover – the fraction of absorbed photosynthetically active radiation5 – to identify a decline in the temperature limitation of vegetation in global ecosystems between 1982 and 2012. We quantify the spatial functional response of maximum annual vegetation cover to temperature and show that the observed temporal decline in temperature limitation is consistent with expectations based on observed recent warming. An ensemble of Earth system models from the Coupled Model Intercomparison Project (CMIP5) mischaracterized the functional response to temperature, leading to a large overestimation of vegetation cover in cold regions. We identify a 16.4% decline in the area of vegetated land that is limited by temperature over the past three decades, and suggest an expected large decline in temperature limitation under future warming scenarios. This rapid observed and expected decline in temperature limitation highlights the need for an improved understanding of other limitations to vegetation growth in cold regions3,4,6, such as soil characteristics, species migration, recruitment, establishment, competition, and community dynamics.
Keywords: Vegetation cover, high-latitudes, arctic, ecosystem, functional response, Tibetan plateau, temperature limitation, plant growth
Main
A global increase in green vegetation has been observed over recent decades7,8 and widely attributed to both direct and indirect anthropogenic influences, primarily elevated atmospheric CO2, but also to changes in climate, nitrogen deposition, and land use change 8–11. The global greening has contributed to changes in biophysical feedbacks such as evapotranspiration and albedo12, along with an increased terrestrial carbon sink13, which together have served to slow the rate of global warming2. Uncertainties remain, however, regarding the drivers of the reported greening, and their spatial variation, and thus the likelihood of continued greening.
Ecosystems in cold regions in particular have exhibited rapid increases in green vegetation 3,7. Plot scale evidence suggests a link to warming4,6, but direct attribution of observed regional trends to environmental changes has been elusive. Regional studies have relied on multi-factorial simulation experiments with global vegetation models8,11,14. But vegetation models are known to perform poorly for high-latitude and cold-limited ecosystems15–17, overestimating both the extent of green vegetation and the trend in recent decades17. Model results suggest a role of climate change and CO2 in the observed greening trend8,10,11,14,18, but direct attribution is hindered by model spread and uncertainty14.
Here, we develop a data-based approach19,20, using three decades of remotely sensed estimates of the fraction of absorbed photosynthetically active radiation (fAPAR), a proxy for productive foliage cover21, to characterize the relationship between maximum annual foliage cover (Fmax) and the summer warmth index (SWI5, the sum of the monthly mean temperatures above 5°C). We use the approach, which was previously developed for water limited ecosystems19,20, to identify the spatial distribution of ecosystems in which Fmax is limited by temperature, and thus to track changes in temperature limitation over time. By estimating the temperature sensitivity of Fmax () using spatial gradients, and comparing with expected changes in Fmax due to observed changes in temperatures, we show a long-term increase in foliage cover that is consistent with the expected influence of recent warming. The observed greening occurred together with a large decline in the spatial extent of temperature limitation over recent decades, in particular for northern high-latitude ecosystems. Finally, we use an ensemble of global Earth System Models (ESMs) from the recent Coupled Model Intercomparison Project (CMIP5) to examine the impact of future projected temperature changes on the spatial extent of temperature limitation, and to assess ESM skill in estimating the sensitivity of maximum foliage cover to changes in temperature.
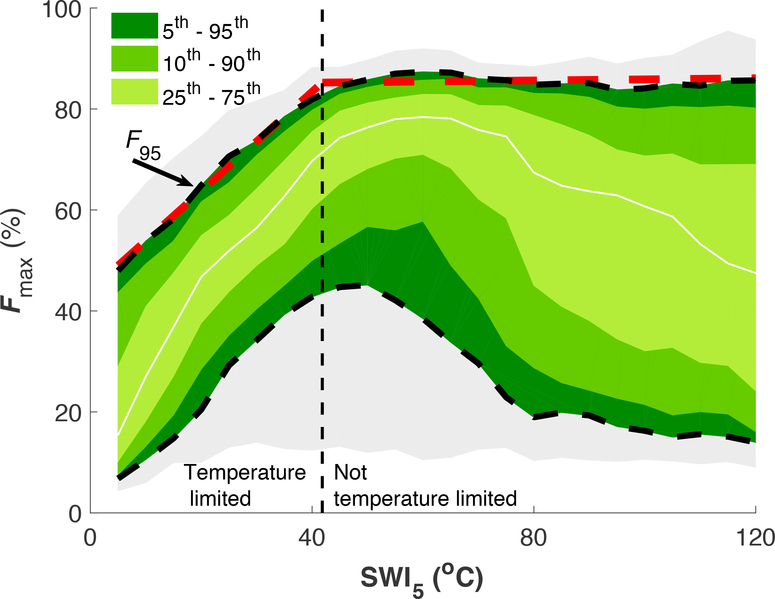
Our functional responses analysis of global satellite observations from the Global Inventory Modeling and Mapping Studies (GIMMS3g5) shows the spatial dependence of vegetation cover on temperature (Fig. 1), with low maximum foliage cover in colder regions (low SWI5) and high maximum foliage cover in warmer regions. We examined the 95th percentile of the distribution of annual Fmax (F95, %), which characterizes the maximum Fmax attained globally for a given annual SWI5. We delineated the regions where temperature strongly affected Fmax, and found it depended linearly on SWI5 under colder conditions (Fig. 1). The slope of the F95 edge quantifies the temperature sensitivity of Fmax (, % °), and the temperature at saturation (SWI5 = 43.2 ± 1.36 °C, mean ± st. dev.) delineates the region where Fmax is limited by temperature (Fig. 1, Fig. S1).
Fig. 1 |. The spatial relationship between temperature and vegetation cover.
Spatial relationship between the summer warmth index (SWI5, °C) and the annual maximum fraction of absorbed photosynthetically active radiation (Fmax, %), for the three-year period from 1982–1984. The 95th percentile of the distribution of Fmax (F95) in each 5°C bin represents the maximum attainable Fmax for a given annual SWI5 (black dashed line). A breakpoint regression applied to the 95th percentile approximates the sensitivity of Fmax to spatial changes in SWI5 (red dashed line), and delineates regions where Fmax is temperature limited and those that are not, as either below or above the breakpoint (vertical dashed line).
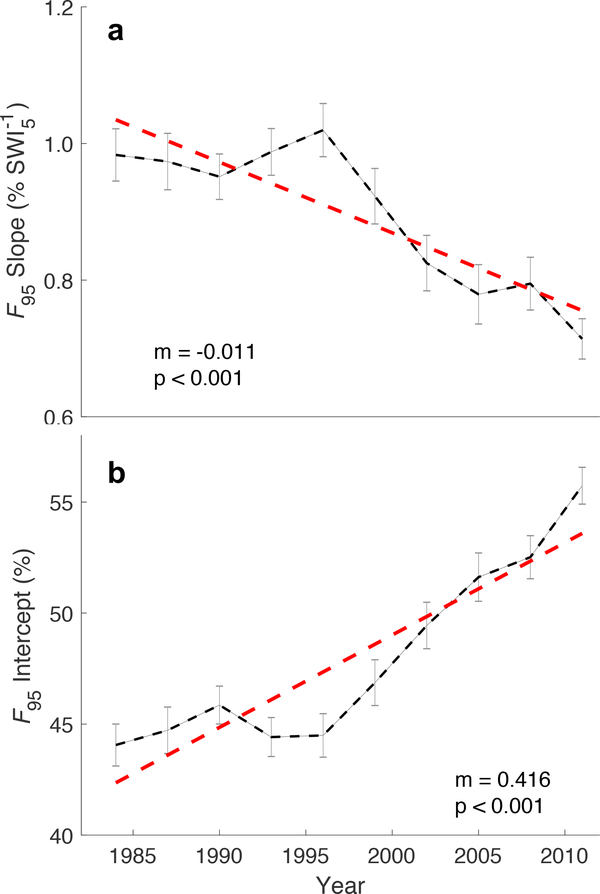
We examined changes in the slope and intercept of F95 during the GIMMS3g observational record (1982–2012) and found both an increasing intercept (4.16 ± 1.47 % decade−1, mean ± 95% CI) and a declining slope (−0.10 ± 0.05 % decade−1) (Fig. 2) for F95 relative to the baseline SWI5 from 1982–1984. An increasing intercept indicates an increase in F95 in regions that were temperature limited at the start of the measurement record, with a 26.5 ± 1.9% increase in F95 in the most temperature limited regions (Fig. 2, Fig. S2). A decreasing slope implies that regions that were more temperature limited at the start of the observational record are greening faster than regions that were less temperature limited. The changes in the relationship between Fmax and SWI5 in temperature-limited regions are consistent with accelerated warming in colder regions1 and could indicate a change in temperature limitation over time.
Fig. 2 |. Changes in temperature limitation.
a, The slope of the relationship between 95th percentile (F95) of the maximum annual fraction of absorbed photosynthetically active radiation (Fmax) and the summer warmth index (SWI5). b, The intercept of the relationship between F95 and SWI5. Error bars represent 95% confidence intervals. The red dashed lines show fitted linear regressions, with slope m (a, % °SWI5−1 yr−1; b, % yr−1) and statistical significance p.
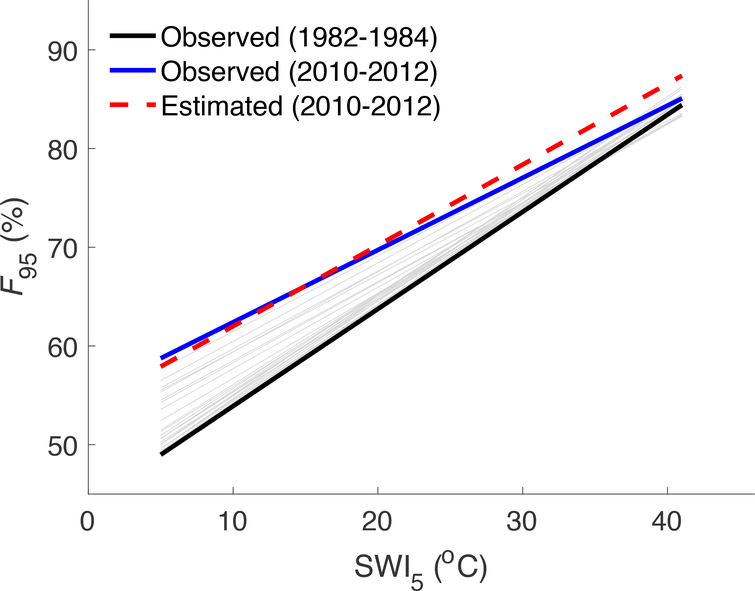
We used a space for time substitution to examine whether the observed changes in Fmax in temperature-limited regions are consistent with observed long-term (1982–2012) changes in temperature. To do so, we predicted the expected change in F95 (F95 = I + SWI5), where I and are estimated as the intercept and slope of the relationship between F95 and SWI5 from the start of the observational record (1982–1984), and SWI5 is temporally dynamic throughout the observational record. The change in F95 over time, predicted based on temporally-static spatial changes in F95, was statistically equivalent to the observed long-term change (p < 0.01, Chow test, Fig. 3). Observed temperature changes implied a somewhat lower increase in F95 in the most temperature-limited regions (19.12 ± 2.27%, Fig. 3), but with a smaller decline in the F95 slope over time than observed. The concordance of the observed and expected change in F95 suggests that the observed long-term increase in Fmax is consistent with a response to long-term warming, though other factors such as CO2 fertilization and nitrogen deposition could also play a role.
Fig. 3 |. Observed and predicted changes in F95.
Each solid line represents the observed F95 for a specific three-year period, starting from 1982–1984 (black) and ending in 2010–2012 (blue). Gray lines show F95 for intermediate three-year periods. The red dashed line represents the predicted temporal change in F95 based on the observed spatial sensitivity to SWI5 and observed long-term changes in SWI5.
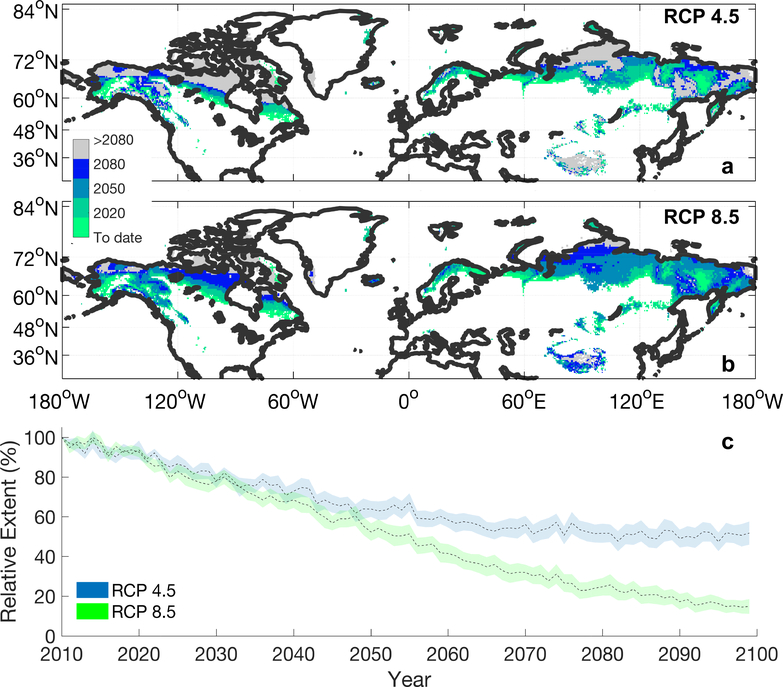
Ecosystems below the temperature limitation threshold in the relationship between F95 and SWI5 (Fig. 1) represented 19.87 ± 0.67% of the total vegetated area of the extra-tropical northern latitudes at the start of the measurement record (1982–1984), and are primarily located at high-latitudes and on the Tibetan Plateau (Fig. 4). Our results indicate that the spatial extent of temperature limitation of Fmax has declined by 16.35 ± 0.64% over the observational record. The release from temperature limitations was largely experienced at the southern edge of high-latitude ecosystems. We estimate 45% and 85% reductions in the temperature-limited area by 2100 for CMIP5 ensemble warming projections under Representative Concentration Pathway (RCP) 4.5 and RCP8.5, respectively (Fig. 4).
Fig. 4 |. Current and predicted changes in the relative spatial extent of temperature limited area of vegetated land.
Shaded areas in a and b represent areas where Fmax indicated temperature limitation at the start of the observational record (1982–1986) but did not by the corresponding year. Bright green areas represent the change in the observational record to 2010, and other shades represent projected changes based on temperature projections from the CMIP5 models under RCP 4.5 (a) and RCP 8.5 (b). The proportion of vegetated areas that are temperature limited over time is shown in c, relative to the extent of vegetated areas that were temperature limited at the end of the measurement record (2010–2012), for the mean (dashed lines) and standard error (shaded areas) of an ensemble of 10 ESMs (Table S1) from the CMIP5 ensemble under RCP 4.5 (blue) and RCP 8.5 (green).
By focusing on the 95th percentile, the space for time substitution utilized here minimizes the influence of other limitations to growth19,20, thus allowing for the identification of the independent temperature sensitivity. In reality, however, multiple factors limit maximum vegetation cover in cold regions, including nutrient availability, rooting depth, permafrost dynamics, and soil moisture. We estimate that 44% of the vegetated land surface identified as temperature-limited is primarily temperature-limited, defined as being within ±10% of the potential Fmax (Fig. S3, S4). This proportion suggests that the vegetation cover response to warming of the remaining 56% will likely be mediated by other factors. Indeed, the mean long-term increase in maximum vegetation cover for vegetated areas that are primarily temperature-limited was 1.48 ± 0.05 % decade−1 (mean ± std. error), whereas vegetated areas limited by both temperature and other factors had smaller increases of 0.8 ± 0.03 % decade−1. The predicted declines in the temperature-limited area therefore do not necessarily translate into a uniform increase in vegetation cover. For instance, warming also extends the growing season length, which may lead to earlier snow-melt, increase peak season water stress, and thus reduce vegetation cover22. In addition, the space for time approach inherently assumes a climate-vegetation equilibrium, which may lead to overestimated rates of change due to the inability of species range shifts to keep pace with warming23,24. Finally, we note that long-term satellite records are subject to uncertainty related to orbital effects and platform changes, though such issues are expected to be lower at high latitudes25.
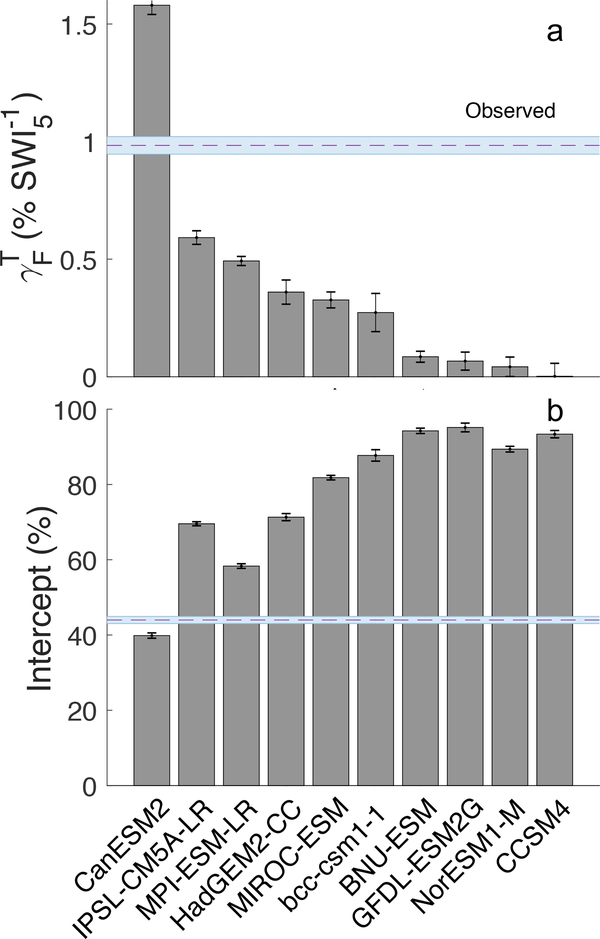
The temperature sensitivity of F95 in the examined CMIP5 ESMs spanned a large range (Fig. 5), from a positive of 1.56 (% ) in the Canadian Earth System model (CanESM2), to a relatively flat temperature sensitivity in the CCSM4 and NorESM models, which both use the CLM4 land surface model (Table S1), and are the only models to include an explicit nitrogen cycle. On average, the models underestimated the observed by 63.53 ± 50.8% (mean, standard deviation), with only CanESM2 giving a temperature sensitivity larger than that observed. The underestimated sensitivity was reflected in an overestimated F95 at low temperatures (Fig. 5b, Fig. S5) of 77.48 ± 41.45%. The overestimated F95 and underestimated in the CMIP5 models are consistent with, and shed light on, previous reports that vegetation cover is consistently overestimated at high latitudes in CMIP5 models15,16 and dynamic vegetation models17. Combined with reports of a persistent underestimation of photosynthetic capacity at high latitudes in terrestrial biosphere models26, these results suggest that models of cold limited ecosystems need improvement, and call into question their utility for attribution8,14. Our results provide a benchmark for model development, though further analysis is needed to identify the responsible processes that govern the relationship between temperature and vegetation cover.
Fig. 5 |. Earth System Model (ESM) estimates of the relationship between maximum vegetation cover and temperature.
The sensitivity () was estimated as the slope of the relationship of the 95th percentile (F95) of maximum modeled fAPAR (Fmax) and the summer warmth index (SWI5) based on ESM modeled temperatures. The observed and intercept (horizontal bars) were estimated from the relationship between GIMMS3g Fmax observations and CRU monthly temperatures. The dashed blue line represents the mean observed value.The shaded blue area and model error bars represent the standard deviation about the mean. Model details are provided in Table S1, and individual model functional responses are presented in Fig. S5.
The greening of the Earth is a widespread phenomenon, one that models have primarily attributed to changes in atmospheric CO2 and climate8,11. Here we use direct observations to isolate the functional response of vegetation cover to temperature in temperature-limited regions and report an observed greening consistent with the effect of long-term temperature changes. The identified temperature sensitivity shows that growing season warmth is a dominant factor for vegetation production in cold regions, confirming previous reports of temperature controls on both spatial and temporal vegetation dynamics27–29. Our analysis also suggests a large reduction in ecosystem temperature limitation under future warming, though other limitations will likely play a large role in mediating the extent to which high-latitude ecosystems green. For example, arctic tundra soils are nutrient poor and, through stoichiometric requirements, impose limits on potential biomass, although mineralization of previous frozen soil N may30 or may not31 offset those limitations. Similarly, the waterlogged soils of extensive northern wetlands are unsuitable for dense vegetation, regardless of the temperature limitation. Other limitations include the limited ability of species to migrate and adapt to the distinct environmental conditions of high-latitude ecosystems23,24. Current models need to accurately reproduce the effect of temperature on vegetation cover. That said, the expected release from temperature limitation under future warming highlights the importance of non-temperature limitations in mediating ecosystem responses to future climate change.
Methods
Satellite data
We used estimates of the fraction of absorbed photosynthetically active radiation (fAPAR) from the Global Inventory Modelling and Mapping Studies third-generation fAPAR data product (GIMMS3g5), available for the period 1982–2012. The data set is provided biweekly at 0.083° spatial resolution and was regridded to match the spatial resolution of the climate data. Maximum annual fAPAR (Fmax) was calculated as the maximum recorded value during each year. fAPAR is closely related to the photosynthetic activity of plants, and therefore constitutes an indicator of the presence and productivity of live vegetation.
Climatic variables
Monthly fields of air temperature at a 0.5° spatial resolution were obtained from the Climate Research Unit (CRU) high-resolution gridded datasets version 3.2432. The monthly mean air temperature values were converted to annual values of summer warmth by summing all monthly temperature values above a baseline of 5 °C (SWI5). This approach is designed to account for changes in temperatures that effect vegetation growth, whilst minimizing changes in temperatures that are too low to influence vegetation. Using a base temperature of 0 °C (SWI0) led to the inclusion of low temperature and low fAPAR pixels that were relatively insensitive to temperature change, but did not affect the overall results (Fig. S6).
Breakpoint regression analysis
Three-year running mean Fmax values were binned according to their corresponding temperature values for 5° temperature bins19,20. For each bin, the upper and lower 95th, 90th and 75th percentiles were determined for each running mean block. Breakpoint regression was applied to the 95th percentile values (F95) using multi-phase linear regression. We estimated uncertainties of fit parameters through Monte Carlo simulations of zero-mean deviates based on the Cholesky decomposition of the covariance matrix. The regression of the 95th percentile of Fmax represents the maximum Fmax attainable for a given SWI5, thus minimizing the influence of other factors, such as precipitation or aridity, on the derived responses (Fig. S8). The breakpoint of the regression identifies the region where the vegetation–temperature relationship plateaus and vegetation ceases to be temperature-limited. Note that the breakpoint temperature was relatively insensitive to the percentile used (Fig S7). We constructed time series of the slopes and intercepts of the breakpoint regression and determined linear trends for both variables, using changes in the Fmax - SWI5 relationship but keeping SWI5 fixed to that experienced in the first three-year window of the observational record (1982–1984). As running means were used to construct the time series, non-independent running mean blocks were removed before determining the strength and significance of trends.
CMIP5 simulations
We analyzed output from 10 Coupled Model Intercomparison Project Phase 5 (CMIP5) coupled carbon-climate models (Table S1) obtained from the Program for Climate Model Diagnosis and Inter-comparison (PCMDI) Earth System Grid (ESG) (http://pcmdi9.llnl.gov/esgf-web-fe/)). The land components of these ESMs differ in their representations of vegetation types, soil properties, human disturbances, and carbon and nitrogen pools. We used model output of leaf area and air temperature at native spatial resolution, and converted to the fraction of absorbed photosynthetically active radiation using the standard conversion of Beer’s law, which accounts for the exponential decline in absorbed radiation with increasing leaf area. Values of Fmax, F95 and SWI5 were calculated through a functional response analysis as with the remote sensing observations. We used historical simulations (1980–1990) for the comparison of spatial responses of Fmax to SWI5, and projections of future monthly temperatures from 2010 to 2100 under two representative concentration pathways (RCPs), 4.5 and 8.5.
Data Availability
The data that support the findings of this study are publicly available. The satellite fAPAR data are hosted on NASA NEX (see instructions at http://sites.bu.edu/cliveg/datacodes/). The CMIP5 simulation outputs are available from the Program for Climate Model Diagnosis and Inter-comparison (PCMDI) Earth System Grid (ESG) (http://pcmdi9.llnl.gov/esgf-web-fe/). The climate data used (CRU3.24) can be downloaded from https://crudata.uea.ac.uk/cru/data/hrg/. All code is available from the corresponding author upon request.
Supplementary Material
Acknowledgements
The authors are very grateful to the University of East Anglia Climate Research Unit for providing the climate data used in this study, the CMIP5 project and the Earth System Grid Federation for making Earth System model simulations publicly available, and the Vegetation Remote Sensing and Climate Research group at Boston University for making the satellite fAPAR data available. TFK acknowledges support from the NASA Terrestrial Ecology Program IDS Award NNH17AE86I. TFK and WJR were supported by the Director, Office of Science, Office of Biological and Environmental Research of the US Department of Energy under Contract DE-AC02–05CH11231 as part of the Rubisco SFA. We thank Margaret Torn for discussions on the interpretation and implication of results, and Anna Ukkola and I. Colin Prentice for early methodological discussions.
Footnotes
Competing Financial Interests statement
The authors declare no competing financial interests.
References
- 1.Pithan F & Mauritsen T Arctic amplification dominated by temperature feedbacks in contemporary climate models. Nat. Geosci 7, 181–184 (2014). [Google Scholar]
- 2.Zeng Z et al. Climate mitigation from vegetation biophysical feedbacks during the past three decades. Nat. Clim. Chang 7, 432–436 (2017). [Google Scholar]
- 3.Epstein HE et al. Dynamics of aboveground phytomass of the circumpolar Arctic tundra during the past three decades. Environ. Res. Lett 7, 015506 (2012). [Google Scholar]
- 4.Elmendorf SC et al. Plot-scale evidence of tundra vegetation change and links to recent summer warming. Nat. Clim. Chang 2, 453–457 (2012). [Google Scholar]
- 5.Zhu Z et al. Global Data Sets of Vegetation Leaf Area Index (LAI)3g and Fraction of Photosynthetically Active Radiation (FPAR)3g Derived from Global Inventory Modeling and Mapping Studies (GIMMS) Normalized Difference Vegetation Index (NDVI3g) for the Period 1981 to 2. Remote Sens. 5, 927–948 (2013). [Google Scholar]
- 6.Myers-Smith IH et al. Climate sensitivity of shrub growth across the tundra biome. Nat. Clim. Chang 5, 887–891 (2015). [Google Scholar]
- 7.Myneni RB et al. Increased plant growth in the northern high latitudes from 1981 to 1991. Nature 386, 698–702 (1997). [Google Scholar]
- 8.Zhu Z et al. Greening of the Earth and its drivers. Nat. Clim. Chang 6, 791–795 (2016). [Google Scholar]
- 9.de Jong R, de Bruin S, de Wit A, Schaepman ME & Dent DL Analysis of monotonic greening and browning trends from global NDVI time-series. Remote Sens. Environ 115, 692–702 (2011). [Google Scholar]
- 10.Los SO Analysis of trends in fused AVHRR and MODIS NDVI data for 1982–2006: Indication for a CO2 fertilization effect in global vegetation. Global Biogeochem. Cycles 27, 318–330 (2013). [Google Scholar]
- 11.Mao J et al. Human-induced greening of the northern extratropical land surface. Nat. Clim. Chang 6, 959–963 (2016). [Google Scholar]
- 12.Forzieri G, Alkama R, Miralles DG & Cescatti A Satellites reveal contrasting responses of regional climate to the widespread greening of Earth. Science (80-. ). 356, 1180–1184 (2017). [DOI] [PubMed] [Google Scholar]
- 13.Keenan TF et al. Recent pause in the growth rate of atmospheric CO2 due to enhanced terrestrial carbon uptake. Nat. Commun 7, 13428 (2016). [DOI] [PMC free article] [PubMed] [Google Scholar]
- 14.Zhu Z et al. Attribution of seasonal leaf area index trends in the northern latitudes with ‘optimally’ integrated ecosystem models. Global Change Biology 1–16 (2017). doi: 10.1111/gcb.13723 [DOI] [PubMed] [Google Scholar]
- 15.Anav A et al. Evaluation of land surface models in reproducing satellite derived leaf area index over the high-latitude northern hemisphere. Part II: Earth system models. Remote Sens. 5, 3637–3661 (2013). [Google Scholar]
- 16.Mahowald N et al. Projections of leaf area index in earth system models. Earth Syst. Dyn. 7, 211–229 (2016). [Google Scholar]
- 17.Murray-Tortarolo G et al. Evaluation of land surface models in reproducing satellite-derived LAI over the high-latitude northern hemisphere. Part I: Uncoupled DGVMs. Remote Sens. 5, 4819–4838 (2013). [Google Scholar]
- 18.Le Quéré C et al. Global Carbon Budget 2016. Earth Syst. Sci. Data 8, 605–649 (2016). [Google Scholar]
- 19.Ukkola AM et al. Reduced streamflow in water-stressed climates consistent with CO2 effects on vegetation. Nat. Clim. Chang 6, 75–78 (2015). [Google Scholar]
- 20.Donohue RJ, Roderick ML, McVicar TR & Farquhar GD Impact of CO2 fertilization on maximum foliage cover across the globe’s warm, arid environments. Geophys. Res. Lett 40, 3031–3035 (2013). [Google Scholar]
- 21.Myneni RB & Williams DL On the relationship between FAPAR and NDVI. Remote Sens. Environ 49, 200–211 (1994). [Google Scholar]
- 22.Barichivich J et al. Temperature and snow-mediated moisture controls of summer photosynthetic activity in northern terrestrial ecosystems between 1982 and 2011. Remote Sens. 6, 1390–1431 (2014). [Google Scholar]
- 23.Huang M et al. Velocity of change in vegetation productivity over northern high latitudes. Nat. Ecol. Evol 1, 1649–1654 (2017). [DOI] [PubMed] [Google Scholar]
- 24.Burrows MT et al. Geographical limits to species-range shifts are suggested by climate velocity. Nature 507, 492–495 (2014). [DOI] [PubMed] [Google Scholar]
- 25.Tian F et al. Evaluating temporal consistency of long-term global NDVI datasets for trend analysis. Remote Sens. Environ 163, 326–340 (2015). [Google Scholar]
- 26.Rogers A et al. Terrestrial biosphere models underestimate photosynthetic capacity and CO 2 assimilation in the Arctic. 25, (2017). [DOI] [PubMed] [Google Scholar]
- 27.Arft AM et al. Responses of tundra plants to experimental warming: a meta-analysis of the International Tundra Experiment. Ecol. Monogr 69, 491–511 (1999). [Google Scholar]
- 28.Jia GJ, Epstein HE & Walker DA Spatial heterogeneity of tundra vegetation response to recent temperature changes. Glob. Chang. Biol 12, 42–55 (2006). [Google Scholar]
- 29.Bhatt US et al. Changing seasonality of panarctic tundra vegetation in relationship to climatic variables. Environ. Res. Lett 12, (2017). [Google Scholar]
- 30.Mekonnen ZA, Riley WJ & Grant RF 21st century tundra shrubification could enhance net carbon uptake of North America Arctic tundra under an RCP8.5 climate trajectory. Environ. Res. Lett 13, 054029 (2018). [Google Scholar]
- 31.Koven CD, Lawrence DM & Riley WJ Permafrost carbon−climate feedback is sensitive to deep soil carbon decomposability but not deep soil nitrogen dynamics. Proc. Natl. Acad. Sci 201415123 (2015). doi: 10.1073/pnas.1415123112 [DOI] [PMC free article] [PubMed] [Google Scholar]
- 32.Harris I, Jones PD, Osborn TJ & Lister DH Updated high-resolution grids of monthly climatic observations - the CRU TS3.10 Dataset. Int. J. Climatol 34, 623–642 (2014) [Google Scholar]
Associated Data
This section collects any data citations, data availability statements, or supplementary materials included in this article.
Supplementary Materials
Data Availability Statement
The data that support the findings of this study are publicly available. The satellite fAPAR data are hosted on NASA NEX (see instructions at http://sites.bu.edu/cliveg/datacodes/). The CMIP5 simulation outputs are available from the Program for Climate Model Diagnosis and Inter-comparison (PCMDI) Earth System Grid (ESG) (http://pcmdi9.llnl.gov/esgf-web-fe/). The climate data used (CRU3.24) can be downloaded from https://crudata.uea.ac.uk/cru/data/hrg/. All code is available from the corresponding author upon request.


