Abstract
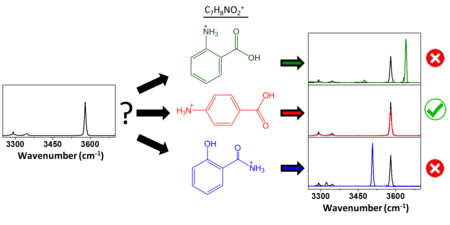
Vibrational ion spectroscopy techniques coupled with mass spectrometry are applied to standard metabolites as a proof-of-principle demonstration for the structural identification of unknown metabolites. The traditional room temperature infrared multiple photon dissociation (IRMPD) spectroscopy technique is shown to differentiate chemical moieties in isobaric and isomeric variants. These results are compared to infrared spectra of cryogenically cooled analyte ions, showing enhanced spectral resolution, and thus also improved differentiation between closely related molecules, such as isomers. The cryogenic spectroscopy is effected in a recently developed mass-selective cryogenic linear ion trap, which is capable of high sensitivity and the ability to measure the IR spectra of multiple analytes simultaneously.
Keywords: Infrared multiple-photon dissociation spectroscopy, Cryogenic ion spectroscopy, Isomeric metabolites, Mass spectrometry
Graphical abstract
Introduction
Metabolomics involves the study of small molecules (metabolites) that are products or bi-products of cellular processes.1 Such studies range from the screening of endogenous and exogenous metabolites in humans, to the study of primary and secondary metabolites in plants.2–4 Many of these processes reveal unknown metabolites, in which multiple techniques have been employed for identification and characterization, the most common of which are nuclear magnetic resonance (NMR) and liquid chromatography tandem mass spectrometry (LC-MS/MS).5 Both techniques have strengths and weaknesses: NMR is the gold standard in terms of molecular identification, but low sensitivity makes it difficult to probe low-abundance features in biological samples; conversely, LC-MS/MS has excellent sensitivity, but the identification is generally limited to previously cataloged MS/MS spectra in databases.6,7
A key constraint of traditional mass spectrometry approaches is the limited detailed structural information (e.g. 3D structure, positional isomers, bond chirality, etc.) from these measurements. This, however, can be overcome in more advanced methodologies that provide more structural information on the ions, notably ion mobility mass spectrometry and ion spectroscopy. Vibrational spectroscopy in particular provides ample structural information on the chemical structures of analytes.
Due to the low number densities of ions in a mass spectrometer, direct absorption is a very challenging experiment. Conversely, action, or consequence, spectroscopy techniques allow the infrared spectra of ions within a mass spectrometer to be measured readily. Such techniques rely on the measurement of parameters other than direct absorption, such as the appearance of fragment ions, which effectively involves a change in mass-to-charge. Infrared multiple photon dissociation (IRMPD) spectroscopy is an action spectroscopy scheme that relies on the resonant absorption of multiple photons to induce cleavages of covalent bonds.8,9 As with traditional vibrational spectroscopy, the absorption of photons is dependent on the molecular structures of the ion. When an ion absorbs a photon, the energy is distributed throughout the ion by a process called intramolecular vibrational redistribution (IVR). Each time the ion absorbs a photon, the ion’s internal energy increases. Eventually, the dissociation threshold is reached, where the ion fragments, a response detected by the mass spectrometer.
IRMPD spectra generally exhibit broad vibrational bands, which are the result of the methodology that is employed. As room-temperature ions are photodissociated, an ensemble of dynamic structures are probed. In addition, the multiple-photon nature of the process further broadens vibrational features, due to anharmonic redshifting and broadening effects. The limited spectral resolution of IRMPD spectroscopy may limit the usefulness of the technique in distinguishing closely-related analytes, notably isomers.
Infrared photodissociation (IRPD) spectroscopy at cryogenic temperatures typically offers enhanced resolution compared to IRMPD spectroscopy at room temperature. At cryogenic temperatures (e.g., 10–50 K), the molecular structures are less dynamic, and a smaller sub-set of more defined structures may be generated, resulting in narrower absorption spectra. Moreover, depending on the spectroscopic scheme, the cryogenic experiments are often carried out in a single-photon regime, and are thus not subject to anharmonic broadening effects. In infrared predissociation spectroscopy10–12, which is also known as the messenger13 technique or tagging14 spectroscopy, an inert gas molecule that is generally transparent to IR light, such as molecular N215 or H210 condenses onto the collisionally cooled ions, leading to a change in the mass-to-charge ratio of the precursor complex (e.g. +28 m/z for N2 tag). A tunable IR light source is then scanned, and upon resonant absorption of a single photon, the tag is detached from the tagged complex. The single-photon nature of this process makes the technique a linear spectroscopy method, and thus facilitates comparison to computed absorption spectra of putative structures from quantum-chemical approaches. Moreover, the loss of the tag is the same for all analytes, and is thus completely predictable in mass, in contrast to IRMPD of the analyte ion. The advantage for tagging spectroscopy is that in principle multiple ions can be tagged and probed by IR spectroscopy simultaneously (if their masses do not overlap).16,17
Recent studies have illustrated the power of IR and IR-UV ion spectroscopy as bioanalytical tools for small molecule analysis.18–25 Moreover, at least for cryogenic single-photon spectroscopy, benchtop light sources can now cover the entire 600–4000 cm−1 range for spectroscopic interrogation. Nonetheless, many improvements in instrumentation and methodology are required to make the technique truly analytically viable.16 Key parameters that need to be addressed are sensitivity and duty cycle of the experiment. We have recently shown the operation of the first mass-selective cryogenic linear ion trap for the purpose of recording cryogenic infrared spectra of analytes.17 This trap is compatible with low concentration analytes, as well as the ability to multiplex the infrared ion spectroscopy experiment. The setup is implemented here to provide a proof-of-principle demonstration for the potential of infrared ion spectroscopy, and in particular cryogenic infrared spectroscopy, in the differentiation of isobaric and isomeric metabolites.
Experimental and Methods
Sample Preparation
All compounds were purchased from Sigma Aldrich (St. Louis, MO). The samples for IRMPD spectroscopy were diluted to concentrations of 10−5 to 10−6M using 70:29:1 MeOH:H2O:HCOOH The samples for IRPD spectroscopy were diluted to 10−5M – 10−7M using 99:1 acetonitrile(ACN): FA except for tryptophan which was diluted to 10−5M using 70:29:1 MeOH:H2O:FA. Prior to being loaded into the syringe, the samples were centrifuged for 5 mins at 3000rpms to remove any fine particles.
Mass Spectrometry Instrumentation & Operation
The IRMPD spectra were recorded on a previously described custom quadrupole mass filter-quadrupole ion trap-time of flight (QMF-QIT-ToF) mass spectrometer.26 Ions were generated in an electrospray ionization (ESI) source (Analytica, Branford, CT) equipped with a heated metal capillary to aid desolvation, and an rf ion funnel to increase ion transmission. Ions were first accumulated in a hexapole and then pulsed through an ion bender, where the packet was deflected 90⁰ into a QMF for mass selection. The ion packet was then deflected 90⁰ by a second ion bender, through an RF guide and then trapped by a QIT equipped with a pulse valve for gas-assisted trapping. Due to the slightly harsher nature of trapping in a QIT, the ion may fragment via collisions with the pulsed helium buffer gas. In order to provide a background free experiment, the RF on the ring electrode is ramped up, ejecting the low mass fragments. After a pump down delay (100 ms), the ions were irradiated with the tunable output from an optical parametric oscillator/amplifer (OPO/A) (LaserVision, Bellevue, WA) pumped by a Surelite III, unseeded 1064 nm Nd:YAG laser (Continuum, San Jose CA) to induce IRMPD. A shutter, controlled by a delay generator (Stanford Research Systems, Sunnyvale, CA), allowed a single pulse from the OPO/A to irradiate the ions. The remaining precursor and photofragment ions were then pulsed into a time-of-flight for mass analysis.
For the IRPD experiments, the ions were generated in the same ion source described above, but were directed to a custom extension equipped with a cryogenic linear ion trap (cryoLIT), as described in a recent publication.17 For solvent-tagged ions, care was taken to make the source conditions gentle in order to maximize ion signal on solvent-tagged ions (e.g. acetonitrile – ACN). These solvent-tagged ions were generated using a relatively cool ESI source (i.e., metal capillary at 100⁰C). The hexapole was now operated as an ion guide, and at the second ion bender (after the QMF), the ions passed straight to an accumulation trap. The accumulated ions were then pulsed through a series of Einzel lenses for focusing and into the cryoLIT, where they were collisionally cooled to cryogenic temperatures (and tagged in the case of N2-tagged protonated tryptophan). The tagged ions were mass isolated using a stored waveform inverse Fourier transform (SWIFT)27 waveform generated via an arbitrary waveform generator. Lastly, the tagged ions were irradiated with an OPO pulse at a particular wavelength, and were radially ejected to a conversion dynode-electron multiplier for detection. This experiment was repeated at different OPO wavelengths. All data acquisition was under control of a custom LabView™ software.
Infrared Action Spectroscopy
Figure 1 illustrates how IRMPD and IRPD spectroscopy are implemented with mass spectrometry for the example of protonated tyramine. Figure 1A depicts the IRMPD spectrum of 4-hydroxyphenylacetaldehyde (tyramine) with the raw mass spectra from the ToF for three specific points on the spectra. At some IR frequencies, no photodissociation is observed (e.g. 3390 cm−1), whereas at other frequencies (e.g. 3350 cm−1) extensive dissociation is seen. The basic premise upon which IRMPD spectroscopy rests is that the ion absorbs multiple photons at a specific frequency due to resonant absorption from a vibrational mode, causing cleavage of covalent bonds (e.g. loss of H2O and CO2 here). The IRMPD spectrum is obtained by plotting the photodissociation yield as a function of the light source frequency. As the photodissociation yield is a measure of the number of photons that are absorbed, the IRMPD spectrum is an indirect measure of the absorption spectrum of the ion, even if the non-linear nature of multiple-photon absorption can complicate this analysis.
Figure 1:
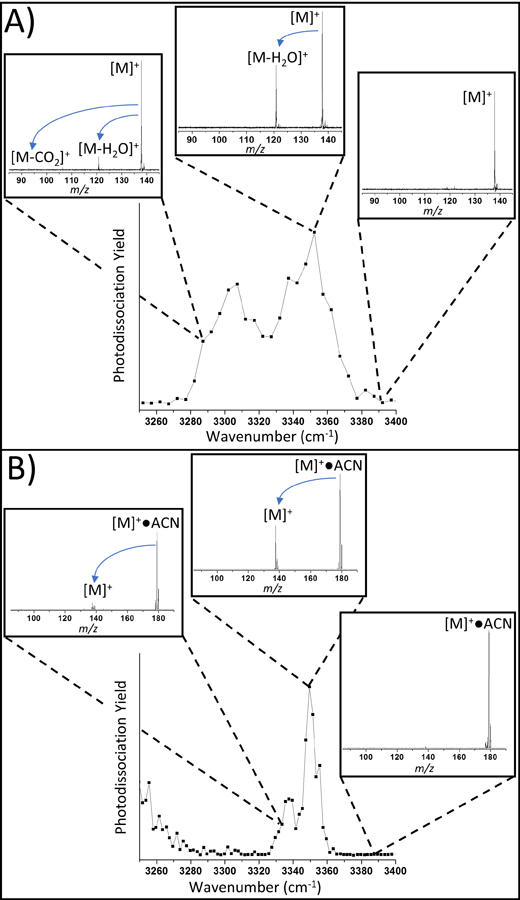
Comparison of IR “action” spectra for protonated tyramine (Top) IRMPD and (Bottom) IRPD for tyramine●ACN. Insets show raw mass spectra at several irradiation frequencies.
Figure 1B depicts the IRPD spectrum of the same analyte tagged with acetonitrile (ACN). Upon resonant absorption, the tag, in this case ACN, is knocked off, causing the mass of the bare molecular ion to appear. Once again, there is a strong wavelength dependence in terms of photodissociation yield, and the IRPD spectrum is an indirect measure of the absorption spectrum of the tagged analyte ion. Both IRMPD and IRPD spectroscopy have the advantage of a background-free photodissociation scheme, which is advantageous when there is random fluctuation in the ion intensity from the ion source. Nonetheless, it is also apparent that the cryogenic IRPD spectra have much narrower IR bands.
The photodissociation yields for both IRMPD and IRPD experiments are expressed through the following equations:
| Eq 1 |
| Eq 2 |
Computational Analysis
Calculated structures of protonated tyramine and 2-phenyl-1-ethanolamine were generated with chemical intuition in Gabedit 2.4.8.28 Gaussian 09 was then utilized to perform DFT calculations for energy optimizations and IR frequencies for each conformation at the B3LYP/cc-pVTZ level of theory. All spectra were broadened with a Gaussian linewidth fwhm (full-width half-maximum) = 10 cm−1 and scaled by 0.960 for more facile comparison with experimental data.
Results and Discussion
Functional Group Identifier
Vibrational ion spectroscopy can be a useful technique to distinguish between different chemical moieties via diagnostic vibrational modes. For example, sulfotyrosine-containing peptides that have an SO-H vibrational mode at ~3590cm−1 can be distinguished from phosphotyrosine-containing peptides that exhibit a PO-H vibrational mode at ~3670cm-1.29 Similar trends were seen for carbohydrates, where the respective sulfate (3595 cm−1) and phosphate (3666cm−1) bands were observed.30
Here, this method is applied to smaller, isobaric metabolites such as taurine (m/z 126.02), a semi-essential amino acid and metabolite found in mammalian tissues,31 and 2-aminoethylphosphonic acid (2-AEP or Ciliatine) (m/z 126.03), which has also been detected in human organ tissue.32 Both the room temperature IRMPD and cryogenic IRPD infrared spectra for these isobars are displayed in Figure 2. It is quite clear that the SO-H and PO-H modes are readily distinguishable, both by IRMPD and IRPD. As summarized in Table 1, the SO-H stretch is red shifted by about 75 cm−1 compared to the PO-H stretch. It is striking how narrow the IRPD bands are compared to the respective IRMPD bands (i.e., FWHMIRPD = 5 cm−1 vs. FWHMIRMPD = 25 cm−1), which increases the molecular specificity of the measurement. There are also visible N-H modes for both molecules, but the high chemical similarities of the amine groups yield less marked differences. Finally, we notice several prominent C-H stretching modes in the IRPD spectrum of taurine, which are not visible in the IRMPD spectrum. The more challenging detection of C-H stretching modes in IRMPD results from the generally weak absorbances of these modes, coupled with the lower energy per photon in the multiple-photon dissociation scheme.
Figure 2:
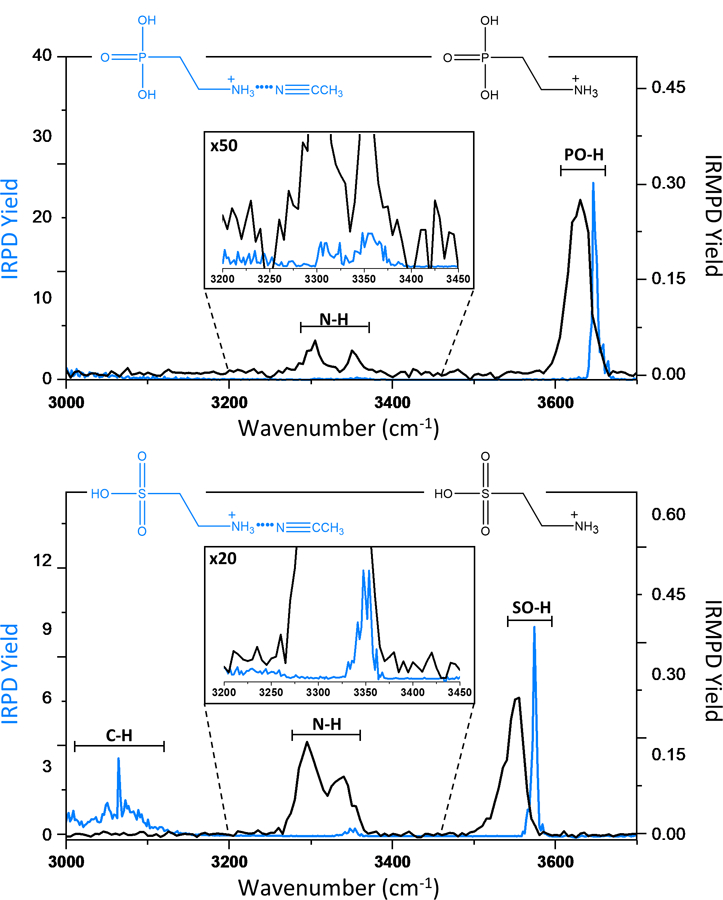
(Top) The IRPD spectrum of 2-AEP●ACN (blue) compared to the IRMPD spectrum of the 2-AEP bare ion (black). (Bottom) The IRPD spectrum of taurine●ACN (blue) compared to the IRMPD spectrum of the taurine bare ion (black).
Table 1:
Experimental IRMPD and IRPD band positions for taurine and 2-aminoethylphosphonic acid.
| Compound | IRMPD | IRPD | ||
|---|---|---|---|---|
| Band Position/cm−1
(FWHM) |
Vibrational mode |
Band Position/cm−1
(FWHM) |
Vibrational mode |
|
| Taurine | 3550 (25) | S-OH | 3574(5) | S-OH |
| 3334 (29) 3298(37) |
NH3+ | 3350(13.6) | NH3+ | |
| 2-AEP | 3628(30) | P-OH | 3648(7) | P-OH |
| 3352(14) 3303(19) |
NH3+ | 3357(19) 3314(29) |
NH3+ | |
Isomeric Structure Identification
While vibrational spectroscopy is inherently powerful in elucidating functional groups, the differentiation of isomeric compounds is analytically more challenging, and is an especially prominent problem in mass spectrometry. Sometimes, the differences in IR spectra are exclusively due to conformational differences between isomers, and a comparison to theoretical calculations is required to assign vibrational modes and confirm specific conformations. Figure 3 depicts IRMPD spectra on the isomeric metabolites, 2-phenyl-1-ethanolamine (2P1EA) and tyramine, along with their calculated vibrational absorption spectra. At first glance, it appears that the two IRMPD spectra have many overlapping features, but a detailed analysis (see Table 2) reveals some subtler differences in peak positions and peak shapes. The broad doublet (3660cm−1 and 3645 cm−1) for 2P1EA in the O-H stretching region is reproducible, whereas tyramine only has the one O-H stretch at 3642cm-1. There are also some differences in the 3100–3300cm−1 N-H stretching region, where the IRMPD spectrum of 2P1EA has a peak at 3242 (probably the symmetric N-H stretching mode) which appears more redshifted for tyramine at 3128cm-1. It should be noted that these differences, while minor, are reproducible (see for instance Fig S1 in the Supplementary Information). Nonetheless, the poor resolution of these spectral features is not ideal in terms of differentiating a large number of isomers.
Figure 3:
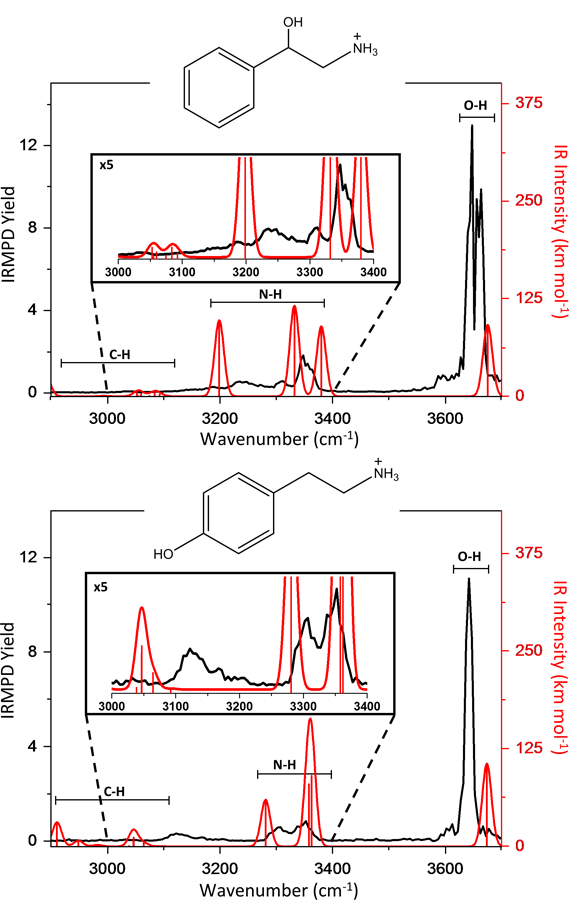
(Top) IRMPD spectrum of 2P1EA (black) compared to the computed IR spectrum of 2P1EA bare ion (red). (Bottom) IRMPD spectrum of tyramine (black) compared to the computed IR spectrum of tyramine bare ion (red).
Table 2:
Experimental IRMPD and IRPD band positions for 2-phenyl-1-ethanolamine and tyramine compared to computed band positions.
| 2P1EA IRMPD | 2P1EA B3LYP/cc-pVTZ (scaling factor 0.960)39 |
2P1EA IRPD | |||
|---|---|---|---|---|---|
|
Band
Position/cm−1 (FWHM) |
Vibrational
mode |
Band
Position/cm−1 |
Vibrational
mode |
Band
Position/cm−1 (FWHM) |
Vibrational
mode |
| 3660 (15) 3645 (12) |
OH | 3675 | OH | 3659 (5) | OH |
| 3351 (28) 3310 (17) 3242 (34) |
NH3+ | 3380 3332 3199 |
NH3+ | 3305 (30) 3263 (8) 3219 (10) |
NH3+ |
| - | - | 3093 3084 3075 3060 3055 2994 2892 |
CH | 3096 (20) 3046 (19) 2989 (30) |
CH |
| Tyramine IRMPD |
Tyramine
B3LYP/cc- pVTZ (scaling factor 0.960) |
Tyramine IRPD | |||
| 3642 (14) | OH | 3674 | OH | 3646 (7) | OH |
| 3346 (35) 3305 (37) 3128 (37) |
NH3+ | 3362 3358 3281 |
NH3+ | 3350 (9) 3337 (9) 3187 (13) |
NH3+ |
| - | - | 3092 3064 3047 3046 3038 2983 2949 2910 |
CH | 3045 (10) 3013 (19) 2975 (29) 2931 (28) |
CH |
Figure 4 shows the cryogenic IRPD spectra for the same isomers, 2P1EA and tyramine, using the solvent tag acetonitrile (ACN). The higher spectral resolution allows a separation of most of the vibrational features. For instance, the O-H modes between the isomers are separated by 15cm-1. Furthermore, there are several peaks in the N-H and C-H regions that allow for a much clearer differentiation between the isomers compared to the respective IRMPD spectra. It should be noted that the spectral resolution in these cryogenic IRPD spectra does depend on the temperature of the cryoLIT, and that colder temperatures result in narrower spectral features (see Fig S2 in the Supplementary Information).
Figure 4:
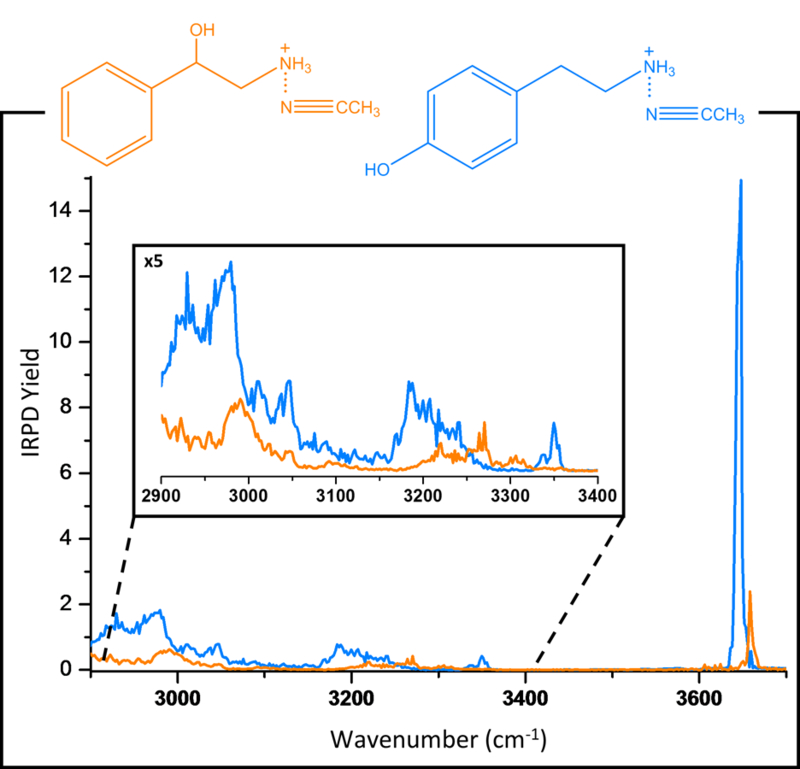
Comparison of IRPD spectra of 2P1EA●ACN (orange) and tyramine●ACN (blue) at a trap temperature of 16.4K.
Apart from narrower IR spectral features, another key advantage of tagging spectroscopy is the ability to measure the IR spectra of multiple analytes in the same measurement. This is illustrated in Figure 5, where the mass isolated ACN-tagged analytes taurine and p-aminobenzoic acid are probed simultaneously. Each IRPD mass channels is clearly distinguishable, selectively showing the diagnostic vibrations of these analytes.
Figure 5:
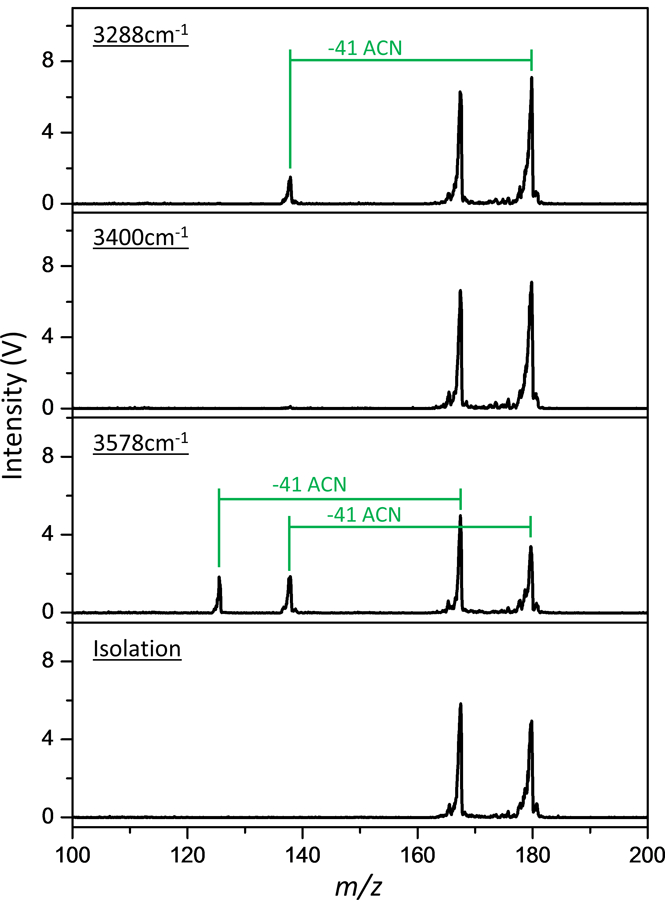
Raw mass spectra of mass isolated taurine●ACN (m/z 167) and PABA●ACN (m/z 179), following irradiation at various IR frequencies.
The real challenge is to apply IR spectroscopy to multiple isomers with subtle differences in structures. Figure 6 contains the cryogenic IRPD spectra for a set of five isomeric metabolites: p-aminobenzoic acid (PABA), m-aminobenzoic acid (MABA), o-aminobenzoic acid (OABA), salicylamide, and 3-pyridylacetic acid (3-PAA). From a structural point of view, PABA, MABA, and OABA are all positional isomers and all but salicylamide contain a carboxylic acid. The peak positions and assignments are summarized in Table 3. It is interesting then that there are noticeable differences in the O-H band positions for almost all of these isomers with the exception of PABA and MABA. In fact, PABA and MABA have very similar spectra, except for a slight shift in peak position for their asymmetric NH3+ modes, and some differences in the C-H stretching region. In an attempt to quantify the spectral differences between these isomers, the absolute value differences of integrated intensities over a spectral range was summed to generate difference scores, as summarized in Table 4. Equation 3 shows the mathematical formula to obtain this difference score, where f(ṽ) and g(ṽ) denote relative IRPD intensities at different IR frequencies (ṽ) in the IRPD spectra f and g. By taking the absolute value of the intensity differences, the differences cumulatively add up over the IR spectral range that the integration is done; the integration was performed here using the python library NumPy’s trapz method. Note that others have employed matrix-based approaches to analyze photofragmentation data for the purpose of structural identification24.
Figure 6:
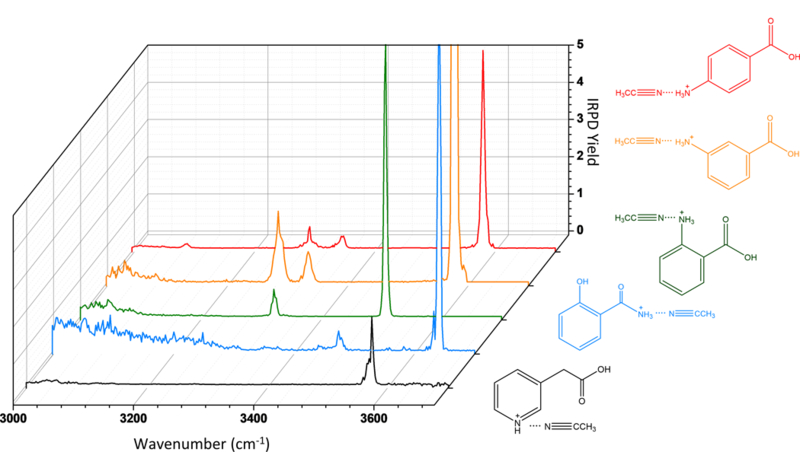
A 3D comparison of IRPD spectra of five m/z 138 solvent-tagged isomeric ions (m/z 179): PABA●ACN (red), MABA●ACN (orange), OABA●ACN (green), salicylamide●ACN (blue) and 3-PAA●ACN (black).
Table 3:
Experimental IRPD band positions for several m/z 138 isomers.
| Isomer | OH Band Position/cm−1
(FWHM) |
NH3+ Band(s) Position/cm−1 (FWHM) |
|---|---|---|
| p-aminobenzoic acid | 3577 (8) | 3339 (7), 3288 (8) |
| m-aminobenzoic acid | 3577 (6) | 3334 (12), 3285 (16) |
| o-aminobenzoic acid | 3563 (6) | 3322 (9) |
| Salicylamide | 3636 (6) | 3471 (10), 3437 (9), 3370 (12) |
| 3-pyridylacietic acid | 3571 (10) | - |
Table 4:
A comparison of m/z 138 isomers based on their integrated intensity difference.
|
p-aminobenzoic acid |
m-aminobenzoic acid |
o-aminobenzoic acid |
Salicylamide | 3-pyridylacetic acid |
|
| - | 8.4 | 17.3 | 23.4 | 36.6 |
p-aminobenzoic acid |
| 8.4 | - | 17.7 | 23.3 | 34.0 |
m-aminobenzoic acid |
| 17.3 | 17.7 | - | 21.0 | 39.0 |
o-aminobenzoic acid |
| 23.4 | 23.3 | 21.0 | - | 34.1 | Salicylamide |
| 36.6 | 34.0 | 39.0 | 34.1 | - | 3-pyridylacetic acid |
It is clear from these scores that the IR spectra of PABA and MABA are most similar, followed by OABA. As PABA, MABA and OABA are positional isomers with the same functional groups, there appears to be a correlation between the spectral similarities and the molecular similarities between the isomers. It is promising that this trend is observed even for an imperfect tag such as ACN, which is known to affect the inherent IR spectrum of the analyte, as a result of intermolecular interactions. For instance, there are a couple of bands that seem to be missing in these IRPD spectra, particularly N-H modes of the charged moiety, due to interactions of ACN with this group. A more detailed study on the effect of a solvent tag on the IRPD spectra of analytes is the subject of a forthcoming study,33 and this has been the subject of a large number of studies in the literature.34–36 It should also be noted that the binding energy of ACN exceeds the energy of a single IR photon, and thus these IRPD spectra reflect a multiple-photon dissociation regime.
| Eq. 3 |
Using a More Innocent Tag: N2
Ideally, the role of the tag is to be an innocent reporter on the absorption of a single photon.13 Additionally, the tag should be generic, and stick to any ion, which is not readily implemented for solvent-tagged ions from ESI. Here, we demonstrate IRPD of an N2-tagged complex, based on a weak van der Waals interaction, which dissociates via absorption of a single photon. The choice of N2 (rather than H2 or He) is motivated by the larger mass shift (i.e., 28 amu), which is large enough to ensure mass isolation in our mass-selective cryogenic trap without knocking off the tag due to RF heating.
Figure 7A compares the cryogenic IRPD spectrum of N2-tagged protonated tryptophan to the IRMPD spectrum of protonated tryptophan. Protonated tryptophan is a good model system for interpretation, as it has been previously studied by both IRMPD spectroscopy,37 and cryogenic IR-IR-UV hole burning spectroscopy.38 It is clear that for both IRMPD and IRPD the carboxylic OH stretch and the indole NH mode appear in relatively the same positions but with the IRPD spectrum exhibiting better resolved peaks. It is interesting to note that there is a red shift in the IRPD spectrum for the free N-H stretching modes and that there are actually two resolvable peaks. Furthermore, there are also quite clearly resolved peaks in the 3000cm−1 – 3200cm−1 range which are not apparent in the IRMPD spectrum. Figure 7B shows a comparison to the previously published data by Boyarkin et al.38 The latter data was interpreted by the presence of two conformers (labeled in blue and red). The N2-tagged IRPD spectrum exhibits similar features, but these appear to be shifted. These results illustrate that cryogenic IR spectra are often the sum of multiple conformations, and that even a van der Waals tag can have an effect on the measured IR action spectrum. Nonetheless, the high resolution, and therefore high chemical specificity of these measurements can serve as a powerful fingerprint for identification and differentiation of isomeric species.
Figure 7:
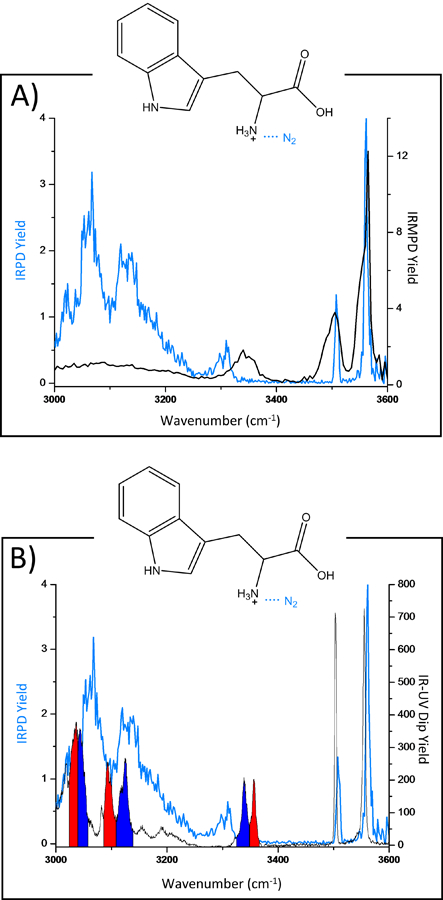
IRPD spectrum of protonated tryptophan tagged with N2 (blue) compared with (Top) the IRMPD spectrum of the bare tryptophan ion and (Bottom) the IR-IR-UV hole burning spectrum of the bare tryptophan ion.38 Diagnostic IR modes for two prominent conformations are labeled (in blue and red).
Conclusions
Vibrational ion spectroscopy methods such as IRMPD and IRPD offer a wealth of structural information on isomeric and isobaric metabolites. IRMPD spectroscopy is implementable in commercially available mass spectrometers, and can be a powerful tool for identifying specific functional groups, especially among isobaric metabolites with different functional groups. Nonetheless, the low resolution of IRMPD limits its usefulness for differentiating closely related molecules, such as isomers. Cryogenic IRPD spectroscopy provides enhanced spectral resolution to distinguish multiple isomers, even positional isomers that differ by only a single substituent around a benzene ring. An important aspect of IRPD spectroscopy involves “tagging” the analyte non-covalently, which opens the door to a multiplexed scheme, in which the IR spectra of multiple analytes can be recorded in parallel. It was shown here that using the solvent tag acetonitrile, high resolution IR spectra can be recorded (in a multiplexed fashion). On the one hand, the tagging efficiency for solvent tagging can be high for some analytes17, which is advantageous from a sensitivity point of view. On the other hand, the solvent tag can have a significant effect on the infrared spectra of analytes. The use of a van der Waals tag such as N2 is more ideal in terms of employing an innocent tag, even if there are also subtle band shifts in the measured IR spectra compared to measuring IR spectra of bare ions. This illustrates the importance of employing a reference tag in terms of building up a library of IR spectra of known standards. A strong point of IR spectroscopy is that this IR spectral library would not have to be complete in order to allow a partial structural characterization of an unknown. As spectral similarity correlates with structural similarity, especially in the fingerprint (1000–1400 cm−1) region, a classification of the unknown into the chemical class of a library reference compound should be possible.
Supplementary Material
Acknowledgments
The project was financially supported by the United States National Science Foundation (NSF) under grant number CHE-1403262, the United States National Institutes of Health (NIH) under grant number R01GM110077, the LabEx MiChem part of French state funds managed by the ANR within the Investissements d’Avenir program under reference ANR-11-IDEX-0004–02, and also within the Investissements d’Avenir/ Sorbonne Universités international mobility grants. Todd Prox and Brian Smith in our machine shop are gratefully acknowledged for constructing the cryoLIT and a number of custom parts of our set-up. Stanley Pych in our electronics shop is acknowledged for help with electronics circuits. Dr. Philip Remes and Dr. Jae Schwartz from Thermo-Fisher are thanked for providing a Thermo Velos RF power supply to enable these experiments. Professor Oleg Boyarkin (EPFL) is thanked for providing the cryogenic IR spectroscopy data on protonated tryptophan.
Publications
- (1).Samuelsson LM; Larsson DG J. Molecular BioSystems 2008, 4, 974. [DOI] [PubMed] [Google Scholar]
- (2).Kang J; Zhu L; Lu J; Zhang X Journal of Neuroimmunology 2015, 279, 25. [DOI] [PubMed] [Google Scholar]
- (3).Zhang A; Sun H; Xu H; Qiu S; Wang X OMICS: A Journal of Integrative Biology 2013, 17, 495. [DOI] [PMC free article] [PubMed] [Google Scholar]
- (4).Mahrous EA; Farag MA Journal of Advanced Research 2015, 6, 3. [DOI] [PMC free article] [PubMed] [Google Scholar]
- (5).Guo-Fang Zhang QL, Ling Li and Takhar Kasumov Metabolomics Research with Tandem Mass Spectrometry; InTech, 2012. [Google Scholar]
- (6).Vinaixa M; Schymanski EL; Neumann S; Navarro M; Salek RM; Yanes O TrAC Trends in Analytical Chemistry 2016, 78, 23. [Google Scholar]
- (7).Naz S; Vallejo M; García A; Barbas C Journal of Chromatography A 2014, 1353, 99. [DOI] [PubMed] [Google Scholar]
- (8).Fridgen TD Mass Spectrometry Reviews 2009, 28, 586. [DOI] [PubMed] [Google Scholar]
- (9).Polfer NC; Oomens J Mass Spectrometry Reviews 2009, 28, 468. [DOI] [PubMed] [Google Scholar]
- (10).Kamrath MZ; Garand E; Jordan PA; Leavitt CM; Wolk AB; Van Stipdonk MJ; Miller SJ; Johnson MA Journal of the American Chemical Society 2011, 133, 6440. [DOI] [PMC free article] [PubMed] [Google Scholar]
- (11).Thompson MC; Ramsay J; Weber JM Angewandte Chemie International Edition 2016, 55, 15171. [DOI] [PubMed] [Google Scholar]
- (12).Duffy EM; Marsh BM; Voss JM; Garand E Angewandte Chemie International Edition 2016, 55, 4079. [DOI] [PubMed] [Google Scholar]
- (13).Okumura M; Yeh LI; Myers JD; Lee YT In The Journal of Chemical Physics 1986; Vol. 85, p 2328. [Google Scholar]
- (14).Goebbert DJ; Wende T; Bergmann R; Meijer G; Asmis KR The Journal of Physical Chemistry A 2009, 113, 5874. [DOI] [PubMed] [Google Scholar]
- (15).Jašík J; Roithová J International Journal of Mass Spectrometry 2015, 377, 109. [Google Scholar]
- (16).Cismesia AP; Bailey LS; Bell MR; Tesler LF; Polfer NC Journal of The American Society for Mass Spectrometry 2016, 27, 757. [DOI] [PMC free article] [PubMed] [Google Scholar]
- (17).Cismesia AP; Tesler LF; Bell MR; Bailey LS; Polfer NC J Mass Spectrom 2017, 52, 720. [DOI] [PMC free article] [PubMed] [Google Scholar]
- (18).Gorlova O; Colvin SM; Brathwaite A; Menges FS; Craig SM; Miller SJ; Johnson MA J. Am. Soc. Spectrom 2017, 28, 2414. [DOI] [PubMed] [Google Scholar]
- (19).Martens J; Koppen V; Berden G; Cuyckens F; Oomens J Analytical Chemistry 2017, 89, 4359. [DOI] [PMC free article] [PubMed] [Google Scholar]
- (20).Hernandez O; Isenberg S; Steinmetz V; Glish GL; Maitre P The Journal of Physical Chemistry A 2015, 119, 6057. [DOI] [PubMed] [Google Scholar]
- (21).Wattjes J; Schindler B; Trombotto S; David L; Moerschbacher Bruno M; Compagnon I In Pure and Applied Chemistry 2017; Vol. 89, p 1349. [Google Scholar]
- (22).Kopysov V; Makarov A; Boyarkin OV Analytical Chemistry 2017, 89, 544. [DOI] [PubMed] [Google Scholar]
- (23).Mucha E; Gonzalez Florez AI; Marianski M; Thomas DA; Hoffmann W; Struwe WB; Hahm HS; Gewinner S; Schollkopf W; Seeberger PH; von Helden G; Pagel K Angew Chem Int Ed Engl 2017, 56, 11248. [DOI] [PubMed] [Google Scholar]
- (24).Kopysov V; Makarov A; Boyarkin OV Analytical Chemistry 2015, 87, 4607. [DOI] [PubMed] [Google Scholar]
- (25).Masellis C; Khanal N; Kamrath MZ; Clemmer DE; Rizzo TR Journal of The American Society for Mass Spectrometry 2017, 28, 2217. [DOI] [PMC free article] [PubMed] [Google Scholar]
- (26).Gulyuz K; Stedwell CN; Wang D; Polfer NC Review of Scientific Instruments 2011, 82, 054101. [DOI] [PubMed] [Google Scholar]
- (27).Guan S; Marshall AG Analytical Chemistry 1993, 65, 1288. [DOI] [PubMed] [Google Scholar]
- (28).Allouche A-R Journal of Computational Chemistry 2011, 32, 174. [DOI] [PubMed] [Google Scholar]
- (29).Patrick AL; Stedwell CN; Polfer NC Analytical Chemistry 2014, 86, 5547. [DOI] [PubMed] [Google Scholar]
- (30).Schindler B; Joshi J; Allouche A-R; Simon D; Chambert S; Brites V; Gaigeot M-P; Compagnon I Physical Chemistry Chemical Physics 2014, 16, 22131. [DOI] [PubMed] [Google Scholar]
- (31).Schuller-Levis GB; Park E FEMS Microbiology Letters 2003, 226, 195. [DOI] [PubMed] [Google Scholar]
- (32).S.A. Tan, L. G. T; Clin Physiol Biochem 1989, 7, 303. [PubMed] [Google Scholar]
- (33).Bell MR; Vinicius WD; Cismesia AP; Tesler LF; Roitberg AE; Polfer NC J. Phys. Chem 2017, In Preperation. [DOI] [PubMed] [Google Scholar]
- (34).Wanko M; Wende T; Montes Saralegui M; Jiang L; Rubio A; Asmis KR Phys Chem Chem Phys 2013, 15, 20463. [DOI] [PubMed] [Google Scholar]
- (35).Roy TK; Nagornova NS; Boyarkin OV; Gerber RB J Phys Chem A 2017, 121, 9401. [DOI] [PubMed] [Google Scholar]
- (36).Marsh BM; Zhou J; Garand E J Phys Chem A 2014, 118, 2063. [DOI] [PubMed] [Google Scholar]
- (37).Mino WK; Gulyuz K; Wang D; Stedwell CN; Polfer NC The Journal of Physical Chemistry Letters 2011, 2, 299. [Google Scholar]
- (38).Pereverzev AY; Cheng X; Nagornova NS; Reese DL; Steele RP; Boyarkin OV The Journal of Physical Chemistry A 2016, 120, 5598. [DOI] [PubMed] [Google Scholar]
- (39).Lanucara F; Chiavarino B; Scuderi D; Maitre P; Fornarini S; Crestoni ME Chemical Communications 2014, 50, 3845. [DOI] [PubMed] [Google Scholar]
Associated Data
This section collects any data citations, data availability statements, or supplementary materials included in this article.


