

Abstract
For many years, mRNA abundance has been used as the surrogate measure of gene expression in biological systems. However, recent genome-scale analyses in both bacteria and eukaryotes have revealed that mRNA levels correlate with steady-state protein abundance for only 50–70% of genes, indicating that translation and post-translation processes also play important roles in determining gene expression. What is not yet clear is whether dynamic processes such as cell cycle progression, differentiation, or response to environmental changes change the relationship between mRNA and protein abundance. Here, we describe a systems approach to interrogate promastigote-to-amastigote differentiation in the obligatory intracellular parasitic protozoan Leishmania donovani. Our results indicate that regulation of mRNA levels plays a major role early in the differentiation process, while translation and post-translational regulation are more important in the latter part. In addition, it appears that the differentiation signal causes a transient global increase in the rate of protein synthesis, which is subsequently down-regulated by phosphorylation of α-subunit of translation initiation factor 2. Thus, Leishmania dynamically changes the relationship between mRNA and protein abundance as it adapts to new environmental circumstances. It is likely that similar mechanisms play a more important role than previously recognized in regulation of gene expression in other organisms.—Lahav, T., Sivam, D., Volpin, H., Ronen, M., Tsigankov, P., Green, A., Holland, N., Kuzyk, M., Borchers, C., Zilberstein, D., Myler, P. J. Multiple levels of gene regulation mediate differentiation of the intracellular pathogen Leishmania.
Keywords: gene expression, development, microarray, proteomics
Quantitation of mRNA abundance has traditionally served as a surrogate for gene expression in many biological systems, especially with the advent of genome-wide methods for RNA profiling, such as microarrays and high-density cDNA sequencing. However, recent studies (1–3) in log-phase bacteria and yeast showed good correlation between mRNA and protein levels for only 50 and 70% of genes, respectively. The level of correlation also varied according to gene function, i.e., proteins involved in signaling and metabolic pathways demonstrated strong correlation, while those in large complexes showed weaker correlation (4). While the relationship between steady-state mRNA and protein abundance varies considerably for different genes under different growth conditions, it is not yet clear whether dynamic processes such as cell cycle progression, cellular development/differentiation, or response to environmental changes modulate these relationships. However, similar relationships between mRNA and protein abundance changes have also been observed in the antibiotic-producing Streptococcus pyogenes during their differentiation from log to stationary phase, when they produce and secrete antibiotics (5). Here we compared the changes in mRNA and protein abundance during promastigote-to-amastigote differentiation of the unicellular human pathogen Leishmania donovani as a model system to investigate these processes.
L. donovani is an intracellular protozoan that causes kala azar, a fatal form of visceral leishmaniasis in humans. These parasites cycle between the midgut of female sand flies, where they reside as extracellular flagellated promastigotes, and the phagolysosomes of human macrophages, where they live as aflagellated amastigotes (6). Virulent metacyclic promastigotes are introduced into the host during the sand fly blood meal and then are phagocytosed by resident macrophages near the bite (7). Lipophosphoglycans on the parasite surface attenuate phagolysosome biogenesis following uptake (8–10), and this pause allows promastigotes to prepare for the imminent environmental transition (11, 12). Differentiation into amastigotes initiates in postpause phagolysosomes that exhibit an acidic luminal pH and contain various active acidic hydrolases (13–15).
In recent years, studies (12, 16, 17) have been carried out to better understand the molecular mechanism of Leishmania intracellular development by establishing host-free systems that simulate this process. These were based on the hypothesis that in order to promote axenic promastigotes differentiation into amastigotes, post-pregnant pause conditions must be employed. L. donovani differentiation is induced in axenic culture by exposing promastigotes to intralysososome-like environment (37°C and pH 5.5 in 5% CO2). With the use of biochemical and molecular markers, axenic amastigotes of both Old and New World species have been shown to resemble animal-derived amastigotes (16, 18, 19). An important and novel advantage for the axenic system is the ability to investigate differentiation progression without host molecules interference. To date, this cannot be achieved in infected animal models or macrophage cell lines. Based on morphology, recent time-course analysis of axenic L. donovani differentiation identified 4 phases; signal perception with no morphological change (phase I; 0–5 h), movement cessesion and aggregation (phase II; 5–10 h), morphological transformation to amastigote-shape cells (phase III; 10–25 h), and amastigote maturation (phase IV; 25–120 h; 20). Recent time-course analyses using high coverage proteomic methodology have shown that L. donovani differentiation is well regulated, with ordered and coordinated changes in protein abundance (21). These studies showed that during differentiation, parasites retool themselves for life in the new host environment.
There is considerable debate as to the relative importance of changes in mRNA levels and translation in regulating cellular protein abundance during parasite development. Protein-coding genes in Leishmania (and other trypanosomatids) are organized into long gene clusters (22–24), and the resultant polycistonic RNAs are post-transcriptionally processed into mature mRNAs by concomitant trans-splicing and polyadenylation. In addition, trypanosomatids appear to have few of the regulatory transcription factors (24) and transcription initiates at <200 sites in the entire genome (25, 26). Thus, it has been postulated that they largely lack the transcriptional regulation of gene expression typically found in other eukaryotes. However, interpretation of microarray analysis has been controversial, with some studies (27, 28) indicating that substantial changes occur during promastigote-to-amastigote differentiation, with many (>10%) mRNAs transiently up- or down-regulated at various time points during differentiation. On the other hand, others (29–31) have suggested that transcription is constitutive throughout the parasite life cycle and only a small proportion (3–9%) of mRNAs have different abundance between promastigotes and amastigotes.
To more carefully investigate the relationship between changes in mRNA and protein abundance, we have compared the results of microarray and proteomic analyses of L. donovani differentiation in the same differentiation time-course experiments. This analysis allowed us to develop a model of the molecular processes underlying promastigote-to-amastigote differentiation. We found that changes in mRNA abundance play a major role early in the differentiation process, while translation and post-translational regulation are more important in the latter part of the process. This study enabled, for the first time, a systems analysis of changes in gene expression during development of an intracellular pathogen.
MATERIALS AND METHODS
Cell culture and sampling
A cloned line of L. donovani 1SR cells was used in all experiments (16). Promastigotes and amastigotes were grown at 26°C in Medium 199 (Sigma, St. Louis, MO, USA) supplemented with 10% FCS. Differentiation of promastigotes to amastigotes in axenic culture was carried out as in Barak et al. (20). Briefly, late-log promastigotes were transferred from promastigote medium at 26°C to amastigote medium at 37°C and 5% CO2. Quality control of differentiation was monitored using 2 biological markers: gradual increase in ascorbate-dependent peroxidase (LinJ34_V3.0070; ref. 27) and change in cell morphology (20). Cell sampling during differentiationg was carried out as follows: promastigotes were subjected to the differentiation signal, and total RNA and soluble proteins were simultaneously extracted from cells at 0, 2.5, 5, 7.5 (RNA only), 10, 15, 24, and 120 h after exposure to differentiation signal using methods previously described by Saxena et al. (27) and Rosenzweig et al. (21), respectively. Time-course differentiation analysis was done on 2 independent biological repeats.
Microarray design
The Nimblegen microarrays used to quantify changes in RNA abundance consisted of an “expression” probe-set, a “tiling” probe-set, and a small set of probes designed to selected 5′-untranslated regions (Nimblegen, Madison, WI, USA). Only data from the protein-coding gene (CDS) portion of the first probe set were used in the analyses described here. Eight to 10 50-mer probes were designed for each of the 8173 CDSs in Leishmania infantum version 2.0 annotation (LinJ_v2.0) at GeneDB. In addition, probes for 95 genes from Leishmania major version 5.2 for which no ortholog was annotated in the LinJv2.0 genome were included, for a total of 83,618 probes, which were arrayed in triplicate. Since the L. infantum genome annotation was updated after initial probe design, all microarray probes were remapped to LinJ_v3 using cross_match (32), resulting in 1720 probes that no longer had a perfect match to the LinJ assembly: these probes were omitted from further analysis. Another 6556 probes showed perfect matches to more than one CDS and were therefore excluded from further analysis.
Microarray hybridization
The quality of the RNA from each sample was verified on an Agilent 2100 bioanalyzer (Agilent Technologies, Santa Clara, CA, USA). RNA was sent to Nimblegen for cDNA synthesis using random priming, labeling with Cy3, and hybridization to the microarrays above according to their standard protocol for prokaryotic expression arrays (http://www.nimblegen.com/products/lit/expression_userguide_v4p0.pdf). Results from scanning the microarrays were returned from Nimblegen in the form of raw signal intensity values for each probe (in triplicate for each experiment).
Microarray data analysis
The probe intensity signals from the 16 microarray chips (2 biological replicates by 8 time points), as provided by Nimblegen, were subjected to Robust Multi-Chip Average normalization (33) to account for nonbiological signal intensity variation across the chips. For each hybridization, a single expression value was calculated for each probe by applying Tukey's biweight function to the triplicate signal values for that probe. Tukey's biweight function provides a measure of median that is more robust to outlying values than a simple arithmetic median. The data from the microarrays have been deposited with the Gene Expression Omnibus database (accession no. GSE21936) and have also been provided to TriTrypDB (http://www.tritrypdb.org) for public access. The probe-level signals were aggregated into gene-level signals by applying Tukey's biweight function to each probe that fell within the CDS boundaries. The statistical significance of signal changes between samples was assessed by either pair-wise or multiclass tests from the significance analysis of microarrays (SAM) software package (34), as appropriate, using all 3 biological replicates for each condition. We set the q value to 5, yielding a false discovery rate of 5% for the set of genes identified. There was good agreement between genes showing a 2-fold or greater change as assessed by the SAM-calculated mean or a Tukey's biweight mean of the biological replicates, so the pair-wise analyses considered both values, accepting all genes with ≥2-fold change by one method and ≥1.7-fold change by the other method.
Determination of relative protein abundance by isobaric tags for relative and absolute quantitation (iTRAQ) analysis
As described previously (21), peptides from 969 proteins were detected by liquid chromatography-tandem mass spectrometry (LC-MS/MS) at all 7 time points (0, 2.5, 5, 10, 15, 24, and 120 h after exposure to the differentiation signal). Total cellular protein content at each time point was measured using Bradford protein assay reagents from Bio-Rad (Hercules, CA, USA).
Comparison between mRNA and protein levels
To avoid false positive or negative results for the microarray analyses, further statistical analyses were carried out using JMP (http://www.jmp.com/) and several customized R scripts (http://www.r-project.org/index.html). All genes whose probes showed a sd of >1.3× the mean at any time point and/or those that exhibited a Pearson's correlation coefficient of <0.4 between the 2 biological repeats were excluded from the data set. These filters resulted in 5619 genes with highly reproducible mRNA levels that were used for further analysis, of which 902 had quantitative proteomic data from all 7 time points. The 3 biological replicates for the microarray analysis were combined by Tukey's biweight function to give a single gene-level value, and a Pearson correlation (R) was calculated for from the log2-fold changes in mRNA and protein abundance for each of these genes at all time points. These R values were used to calculate the mean value for each cluster. A Pearson correlation was also calculated between the log2-fold changes in mRNA and protein abundance for all genes at each time point. K-means clustering (35) was performed using the MeV component of the TM4 software package (36). These analyses combined the log2-fold changes mRNA and protein abundance at each of the 7 differentiation time points using the following parameters: Cluster genes only into 9 clusters by K means for 10 iterations using the euclidean distance metric, followed by heirachical clustering of each K-means clustering cluster using Gene Trees only with Gene Leaf Order optimization using the euclidean distance metric and complete linkage clustering.
Cellular mRNA abundance
Poly(A)+ mRNA was extracted from cells at 8 time points (0, 1, 2, 3, 5, 10, 24, and 120 h) of differentiation using Dynabeads mRNA Direct kit (Invitrogen, Carlsbad, CA, USA). Extractions were calibrated so that mRNA from promastigotes was one-fifth of the Dynabeads' maximum capacity. Briefly, cells (1×10⁸ in 10 ml) were washed twice with ice-cold PBS and finally suspended to the same density. An aliquot containing 1 × 10⁷ cells was lysed and mixed with Dynabeads Oligo (dT)25 for 5 min at room temperature and washed 3 times, and mRNA was eluted with Tris-HCl 10 mM. mRNA concentrations were determined using a NanoDrop ND100 spectrophotometer(Thermo Scientific, Wilmington, DE, USA).
Rate of protein synthesis
The initial rate of 35S-methionine incorporation to L. donovani cells was determined as follows: 6-ml aliquots of cells at each of 8 differentiation time points (0, 1, 2, 3, 5, 10, 24, and 120 h) were transferred to a 24-well plate (1 ml/well), and 1 μCi 35S-methionine was added to each well, before further incubation at 37°C in 5% CO2 incubator. Duplicates of 1-ml samples were portioned into aliquots at 0, 15, and 30 min (within the linear range of incorporation), washed once in ice-cold PBS, and then added to 4 ml of 10% ice-cold trichloroacetic acid for protein precipitation. Subsequently, precipitates were filtered through GF/C filters followed by 2 washes with 4 ml of ether before scintillation counting. The rate of protein incorporation was calculated from the slope at each 3 time points.
Polysome profiling
Polysome profiles were generated as described previously (37).
Analysis of α-subunit of translation initiation factor 2 (eIf2α) phosphorylation
Parasites were harvested, and the cells were lysed using a buffer containing 1% w/v sodium deoxycholate, 25 mM ammonium bicarbonate, and 3 phosphatase inhibitors (50 mM NaF, 1 mM sodium orthovanadate, and 5 mM β-glycerophosphate). One milligram of protein from each time point was reduced with dithiothreitol and cysteine sulfhydryls alkylated with iodoacetamide, and then subjected to 20 μg of trypsin for 16 h at 37°C. The resultant peptides were mixed with TiO2 beads, and phosphopeptides were eluted in 2 steps, using 30 and 50% ACN in 0.5% NH4OH. The eluted peptides were then iTRAQ-labeled and subjected to LC-MS/MS analysis as described previously (21). This analysis detected a single phosphopeptide [157-EGIIPYTEV(pT)R-167] at a confidence of 98% at all time points. The relative abundance of total eIF2α during L. donovani differentiation was determined as described previously (21).
RESULTS
Analysis of relative protein abundance by iTRAQ LC-MS/MS detected 969 proteins at all 7 time points (0, 2.5, 5, 10, 15, 24, and 120 h after exposure to the differentiation signal) during axenic promastigote-to-amastigote differentiation of L. donovani (21), and we were able to determine the relative mRNA levels with high confidence for 902 of these genes using microarray analysis on RNA from the same cells (Supplemental Table S1). Figure 1A compares the distribution of changes in mRNA and protein abundance at each of the 7 differentiation time points. For both mRNA and protein, there are progressively larger changes in abundance (both up and down) as differentiation progresses. The most obvious result is that the changes in protein abundance in amastigotes are greater in both number of genes and magnitude than are changes in mRNA levels at the same time point. Conversely, at 2.5, 5, and 10 h (phases I and II of differentiation), there are more changes in mRNA than protein abundance, albeit fewer and smaller in magnitude than in amastigotes. Overall, substantially more genes were down-regulated in amastigotes at the mRNA (191) or protein (196) level than were up-regulated (20 and 100, respectively; see Table 1). In addition, another 16 genes were only transiently up- or down-regulated (>2-fold) at the mRNA and/or protein level at intermediate time points. One gene showed an initial >2-fold decrease in mRNA levels before increasing at 120 h, while another gene showed a similar pattern at the protein level. Interestingly, while almost half (445/902) of the genes showed a 2-fold or greater change in either mRNA or protein abundance at one or more time points, only 17% of these showed a concomitant change in both mRNA and protein levels. This rose to only 29% (231/784), even when the fold-change threshold was relaxed to 1.5-fold (data not shown).
Figure 1.

RNA and protein changes associated with Leishmania differentiation. RNA and proteins were isolated from parasites at 0, 2.5, 5, 10, 15, 24, and 120 (mature amastigotes) h after differentiation was initiated and then subjected to microarray and iTRAQ analyses. A) Number of genes as a function of log2-transformed expression ratio for mRNA (left panel) or protein (right panel) at each differentiation time point. B) Number of genes showing ≥2-fold increase (U-I, U-II, U-III, U-IV) or decrease (D-I, D-II, D-III, D-IV) in mRNA (left panel) or protein (right panel) levels. Numbers indicate the differentiation phase at which the initial 2-fold change occurred. Genes showing transient changes are indicated in red, while those showing both increase and decrease (at different time points) are shown in green, and are listed according to the initial direction of change. C) Scatter-plot analysis at each time point showing the relationship between log2 ratios for mRNA (x axis) and protein (y axis) at each time point during differentiation. Correlation coefficient for each time point is at top left of each panel.
Table 1.
Changes in mRNA and protein levels during differentiation
| mRNA | Protein |
|||
|---|---|---|---|---|
| Up | Down | Nonea | Total | |
| Up | 10 | 4b | 6 | 20 |
| Down | 8 | 58 | 125c | 191 |
| None | 82d | 134e | 475f | 691 |
| Total | 100 | 196 | 606 | 902 |
Less than 2-fold change at 120 h relative to 0 h.
One gene transiently down at mRNA level and then up at 120 h.
One gene transiently up at protein level.
One gene down transiently at protein levelm and then up at 120 h; 3 genes transiently up at mRNA level; 1 gene down transiently at mRNA level.
Two genes down transiently at mRNA level.
Two genes up transiently at both mRNA and protein levels; 2 genes up transiently at mRNA level only; 5 genes up transiently at protein level only; 1 gene down transiently at protein level only; 4 genes down transiently at mRNA level only.
To more clearly understand the timing of the changes in mRNA and protein abundance, we determined the differentiation stage at which these changes reached ≥2-fold up or down compared with promastigotes (Fig. 1B). Interestingly, the majority of the up-regulated mRNAs showed an initial 2-fold increase in phase I or II (12) or were only transiently up-regulated (8). In contrast, of the genes that are up-regulated at the protein level, most (67) showed their initial 2-fold increase in phase III or IV. Similarly, most down-regulated mRNAs first decreased in phase I or II (135), or only transiently (7), while almost all (176/197) down-regulated proteins showed their initial 2-fold decrease only in phase III or IV. Thus, most changes in relative mRNA abundance initially occur early in the differentiation (i.e., phase I or II), while most changes in relative protein abundance occur later (phase III or IV) in the process.
To quantitatively analyze the correlation between the direction and magnitude of mRNA and protein abundance changes during differentiation, we performed linear regression analysis at all time points (Fig. 1C). While there is a positive correlation between changes in mRNA and protein levels throughout differentiation, the maximum correlation (r=0.44) occurs at 5 and 10 h after the signal. During phases III and IV (15–120 h), the correlation becomes progressively worse, such that by 120 h (mature amastigotes) there is almost no correlation (r=0.17) between the changes in mRNA and protein levels. Since a high correlation coefficient would indicate regulation of gene expression at the level of mRNA abundance, while a low coefficient would be indicative of translational or post-translational regulation (2), these results suggest that regulation of mRNA levels is more important during the time of aggregation and synchronization (phase II). Conversely, during amastigote maturation (phase IV), regulation of mRNA levels is less important, with translational regulation becoming paramount.
K-means clustering revealed 9 clusters showing 6 distinct patterns of changes in mRNA and protein levels during differentiation (Fig. 2 and Supplemental Table S1). Two of the clusters (containing 198 genes) showed essentially no change in either mRNA or protein levels (Fig. 2A). One cluster contained 90 genes that are up-regulated at both mRNA and protein levels, albeit in most cases the increases in mRNA levels are <2-fold, resulting in only a modest correlation (0.33 on average) between mRNA and protein levels (Fig. 2B). For most of these genes, mRNA levels start to increase soon after the signal, while protein changes tend to occur later (as exemplified by the 3,2-trans-enoyl-CoA isomerase encoded by LinJ23_V3.1220; see Fig. 3A). However a few genes, such as the ascorbate-dependent peroxidise (LinJ34_V3.0070) and heat-shock protein 100 (LinJ29_V3.1360), show early increases in both mRNA and protein levels. Three clusters (containing 301 genes) showed down-regulation at both mRNA and protein levels, although in many cases the decreases were modest (Fig. 2C). Genes in these clusters showed a tighter linkage between mRNA and protein levels, as evidenced by the higher average correlation coefficients (0.41–0.77). Genes that were down-regulated at both mRNA and protein levels included those encoding paraflagellar rod proteins 1D and 2C (LinJ29_V3.1890 and LinJ16_V3.1510 in Fig. 3B), eukaryotic translation initiation factor 3 (LinJ36_V3.4070), and 60S ribosomal protein L23a (LinJ06_V3.0600).
Figure 2.

Cluster analysis of mRNA and protein coexpression during Leishmania differentiation. K-median clustering of mRNA and protein abundance changes were performed using TMeV software (36) to produce 9 clusters with 6 different patterns (letters A–F at left). Average correlation coefficient (as determined for each gene as described in Materials and Methods) is at right of each cluster. Number of genes in each cluster pattern is at far right, between arrows indicating the change in mRNA and protein abundance.
Figure 3.
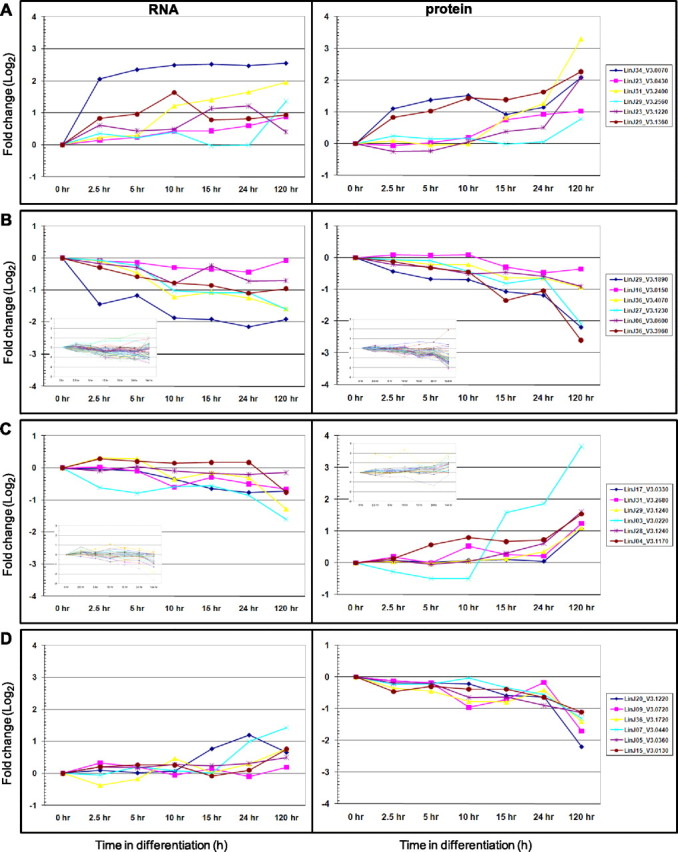
RNA and protein coexpression patterns. Changes in mRNA (left panel) and protein (right panel) abundance are plotted as function of differentiation time course. A) Six genes selected from cluster group B in Fig. 2. B) Six genes selected from cluster group C in Fig. 2. Insets: all genes involved in translation (as determined by GO Slim Plus). C) Six genes selected from cluster group E in Fig. 2. Insets: all energy metabolism. D) Six genes selected from cluster group F in Fig 2.
The remaining clusters contained 313 genes with poor (or negative) correlation between changes in mRNA and protein levels. One cluster (Fig. 2D) showed down-regulated mRNA levels, but no substantial changes in protein levels, while another cluster (Fig. 2E) contained genes with unchanged or down-regulated mRNAs, but increased protein abundance. The latter included LinJ29_V3.1240 (which encodes tryparedoxin), LinJ03_V3.0220 (long chain fatty acyl CoA synthetase), LinJ28_V3.1240 (electron-transfer-flavoprotein subunit), and LinJ04_V3.1170 (cytosolic fructose-1,6-bisphosphatase), as shown in Fig. 3C.
Genes in the final cluster (Fig. 2F) showed an increase in mRNA (although often <2-fold) but a decrease in protein levels. These include genes encoding prefoldin subunit 2 (LinJ09_V3.0720), ubiquitin-protein ligase (LinJ07_V3.0440), and 2 ATP-dependent RNA helicases (LinJ05_V3.0360 and LinJ15_V3.0130; see Fig. 3D).
Many ribosomal proteins and translation factors are down-regulated at the protein level (see Supplemental Table S1), with most also down-regulated at the mRNA level (Fig. 3B, inset), prompting us to examine whether this coincided with an attenuation of translational activity. In eukaryotes, phosphorylation of Ser51 of the eIF2α leads to destabilization of polysome formation and down-regulation of translation (38). The trypanosomatid eIF2α contains an N-terminal extension of ∼113 aa, and phosphorylation occurs at Thr169 of the Trypanosoma brucei orthologue (39). iTRAQ labeling of TiO2-enriched tryptic phosphopeptides from 0, 2.5, 5, 10, 15, and 24 h time points enabled us to quantify changes in the phosphorylation state of the cognate Thr166 of Leishmania eIF2α (LinJ03_V3.0960 for L. infantum and AAQ02666 for L. donovani). As shown in Fig. 4A, Thr166 phosphorylation increased by almost 4-fold at 10–15 h and leveled off by 24 h. Examination of changes in the polysome profile during promastigote-to-amastigote differentiation revealed an average of 6 ribosomes per mRNA molecule in promastigotes and polysomes account for ∼70% of the ribosomes at this stage (Fig. 4B, C). The polysome profile remains essentially unchanged for 5–10 h after exposure to the differentiation signal, but the number of ribosomes per mRNA and the polysome-to-monosome ratio both decrease substantially at 15 h and are even lower by 24 h (Fig. 4B, C). Thus, during L. donovani differentiation, the increase in eIF2α phosphorylation results in a decrease in polysome formation. This corresponds to the marked decrease in abundance of many ribosomal proteins and translation factors, suggesting a systematic down-regulation of translation machinery during differentiation.
Figure 4.

Translation regulation during Leishmania differentiation. A) iTRAQ analysis of changes in phosphorylation state of eIF2α (LinJ03_V3.0960). Relative fold-changes in total protein (squares) determined from several nonphosphorylated peptides, the phosphopeptide containing Thr166 (diamonds), and the ratio between them (triangles) are plotted as function of time after exposure to differentiation signal. B) Polysome profiles at 0, 5, 10, 15, and 24 h after exposure to differentiation signal, as well as an EDTA control from 0 h. Peaks from ribosomal subunits (40S and 60S), monosomes (80S), and different sized polysomes (2R–6R) are indicated in the 0 h panel. C) Percentage of total ribosomes present as monosomes (squares) and polysomes (diamonds) was measured by calculating the area under the curve to the left and right, respectively, of the dotted line in each panel of B. O.D.280, optical density at 280 nm.
To further analyze the rate of protein synthesis and subsequent changes in cellular protein content during differentiation, we determined the initial rate of methionine incorporation in parasite cells at various time points. As shown, immediately following exposure to differentiation signal, the rate of methionine incorporation rapidly increased, peaking at 3-fold higher by 5 h (Fig. 5A). Subsequently (and coincidently with the increase in eIF2α phosphorylation), the rate of protein synthesis started to decline, reaching rates equal to, and only half that of, promastigotes by 24 and 120 h, respectively. This rise and fall in protein synthesis rate were mirrored by a change in cellular protein content, which sharply increased from 0.6 μg protein/106 cells in promastigotes to almost 3 μg/106 cells by 3 h postsignal and then gradually decreased to a steady-state level of 0.4 μg/106 cells in amastigotes at 120 h (Fig. 5B). It is interesting to note that overall mRNA levels also rise transiently during differentiation, increasing from 25 ng/106 cells in promatogotes to 39 ng/106 cells at 10 h, before declining to 18 ng/106 cells in mature amastigotes (Fig. 5C). Thus, the differentiation signal appears to transiently increase mRNA levels and activate the translation machinery, accelerating the overall rate of protein synthesis and raising the total cellular protein level. The phosphorylation of eIF2α and concomtitant decrease in the level of ribosomal proteins and other members of the protein synthesis machinery that occur later in the differentiation process result in a subsequent decrease in the rate of protein synthesis, enabling adjustment of cellular protein content in the newly developed amastigotes.
Figure 5.

Changes in the rate of protein synthesis, cellular protein content, and mRNA abundance during differentiation. A) Relative change in the rate of protein synthesis during differentiation was carried out by determining the initial rate of 35S-methionine incorporation at each time point, as described in Materials and Methods. Time-point data represent means ± sd (n=3). B) Protein content of parasite cells during differentiation, as determined by Bradford assay, as described in Materials and Methods. Graph represents 1 of 2 independent experiments. C) Total cellular mRNA content during differentiation was determined described as in Materials and Methods. Graph represents 1 of 2 independent experiments.
To visualize whether particular biological functions are associated with specific levels of gene regulation, we plotted the correlation coefficients between changes in mRNA and protein abundance during differentiation for each of the 902 genes and grouped them by Gene Ontology (GO) Slim Plus category (Fig. 6). A strong positive correlation (i.e., values>0.5) is indicative of regulation at the mRNA level, whereas a negative correlation (i.e., <0) is indicative of regulation by translation or protein stability. The mean correlation coeffient for the 902 genes interrogated in this study was 0.60 ± 0.08, suggesting a variety of regulatory levels were used by different genes. Interestingly, most (47/67) genes involved in translation (column 1) show a positive correlation, with the group as a whole showing a mean correlation of 0.28 ± 0.52; significantly different (P<0.002) from the mean for all genes. This supports the finding above (Fig. 3B) that a decrease in mRNA abundance plays a major role in the down-regulation of translation machinery during differentiation. Likewise, genes involved in protein metabolism also showed a significant positive correlation (mean of 0.25±0.57; P<0.02), suggesting that the majority (61/90) were regulated at the level of mRNA. In contrast, the vast majority (23/28) of energy metabolism genes have a negative correlation between changes in mRNA and protein abundance, with a group mean of −0.41 ± 0.52 (P<0.001), indicating that their regulation is mostly by translation and/or protein stability. Most of these proteins are up-regulated late in differentiation, while the mRNA levels remain unchanged or even decreased (Fig. 3C). Conversely, a subset (10/25) of the amino acid metabolism genes showed a strong positive correlation, although the mean of this GO class (0.22±0.19) was not significantly different from the genes as a whole. Most of these are biosynthetic enzymes that are down-regulated at both mRNA and protein levels. As with the translational machinery proteins mentioned above, the protein changes lagged several hours behind the mRNA changes.
Figure 6.

Correlation between changes in mRNA and protein levels by GO Slim category. All 902 genes were categorized into a single GO Slim Plus category (indicated in the legend at right), as described by Ivens et al. (24). Correlation coefficient for each gene was calculated as described in Materials and Methods; Student's t test (in Microsoft Excel) was used to calculate whether the mean for each GO Slim Plus class was significantly different from that of the 902 genes as a whole. Classes with statistically significant differences are indicated by asterisks either above (positive correlation) or below (negative correlation) the relevant column: *P < 0.02; ***P < 0.001.
Within the cytoskeleton-associated proteins, 3 genes (LinJ35_V3.3900, LinJ23_V3.1460, and LinJ21_V3.1330) encoding t-complex protein 1 subunits η, γ, and δ are down-regulated at both protein and mRNA levels. This strong positive correlation suggests coregulation of these 3 genes, located on different chromosomes, by mRNA abundance. The same is true for a number of genes involved in fatty acid and lipid biosynthesis. However, enzymes involved in lipid catabolism show a poor or negative correlation, indicating regulation by translation or protein abundance. Finally, 8 of the 9 trypanosomatid-specific genes showed poor or negative correlation (mean of −0.38±0.19; P<0.11). Interestingly, while the mRNA levels of all of these genes decreased substantially, most showed modest increases in protein abundance. The exception was LinJ32_V3.3920 (kinetoplast associated protein p18–2), which showed a 3-fold increase in protein abundance in phase IV.
DISCUSSION
The use of a systems approach to dissect changes in gene expression has revealed that promastigote-to-amastigote differentiation in L. donovani is mediated by a programmed cascade of changes in mRNA abundance, translation rate, and/or protein processing. Furthermore, different regulatory mechanisms appear to be used at different times during differentiation. At the whole-cell level, we found that differentiation signal, which consists of concomitant shift in temperature (>10°C increase) and pH (from 7 to 5.5), transiently boosts the rate of protein synthesis (and the overall mRNA level) resulting in increased protein content, likely in preparation for the upcoming cell division (between 6 and 9 h) with subsequent morphological and physiological remodeling. Increased phosphorylation of eIF2α at Thr166 is then used by the cells to attenuate protein synthesis and subsequent downward adjustment of cellular protein content in mature amastigotes. This is accompanied (and perhaps enhanced) by a reduction in protein levels for many ribosomal proteins and translation factors, which we have collectively named “translation machinery.” This global repression of translation late in differentiation likely explains the slower growth rate of amastigotes.
We suggest that the differentiation signal also triggers gene-specific changes in RNA processing and turnover during phases I and II (0–10 h) of differentiation (i.e., before morphological changes), resulting in rapid down-regulation of some gene products (e.g., paraflagellar rod proteins) and up-regulation of others (ascorbate-dependent peroxidise and heat shock protein 100). Interestingly, the down-regulation of the translation machinery and (to a lesser extent) protein metabolism appears to be mediated largely at the level of mRNA stability, since they show a better than average correlation between RNA and protein abundance. Decreased mRNA abundance also appears to down-regulate some enzymes involved in amino acid and lipid metabolism, while the increased protein levels of those involved in energy metabolism probably result from changes in translation efficiency, since their mRNA levels do not change (or even decrease). Indeed, a number of key enzymes change in abundance late (>24 h) in differentiation, as the amastigotes retool their metabolic capacity to deal with the phagolysosome environment (21).
Intracellular infectious microorganisms have a specific location in their hosts that they must invade in order to proliferate and subsequently cause a disease. Successful invasion requires that parasites use molecular mechanisms to identify arrival at destination and subsequently transform from invasive to infectious agents. The use of a host-free system that simulates this change in environment is an essential step to reveal the course of events and identify genes and proteins involved in this complex process. We found that at least half of the 902 genes that were tested in this study changed in abundance either permanently or transiently during differentiation at mRNA and/or protein levels, indicating that gene expression during Leishmania development is not constitutive.
Our data clearly demonstrate the importance of changes in mRNA abundance during L. donovani differentiation. However, like all other trypanosomatids, they lack the transcriptional regulation of gene expression typically employed by other eukaryotes in response to environmental changes, since their protein-coding genes are organized into long polycistronic gene clusters, with transcription initiating at only 184 sites in the entire genome (25). Thus, regulation of mRNA abundance in Leishmania relies exclusively on post-transcriptional processes (40). Indeed, previous studies (1) in yeast cells that used transcription to regulate gene expression indicated relatively high correlation between changes in mRNA and protein levels of 70%. In L. donovani, we found a correlation of only ∼20–30%, which is lower than yeast.
We believe that our results provide novel insight not only into Leishmania differentiation but also into the regulation of gene expression in other organisms. Both Plasmodium and Leishmania development involve environmental changes, as well as morphological changes, that require many adjustments, i.e., changes in gene expression. For example, >80% of P. falciparum mRNAs changed in abundance at least once during development (41). Unlike Leishmania, Plasmodium regulates gene expression mostly by transcription, which probably explains this high level of change in mRNA abundance. However, global transcriptome and proteome analyses of different Plasmodium developmental stages have indicated that there is only a weak positive correlation between mRNA and protein levels, suggesting translational repression also plays an important role in gene regulation (42, 43). There is a growing body of evidence that mRNA abundance is an imperfect indicator of protein levels within both prokaryotic and eukaryotic cells (1, 2, 31), and it is becoming increasingly clear that regulation of gene expression involves an intricate balance between the rates of transcription, RNA processing and stability, translation, post-translational modification, and protein stability. Thus, the extensive use of post-transcriptional and translational regulation of gene expression may be as widespread in other organisms as it is during Leishmania differentiation.
Supplementary Material
This article includes supplemental data. Please visit http://www.fasebj.org to obtain this information.
Acknowledgments
The authors thank Dr. Roni Koren, Adele Goldman, and Gur Sevillya for experimental aid, Drs. Dan Cassel and Marilyn Parsons for critical discussions, and Dr. Yoav Arava for his help with polysome analyses.
This work was supported by U.S.-Israel Binational Foundation grant 2003237 and by Israel Ministry of Health Chief Scientist Foundation grant 33928.
Footnotes
This article includes supplemental data. Please visit http://www.fasebj.org to obtain this information.
REFERENCES
- 1.Lu P., Vogel C., Wang R., Yao X., Marcotte E. M. (2007) Absolute protein expression profiling estimates the relative contributions of transcriptional and translational regulation. Nat. Biotechnol. , 117–124 [DOI] [PubMed] [Google Scholar]
- 2.Greenbaum D., Colangelo C., Williams K., Gerstein M. (2003) Comparing protein abundance and mRNA expression levels on a genomic scale. Genome Biol. , 117. [DOI] [PMC free article] [PubMed] [Google Scholar]
- 3.Garcia-Martinez J., Gonzalez-Candelas F., Perez-Ortin J. E. (2007) Common gene expression strategies revealed by genome-wide analysis in yeast. Genome Biol. , R222. [DOI] [PMC free article] [PubMed] [Google Scholar]
- 4.Schmidt M. W., Houseman A., Ivanov A. R., Wolf D. A. (2007) Comparative proteomic and transcriptomic profiling of the fission yeast Schizosaccharomyces pombe. Mol. Syst. Biol. , 79. [DOI] [PMC free article] [PubMed] [Google Scholar]
- 5.Chaussee M. A., Dmitriev A. V., Callegari E. A., Chaussee M. S. (2008) Growth phase-associated changes in the transcriptome and proteome of Streptococcus pyogenes. Arch. Microbiol. , 27–41 [DOI] [PubMed] [Google Scholar]
- 6.Herwaldt B. L. (1999) Leishmaniasis. Lancet , 1191–1199 [DOI] [PubMed] [Google Scholar]
- 7.Chang K. P., Dwyer D. M. (1976) Multiplication of a human parasite (Leishmania donovani) in phagolysosomes of hamster macrophages in vivo. Science , 678–680 [DOI] [PubMed] [Google Scholar]
- 8.Descoteaux A., Matlashewski G., Turco S. J. (1992) Inhibition of macrophage protein kinase C-mediated protein phosphorylation by Leishmania donovani lipophosphoglycan. J. Immunol. , 3008–3015 [PubMed] [Google Scholar]
- 9.Desjardins M., Descoteaux A. (1997) Inhibition of phagolysosomal biogenesis by the Leishmania lipophosphoglycan. J. Exp. Med. , 2061–2068 [DOI] [PMC free article] [PubMed] [Google Scholar]
- 10.Turco S. J., Spath G. F., Beverley S. M. (2001) Is lipophosphoglycan a virulence factor? A surprising diversity between Leishmania species. Trends Parasitol. , 223–226 [DOI] [PubMed] [Google Scholar]
- 11.Swanson M. S., Fernandez-Moreira E. (2002) A microbial strategy to multiply in macrophages: the pregnant pause. Traffic , 170–177 [DOI] [PubMed] [Google Scholar]
- 12.Zilberstein D. (2008) Physiological and biochemical aspects of Leishmania develpment. In Leishmania After the Genome: Biology and Control (, Myler P. J., Fasel N., eds) pp. 107–122, Horizon Scientific Press and Caiser Academic, New York [Google Scholar]
- 13.Antoine J. C., Prina E., Jouanna C., Bongrand P. (1990) Parasitophorous vacuoles of Leishmania amazonensis–infected macrophages maintain an acidic pH. Infect Immun. , 779–787 [DOI] [PMC free article] [PubMed] [Google Scholar]
- 14.Alexander J., Russell D. G. (1992) The interaction of Leishmania species with macrophages. Adv. Parasitol. , 175–233 [DOI] [PubMed] [Google Scholar]
- 15.Lang T., Hellio R., Kaye P. M., Antoine J. C. (1994) Leishmania donovani-infected macrophages: characterization of the parasitophorous vacuole and potential role of this organelle in antigen presentation. J. Cell Sci. , 2137–2150 [DOI] [PubMed] [Google Scholar]
- 16.Saar Y., Ransford A., Waldman E., Mazareb S., Amin-Spector S., Plumblee J., Turco S. J., Zilberstein D. (1998) Characterization of developmentally-regulated activities in axenic amastigotes of Leishmania donovani. Mol. Biochem Parasitol. , 9–20 [DOI] [PubMed] [Google Scholar]
- 17.Burchmore R. J., Barrett M. P. (2001) Life in vacuol. Int. J. Parasitol. , 1311–1320 [DOI] [PubMed] [Google Scholar]
- 18.Bates P. A. (1994) The developmental biology of Leishmania promastigotes. Exp. Parasitol. , 215–218 [DOI] [PubMed] [Google Scholar]
- 19.Debrabant A., Joshi M. B., Pimenta P. F., Dwyer D. M. (2004) Generation of Leishmania donovani axenic amastigotes: their growth and biological characteristics. Int. J. Parasitol. , 205–217 [DOI] [PubMed] [Google Scholar]
- 20.Barak E., Amin-Spector S., Gerliak E., Goyard S., Holland N., Zilberstein D. (2005) Differentiation of Leishmania donovani in host-free system: analysis of signal perception and response. Mol. Biochem. Parasitol. , 99–108 [DOI] [PubMed] [Google Scholar]
- 21.Rosenzweig D., Smith D., Opperdoes F. R., Stern S., Olafson R. W., Zilberstein D. (2008) Retooling Leishmania metabolism: from sandfly gut to human macrophage. FASEB J. , 590–602 [DOI] [PubMed] [Google Scholar]
- 22.Worthey E. A., Martinez-Calvillo S., Schnaufer A., Aggarwal G., Cawthra J., Fazelinia G., Fong C., Fu G., Hassebrock M., Hixson G., Ivens A. C., Kiser P., Marsolini F., Rickel E., Salavati R., Sisk E., Sunkin S. M., Stuart K. D., Myler P. J. (2003) Leishmania major chromosome 3 contains two long convergent polycistronic gene clusters separated by a tRNA gene. Nucleic Acids Res. , 4201–4210 [DOI] [PMC free article] [PubMed] [Google Scholar]
- 23.Martinez-Calvillo S., Yan S., Nguyen D., Fox M., Stuart K., Myler P. J. (2003) Transcription of Leishmania major Friedlin chromosome 1 initiates in both directions within a single region. Mol. Cell , 1291–1299 [DOI] [PubMed] [Google Scholar]
- 24.Ivens A. C., Peacock C. S., Worthey E. A., Murphy L., Aggarwal G., Berriman M., Sisk E., Rajandream M. A., Adlem E., Aert R., Anupama A., Apostolou Z., Attipoe P., Bason N., Bauser C., Beck A., Beverley S. M., Bianchettin G., Borzym K., Bothe G., Bruschi C. V., Collins M., Cadag E., Ciarloni L., Clayton C., Coulson R. M., Cronin A., Cruz A. K., Davies R. M., De G. J., Dobson D. E., Duesterhoeft A., Fazelina G., Fosker N., Frasch A. C., Fraser A., Fuchs M., Gabel C., Goble A., Goffeau A., Harris D., Hertz-Fowler C., Hilbert H., Horn D., Huang Y., Klages S., Knights A., Kube M., Larke N., Litvin L., Lord A., Louie T., Marra M., Masuy D., Matthews K., Michaeli S., Mottram J. C., Muller-Auer S., Munden H., Nelson S., Norbertczak H., Oliver K., O'Neil S., Pentony M., Pohl T. M., Price C., Purnelle B., Quail M. A., Rabbinowitsch E., Reinhardt R., Rieger M., Rinta J., Robben J., Robertson L., Ruiz J. C., Rutter S., Saunders D., Schafer M., Schein J., Schwartz D. C., Seeger K., Seyler A., Sharp S., Shin H., Sivam D., Squares R., Squares S., Tosato V., Vogt C., Volckaert G., Wambutt R., Warren T., Wedler H., Woodward J., Zhou S., Zimmermann W., Smith D. F., Blackwell J. M., Stuart K. D., Barrell B., Myler P. J. (2005) The genome of the kinetoplastid parasite, Leishmania major. Science , 436–442 [DOI] [PMC free article] [PubMed] [Google Scholar]
- 25.Thomas S., Green A., Sturm N. R., Campbell D. A., Myler P. J. (2009) Histone acetylations mark origins of polycistronic transcription in Leishmania major. BMC Genomics , 152. [DOI] [PMC free article] [PubMed] [Google Scholar]
- 26.Siegel T. N., Hekstra D. R., Kemp L. E., Figueiredo L. M., Lowell J. E., Fenyo D., Wang X., Dewell S., Cross G. A. (2009) Four histone variants mark the boundaries of polycistronic transcription units in Trypanosoma brucei. Genes Dev. , 1063–1076 [DOI] [PMC free article] [PubMed] [Google Scholar]
- 27.Saxena A., Lahav T., Holland N., Anupama A., Huang G., Volpin H., Myler P. J., Zilberstein D. (2007) Analysis of the Leishmania donovani transcriptome reveals an ordered progression of transient and permanent changes in gene expression during differentiation. Mol. Biochem. Parasitol. , 53–65 [DOI] [PMC free article] [PubMed] [Google Scholar]
- 28.Almeida R., Gilmartin B. J., McCann S. H., Norrish A., Ivens A. C., Lawson D., Levick M. P., Smith D. F., Dyall S. D., Vetrie D., Freeman T. C., Coulson R. M., Sampaio I., Schneider H., Blackwell J. M. (2004) Expression profiling of the Leishmania life cycle: cDNA arrays identify developmentally regulated genes present but not annotated in the genome. Mol. Biochem. Parasitol. , 87–100 [DOI] [PubMed] [Google Scholar]
- 29.Leifso K., Cohen-Freue G., Dogra N., Murray A., McMaster W. R. (2007) Genomic and proteomic expression analysis of Leishmania promastigote and amastigote life stages: the Leishmania genome is constitutively expressed. Mol. Biochem. Parasitol. , 35–46 [DOI] [PubMed] [Google Scholar]
- 30.Akopyants N. S., Matlib R. S., Bukanova E. N., Smeds M. R., Brownstein B. H., Stormo G. D., Beverley S. M. (2004) Expression profiling using random genomic DNA microarrays identifies differentially expressed genes associated with three major developmental stages of the protozoan parasite Leishmania major. Mol. Biochem. Parasitol. , 71–86 [DOI] [PubMed] [Google Scholar]
- 31.Haile S., Papadopoulou B. (2007) Developmental regulation of gene expression in trypanosomatid parasitic protozoa. Curr. Opin. Microbiol. , 569–577 [DOI] [PubMed] [Google Scholar]
- 32.Wilson R., Ainscough R., Anderson K., Baynes C., Berks M., Bonfield J., Burton J., Connell M., Copsey T., Cooper J., Coulson A., Craxton M., Dear S., Du Z., Durbin R., Favello A., Fraser A., Fulton L., Gardner A., Green P., Hawkins T., Hillier L., Jier M., Johnston L., Jones M., Kershaw J., Kirsten J., Laisster N., Latreille P., Lightning J., Lloyd C., Mortimore B., O'Callaghan M., Parsons J., Percy C., Rifken L., Roopra A., Saunders D., Shownkeen R., Sims M., Smaldon N., Smith A., Smith M., Sonnhammer E., Staden R., Sulston J., Thierry-Mieg J., Thomas K., Vaudin M., Vaughan K., Waterston R., Watson A., Weinstock L., Wilkinson-Sproat J., Wohldman P. (1994) 2.2 Mb of contiguous nucleotide sequence from chromosome III of C. elegans. Nature , 32–38 [DOI] [PubMed] [Google Scholar]
- 33.Bolstad B. M., Irizarry R. A., Astrand M., Speed T. P. (2003) A comparison of normalization methods for high density oligonucleotide array data based on variance and bias. Bioinformatics , 185–193 [DOI] [PubMed] [Google Scholar]
- 34.Tusher V. G., Tibshirani R., Chu G. (2001) Significance analysis of microarrays applied to the ionizing radiation response. Proc. Natl. Acad. Sci. U. S. A. , 5116–5121 [DOI] [PMC free article] [PubMed] [Google Scholar]
- 35.Soukas A., Cohen P., Socci N. D., Friedman J. M. (2000) Leptin-specific patterns of gene expression in white adipose tissue. Genes Dev. , 963–980 [PMC free article] [PubMed] [Google Scholar]
- 36.Saeed A. I., Sharov V., White J., Li J., Liang W., Bhagabati N., Braisted J., Klapa M., Currier T., Thiagarajan M., Sturn A., Snuffin M., Rezantsev A., Popov D., Ryltsov A., Kostukovich E., Borisovsky I., Liu Z., Vinsavich A., Trush V., Quackenbush J. (2003) TM4: a free, open-source system for microarray data management and analysis. BioTechniques , 374–378 [DOI] [PubMed] [Google Scholar]
- 37.Melamed D., Pnueli L., Arava Y. (2008) Yeast translational response to high salinity: global analysis reveals regulation at multiple levels. RNA , 1337–1351 [DOI] [PMC free article] [PubMed] [Google Scholar]
- 38.Dever T. E. (2002) Gene-specific regulation by general translation factors. Cell , 545–556 [DOI] [PubMed] [Google Scholar]
- 39.Moraes M. C., Jesus T. C., Hashimoto N. N., Dey M., Schwartz K. J., Alves V. S., Avila C. C., Bangs J. D., Dever T. E., Schenkman S., Castilho B. A. (2007) Novel membrane-bound eIF2alpha kinase in the flagellar pocket of Trypanosoma brucei. Eukaryot. Cell , 1979–1991 [DOI] [PMC free article] [PubMed] [Google Scholar]
- 40.Clayton C., Shapira M. (2007) Post-transcriptional regulation of gene expression in trypanosomes and leishmanias. Mol. Biochem. Parasitol. , 93–101 [DOI] [PubMed] [Google Scholar]
- 41.Bozdech Z., Llinas M., Pulliam B. L., Wong E. D., Zhu J., DeRisi J. L. (2003) The transcriptome of the intraerythrocytic developmental cycle of Plasmodium falciparum. PLoS Biol. , E5. [DOI] [PMC free article] [PubMed] [Google Scholar]
- 42.Le Roch K. G., Johnson J. R., Florens L., Zhou Y., Santrosyan A., Grainger M., Yan S. F., Williamson K. C., Holder A. A., Carucci D. J., Yates J. R., Winzeler E. A. (2004) Global analysis of transcript and protein levels across the Plasmodium falciparum life cycle. Genome Res. , 2308–2318 [DOI] [PMC free article] [PubMed] [Google Scholar]
- 43.Hall N., Karras M., Raine J. D., Carlton J. M., Kooij T. W., Berriman M., Florens L., Janssen C. S., Pain A., Christophides G. K., James K., Rutherford K., Harris B., Harris D., Churcher C., Quail M. A., Ormond D., Doggett J., Trueman H. E., Mendoza J., Bidwell S. L., Rajandream M. A., Carucci D. J., Yates J. R., Kafatos F. C., Janse C. J., Barrell B., Turner C. M., Waters A. P., Sinden R. E. (2005) A comprehensive survey of the Plasmodium life cycle by genomic, transcriptomic, and proteomic analyses. Science , 82–86 [DOI] [PubMed] [Google Scholar]
Associated Data
This section collects any data citations, data availability statements, or supplementary materials included in this article.