

Abstract
Multiple recent pharmacological clinical trials in neuropathic pain have failed to show beneficial effect of drugs with previously demonstrated efficacy, and estimates of drug efficacy seems to have decreased with accumulation of newer trials. However, this has not been systematically assessed. Here we analyze time-dependent changes in estimated treatment effect size in pharmacological trials together with factors that may contribute to decreases in estimated effect size. This study is a secondary analysis of data from a previous published NeuPSIG systematic review and meta-analysis, updated to include studies published up till March 2017. We included double-blind, randomized, placebo-controlled trials examining the effect of drugs for which we had made strong or weak recommendations for use in neuropathic pain in the previously published review. As the primary outcome, we used an aggregated number needed to treat (NNT) for 50% pain reduction (alternatively 30% pain reduction or moderate pain relief). Analyses involved 128 trials. NNT values increased from around 2–4 in trials published between 1982 and 1999 to much higher (less effective) values in studies published from 2010 onwards. Several factors that changed over time, such as larger study size, longer study duration, and more studies reporting 50% or 30% pain reduction correlated with the decrease in estimated drug effect sizes. This suggests that issues related to the design, outcomes and reporting have contributed to changes in the estimation of treatment effects. These factors are important to consider in design and interpretation of individual study data and in systematic reviews and meta-analyses.
Keywords: Neuropathic pain, clinical trial, numbers needed to treat, placebo response, trial design
1. Introduction
Neuropathic pain is pain caused by a lesion or disease affecting the somatosensory nervous system, and affects 6–8% of the general adult population [15;31]. Neuropathic pain is associated with a negative impact on quality of life and a relatively modest efficacy response to existing drugs [28;29]. In a recent systematic review and meta-analysis, which provided the basis for the latest recommendations on neuropathic pain pharmacotherapy [6], we demonstrated quite unfavorable effect sizes, with higher numbers needed to treat (NNT) for most neuropathic pain medications than with the NNT in previous systematic reviews [5;7]. NNT values for the most effective therapies tend to be in the region of 5–7 for drugs such as duloxetine, gabapentin, and pregabalin, for which most data are available. This means that only a minority of people with moderate or severe neuropathic pain achieve a clinically meaningful pain outcome.
This apparent decrease in estimates of clinical drug efficacy is of concern, considering multiple recent negative clinical trials in neuropathic pain with drugs that either showed potential in preclinical studies or where previous positive trials existed [1;26]. Similar concerns have been raised in the literature on major depressive disorders and schizophrenia, where the results of randomized controlled trials (RCTs) are highly variable and many trials fail to show an effect of drugs that have previously proven effective [13;16;17]. There may be several explanations for this apparent decrease in drug effect size in trials over time, such as more stringent study design and larger studies, increased magnitude of the placebo response, or publication or time-lag bias [3;12;24]. Systematical analysis of this issue is therefore necessary. We need to understand how to better design future trials. The treatment Committee of the Special Interest Group on Neuropathic Pain (NeuPSIG) of the International Association for the Study of Pain therefore performed an exploratory analysis of neuropathic pain trials comparing first-, second-, and third-line treatment options to placebo [6] in order to analyze changes in NNT and to identify potential factors that could contribute to this apparent increase in NNT. The results of this analysis should help understand how to better design future trials in neuropathic pain.
2. Material and methods
This is a secondary exploratory analysis of a published systematic review and meta-analysis of studies published between 1982 and 2014 [6] supplemented with studies published after 2014. In the published systematic review, we included double-blind, randomized, placebo-controlled trials (RCTs) lasting at least 3 weeks with at least 10 patients per group, that examined the effect of drugs for use in neuropathic pain and reported results up to January 2014 [6]. Included RCTs were identified via searches of the PubMed and EMBASE databases, the Cochrane Central Register of Controlled Trials, and via the WHO Registry Network and registries approved by the International Committee of Medical Journal Editors (ICMJE) [6]. Based on the Grading of Recommendations Assessment, Development, and Evaluation (GRADE), we assigned weak or strong recommendations for or against a drug or drug class’s use. For this study, we performed an additional free text search of recommended drugs in PubMed and clinicaltrials.gov including studies up to March 2017 (Fig. 1).
Figure 1.
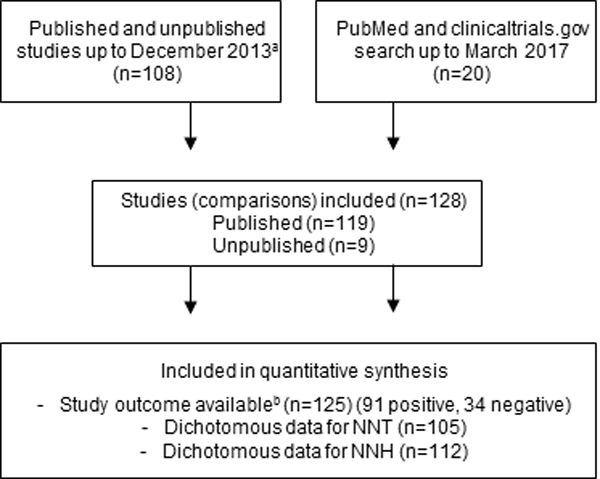
Flowchart of study selection. Number of studies indicate number of comparisons of a drug against placebo. aPlease see PRISMA flowchart in Finnerup, Attal et al. 2015 [6], bStudy outcome based on the primary outcome.
2.1. Outcomes
Our primary outcome of interest was NNT. NNT was calculated as the inverse of the risk difference with the fixed-effects Mantel-Haenszel method [10;11;21]. We also undertook cumulative analysis of NNT, in which the final value corresponds to random effects (DerSimonian-Laird) analysis. The number of responders was based on the number of patients with ≥50% pain intensity reduction if reported, otherwise ≥30% pain reduction, or alternatively at least moderate (or similar) pain relief. Other data extracted were: (1) trial outcome (positive or negative study, based on the effect on the primary outcome measure); (2) year of publication (for illustration categorized in periods 1982–1999, 2000–2004, 2005–2009, 2010–2013, and 2014–2017); (3) study design (parallel or crossover); (4) study size (number of patients randomized to active drug treatment); (5) treatment duration in weeks (duration of each treatment arm in crossover trials); (6) study quality (The Oxford Quality Scale, also known as Jadad scale, which scores whether randomization and blinding is described appropriately and if there is a description of dropouts and withdrawals (scores ranged from 2–5, with higher scores denoting higher quality [14]); (7) number needed to harm (NNH) for number of patients who needed to be treated for one patient to drop out of the trial because of adverse events; (8) whether the estimation of the primary outcome was stated to be based on intention-to-treat (ITT) analysis or not; (9) whether any concomitant treatment other than rescue medication was allowed; (10) whether inert or active placebo was used; (11) Patient Global Impression of Change (PGIC) and (12) pain condition(s) under treatment.
2.2. Statistical analysis
In order to test if there was a change in effect size of drugs in clinical trials in neuropathic pain from 1982 to 2017, we calculated the correlation between the effect size and publication year using Spearman’s correlation coefficient. To assess the correlation between effect size and publication year and the above mentioned variables, we also calculated the pairwise correlation between two variables using Spearman’s correlation coefficients. Positive correlations between the effect size and publication year and any of the above variables would indicate that these variables may contribute at least partially to the change over time. In correlation analyses publication year for unpublished studies was arbitrarily set to one year after the results were posted (2007–2016), and we used the Risk Difference (RD, NNT=1/RD)) instead of NNT due to problems with infinite and negative values for NNT when RD is negative or zero. In order to take the uncertainty on the estimates of RD into account, we performed a linear regression analysis with RD as the dependent variable and publication year as independent variable where the studies were weighted by 1/se2 (se: standard error of the estimated RD). Due to collinearity between variables, we did not perform multiple regression analysis [30]. Statistical analysis was performed with SPSS version 20 (IBM SPSS Statistics 20).
3. Results
We included 118 studies with 128 comparisons of a drug against placebo. We added 20 additional trials published between 2014 and March 2017 to the 108 trials between 1982 and 2013 (Fig. 1)(references in supplementary material). Of the 128 trials, 125 provided information on trial outcome, 91 trials were positive and 34 negative, and 105 and 112 trials provided dichotomous values for NNT and NNH, respectively (Fig. 1). Most studies included patients with painful diabetic polyneuropathy (n=44) or postherpetic neuralgia (n=28), 14 studies examined central neuropathic pain, 10 peripheral nerve injury, 8 mixed painful polyneuropathy, 7 painful HIV polyneuropathy, and 17 mixed or other neuropathic pain conditions. Pregabalin was studied in 33 trials, tricyclic antidepressants in 22, serotonin-noradrenalin reuptake inhibitors in 18, gabapentin in 13, strong opioids in 11, botulinum-toxin type A in 8, capsaicin 8% patch in 8, tramadol in 7, gabapentin extended release or enacarbil in 6, and lidocaine 5% patch in 2 trials (comparisons to placebo). The 8 unpublished studies with 9 comparisons with placebo, included patients with painful diabetic polyneuropathy (n=8) and postherpetic neuralgia (n=1) and with pregabalin in 4, and amitriptyline, desvenlafaxine, duloxetine, gabapentin, and oxycodone in 1 trial each.
3.1. Change in trial outcome based on year of publication
Combining all drugs and all pain conditions, NNT increased over time from 1982 to 2017 (Supplementary fig. 1) from around 1.6–3.0 to a final NNT of 7.2 (6.7–7.9) (Spearman’s Rho = 0.51, P < 0.001). Taking into account the standard error of the risk difference, there was also a statistically significant slope in the linear regression between publication year and the risk difference (inverse of NNT) (P = 0.0006). There was also a significant correlation between the year of publication and NNT when only those studies that were positive on the primary outcome were analyzed (Spearman’s Rho = 0.52, P <0.001). The combined NNT per year increased gradually with a step between 1991 and 1997 and in the mid-2000s and then stabilized after around 2008–2010 (Fig. 2, Supplementary fig. 1).
Figure 2.
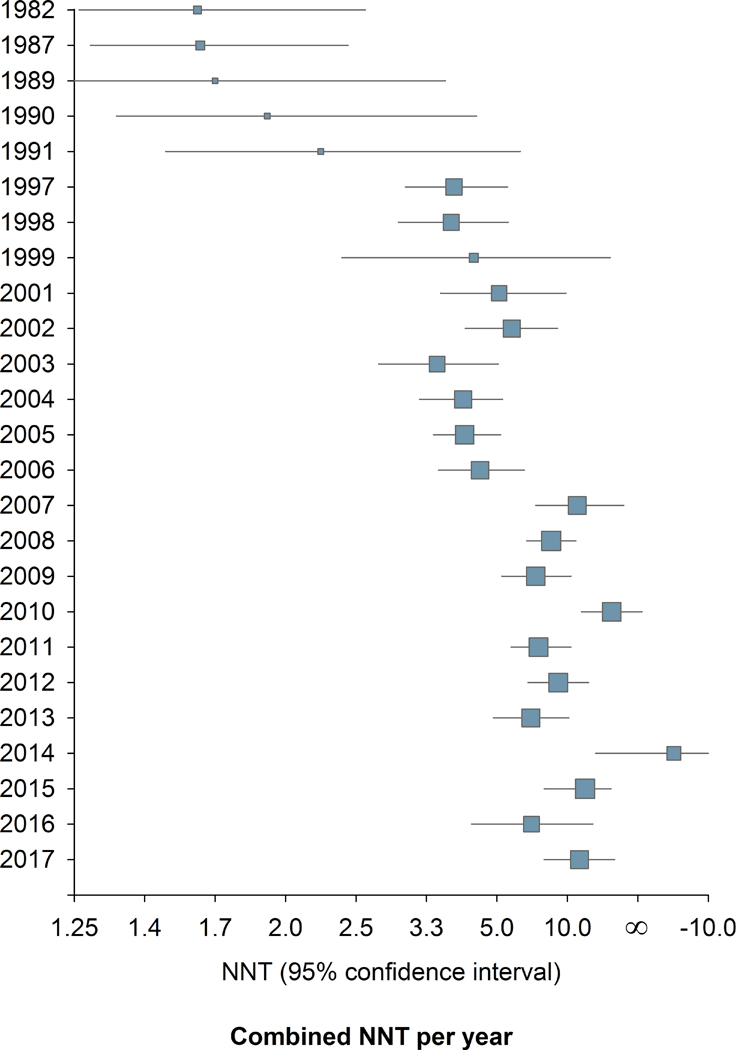
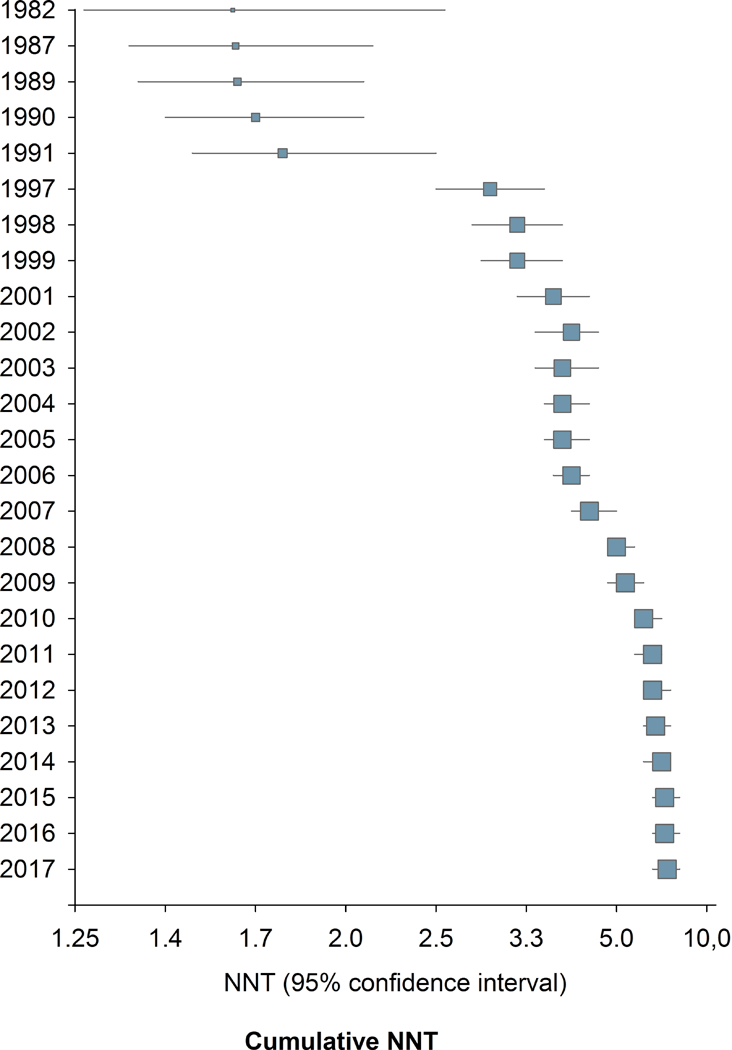
Change in study outcome over time. 2a. Combined NNT (random effect) per year. 2b. Cumulative NNT (random effect). 105 studies provided dichotomous data for NNT calculation.
3.2. Factors associated with NNT values and publication year
Correlation analysis showed that larger study size, longer study duration, and higher placebo responses were related to both more recent publication and higher NNT (lower RD) (Figs. 3 and 4, Supplementary table 1a). Studies where outcomes were based on ITT analysis (which was reported to have been done in 93% of parallel and 28% of crossover design studies), 30% or 50% pain reduction (compared to pain relief or unknown scales), and/or which had higher Oxford quality scores were also published later and had higher NNT (Figs. 3 and 4, Supplementary table 1a). Similarly, lower active drug responses and studies with parallel group design (compared to crossover studies) were published more recently and had higher NNT values (Supplementary table 1a). Importantly, most of these factors were highly correlated, e.g. parallel-group design studies more often reported ITT analysis than crossover studies; larger studies had higher placebo responses, were of longer duration, and more often reported 30 or 50% pain reduction, etc. (Supplementary table 1a).
Figure 3.
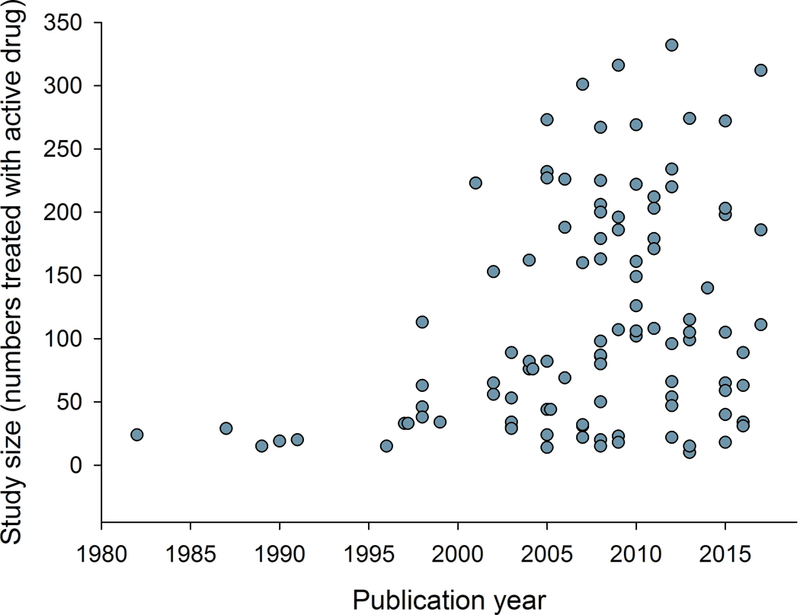
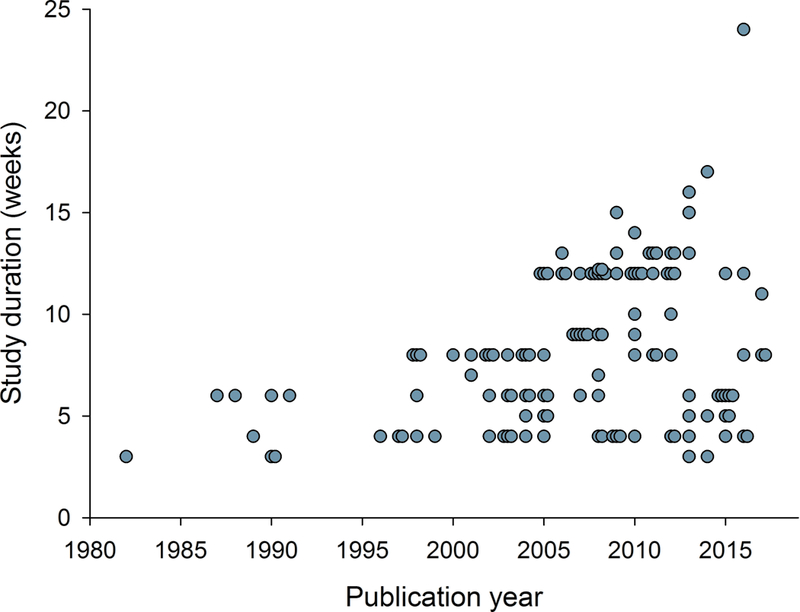
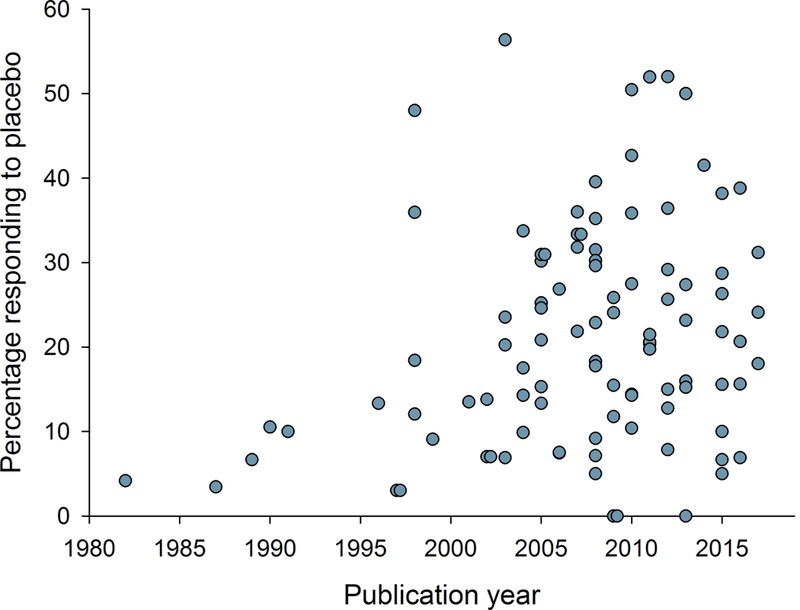
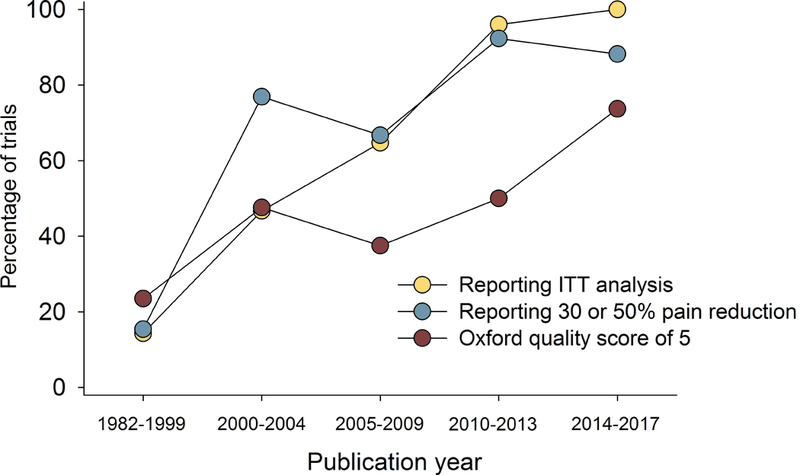
Relation between publication year and a) study size (number of patients treated with active drug in individual studies), b) study duration, c) placebo response, and d) percentage of studies reporting intention-to-treat (ITT) analysis, 30 or 50% pain reduction for outcome NNT calculation, and with a high quality score (Oxford scale). Publication year for unpublished studies was arbitrarily set to one year after the results were posted.
Figure 4.
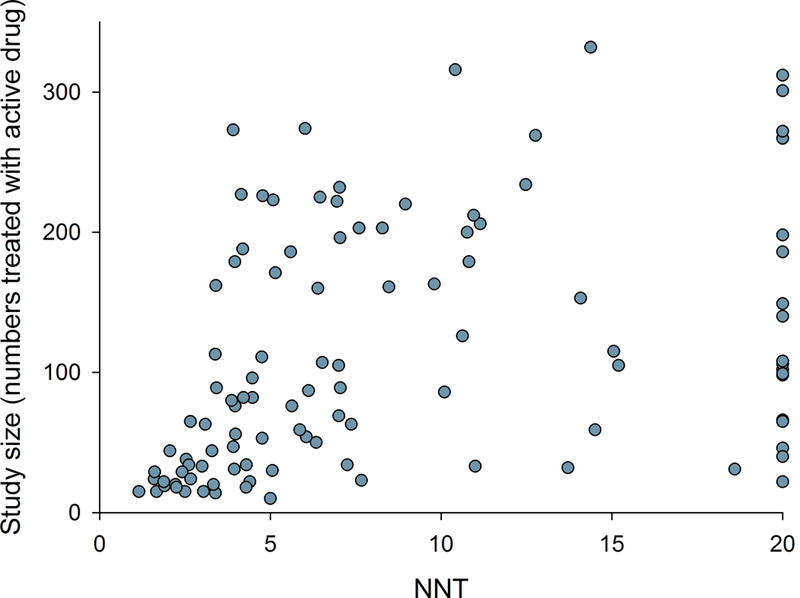
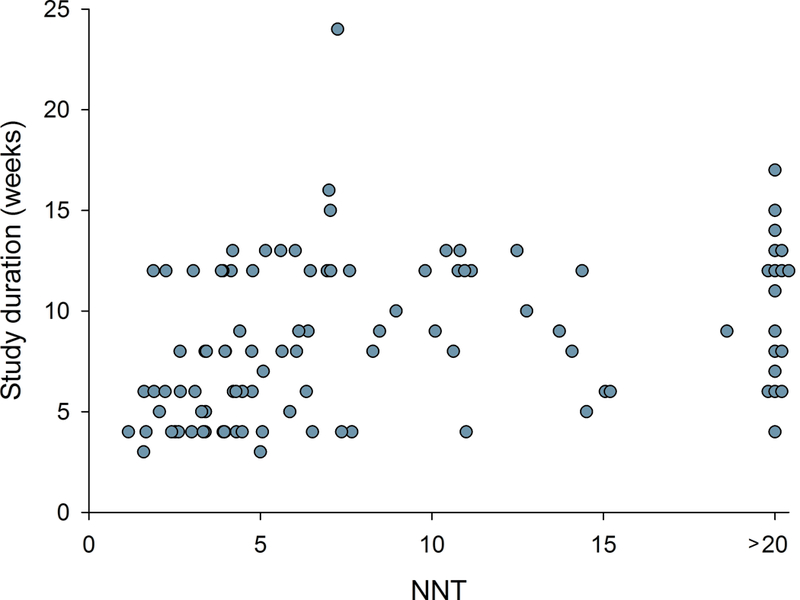
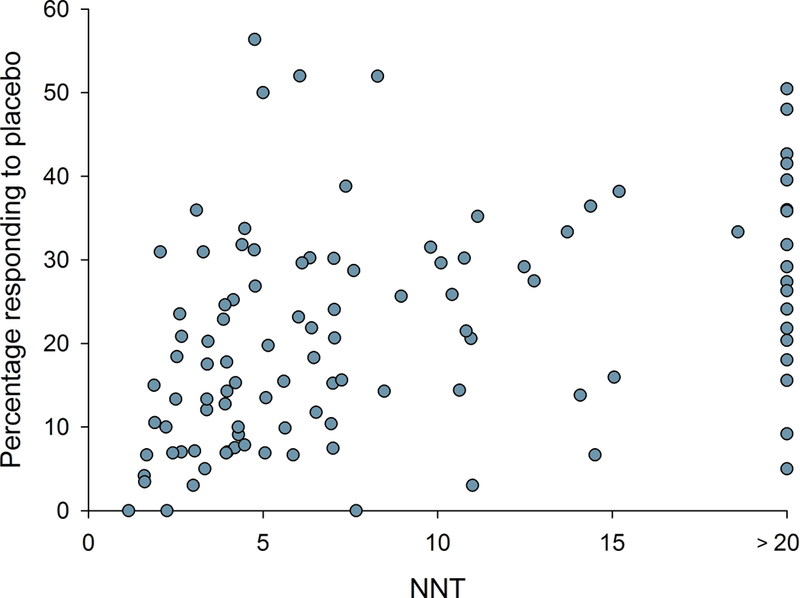
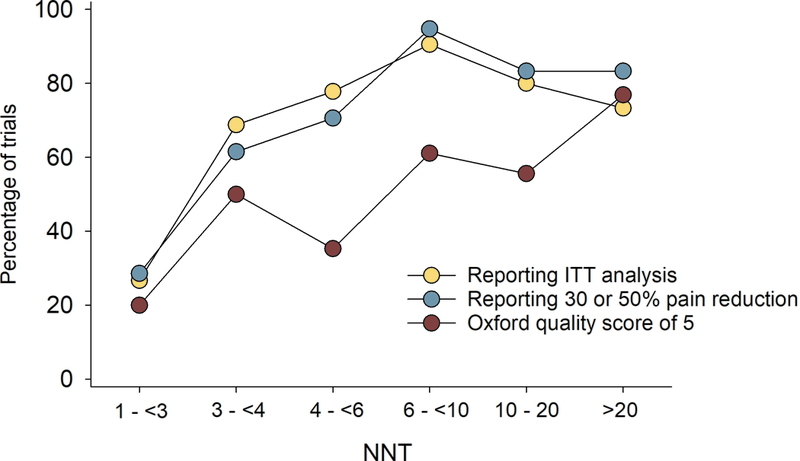
Relation between NNT in individual studies and a) study size (number of patients treated with active drug in individual studies), b) study duration, c) placebo response, and d) percentage of studies reporting intention-to-treat (ITT) analysis, 30 or 50% pain reduction for outcome NNT calculation, and with a high quality score (Oxford scale)
NNT values based on 50% pain reduction did not differ significantly from NNT values based on 30% pain reduction (Spearman’s Rho = −0.02, P = 0.89). The use of an inert or active placebo did not change over time, and there was no significant difference in NNT values in studies using an inert or active placebo (Supplementary table 1a). Similarly, there was no difference in NNT values over time between studies allowing and not allowing concomitant treatment with other analgesics (Supplementary table 1a, Supplementary fig. 2). NNHs increased over time, but there was no significant change in the percentage who dropped out during active or placebo treatment due to side effects (Supplementary table 1a). In newer studies published from 2008 and beyond (n=71), the NNT correlated to study size, duration, and quality, and placebo response.
We conducted additional analysis in parallel design studies (Supplementary table 1b). All the factors mentioned above were related to higher NNT except studies where outcomes were based on ITT analysis and 30% or 50% pain reduction as outcome measures, which were all more recent (Supplementary table 1b). In studies where NNT based on both 30% or 50% pain reduction and PGIC could be calculated, there was a tendency that NNT was lower when based on PGIC (Supplementary table 2).
3.3. Drug classes and pain conditions
Figure 5 illustrates the change in NNT over time for each drug class. While not part of our planned analysis, we observed that NNT values were affected by the maximum dose administered in a trial. When only pregabalin studies with maximum daily doses up 600 mg were included, NNT were lower (Supplementary fig. 3). Several recent trials assessing pregabalin as a positive control only used a maximum daily dose of 300 mg compared to many earlier trials using 600 mg. Drug dose may be important for other drug and drug classes also, but too few trials provided this information for other drugs than pregabalin. Tricyclic antidepressants were studied mainly in early trials (Supplementary fig. 4A) and the number of patients responding to active drug and placebo for each drug class are illustrated in Supplementary figure 4B. Cumulative NNT for tricyclic antidepressants, serotonin-noradrenaline reuptake inhibitors and pregabalin in daily doses up to 600 mg are illustrated in Supplementary figure 5. There was no clear change in pain conditions examined over time, and NNT were similar across pain conditions, except for a tendency for high NNT in studies of painful polyneuropathy due to HIV, which also had high placebo responses (Supplementary fig. 6). Supplementary fig. 7 illustrates the NNT for each drug class for each of the pain conditions. The majority of trials that form the basis for treatment recommendations are performed in peripheral neuropathic pain.
Figure 5.
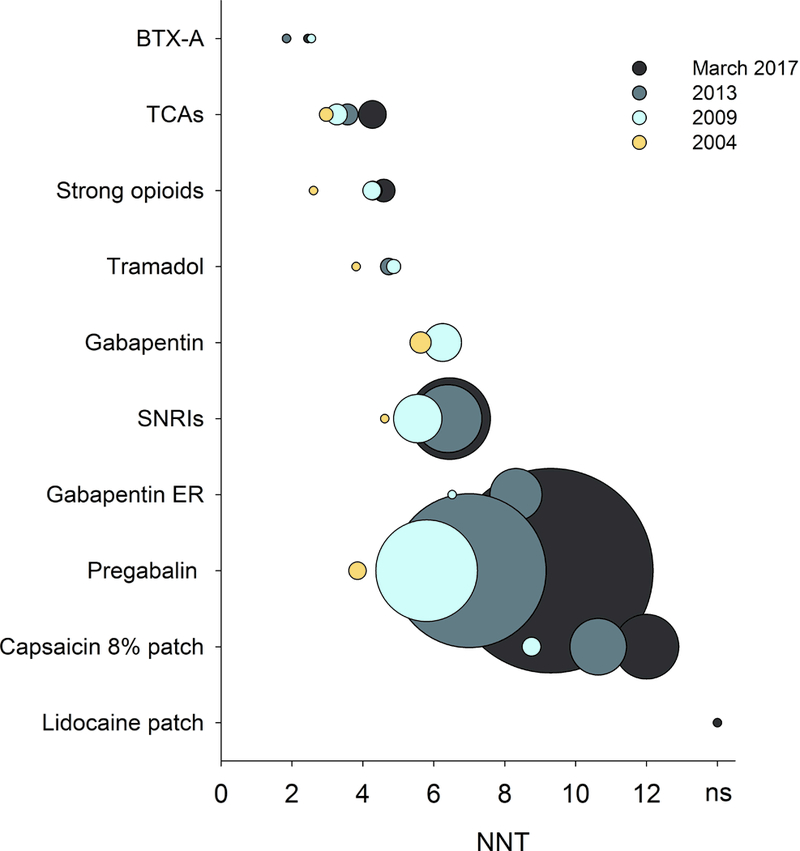
Combined NNT values (fixed-effects Mantel-Haenszel method) for various drug classes in all central and peripheral neuropathic pain conditions for drug classes recommended for the treatment of neuropathic pain. The circle sizes indicate the relative number of patients who received active treatment drugs in studies for which dichotomous data were available. BTX-A: botulinum toxin type A; TCAs: tricyclic antidepressants; SNRIs: serotonin-noradrenaline reuptake inhibitors; Gabapentin ER: Gabapentin extended release or enacarbil. Publication year for unpublished studies was arbitrarily set to one year after the results were posted.
3.4. Placebo responses
The weak correlation between placebo response and publication year was mainly caused by low placebo responses in very early trials. For example, as can be seen from figure 3c, studies published before 1996 all had low placebo responses, and including only studies published after 1995, there was no statistically significant increase in placebo responses in trials with increasing publication year (Spearman’s Rho = 0.10, P = 0.31). Similarly, there was no correlation between placebo response and publication year, if only studies that reported 30% or 50% pain reduction were included (Spearman’s Rho = 0.18, P = 0.13), nor, as discussed above, if only parallel group design studies were included. The correlation between placebo response and NNT did, however, persist after excluding studies before 1996 and studies that did not report 30 or 50% pain reduction (Spearman’s Rho > 0.40, P < 0.001). Large sample size and long study duration correlated with high placebo responses and parallel design studies had higher placebo responses than crossover studies (Supplementary table 1a). As can be seen from the L’Abbé plot in figure 6, studies that were negative on the primary outcome had both low and high placebo responses. While 83% of trials with a placebo response rate lower than 30% were positive on the primary outcome (i.e. showed superiority of the study drug over placebo), only 52% of trials with a placebo response rate above 30%, and 33% of trials with a placebo response above 33%, were positive on the primary outcome.
Figure 6.
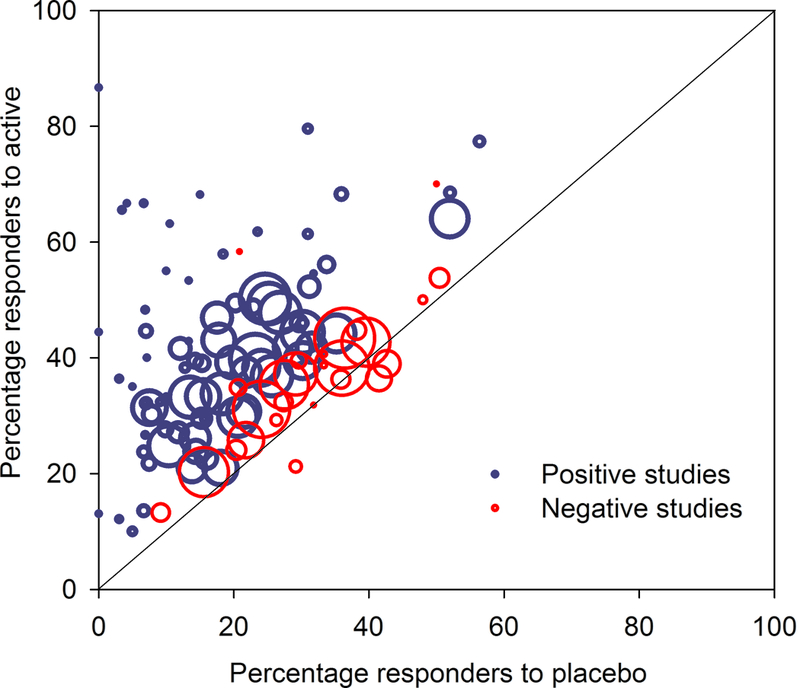
L’Abbé plot of all studies. This plots the percentage of responders to active drug against the percentage of responders to placebo. Trials in which the active drug is better than the placebo (using a dichotomous outcome for NNT calculation) are in the upper left (above the line), while studies where placebo is better than the active drug are in the lower right (below the line). Studies that were positive on the primary outcome (showed superiority of the study drug over placebo) are indicated with blue circles and studies that were negative are indicated with red circles. The x-axis shows percentage of patients in each study who responded to placebo with 50% pain reduction (alternatively 30% pain reduction or moderate pain relief) and the y-axis shows the percentage who responded to active drug. Circle size indicates relative study size (number of patients treated with active drug).
4. Discussion
The major finding from the present study was that estimated effect size of drug trials for neuropathic pain decreased from 1982 to 2017, with increases in overall NNT and NNT per drug class. This decrease was apparent until 2010 then the effect size tended to stabilize. Importantly, this change over time was paralleled by changes in study design. More specifically larger sample size, longer study duration, better reporting of randomization and blinding, ITT analysis and more complete reporting of efficacy (ie the use of 30 % or 50 % pain reduction as outcome measures) were all significantly associated with reduced effect size. In contrast, there was no difference in effect size whether NNT was based on 30% or 50% pain reduction, which is in line with studies in acute pain [23;25]. Similarly the use of concomitant medication did not affect effect size.
The increase in placebo response over time was explained mainly by low placebo responses in very early trials. It is possible that the placebo responses are less associated with trial failure than previously thought [8;19]. We did, however, find a reduced percentage of positive trial outcomes in studies with more than 30% placebo responders (although there are statistical explanations for such associations [27]). This is in line with studies of bipolar disorders [12] and depression [13;18], where a placebo response rate greater than 30% showed greatly reduced drug-placebo separation, supporting the suggestion that such trials might be considered failed or uninformative rather than negative trials.
The changes in NNT and study design over time may be seen in light of the evolution in the standards for RCTs. Our understanding of biases has improved and along with changes in requirements from regulatory bodies, the standards for RCTs have changed. While early studies were typically small single-center crossover trials, a change in NNT appeared when large gabapentin trials were published, which pioneered a shift in trial design towards larger parallel group trials of longer duration and with multiple sites. In the mid-2000s, the FDA began to require a 12-week duration for phase 3 trials and clinical trials in the US migrated from academic medical centers to commercial centers in the community that conduct trials across many therapeutic areas, which may have influenced the second jump in NNT. The question is what is the “true NNT”. In early trials, the use of per-protocol-analysis and lack of reporting of 30% or 50% reduction in pain intensity may have overestimated the treatment effect (underestimated the NNT). In later trials, however, there may be an underestimation of the effect size. Although not analyzed in this study, it has been suggested that large multi-center trials may have a less careful patient selection and study implementation and integrity, which may underestimate treatment effects, because of the introduction of a higher rate of underlying variability [16;20]. Recruitment pressures at commercial sites and limited access to health care may also result in inflation of baseline scores and high placebo responses. Therefore, investigator and patient training and improved diagnostic accuracy and assessment, as well as implementation of methods to secure patient adherence have been advocated to improve trial assay sensitivity [16;22].
Several limitations of this study should be acknowledged. Although the study included all high-quality pharmacotherapy trials with 1st-3rd line agents in neuropathic pain, there were too few studies regarding each drug or each pain conditions to allow testing interactions, the role of different drug doses or the role of fixed versus flexible dosing, and to allow examining each drug separately rather than lumping different drugs into drug classes. Because of the collinearity between factors, regression analyses were not feasible. Therefore, the presentation of the associations between factors is mainly descriptive and does not make it possible to identify whether variables independently explain the changes over time. A previous study using standardized effect size, which is the ratio of the treatment effect and the within-group standard deviation, did not find an association between publication year and standardized effect size [3], and it is possible that the decrease in estimated effect sizes with increasing publication year is partly related to the use of NNT as the primary outcome. There are limitations to the use of NNT as a summary measure of treatment effect, and other analyses using risk rations, standardized effect sizes or other measures may be relevant to consider in systematic reviews. Using other outcomes such as PGIC, pain relief, quality of life and pain impact, may, however, have yielded somewhat different results. Outcomes based on PGIC or pain relief may result in lower NNTs than outcomes based on reduction in pain intensity, and these types of sensitivity analyses should be encouraged in future trials. We did not have access to single-patient data and may not have extracted all factors that could be associated with the study outcome, such as number of study sites, pain duration, compliance, comorbidities, age, and number of treatments tried before the trial, which may affect assay sensitivity [2–4]. Some of the factors included were not always clearly described in the papers. For example, ITT analysis may be mislabeled and is difficult to estimate in crossover trials [9], and too few studies used baseline observation carried forward methods to examine the impact of imputation method. Also, several possible important factors were rarely assessed or reported in the publications, such as patient expectation, pain characteristics and serum drug concentrations. We did not identify unpublished studies before 2007, and it is likely that several unpublished studies exist, although our primary analysis suggested minimal publication bias [6]. The correlation between year of publication and NNT persisted even if unpublished or negative trials were not included, suggesting that the increase in NNT over time was not only due to publication bias or delays in publication. Lastly, the drugs may have been included in trials for different purposes, e.g. establishing whether there was an effect of the drug over placebo in a given condition, to evaluate predictors for response, or to have an active control for an investigational drug, and not all were designed to measure the magnitude of an overall treatment effect.
5. Conclusion
We examined the changes in effect sizes of neuropathic pain clinical trials in the past 35 years. Across all drug classes, the NNT has increased (estimated drug effect size decreased) over time, with stabilization around 2010. Altered study design methodology with larger study size and duration, as well as changes in reporting of outcomes paralleled this decrease in overall estimated drug effect sizes. Except for very low placebo responses in early trials, placebo responses did not increase over time, but high placebo responses were generally associated with higher NNTs. Our analysis supports the suggestions that systematic reviews and meta-analyses should go beyond the aggregate findings of a meta-analysis and carefully look at all characteristics of the individual studies. Developing alternative study designs and studying phenotype-specific drug effects may lead to improved drug development in the future. Thus to increase our understanding and to improve treatment, future studies should record detailed patient characteristics at baseline and meta-analysis should preferably be made on patient-level data.
Supplementary Material
Footnotes
Conflicts of interest statement
NA received speakers fee from Pfizer and reported consultant fees from Novartis, Teva, Grünenthal, Mundipharma, Sanofi Pasteur, Aptynix. RB received speakers or consultancy fees from Pfizer, Genzyme GmbH, Grünenthal GmbH, Mundipharma, Allergan, Sanofi Pasteur, Medtronic, Eisai, Lilly GmbH, Boehringer Ingelheim Pharma GmbH&Co.KG, Astellas, Novartis, Bristol-Myers Squibb, Biogenidec, AstraZeneca, Merck, Abbvie, Daiichi Sankyo, Glenmark Pharmaceuticals, Seqirus, Teva Pharma, Genentech, Galapagos NV, Kyowa Kirin GmbH, Vertex Pharmaceuticals Inc., Biotest AG, Celgene, Densitin, Bayer-Schering, MSD, TAD Pharma GmbH, and research support from Pfizer, Genzyme GmbH, Grünenthal GmbH, Mundipharma. RB is member of the EU Project No 633491: DOLORisk. Member of the IMI „Europain” collaboration and industry members of this are: Astra Zeneca, Pfizer, Esteve, UCB-Pharma, Sanofi Aventis, Grünen-thal GmbH, Eli Lilly and Boehringer Ingelheim Pharma GmbH&Co.KG, German Federal Ministry of Education and Research (BMBF), the ERA_NET NEURON / IM-PAIN Project (01EW1503), the German Research Network on Neuropathic Pain (01EM0903), NoPain system biology (0316177C) and the German Research Foundation (DFG). RHD has received in the past 36 months research grants and contracts from US Food and Drug Administration and US National Institutes of Health, and compensation from Abide, Adynxx, Aptinyx, Astellas, AstraZeneca, Biogen, Boston Scientific, Braeburn, Celgene, Centrexion, Chromocell, Concert, Coronado, Daiichi Sankyo, Dong-A, Eli Lilly, Eupraxia, Glenmark, Grace, Hope, Hydra, Immune, Johnson & Johnson, Medavante, Novartis, NSGene, Olatec, Periphagen, Pfizer, Phosphagenics, Quark, Reckitt Benckiser, Regenacy, Relmada, Sandoz, Semnur, Spinifex, Syntrix, Teva, Thar, Trevena, and Vertex. NBF has received honoraria for serving on advisory boards or speakers panels from Grünenthal, Teva Pharmaceuticals, Novartis Pharma, Astellas, and Mitshubishe Tanabe Pharma. IG has received support from Biogen, Adynxx, TARIS Biomedical, AstraZeneca, Pfizer, and Johnson and Johnson and has received grants from the Canadian Institutes of Health Research, Physicians’ Services Incorporated Foundation, and Queen’s University. SH has received a research grant from Pfizer Inc. MH received fees for consulting from Abbvies, Astellas, and Pfizer, and for lecturing from Astellas, Mundipharma, and Pfizer. TSJ received speakers or consultancy fees from Pfizer, Mundipharma, Daichi-Sankyo, Novartis, Orion Pharma and Biogen. PK has received payment for consultancy work or as a speaker for Janssen Pharmaceutica, Partners in Research, and Reckitt Benckiser. AM has received grant support from Grünenthal and Novartis and has received honoraria for attending boards with RB and honoraria from Omega Pharma and Futura Pharma. SNR has served on advisory boards for Allergan, Aptinyx, and Daichi-Sankyo. SNR is supported by an NIH grant- NS26363. ASCR has received funding from Orion Pharma, and undertakes consultancy and advisory board work for Imperial College Consultants in the last 12 months this has included remunerated work for: Merck, Galapagos, Toray, Quartet, Lateral, Novartis and Orion. ASCR was the owner of share options in Spinifex Pharmaceuticals from which personal benefit accrued upon the acquisition of Spinifex by Novartis in July 2015 and from which future milestone payments may occur. ASCR is named as an inventor on patents related to N-(2-propenyl) hexadecanamide and related amides and inhibition of vgf activity. NTA, BHS, EM, and ES have no conflicts of interests.
References
- [1].Bartfai T, Lees GV. Pharma TARP: a troubled asset relief program for novel, abandoned projects in the pharmaceutical industry. ScientificWorldJournal 2011;11:454–457. [DOI] [PMC free article] [PubMed] [Google Scholar]
- [2].Dworkin RH, Turk DC, Peirce-Sandner S, Burke LB, Farrar JT, Gilron I, Jensen MP, Katz NP, Raja SN, Rappaport BA, Rowbotham MC, Backonja MM, Baron R, Bellamy N, Bhagwagar Z, Costello A, Cowan P, Fang WC, Hertz S, Jay GW, Junor R, Kerns RD, Kerwin R, Kopecky EA, Lissin D, Malamut R, Markman JD, McDermott MP, Munera C, Porter L, Rauschkolb C, Rice AS, Sampaio C, Skljarevski V, Sommerville K, Stacey BR, Steigerwald I, Tobias J, Trentacosti AM, Wasan AD, Wells GA, Williams J, Witter J, Ziegler D. Considerations for improving assay sensitivity in chronic pain clinical trials: IMMPACT recommendations. Pain 2012;153:1148–1158. [DOI] [PubMed] [Google Scholar]
- [3].Dworkin RH, Turk DC, Peirce-Sandner S, He H, McDermott MP, Farrar JT, Katz NP, Lin AH, Rappaport BA, Rowbotham MC. Assay sensitivity and study features in neuropathic pain trials: an ACTTION meta-analysis. Neurology 2013;81:67–75. [DOI] [PMC free article] [PubMed] [Google Scholar]
- [4].Fanelli D, Costas R, Ioannidis JP. Meta-assessment of bias in science. Proc Natl Acad Sci U S A 2017;114:3714–3719. [DOI] [PMC free article] [PubMed] [Google Scholar]
- [5].Finnerup NB, Otto M, McQuay HJ, Jensen TS, Sindrup SH. Algorithm for neuropathic pain treatment: an evidence based proposal. Pain 2005;118:289–305. [DOI] [PubMed] [Google Scholar]
- [6].Finnerup NB, Attal N, Haroutounian S, McNicol E, Baron R, Dworkin RH, Gilron I, Haanpaa M, Hansson P, Jensen TS, Kamerman PR, Lund K, Moore A, Raja SN, Rice AS, Rowbotham M, Sena E, Siddall P, Smith BH, Wallace M. Pharmacotherapy for neuropathic pain in adults: a systematic review and meta-analysis. Lancet Neurol 2015;14:162–173. [DOI] [PMC free article] [PubMed] [Google Scholar]
- [7].Finnerup NB, Sindrup SH, Jensen TS. The evidence for pharmacological treatment of neuropathic pain. Pain 2010;150:573–581. [DOI] [PubMed] [Google Scholar]
- [8].Furukawa TA, Cipriani A, Leucht S, Atkinson LZ, Ogawa Y, Takeshima N, Hayasaka Y, Chaimani A, Salanti G. Is placebo response in antidepressant trials rising or not? A reanalysis of datasets to conclude this long-lasting controversy. Evid Based Ment Health 2018;eb-102827. [DOI] [PMC free article] [PubMed] [Google Scholar]
- [9].Gewandter JS, McDermott MP, McKeown A, Smith SM, Pawlowski JR, Poli JJ, Rothstein D, Williams MR, Bujanover S, Farrar JT, Gilron I, Katz NP, Rowbotham MC, Turk DC, Dworkin RH. Reporting of intention-to-treat analyses in recent analgesic clinical trials: ACTTION systematic review and recommendations. Pain 2014;155:2714–2719. [DOI] [PubMed] [Google Scholar]
- [10].Greenland S, Robins JM. Estimation of a common effect parameter from sparse follow-up data. Biometrics 1985;41:55–68. [PubMed] [Google Scholar]
- [11].Higgins JPT, Green S. Cochrane Handbook for Systematic Reviews of Interventions Version 5.1.0 [updated march 2011]. The Cochrane Collaboration, 2011. Available from www.cochrane-handbook.org 2010. [Google Scholar]
- [12].Iovieno N, Nierenberg AA, Parkin SR, Hyung Kim DJ, Walker RS, Fava M, Papakostas GI. Relationship between placebo response rate and clinical trial outcome in bipolar depression. J Psychiatr Res 2016;74:38–44. [DOI] [PubMed] [Google Scholar]
- [13].Iovieno N, Papakostas GI. Correlation between different levels of placebo response rate and clinical trial outcome in major depressive disorder: a meta-analysis. J Clin Psychiatry 2012;73:1300–1306. [DOI] [PubMed] [Google Scholar]
- [14].Jadad AR, Moore RA, Carroll D, Jenkinson C, Reynolds DJ, Gavaghan DJ, McQuay HJ. Assessing the quality of reports of randomized clinical trials: is blinding necessary? Control Clin Trials 1996;17:1–12. [DOI] [PubMed] [Google Scholar]
- [15].Jensen TS, Baron R, Haanpaa M, Kalso E, Loeser JD, Rice AS, Treede RD. A new definition of neuropathic pain. Pain 2011;152:2204–2205. [DOI] [PubMed] [Google Scholar]
- [16].Kemp AS, Schooler NR, Kalali AH, Alphs L, Anand R, Awad G, Davidson M, Dube S, Ereshefsky L, Gharabawi G, Leon AC, Lepine JP, Potkin SG, Vermeulen A. What is causing the reduced drug-placebo difference in recent schizophrenia clinical trials and what can be done about it? Schizophr Bull 2010;36:504–509. [DOI] [PMC free article] [PubMed] [Google Scholar]
- [17].Khan A, Bhat A, Kolts R, Thase ME, Brown W. Why has the antidepressant-placebo difference in antidepressant clinical trials diminished over the past three decades? CNS Neurosci Ther 2010;16:217–226. [DOI] [PMC free article] [PubMed] [Google Scholar]
- [18].Khan A, Detke M, Khan SR, Mallinckrodt C. Placebo response and antidepressant clinical trial outcome. J Nerv Ment Dis 2003;191:211–218. [DOI] [PubMed] [Google Scholar]
- [19].Khan A, Fahl MK, Faucett J, Khan SS, Brown WA. Has the rising placebo response impacted antidepressant clinical trial outcome? Data from the US Food and Drug Administration 1987–2013. World Psychiatry 2017;16:181–192. [DOI] [PMC free article] [PubMed] [Google Scholar]
- [20].Liu KS, Snavely DB, Ball WA, Lines CR, Reines SA, Potter WZ. Is bigger better for depression trials? J Psychiatr Res 2008;42:622–630. [DOI] [PubMed] [Google Scholar]
- [21].Mantel N, Haenszel W. Statistical aspects of the analysis of data from retrospective studies of disease. J Natl Cancer Inst 1959;22:719–748. [PubMed] [Google Scholar]
- [22].McCann DJ, Petry NM, Bresell A, Isacsson E, Wilson E, Alexander RC. Medication Nonadherence, “Professional Subjects,” and Apparent Placebo Responders: Overlapping Challenges for Medications Development. J Clin Psychopharmacol 2015;35:566–573. [DOI] [PMC free article] [PubMed] [Google Scholar]
- [23].Moore RA, Edwards JE, McQuay HJ. Acute pain: individual patient meta-analysis shows the impact of different ways of analysing and presenting results. Pain 2005;116:322–331. [DOI] [PubMed] [Google Scholar]
- [24].Moore RA, Gavaghan D, Tramer MR, Collins SL, McQuay HJ. Size is everything--large amounts of information are needed to overcome random effects in estimating direction and magnitude of treatment effects. Pain 1998;78:209–216. [DOI] [PubMed] [Google Scholar]
- [25].Moore RA, McQuay HJ. Single-patient data meta-analysis of 3453 postoperative patients: oral tramadol versus placebo, codeine and combination analgesics. Pain 1997;69:287–294. [DOI] [PubMed] [Google Scholar]
- [26].Percie du SN, Rice AS. Improving the translation of analgesic drugs to the clinic: animal models of neuropathic pain. Br J Pharmacol 2014;171:2951–2963. [DOI] [PMC free article] [PubMed] [Google Scholar]
- [27].Senn S Importance of trends in the interpretation of an overall odds ratio in the meta-analysis of clinical trials. Stat Med 1994;13:293–296. [DOI] [PubMed] [Google Scholar]
- [28].Smith BH, Torrance N, Bennett MI, Lee AJ. Health and quality of life associated with chronic pain of predominantly neuropathic origin in the community. Clin J Pain 2007;23:143–149. [DOI] [PubMed] [Google Scholar]
- [29].Torrance N, Lawson KD, Afolabi E, Bennett MI, Serpell MG, Dunn KM, Smith BH. Estimating the burden of disease in chronic pain with and without neuropathic characteristics: does the choice between the EQ-5D and SF-6D matter? Pain 2014;155:1996–2004. [DOI] [PMC free article] [PubMed] [Google Scholar]
- [30].Tu YK, Clerehugh V, Gilthorpe MS. Collinearity in linear regression is a serious problem in oral health research. Eur J Oral Sci 2004;112:389–397. [DOI] [PubMed] [Google Scholar]
- [31].van Hecke O, Austin SK, Khan RA, Smith BH, Torrance N. Neuropathic pain in the general population: A systematic review of epidemiological studies. Pain 2014;155:654–662. [DOI] [PubMed] [Google Scholar]
Associated Data
This section collects any data citations, data availability statements, or supplementary materials included in this article.