

Abstract
Over the past decade, mass spectrometry (MS)-based “shotgun lipidomics” has emerged as a powerful tool for quantitative and qualitative analysis of the complex lipids in the biological system. The aim of this critical review is to give the interested reader a concise overview over the current state of the technology, focused on lipidomic analysis by mass spectrometry. The pros and cons, and pitfalls associated with each available “shotgun lipidomics” method are discussed; and the new strategies for improving the current methods are described. A list of important papers and reviews that are sufficient rather than comprehensive, covering all the aspects of lipidomics including the workflow, methodology, and fundamentals is also compiled for readers to follow.
Keywords: Lipidomics, Mass Spectrometry, electrospray ionization, MALDI, Collision induced dissociation, Lipid
Introduction
The emergence of the electrospray ionization (ESI) technique [1,2] coupled with mass spectrometry (MS) that permits direct analysis of intact phospholipids with 2 to 3 orders of magnitude more sensitivity than that achieved by FAB/MS [3–5], prompts the development of “shotgun lipidomics”, a term first coined by Han and Gross in their seminal work applying mass spectrometric techniques without prior chromatographic separation for global analysis of lipids from crude lipid extracts of biological origin [6,7]. The superb sensitivity and ease of continuous sample introduction with ESI, coupled with tandem mass spectrometry provide opportunities to explore the structure and the fragmentation process of complex lipids in greater detail [8,9]. The ions generated by ESI minimized some of the problems such as the complication of the spectra associated with matrixes employing FAB/MS, or MALDI-TOF, the other sensitive MS tool for lipid analysis. On the other hand, MALDI-TOF has emerged as another MS based lipidomic tool for, e.g., imaging lipid in the tissue, due to its sensitivity and the abundance of lipids in the tissue that can be released by MALDI [10,11].
Lipids are present in all prokaryotic and eukaryotic cells and are essential to maintain the life. Lipids contain a range of chemical functional groups, which can be divided into many classes and subclasses. To completely analyze their structures in a short period of time is a daunting task. Up to now, a large body of articles and reviews regarding lipidomic analysis, including shotgun lipidomics have been published [12–54]. Over the years since the application of MS in the lipid analysis, the sensitivity, fidelity and speed have been improved drastically. The driving force behind the improvement is a constant advance in mass spectrometry and related technologies, and more importantly, the desire to gain insight onto the biological processes related to lipids. The ultimate goal for these continuous efforts is to develop a reliable, high throughput, sensitive, and automatic method for global analysis of lipids in the cellular level, leading to understand the biological function of lipids related to human health and diseases.
The aim of this review is to provide readers with critical evaluation of the current state of “shotgun lipidomics”. This article is devoted to the application of MS to the quantitation and elucidation of the chemical structure of the major lipids of biological origins deriving mainly from eukaryotic systems. The “LC/MS lipidomics” approach and the lipids outside the major lipid classes will not be reviewed. Of importance, pertinent examples that highlight the key role of the state-of-the-art MS methods employing ESI high resolution multiple stage mass spectrometry, and the traditional triple quadrupole and MALDI-TOF-TOF mass spectrometry to analyze lipids will be discussed. I will provide an overview and critique of the current understanding of lipid analysis taking into account of the various methodologies without employment of chromatographic separation.
The non-MS related techniques such as the development of the sample preparation methods before MS analysis and of the data processing methods after MS-data acquisition will not be reviewed here. However, a list of important papers and reviews that cover all the aspects of lipidomics, including the workflow, methodology, and fundamentals is compiled for readers to follow. It is also noteworthy that various nomenclature systems have been used, and the abbreviations, nomenclatures, and lipid classification published by LIPID MAPS consortium [55] with modification will be adopted in this review.
Analytical methods toward shotgun lipidomics
Table 1 is a collection of some of the most representative literatures of the MS-based lipidomics, including those involving chromatographic separation by liquid chromatography (LC), thin layer chromatography (TLC), ion mobility (IM), and supercritical fluid chromatography (SFC) combined with MS for lipid analysis for interested readers to follow.
Table 1:
Summary of current literatures related to MS-based shotgun lipidomic
| Type | Sample inlet | Article type | Reference # | Comments | ||
|---|---|---|---|---|---|---|
| Shotgun | Direct infusion (including Nanomate) |
Flow inection | ||||
| × | 12 | One of the earliest papers on global lipid analysis by combined linked scans using TSQ with flow inection |
||||
| × | Review | 13,14,25 | Mutiple dimensional shotgun using combined linked scans with TSQ for global lipid analysis | |||
| × | Review | 15 | Global plant lipid analysis using combined linked scans with TSQ | |||
| 16 | Removal of non-sphingolipid by lithium methoxide treatment to enhance shotgun sphingomyelin analysis |
|||||
| × | 17 | Database software development | ||||
| × | Review | 18,21,24,28,33,43,49 | HR MS/MS-shotgun lipid profiling with Q-TOF or Orbitrap FT and database search | |||
| Review | 19,23,26,41 | General review on MS-based lipidomics, including fundamentals, workflow, and methodology | ||||
| 40,45 | Tips, methology on shotgun lipidomic | |||||
| × | Review | 6,34,52 | General review on MS-based lipidomics | |||
| Review | 37,39 | A must-read very comprehensive review covering all the aspects of shotgun ipidomics | ||||
| × | 42 | Shotgun on lysophospholipids | ||||
| × | 38 | Applying photochemical reaction before ESI followed by MS/MS to locate fatty acid double bond |
||||
| × | 35 | A novel approach based on MS1 to MSn>3 DDA/DIA for targeted and untargeted lipid analysis usingultra-HR Orbitrap/Fusion instrument and homebuilt database (ALEX) analysis |
||||
| × | Review | 50 | Shotgun on aminophospholipids and plasmalogen lipid via specific reaction with amino group and O-alk-1’-enyl substituent |
|||
| 54 | Applying ozonolysis to ESI generated unsaturated fatty acid-containing lipids followed by MS analysis to locate double bond position |
|||||
| Chromatographic separation |
HPLC | HPLC/ion obility | SFC | |||
| × | Review | 22 | LC/MS analysis on neutral glycerolipid and cholesterol esters | |||
| × | 30,47 | SFC/ESI-HRMS with packed column for lipidomic analysis | ||||
| Review | 46 | General review on lipid analysis by SFC-MS | ||||
| − / × | 32 | Drift-tube ion mobility (IM)-MS analysis of glycerophopholipids | ||||
| × | 20 | ESI/LC/MS analysis of DAG | ||||
| × | 29 | Nano LC/MS on oxysterol analysis | ||||
| − / × | Review | 31 | Comprehensive review on qualitative and quantitative analysis of lipid by IM-MS and IM MS/MS | |||
| Review | 36 | General review of FTICR/orbitrap on lipidomic including metabolomics | ||||
| × | 44 | LC/MS based sphingolipid analysis | ||||
| − / × | 27 | Differential ion mobility spectrometry(DMS)-driven shotgun lipidomics for distinction of isobaric and isomeric phospholipids, ether and diacyl PC and PE, and separation of SM/PC lipid familiess |
||||
| × / × | 51 | UPLC/DMS with Q-Trap for qualitative and quantitative analysis of phospholipids | ||||
| × / × | 53 | Online Ozonolysis Combined with Ion Mobility-Mass Spectrometry for lipid double bond recognition and lipid isomer differtiation |
||||
| Review | 48 | Review on TLC-blot-MALDI-TOF lipidomic with references | ||||
| Review | 102 | A very comprehensive review covering all aspects of MALDI TOF MS analysis of lipids | ||||
Continuous infusion “shotgun lipidomics”
Dependent on the specimen, lipids are often present as a big family, consisting of numerous structures in various subclasses (Fig 1), with a wide range of concentrations. Lipids are “sticky”, i.e., they can aggregate, interact, and are difficult to remove. Additionally, the physicochemical properties such as the basicity, polarity, vapor pressure, and chargeability among various lipid classes are different. As such, the physical states including the salt content and the pH of the lipid specimen when ionization takes place in the ion source are also different. Thus, the ionization efficiencies of various lipid families upon subjected to different ionization methods can vary drastically. Shotgun lipidomics tries to minimize these differences and maximize the ionization efficiency. On the other hand, it also exploits these differences; thereby, the various lipid classes can be formed by charge separation (e.g. deprotonation) or adduct formation (e.g. protonation, alkaline metal adduct ion, halogen adduct ion) in the solution or gas phase.
Fig 1.
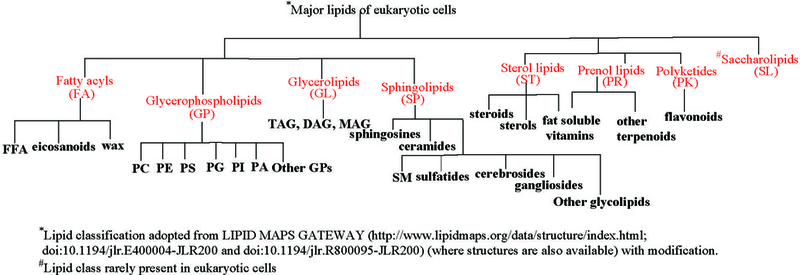
The most commonly known lipids in eukaryotic system
Han and coworkers describe a work flow applying direct infusion in combination with tandem quadrupole mass spectrometry for sensitive detection of various lipid classes. Anionic lipids, including cardiolipins (CLs), phosphatidylglycerols (PGs), phosphatidylinositols (PIs), phosphatidylserines (PSs), phosphatidic acids (PAs), and sulfatides (Sulf) of cellular lipid extract of biological origins were analyzed as [M −H]− ions by negative-ion ESI-MS; while LiOH in methanol (50 nmol/mg of protein) were added to each individual cellular extract to supply Li+ ions prior to analyses of triacylglycerols (TAGs), galactocerebrosides (GalCers), phosphatidylcholines (PCs), and sphingomyelins (SMs) as the [M + Li]+ adduct ions. In the meantime, phosphatidylethanolamine (PEs) molecular species was turned into anionic phospholipids and was analyzed as [M −H]− ions. Thereby, separation of various lipid classes can be established by electrospray ionization [13]. This approach to achieve lipid analysis without prior chromatographic separation via manipulation of the physical state of the various lipid (e.g., basicity) and the ionization method (i.e., positive-and negative-ion ionization), was termed as “intrasource” separation [6,56]. However, this approach to accomplish lipid separation is in fact via the manipulation of ionization efficiency by which the signals of different lipid classes were selectively suppressed or preferentially formed, and physical separation of lipid classes in the ion source has not been evidenced.
The concept that quantitates PC, SM, and TAG as lithium adduct ions by adding LiOH provides discrete [M + Li]+ molecular species apart from other lipid classes for profiling. More importantly, the stable [M + Li]+ molecular species can be further subjected to CID tandem mass spectrometry for total structural characterization [9,57–59]. In the same context, the discrete [M − H[− ions of Sulf, PI, CL, GalCer and Cer formed in the negative ion mode can be applied for quantitation; and structural identification and isomer differentiation can be achieved by further CID tandem mass spectrometry [60–66]. With the addition of internal standards, simultaneous semi-qualitative and quantitative methods via precursor ion scan (PIS) and neutral loss scan (NLS) features readily available for a tandem quadrupole instrument, can be easily implemented [61–68].
However, several drawbacks have been encountered in this approach: (1) the addition of LiOH rarely results in the exclusive formation of [M + Li]+ adduct ions, in particular, for the lipid extract of biological origin where Na+ is ubiquitous. The presence of the companion [M + Na]+ ions (sometimes [M + K]+ ions also present), which are 16 Da heavier complicates the analysis. For example, the [M + Li]+ ion of 16:0/18:1-PC has the same nominal mass as the [M + Na]+ ion of 1-O-hexadecanyl-2-octadecadienoyl sn-glycero-3-phosphocholine (e16:0/18:2-PC)) at m/z 766.6 (unless a sufficient high resolution mass spectrometry can be implemented for their distinction); (2) In the presence of Li+, PE can also form [M + Li]+ ions [69], which is indistinguishable from the PC [M + Li]+ species consisting of C2-chain length shorter (identical elemental composition), although these adduct ions are often of low abundance. (3) To facilitate the formation of ceramides as the [M − H]− ions by adding LiOH to raise the pH of the solution, cannot completely prevent the anionic adduct ion formation such as [M + Cl]− ions, in particular, if CHCl3 was used as co-solvent to dissolve the sample for infusion (Cl− can be generated from CHCl3 by ESI). To minimize [M + Cl]− ion formation, skimmer CID (or termed as fragmentor voltage for Agilent instruments) can be applied to transform them into [M − H]− ions by removal of HCl. (4) LiOH is slightly soluble in methanol (9.76 mg/100ml methanol); and is a base that can saponify TAG, leading to artificial formation of diacylglycerols (DAGs) and fatty acids. (5) Li+ has two stable isotopes with masses of 6.01512 u (7.6%) and 7.01600 u (92.4%) that can complicate the analysis. To remedy, exclusively 7LiOH can be used.
To overcome these shortcomings, 0.5 % NH4OH (29% NH3 basis) in methanol solution (pH ~10) can be added to the lipid extract prior to ESI. In this manner, PC and SM can be exclusively detected as the [M + H]+ ions without compromising the sensitivity; and TAG in the fashion of [M + NH4]+ can be formed with less complexity and more sensitivity, as compared to that seen as the [M + Li]+ ions, which are often complicated by simultaneous formation of [M + Na]+ ions, in particular, for biological samples (unpublished results). The addition of NH4OH also drastically increases the sensitivity of the anionic lipids that are to be detected as the [M − H]− ions [70], including CL, PG, PI, PS, PA, and Sulf, and > 2 fold sensitivity increase has been observed, as compared to that obtained from the original solution (i.e., no NH4OH was added). More importantly, sphingonoids, such as ceramide and GlcCer can be exclusively formed as the [M − H]− ions in the negative-ion mode with a greater sensitivity, averting the formation of the undesired adduct ions, such as [M + Cl]− and [M + CH3CO2]− completely. For lipid species such as phosphatidylinositol polyphosphate (PIPn n=1, 2, 3), acylCoA and CL, more doubly-charged ions can be formed. The readily recognizable MS pattern of the doubly-charged ions (0.5 Da apart for isotopic peaks) provides extra information for structure identification, meanwhile, the resulted [M − 2H]2− ions can also be detected by the mass spectrometers designed with a limited mass range (<1000Da).
Loop injection vs. continuous infusion
The shortcoming of using continuous infusion for lipid analysis is the cross contamination among samples that were subjected to analysis sequentially. Another drawback of using continuous infusion as sample inlet is the accumulation of nonvolatile metal ion such as Na+ as infusion persists. This leads to the decline of the [M −H]− ion formation for PPLs (such as PI, PE and PG) in the negative-ion mode, and the rise of the formation of Na+ adduct ions, particularly in the analysis of biological specimens, where Na+ is often abundant. To overcome the contamination problem from the carry-over of previous samples, a chip based nanospray ion source, for example, the Advion TriVersa NanoMate (https://advion.com/products/triversa-nanomate/) for direct infusion was implemented in many laboratories. The setup has a very minimal sample consumption due to the fabrication suitable for low flow rate (low as to 20 nL/min) and because each sample uses its nanoelectrospray emitter, the sample-to-sample carryover can be minimized. All nanospray ion sources provide good sensitivity and consume very small amount of samples, but relatively more complicated to implement. The chip based nanospray ion source has been well received in the shotgun lipidomic analysis [35,24,71,18,42]. However, the device is rather expensive and the cost of operation is relatively much higher.
On the other hand, the conventional loop injection method using a syringe or a HPLC pump with isocratic flow combined with an autosampler, affords background subtraction to minimize sample carry-over from the previous injections. Loop injection without chromatographic separation also provides speed, automation and is suitable for all the analysis [72–74]. Loop injection adds flexibility in the solvent selection, which can be further optimized to the conditions that maximum sensitivity (e.g., NH4OH or HCO2H can be added before ESI analysis in negative-or positive-ion mode, respectively), or types of adduct ions (e.g., via adding adultery ions such as Na+, Li+ to form [M + Na]+ and [M + Li]+ ions) can be reached. The flexibility in the sample amount and concentration to be introduced for analysis, and in the flow rate can increase the linear range for quantitation. Loop injection in conjunction with high resolution or tandem quadrupole mass spectrometry thus provides a very simple setup that can be easily implemented for lipidomic analysis.
Shotgun lipidomics with tandem quadrupole mass spectrometry
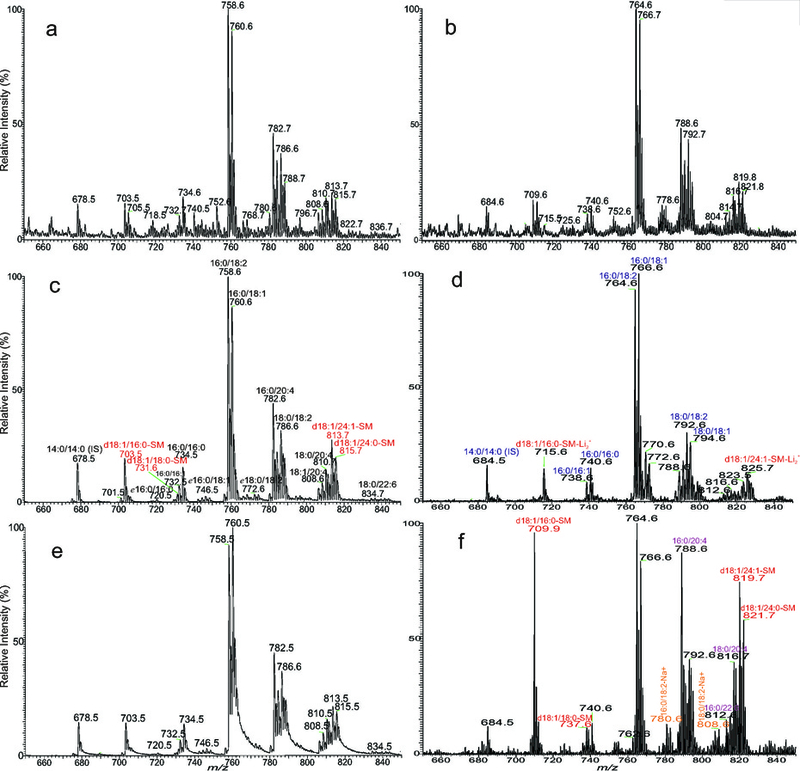
Insight into the fragmentation processes is crucial for optimal utilization of tandem quadrupole mass spectrometry toward shotgun lipidomics. Structural information from product-ion spectrum affords identification of lipid structures [9]. Accordingly, relevant ions can also be selected for precursor-ion scan (PIS) and neutral loss scan (NLS) (Table 2) for quantitation of various intact lipid classes without chromatographic separation [12,75]. Selectivity provided by linked scans using a tandem quadrupole instrument minimizes background ions, and s/n can be improved. However, drastic decline in the sensitivity and, in many cases, loss of the fidelity that reflects the entire specific lipid classes in the mixture were often seen, dependent on the ions selected for linked scan. For example, quantitation of PE species in a lipid extract from blood (Fig 2. Panels a and b) applying PIS of 196 (Fig 2. Panel c) to fish out PE species as [M − H]− ions has very poor sensitivity, because ion of m/z 196 is of low abundance in the PE product ion spectrum [76], while applying NLS of 141 (Fig 2. Panel d) for profiling PE as [M + H]+ ions [12,15] severely discriminates against plasmalogen-PE species. For example, ions of m/z 700 (p16:0/18:1), 722 (p16:0/20:4), and 750 (p18:0/20:4) in Fig 2a, and 2c are abundant, but the corresponding [M + H]+ ions expected at m/z 702, 724 and 752 are absent in Fig 2d and 2e. Meanwhile, the concurrence of the [M + Na]+ ions by NLS of 141 from species that are 22 Da lighter overlaps the [M + H]+ species that are 22 Da heavier. For example, the [M + Na]+ ions of 16:0/18:1-PE (m/z 740) and 18:0/18:1-PE (m/z 768) have the same nominal masses as the [M + H]+ ions of 16:0/20:4-PE and 18:0/20:4-PE, respectively, and are inseparable by a quadrupole instrument (Fig 2d and 2e). The sodium adduct ions as seen at m/z 658, 740, 762 and 790 in Fig 2e, which were obtained in the consecutive 2 min scans, also increase, due to rapid Na+ build-up as infusion persists. These problems make direct quantitation of PE species in the lipid extracts by NLS of 141, in particular, for samples of biological origin where Na+ content is often abundant and unpredictable, not reliable. To overcome these shortcomings, strategies including derivatization of the amino head group to enhance sensitivity before shotgun lipidomic analysis have been recently described [50,77]. Alternatively, NLS of 129 can be used to profile PE species as [M − H + 2Li]+ ions (Fig 2f) with good sensitivity (Table 2) [69].
Table 2.
Summary of the class-specific linked scan modes available in positive and negative ion ESI tandem quadrupole MS.
| Lipid class | Detected ion type | scan mode | Fragment type | *optimal CE | References | Comments |
|---|---|---|---|---|---|---|
| PC | [M + H]+ | PIS 184 | [phosphocholine + H]+ | 34 eV | 12 | Excellent sensitivity |
| SM | [M + H]+ | PIS 184 | [phosphocholine + H]+ | 38 eV | 12 | Excellent sensitivity |
| PS | [M + H]+ | NLS 185 | loss of phosphoserine | 32 eV | 12 | Moderate sensitivity |
| PE | [M + H]+ | NLS 141 | loss of phosphoethanolamine | 32 eV | 12 | Moderate sensitivity, discriminates against plasmalogen PE; overlaps with [M + Na]+ |
| Cer | [M + H − H2O]+ | PIS 264 | [LCB + H − 2H2O]+ | 32 eV | 79 | Good sensitivity |
| Cer | [M + Li]+ | NLS 48 | loss of [H2O + HCHO] | 45 eV | 78 | Good sensitivity for all LCB/nFA-Cer; not very specific; discriminates against LCB/αhFA-Cer |
| PC | [M + Li]+ | NLS 183 | loss of phosphocholine | 35 eV | 83 | Good sensitivity; favors polyunsaturated-FA containing PC |
| SM | [M + Li]+ | NLS 183 | loss of phosphocholine | 40 eV | 58,67 | Good sensitivity |
| SM | [M + Li]+ | NLS 59 | loss of trimethylamine | 30eV | 58,67 | Good sensitivity |
| SM | [M + Li]+ | NLS 213 l | loss of [phosphocholine + HCHO] | 52eV | 58,67 | Good sensitivity |
| PS | [M + Li]+ | NLS 191 | loss of [phosphoserine Li salt] | 35 eV | 9 | Good sensitivity |
| PE | [M − H + 2Li]+ | NLS 129 | loss of [phosphoethanolamine Li salt − H2O] | 32 eV | 69 | Good sensitivity and fidelity; dilithiated ions are less readily formed |
| PG | [M − H + 2Li]+ | PIS 167 | [phosphoglycerol − H + 2Li] + | 45eV | 9 | Good sensitivity and fidelity; dilithiated ions are difficult to form |
| GlcCer | [M + Li]+ | NLS 210 | loss of [Glc + HCHO] | 65eV | 59 | Good sensitivity |
| PE | [M + Na]+ | PIS 164 | [phosaphethanolamine + Na]+ | 35eV | 75 | Good sensitivity; discriminates against plasmalogen PE |
| PG | [M − H]− | PIS 153 | [phosphoglycerol − H2O − H ]− | 35 eV | 12 | Poor sensitivity; not specific, co-present with all other phospholipids, and CL |
| PS | [M − H]− | NLS 87 | loss of [serine − H2O] | 25eV | 9,12 | Excellent sensitivity |
| PE | [M − H]− | PIS 196 | [phosphoethanolamine − H + C3H4O]− | 55eV | 12,76 | Poor sensitivity |
| PE | [M + Cl]− | NLS 36 | loss of H35Cl | 25eV | 75 | Excellent sensitivity; [M + Cl]− ions not readily formed |
| PI | [M − H]− | PIS 241 | [phosphoinositol − H2O − H ]− | 45eV | 12, 65 | Excellent sensitivity |
| Cer | [M − H]− | NLS 256 | loss of [C13H27CH=CHCHO + H2O] | 32 eV | 62, this paper | Excellent sensitivity; sphingosine (d18:1) ceramide only; discriminates against d18:1/ αhFA-Cer |
| Cer | [M − H]− | NLS 327 | loss of [sphingosine + CO] | 32 eV | 62 | Excellent sensitivity; specifically detect d18:1/αhFA-Cer |
| sulfatide | [M − H]− | PIS 97 | H2PO4− | 65eV | 63,64 | Good sensitivity |
| PIP | [M − H]− | PIS 321 | [inositol bisphosphoric acid − H2O − H ]− | 50eV | 65 | Moderate sensitivity |
| [M − H]− | PIS 241 | [phosphoinositol − H2O − H ]− | 50eV | 65 | Good sensitivity; co-present with PI, PIP2 | |
| PIP2 | [M − H]− | PIS 401 | [inositol trisphosphoric acid − H2O − H ]− | 50eV | 65 | Moderate sensitivity |
| [M − H]− | PIS 241 | [phosphoinositol − H2O − H ]− | 50eV | 65 | Good sensitivity; co-present with PI, PIP | |
| IPC | [M − H]− | PIS 241 | [phosphoinositol − H2O − H ]− | 45eV | 68 | Good sensitivity |
| CL | [M − H]− | PIS 153 | [phosphoinositol − H2O − H ]− | 50eV | 66 | Poor sensitivity; not specific, co-present with all other phospholipids |
| [M − 2H]2− | PIS 153 | [phosphoinositol − H2O − H ]− | 25eV | 66 | Poor sensitivity; unique doubly charged ion pattern easy to identify |
Collison energy (CE) was optimized for overall fidelity and sensitivity
Fig 2.
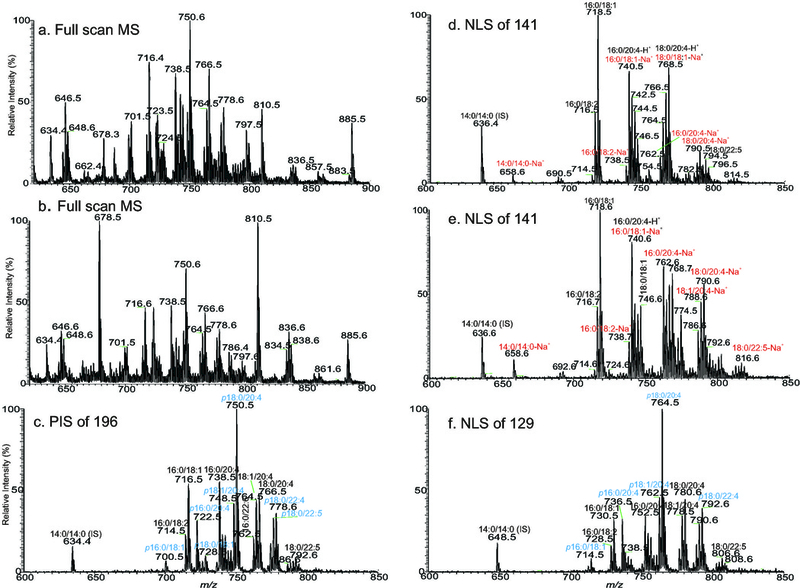
The negative ion ESI-MS spectrum of the total lipid extract from Blight & Dyer extraction of human blood via direct infusion of the undiluted solution (a), and the same solution diluted three times with methanol (b). The drastic difference in the profiles of panels a and b, due to sample dilution reveals the suppression effect, in particular, on the PS species by other lipid classes. Despite the suppression, the profiles of each lipid family remain largely unchanged. Panel c that illustrates the tandem MS (seen as [M − H]− ions) obtained by use of PIS of 196 (collision energy 50eV) in the negative ion mode; and the positive ion tandem MS (seen as [M + H]+ ions) acquired by NLS of 141 (CE 32 eV) accumulated at the first 5 min (d), and at the third 5 min (e) signal average, all represent the PE species in the sample. The Na+ build-up during infusion is seen by the drastic increase of the Na+ adduct ions such as ions at m/z 658, 738, 740, 762, and 790 in Panel e. Panel f illustrates the tandem mass spectrum acquired by NLS of 129 (collision energy 32 eV) that identifies PE species as the [M − H + 2Li]+ ions. The profile is similar to that of Fig 2c, demonstrating its utility in the lipidomic profiling of PE molecules in lipid extract using a TSQ instrument.
The profiles of the ESI-MS can vary drastically depending on the concentration of the sample introduced to the ESI source for ionization, regardless of the sample inlet via infusion or loop injection. For example, the relative intensities of the ions of m/z 678 (14:0/14:0), 810 (18:0/20:4) and 836 (18:0/22:5) in the PS family acquired with the original extract are significantly lower (Fig 2a), as compared to the intensities of the same ions acquired with the same extract that was diluted two times with methanol (Fig 2b). The relative abundance of PS rises even higher in the ESI-MS acquired with further diluted samples (data not shown). These results may be attributable to the suppression effect on PS from other major lipid classes such as PC. Therefore, signal response in ESI-MS is not necessary a good reflection of the concentration of various lipid families in a mixture, but, is rather good reflection of the concentration in the same lipid family. For example, spectra from NLS of 87 (Fig 3a) and from PIS of 241 (Fig 3b) that respectively profile the [M − H]− ions of PS and PI species in the sample are very similar to their ESI-MS profiles (Fig 2a and 2b), regardless of the sample concentration(Fig 2b is obtained from the less concentrated sample). The MS/MS spectrum profiles from NLS of 256 (Fig 3c) that represents sphingosine (d18:1-LCB) ceramide species observed as the [M − H]− ions, from NLS of 48 (data not shown) and from PIS of 264 (Fig 3d) that respectively detects the same ceramide family as the [M + Li]+ [78] and [M + H − H2O]+ ions [79] in the same sample are similar. This feature permits simultaneous semi-qualitative and semi-quantitative analysis of these lipids in mixtures with addition of internal standards. This is the underlying principle of shotgun lipidomics employing a tandem quadrupole instrument [76]. However, variation in sensitivity among the various species in the same families dependent on the structures, such as the type of the radyl group (e.g., PE as described earlier), number of double bond, chain length, etc, makes accurate quantitation impossible (see later for more discussion), despite several approaches such as the addition of multiple internal standard for each lipid class, and implementation of collision energy ramp have been used for more accurate quantitation [25,39,40,80] with the tradeoff of simplicity and speed.
Fig 3.
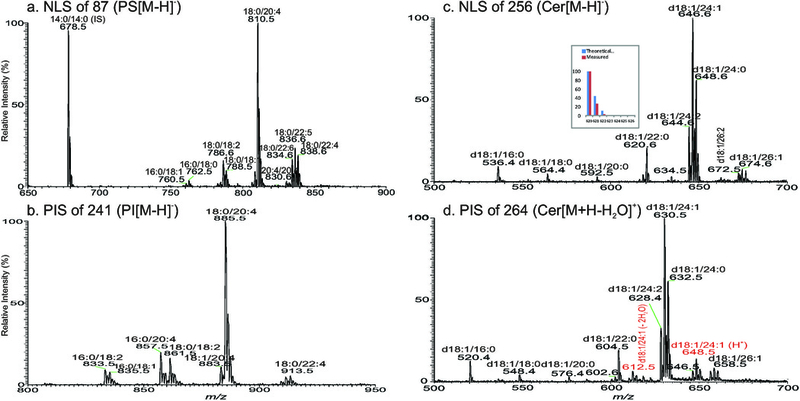
The tandem mass spectra obtained by NLS of 87 (collision energy 25 eV) (a), and by PIS of 241 (collision energy 40 eV) (b) that profile the [M − H]− ions of PS and PI species, respectively, in the lipid extract from blood. Panel c and Panel d illustrate the MS/MS spectra obtained by NLS of 256 (collision energy 32 eV) that represent the [M − H]− ions of d18:1-ceramide family and by PIS of 264 (collision energy 32 eV) that detect the same ceramide family as the [MH+ − H2O]+ ions in positive ion mode (please note: in the same scan, ceramides in the forms of [M + H]+ (e.g., m/z 648) and [M + H − 2H2O]+ (e.g., m/z 612) were also seen as the minor species), respectively. Tandem mass spectra from NLS (a and c) and PIS (b and d) readily fish out the entire specific lipid families; and with the addition of internal standard, semi-quantitation of PS (a), PI (b), and Cer (c and d) is feasible. Another notion is that spectra from NLS (a and c) are more resolved than those from PIS (b and d), and the isotope cluster pattern of all NLS and PIS spectra follows the elemental composition of which the fragments are subtracted (an example is shown for the ion of m/z 620 in panel c, inset).
With the combination of PIS and NLS, isobaric isomers from various lipid classes can be extracted. For example, ions of m/z 786 are present in the spectrum of NLS of 87 that recognizes PS species (Fig 3a) and in the PIS spectrum of 196 (Fig 2c) that detects PE molecules in the same lipid extract from plasma (Fig 2a). High resolution Orbitrap MS spectrum showed two separated peaks that match 40:8-PE (measured m/z: 786.5080; calculated C45H73O8NP: 786.5079) and 36:2-PS (measured m/z: 786.5293; calculated C42H77O10NP: 786.5291), respectively. The HCD product-ion spectrum of m/z 786 obtained by Orbitrap (Fig 4a) contains the ion pairs at 303/303, representing 20:4-FA carboxylate anions, and ions at m/z 500 and 482, arising from loss of 20:4-FA as ketene and acid, respectively, together with ions at m/z 196 and 140 that are signature ions of PE [76,81]. The presence of these ions led to the identification of the major 20:4/20:4-PE isomer. The spectrum also contains the ion pairs of m/z 524/506 and 476/458, arising from losses of 18:2-and 22:6-FA substituents, respectively, along with the ion pairs at m/z 279/327, representing 18:2-and 22:6-FA carboxylate anions, respectively, indicating the presence of 18:2/22:6-PE isomer. The confirmation of the 20:4/20:4-PE isomer is further conducted by MS3 on the ion of m/z 482 (786 → 482) (Fig 4b), which yielded a predominate ion at m/z 303 (20:4-FA carboxylate), along with ions of m/z 439 (loss of aziridine), 196 and 140 that signify a PE molecule [76,81].
Fig. 4.
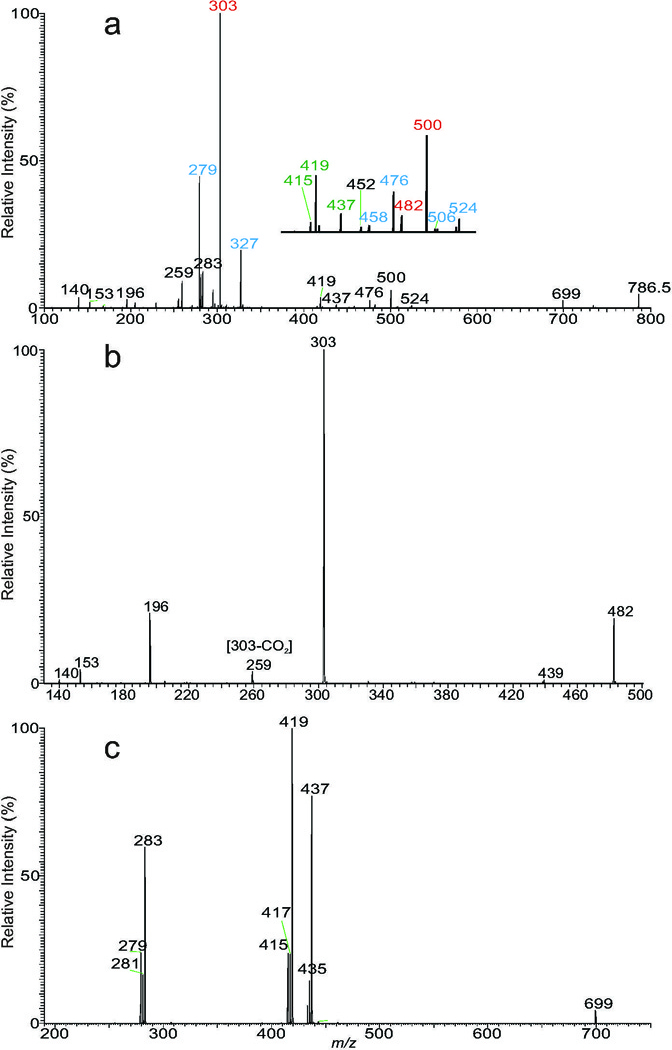
(a) The HCD product-ion spectrum of the ion of m/z 786 obtained by an Orbitrap. The ion mainly consists of both a 20:4/20:4-PE and 18:2/22:6-PE, together with minor 18:0/18:2-and 18:1/18:1-PS isomers. The presence of 20:4/20:4-PE is further supported by the MS3 spectrum of the ion of m/z 482 (786→482; panel b), which contains signature ions of PE at m/z 196, 153 and 140 (also seen in Fig 4a), and m/z 439 (loss of aziridine; Fig 4b). The presence of minor (18:0/18:2 +18:1/18:1)-PS isomers was further confirmed by the MS3 spectrum of the ion of m/z 699 (786→699; panel c). See text the detail leading to the above structural assignments.
In the same spectrum (Fig 4a), the ion at m/z 699 arose from elimination of a serine residue (loss of [Serine – H2O]; 87 Da), indicating the presence of PS species [82]. Further dissociation of the ion of m/z 699 (786 → 699) (Fig 4c) gave rise to ion pairs of m/z 437/419, and 433/415 arising from losses of 18:2-and 18:0-FA substituents as ketene and acid, respectively, consistent with the observation of the ions of m/z 279 and 283, representing 18:2-, and 18:0-FA carboxylate anions, respectively. The results confirm the presence of 18:0/18:2-PS, consistent with the presence of the ions of m/z 437 and 419 in Fig 4a. Meanwhile, the spectrum (Fig 4c) also contained the minor ions of m/z 281 (18:1-carboxlate anion) and 435/417 pairs, arising from losses of 18:1-FA substituent as a ketene and an acid, respectively, indicating the presence of a minor 18:1/18:1-PS isomer. The above results demonstrate the utility of multiple stage mass spectrometry, in particular, combined with high resolution mass spectrometry in the shotgun lipidomic approach towards identification of complex lipid structures.
The ESI-MS profiles of [M + H]+ ions (Fig 5a) and [M + Li]+ ions (Fig 5b) of PC from the same extract are nearly identical. Tandem MS employing PIS of 184 (Fig 5c) is also nearly identical to the ESI-MS, and the method has been used for quantitating and profiling PC molecules in lipid extracts [12]. However, NLS of 189 to profile PC as [M + Li]+ ions (Fig 5d) discriminates against polyunsaturated fatty acid containing PC species such as 16:0/20:4-PC (m/z 788) and 18:0/20:4 (m/z 816); while NLS of 183 favors the same polyunsaturated fatty acid containing PC molecules (Fig 5f) [83]. Information from combination of these scans provides structural recognition of PC species [84], which is the concept behind the multi dimensional MS-based shotgun lipidomics [25]. NLS and PIS can be useful in the profiling specific and minor lipid classes due to removal of background ions. For instance, minor sphingomyelin subclasses with various long-chain base, such as d18:2-LCB containing SM in bovine erythrocytes have been identified by NLS of 427, a specific scan to detect d18:2/FA-SM as [M + Li]+ ion [58,67].
Fig 5.
The positive ion ESI-MS spectrum of the [M + H]+ (a), and [M + Li]+ (b) ions of the total lipid extract from Blight & Dyer extraction of human blood via direct infusion, and the tandem mass spectra obtained from PIS of 184 (collision energy 32eV) with a target gas (Ar) pressure of 0.6 torr (c), and of 1.2 torr (e). Panel c bears a nearly identical profile as the ESI-MS (a), indicating the utility of PIS of 184 in the semi-quantitation analysis of PC as [M + H]+ ions. However, severe peak tailing was seen in Panel e, deteriorating the accuracy in the PC analysis. The profile of the ESI-MS spectrum of the [M + Li]+ ions of the same lipid extract (b) after addition of LiOH is similar to Panel a, but the tandem MS obtained from NLS of 189 (d) is discriminating against the PC species consisting of polyunsaturated fatty acid substituents, as species such as 16:0/20:4 (788), 16:0/22:6 (812), and 18:0/20:4 (816) are of low abundance; while these ions are abundant in the NLS spectrum of 183 (f) due to the preferential neutral loss of 183. Similar results were also observed for the SM family. Other notions include the observation of the dilithiated SM, e.g., ions at m/z 715 and 825 as shown in panel d; and the sodiated PC species, e.g., 16:0/18:2 (780), 18:0/18:2 (808) in panel f, revealing the pitfalls of this method in the PC analysis. It should be noted that in the structural assignments, only the major isomer is shown, and the identified structures as marked have been verified by the product ion spectra and high resolution mass spectrometry.
Lipid profiling using a triple quadrupole instrument by use of NLS resulted in a well resolved tandem mass spectrum because the simultaneous scan of Q1 and Q3 is similar to double focus acquisition [85]. For example, NLS of 256 [62,61] with Q1 and Q3 mass window setting at 0.7 to 1 Da (half-height width) to profile sphingosine (d18:1) ceramide species in the same lipid extract (Fig 3c) yields an unit mass resolved mass spectrum with very low background. In contrast, the spectrum from PIS of 264 (Fig 3d), an approach to detect the same ceramide family as the [MH+ − H2O]+ ions in the positive ion mode [79] is less resolved, and the background ions are higher. Similarly, NLS spectra with baseline resolved peaks were seen in Fig. 5d and 5f; while Fig. 5c obtained by PIS is less resolved.
It should be noted that to obtain a near baseline resolved PIS spectrum, e.g., the spectrum shown in Fig 5c using, for example, a Thermo TSQ instrument under optimal collision energy (e.g., 32 eV for PC), a much lower Ar collision gas pressure (ca 0.6 mtorr) [6] be applied to reduce multiple collisions that may deteriorate the resolution due to energy spread, while full width at half maximum (FWHM) of Q1 was set at 0.7 Da and Q3 can be set between 0.7 to 1.5 Da to maximize the sensitivity. The spectrum is in sharp contrast to Fig 5e, which is obtained using the same condition but with Ar collision gas pressure of 1.2 mtorr, the target gas pressure optimized to maximize the CID fragmentations for acquiring a NLS spectrum or a product-ion spectrum. The spectrum (Fig 5e) is poorly resolved, resulting in loss of sensitivity and mass accuracy in the analysis. It is also important to note that the isotope cluster pattern of all NLS and PIS spectra follows the theoretical plot of the elemental composition of the fragment ions (i.e., the mass of the scanned residue is to be subtracted) rather than that of the elemental composition of the precursor, because fragment ions were scanned during data acquisition [86,87]. For example, the observed isotopic abundance of the ion of m/z 678.5 (Fig.5c) representing a [M + H]+ ion of 14:0/14:0-PC (elemental composition: C36H73O8NP) arising from PIS of 184 (a loss of phosphocholine residue; C5H15NPO4) matches the formula of C31H58O4, where a C5H15NPO4 residue was subtracted from C36H73O8NP; rather than its molecular formula of C36H73O8NP. The isotopic abundance of ceramide species detected as the [M − H]− ions derived from NLS of 256 (loss of C16H34NO) [62] follows a elemental composition of [M − H − C16H34NO] (Fig 3c). Thus, for example, d18:1/22:0-Cer at m/z 620 (elemental composition: C40H78NO3) in the NLS of 256 spectrum, follows the isotopic pattern of C24H46NO (C40H78NO3 − 256), of which the first isotopic [M − H + 1]− ion is 27.03% (Relative Intensity), which is in huge difference from 44.92%, a plot from the molecular formula of C40H78NO3 (see Fig 3c, inset for comparison ). Therefore, to perform deisotoping to achieve accurate quantitation using data from PIS and NLS, care ought to be taken to assure that correct elemental formula be used for deisotoping [88].
To quantitate and characterize TAG as [M + Li]+ ions, Han and Gross described multiple-dimensional ESI tandem quadrupole mass spectrometric approach to identify the fatty acid substituents utilizing combination of NLSs of various fatty acid substituents in the molecules [89]. The method assigned the major structures, but not the minor species. Other drawback is that the scanning method is non-specific. For example, cleavages of18:0-fatty acid (C17H35CO2H) substituent and of 18:3-fatty acid substituent as Li salt (i.e., loss of C17H29CO2Li) all resulted in loss of 284, and thus NLS of 284 fails to distinguish a RxCOOH loss from a loss of RxCOOLi residue, which is nevertheless not a major fragmentation process observed for the [M + Li]+ ions of TAG [90,57]. An alternative approach to fingerprint TAG molecules in a mixture is that TAGs are to be desorbed in the presence of NH4+ as described earlier. In this manner, exclusive [M + NH4]+ adduct ions with a much greater sensitivity than that seen as the [M + Li]+ ions can be formed. The identification of the structures by multiple dimensional mass spectrometry can be established by NLSs of RxCOONH4. Because [M + NH4]+ -RxCOONH4] ions are nearly the exclusive and most prominent fragment ions in the product-ion spectrum obtained by a tandem quadrupole instrument [91 ], multiple-dimensional ESI tandem quadrupole mass spectrometric analysis of TAG as [M + NH4]+ ions [92], therefore, affords a more explicit and more sensitive method than that desorbed and analyzed as the [M + Li]+ ions. However, CID on [M + Li]+ ions applying multiple stage tandem mass spectrometry, provides near complete structural information, including the location of double bond of the fatty acid substituents and their regio-specificity on the glycerol backbone [57]. The structural complexity of TAGs in biological specimen is often a subject of discussion and the approaches toward their structural identification and quantitation have been reviewed [93–95].
Due to its relative low cost and ease of operation, shotgun lipidomics with ESI-TSQ mass spectrometric approach, irrespective of the method (direct infusion or loop injection with a syringe pump) for sample inlet, provides the simplest method that can be easily implemented in a lab with limited resources, even without an HPLC or other more sophisticated logistics.
Shotgun lipidomics with ESI-high resolution mass spectrometry (HRMS)
Nowadays high resolution (HR) mass spectrometry based on FT (such as FT ICR and Orbitrap) or quadrupole time of flight (Q-TOF) instrumentation has emerged as another shotgun lipidomic tools, [39,21,24,43,96,71,49], providing an additional gain in selectivity. The trade-off of high resolution is at the cost of sensitivity and speed. Another downside of a high resolution instrument is the hefty cost.
High field FT ICR and the most recent advances in Orbitrap technology can achieve over 1,000,000 resolution [97], providing the resolution necessary for separating the isotopic isomers. A Q-TOF instrument, on the other hand, provides speed but a typical much lower resolution (<40,000). The insufficient resolution for “high resolution shotgun lipidomics (e.g., <100,000 resolution at m/z 400)” causes the partial overlap between the 13C2-containing isotopologue species and the monoisotopic ion of the similar lipid species with one less double bond, resulting in significant peak broadening and the shift of the mass measurement, thereby, hampering accurate quantitative analysis if the peak intensity is used to compare to that of an internal standard for quantification, as well as the accuracy of the measured m/z that can be used for database search [98].
Direct measurement of intact masses does not allow their unequivocal assignment to individual species or even to the lipid classes. However, HRMS is rather effective in the realization of adduct ions [99], leading to recognize artificial ion formation upon ESI on lipid mixture (also see related discussion on Figure 6); and also very efficient in the differentiation, for example, ether glycerophospholipids (i.e., plasmalogen and plasmanyl lipids) from odd-chain containing diacyl glycerophospholipids [81,100]. High resolution MS3 spectra further recognize the formation of alkenoxide anions that can be used to identify plasmalogen and distinguish it from plasmanyl lipid. For example, the high resolution (R=100,000 at m/z 400) MS2 spectrum of the ions of m/z 750.5 (Fig 6a) from the same blood lipid extract seen in Fig 3a gave rise to 464/446 and 436/418, arising from losses of 20:4-and 22:4-FA substituents as a ketene and an acid, respectively (Fig 6, insets show the accurate mass measurements of the fragment ions). The spectrum also contains the ions of m/z 303 and 331, arising from cleavage of 20:4-and 22:4-FA substituents, along with ions of m/z 287 (C21H33−) and 259 (C19H31−), arising from further loss of CO2 from 20:4-and 22:4-carboxylate anions, respectively. The high resolution MS3 spectrum of the ions of m/z 464 (750.5 →464; Fig 6b) contains the ions of m/z 403 (loss of ethanolamine), 196 and 140 confirming the presence of the phosphoethanolamine head group, together with the ion of m/z 267 (both measured and calculated C16H33CH=CH-O− were seen at m/z 267.2693), an octadecenoxide anion arising from cleavage of the 1-O-octadecenoyl substituent (see Fig 6f for the fragmentation scheme). The results confirm the presence of the major p18:0/20:4-PE isomer. Similarly, a C14H29CH=CH-O− alkenoxide anion at m/z 239 was observed in the HR MS3 spectrum of m/z 436 (750.5 →436; Fig 6c), along with ions of m/z 375, 196, and 140, pointing to the presence of a minor p16:0/22:4-PE isomer. The MS2 spectrum of the ions of m/z 748.5 (Fig 6d) is similar, consisting of the m/z 462/444 and 436/418 ion pairs along with ions of m/z 303 and 329, consistent with the presence of the 20:4, and 22:5-FA substituents at sn-2. The high resolution MS3 spectra of the ions of m/z 462 (748.5 →462; Fig 6e) contains the alkenoxide ion of m/z 265 (C16H31CH=CH-O-), leading to the assignment of p18:1/20:4-PE structure; while the MS3 spectrum of m/z 436 (748.5 → 436) (data not shown) is identical to Fig 6c, revealing the presence of the alkenoxide ion of m/z 239 that identifies the p16:0/22:5-PE isomer. A minor m/z 464/446 ion pairs arising from loss of 20:5-FA substituent are present in Fig 6d, consistent with the observation of m/z 301 and 257 (301 − CO2). MS3 on the ion of m/z 464 (748.5 → 464) gave rise to m/z 267, and the spectrum is similar to Fig 6b (data not shown). These results led to assignment of a minor p18:0/20:5-PE isomer. The above results demonstrate that implementing HR linear ion-trap multiple stage mass spectrometry (LIT MSn) for lipidomic analysis readily led to confident structure assignments, revealing the presence of many isomeric structures, including very minor isomers.
Fig 6.
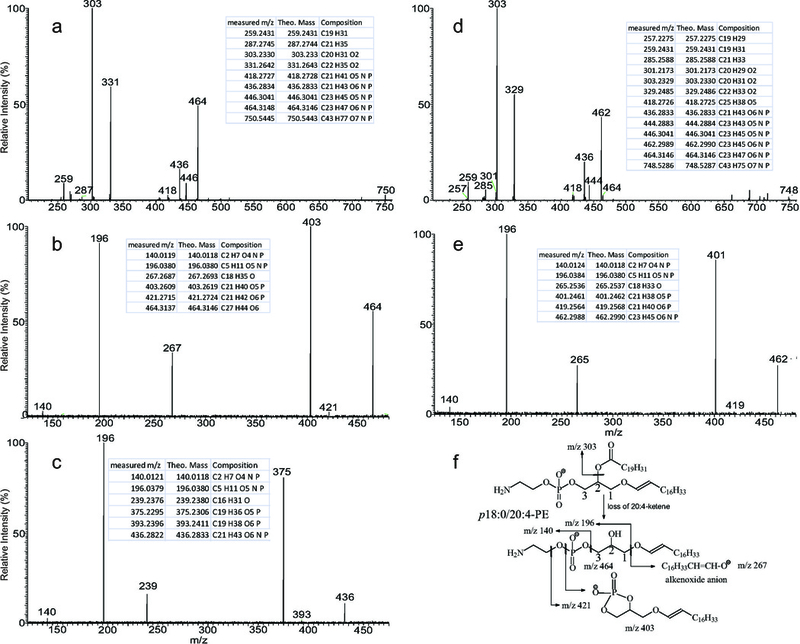
(a) The high resolution (R=100,000, at m/z 400) CID product-ion spectrum of the ion of m/z 750 obtained by an Orbitrap instrument, and its MS3 spectra of the ions of (b) m/z 464 (750 →464) and (c) 436 (750 →436). Panel d shows the high resolution CID product-ion spectrum of the ion of m/z 748, and (e) its MS3 spectrum of the ion of m/z 462 (748 →462). The proposed fragmentation processes from MS2 and MS3 leading to assignment of p18:0/20:4-PE structure are shown in Panel f. The inset Tables are the HR mass measurements of the fragment ions, the theoretical masses and their deduced elemental compositions.
High resolution shotgun lipidomics using data-dependent acquisition with a QqTOF instrument performing multiple precursor ion scanning or a LIT Orbitrap applying HCD tandem MS [49,24,71], and data independent acquisition scans with a LIT Orbitrap performing CID/HCD MSn [35] all generate huge amount of data, which require tremendous amount of logistics support to make the analysis possible, in addition to the hefty price tag of the high-end mass spectrometers and the chip-based infusion device (e.g., the Advion TriVersa NanoMate); thereby, the approach is very difficult to implement. Another limitation is that the genuine linked PIS and NLS features that are readily available to a TSQ instrument is not applicable to today’s HRMS instruments. Recently, Synder et al developed a single analyzer neutral loss scan and parent ion scan in a linear quadrupole ion trap that extends the application of IT technology to another dimension in the MS analysis. However, whether if the technology can be extended to the FT based HRMS (e.g., Orbitrap) and to lipidomic analysis remains to be seen [87,101].
Shotgun lipidomics using MALDI-TOF mass spectrometry
MALDI-TOF has been used for analysis of various lipid classes [102–105]. The ease of instrument operation and sample preparation, the speed of the analysis, and free of crossover sample contamination, make MALDI-TOF an ideal complementary tool for shotgun lipidomic analysis. In this context, MALDI-TOF has allowed researchers to engage imaging lipids, mapping the distribution of various lipids in different tissues with success [10,106–109]. MALDI-TOF equipped with a reflectron and delayed extraction achieves > 20,000 resolution and offers good mass accuracy for assigning intact molecular ions of lipid species. The downside of this technology, at present, is lack of reproducibility and lack of universal matrix for lipid analysis. Despite that 2,5-dihydroxy benzoic acid, α-cyano-4-hydroxy-cinnamic acid, 9-amino-acridine and 5-Chloro-2-mercaptobenzothiazole have been the most commonly used [102], the selection of matrixes so far has, mainly relied on try and error. The interference of matrix ions in the mass range <600 Da, the unpredictable adduct ion formation (i.e., alkali metal, and matrix-lipid adduct ions), and ion suppression of low abundance molecules by high abundance or easily ionizable species also deter its application in the analysis of crude lipid extracts [110]. Because of the drastic differences in ionization efficiency among different lipid classes due to their physical states such as the polarity and salt content, the ion intensity in the MALDI-TOF spectra is also not always a good reflection of the actual relative abundances of the molecules in a mixture. MALDI-TOF also generates artifacts, such as DAGs from prompt fragmentation of TAGs. Nevertheless, MALDI-TOF provides a fast, easy and useful tool for profiling complex lipid mixture, in particular, microbial lipids such as lipid A [111] and phosphatidylinositol mannosides [112]. More recently, an innovative laser-based post-ionization approach coined as MALDI-2, which utilizes a second post-ionization laser beam for secondary MALDI-like ionization of the plume of the matrix; and the analyte molecules generated by the standard MALDI laser was introduced [113]. This innovation was found to increase up to 2 orders of magnitude sensitivity for many lipid classes and minimize ion suppression from MALDI-1. However, the application is mainly focused on imaging, and the use for shotgun lipidomic analysis has not been reported [113,114 ]. Another recent innovation to overcome ion suppression of targeted lipid analytes and low mass ions by compounds that exhibit more efficient ionization and/or are present at high abundance is a nanoparticle-assisted laser desorption/ionization (LDI) MS approach using, e.g., dopamine-modified TiO2 monolith as an alternative to traditional MALDI matrixes. This approach has been successfully applied to localize small metabolites (molecular mass below 500 Da) and lipids in the mouse brain for MS imaging. Again, whether if this method can be used for shotgun lipidomic fingerprinting remains to be seen [109].
MALDI coupled to TOF/TOF instruments has limited success in the structural analysis of complex lipid structures [115–117]. Fragment ions seen in MALDI-TOF and MALDI-TOF/TOF spectra are often from post source decay (PSD) of the precursor ions [118]. Fragment ions from MALDI-TOF PSD are broad and the low m/z fragment ions are less detectable. To obtain product ions with wide range of energies produced by PSD, the curved-field reflectron time-of-flight/time of flight (MALDI TOF/ReTOF) mass spectrometer was invented [119,120], and structural analysis of a variety of lipids have been reported [115,116,121]. Similarly, the MALDI TOF/TOF instrument developed by Bruker Daltonics used “LIFT” technology, which allows all the fragment ions from laser induced dissociation followed by CID with 8 KeV energy, to be detected in a single run [122]. All the above designs allow unit mass resolution of fragment ions, providing structural information complimentary to that obtained by low energy CID. For example, tandem TOF mass spectra contain rich structural information for locating the methyl side chain, functional group(s), and the alkyl tail of long chain fatty acids [123]. However, the application in the structural analysis of lipid in a mixture is constrained by the fact that the precursor ion selection window of today’s instruments (MALDI TOF/TOF instruments from Bruker and Shimadzu alike) fails to isolate two ions that are 2 Da apart for further dissociation. Thus, product-ion spectra from two different ion species that are 2 Da apart in a mixture, such as two similar lipid species differed by a double bond, are indistinguishable [123].
Recently, a spiral MALDI-TOF/TOF instrument with 60 K resolving power was developed [124] to allow monoisotopic isolation of the precursor ions that can be further subjected to CID with 20 keV energy to obtain tandem mass spectrum for near complete characterization of several lipid compounds [125–128]. This innovation may revive the interest in employing high energy CID tandem mass spectrometric approach for structural identification of complex lipids. However, the conversion efficiency (precursor to product ion) remains low, which is typical of a high energy CID process.
In comparison with MALDI TOF shotgun lipidomics, ambient ionization techniques that do not require matrix such as DESI (desorption electrospray ionization) [129,130] and REIMS (Rapid evaporative ionization mass spectrometry) [131] have recently entered the rather crowded shotgun lipidomic arena, indicating the increasing awareness of the importance of this field. All these approaches target lipid analysis or lipid imaging using the similar ESI method with modification, with the mission that lipid profiling can be completed within a short period of time with the simplest sample preparation to the norm of shotgun lipidomics; rather than the comprehensive analysis conducted by the conventional approach. All these methods focus mainly on the clinical application [132–134] and seldom had been seen in the advance of the knowledge of lipidomics.
Long-standing issues in shotgun lipidomics
a. Artificial lipid ion species generated by electrospray ionization
In shotgun lipidomics, it should be noticed that artifacts generated by the ESI process are inevitable, resulting in faulty structural identification. For examples, PA, lyso-PPL (including lyso-CL), DAG, MAG and fatty acids can be generated from glycerophospholipids, and extensive dissociation has been observed for, for examples, ceramide in the positive-ion mode (loss of H2O) and acyl-CoA. Meanwhile, dimer formation, and adduct ion formation across different lipid species in the same family, and different lipid families are also commonly occurred, adding complexity and uncertainty to the ESI MS-based shotgun lipidomic analysis. Such formations have been seen for nearly all the lipid families, in particular, when ionization occurred in a more concentrated lipid condition. The degree of formation also depends on the lipid classes and the content of the solvents that dissolve the lipid. For example, PC forms various adducts with various anionic ions [135], and these adduct ions have been exploited for structural characterization, applying CID tandem mass spectrometry [135,100]. In the presence of Cl−, the d18:1/hFA-Cer subclass forms adduct ion with Cl−(formation of [M + Cl]−) much more preferentially than does the d18:1/nFA-Cer subclass [62] (Cl- can arise from CHCl3 as solvent that dissolves lipids when ionization takes place). Skin ceramides in the Cer[OH] family such as t18:1/ωhFA-Cer at m/z 764 and t20:1/ωhFA at m/z 792 [136] form unusual adduct ions with long chain fatty acid (RCO2−) such as palmitic anion (C15H31CO2−) to form [M + C15H31CO2]− ions at m/z 1020 and 1048 (Fig 7a). Cer[AS] (e.g., d16:1/ αh16:0-Cer, d17:1/αh16:0-Cer and d18:1/αh16:0-Cer at m/z 524, 538 and 552, respectively) forms Cer[AS]-FA adduct ions at m/z 780,794, 808 with 16:0-FA and at m/z 808, 822, and 836 with 18:0-FA (Fig 7b, inset at left) and Cer[AdS] (e.g., d16:0/ αh16:0-Cer, d17:0/αh16:0-Cer and d18:0/αh16:0-Cer at m/z 526, 540 and 554, respectively) form the similar Cer[AdS]-FA adduct ions (ions seen at m/z 782, 796, 810 and at 810, 824, and 838), but Cer[AdS] also form dimers such as ions at m/z 1080, 1094 and 1108, while dimer formation for Cer[AS] family (e.g., ions expected at m/z 1048, 1062, 1076, 1090 and 1104) were not observed (Fig. 7b, inset at right). These adduct ions are readily identified by HRMS (Fig 7b). In a lipid extract from Listeria monocytogenes cells containing high content of PGs [137], the aggregation between PG and diglucosyl diacylglycerol (DGDG) to form PG-DGDG dimer ions of m/z 1614, 1598, etc (Fig 7c, inset) is much more favorable than formation of the [M + Cl]− ions seen at m/z 927, 913, and 899, which were also more abundant than the corresponding [M − H]− ions of DGDG seen at m/z 891, 877, 863, etc. Thus, these adduct formations severely compromise the sensitivity of DGDG, if it is to be detected as the [M − H]− ions in the negative ion mode. Meanwhile, formation of PG dimers (in the same sample) not only occurred across the various species, but also is species dependent. For example, the ion of m/z 1428 representing a (17:0/15:0-PG)-(p17:0/15:0-PG) dimer is more abundant than the same species dimer ion of m/z 1444 ([17:0/15:0-PG]2), which is more abundant than m/z 1412 ([p17:0/15:0-PG]2) (Fig 7c, inset at right). In the current shotgun lipidomic analysis, such formations are often left unaccounted for due to the complexity of the ion formation; and the high mass cutoff in a MS scan that the high m/z covering dimer ions is not scanned. These problems underscore the limitation of shotgun lipidomics towards a very precise lipid analysis.
Fig 7.
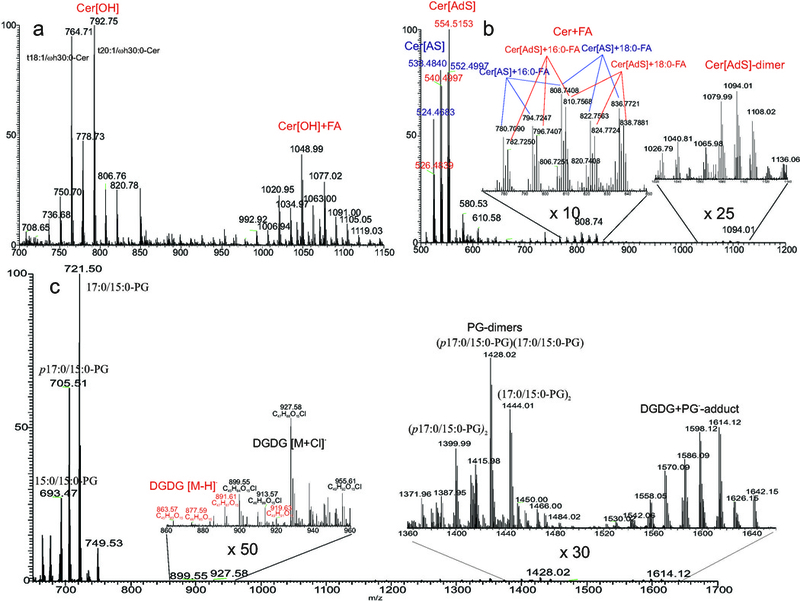
The high resolution (HR) ESI MS of the [M − H]− ions of (a) skin Cer[OH] family (e.g., ions at m/z 764 and 792), and the adduct ions formed with 16:0-FA (e.g., ions at m/z 1020, and 1048); and of (b) skin Cer[AS] (e.g., ions at m/z 524, 538 and 552) and Cer[AdS] (e.g., ions at m/z 526, 540 and 554) subclasses and the adduct ions formed with FA (b, inset at left). Cer[AdS] also forms dimer anions (Panel b, inset at right). The formation of these adduct ions is consistent with HR mass measurements that gave the elemental composition of the sum of the two species ((FA[M − H]− ion + Cer) or (Cer [M − H]− ion + FA) alike). For example, aggregation of ions of m/z 524.4683 (formula: C32H62O4N), 538.4840 (C33H64O4N), and 552.4997 (C34H66O4N) in the Cer[AS] family with 16:0-FA at 256.2402 ( C16H32O2), gave ions at m/z 780.7090 (C48H94O6N), 794.7247 (C49H96O6N) and 808.7496 (C50H98O6N). The measured deviations by an Orbitrap Velos are within 1 ppm. All adduct ion formations are readily revealed by HRMS (inset at left). Panel c shows the ESI MS of the [M − H]− ions of PG and diglucosyl diacylglycerol (DGDG), and its Cl- adduct ions (inset at left) in a lipid extract from L. monocytogenes cells. Formation of PG-DGDG dimers (inset at right) is also present in higher abundance than DGDG desorbed as the [M − H]− ions (label in red). Panel c (inset at right) shows the ions of PG dimeric anions formed from across species (PG-pPG), or same species (PG-PG) aggregations.
b. The structural details of the long-chain fatty acid substituents and the stereochemistry of lipid
Another long-standing issue in shotgun lipidomic analysis is that the structural details of the fatty acyl substituents including the location of functional groups such as methyl, hydroxyl, double bond(s), and/or cyclo side group(s) along the chain (if present), as well as the cis/trans geometry and the stereochemistry such as region-specificity are often left unreported because they are very difficult to define. The cis/trans geometry cannot be addressed by any MS-based shotgun lipidomics means. One study reported a very slight difference in the spectra generated by electron impact excitation of the ion pairs of a cis and trans monounsaturated fatty acyl formed by ESI for their distinction. However, the difference is within the instrument variation during acquisition [138]. A speculation that possible differences in the reaction rate and branching (i.e., the generated fragment ion pairs induced by ozone) ratio between a cis/trans monounsaturated fatty acid pairs upon subjected to ozone-induced dissociation (OzID) mass spectrometry may exist, and these differences may be potentially used for their differentiation [139]. Both high energy (KeV) and low energy CID tandem mass spectrometry have been successfully applied to decipher the structure details of long chain fatty acids and the fatty acyl substituents inside complex lipids with or without derivatization [57,140–142,123]. However, tremendous efforts are required, increasing the throughput time. Infusion/OzID mass spectrometry is useful and effective in the location of double bond(s), but the approach is difficult to implement (e.g., modification of instrument is required) [54]. Although infusion/OzID mass spectrometry is applicable to locate unsaturated bond(s) in the lipid molecules with simplest structures, application to lipids possessing multiple acyl groups with heterogeneous unsaturated fatty acyl chains, or present in multiple isomeric forms that are commonly seen in the lipid samples of biological origins, is yet to be demonstrated. The implementation of OzID ion trap mass spectrometry has shown that ions from MS2 can be isolated and further subjected to OzID, resulting in location of double bond on another alkyl chain, but with drastic decrease in sensitivity [54]. Most recently, an HPLC/ion mobility separation has been implemented to the device to improve the technique, and a mixture of standards containing various lipid classes and isomers can be analyzed in a single run [53]. However, whether if this method is applicable to the more complex lipid mixture remains to be seen. Another innovation implementing online photochemical derivatization (Paternò–Büchi reaction) with tandem mass spectrometry into a shotgun lipidomics workflow has demonstrated the promise in which the double bond positions of the long chain fatty acids, and of the fatty acid substituents inside the glycerophospholipids can be elucidated and quantitation of isomeric structures in a mixture can be performed [38]. This approach first applied acetone as the Paternò–Büchi (PB) reagent for 250-nm UV irradiation to add acetone to the intact unsaturated lipids to form PB products (add 58 Da), which was subsequently subjected to low-energy CID to yield fragment ions by cleavages of the original C=C bonds, permitting location of double bond(s). This innovation requires no instrument modification and can be easily implemented and suitable in a shotgun lipidomic setting; and data interpretation is relatively simple [38]. The method appears to be most applicable to glycerophospholipids with homoconjugated unsaturated fatty acid moieties. Polyunsaturated long-chain fatty acids such as 20:4-FA desorbed as [M -H]− ions are not applicable, but can be achieved in the less well formed [M + Li]+ form [38]. In this regards, this approach may not be that far superior than the other tandem mass spectrometric approaches that characterize the same molecules as metal adduct ions or as derivatives using high energy/low energy CID [117,141–143].
Tandem mass spectrometry is effective in determining the region-specificity, e.g., the sn-1/sn-2 position of the fatty acyl substituents on the glycerol backbone of glycerophospholipids [9]. However, it cannot address the purity of the molecule if both isomers (e.g., both A/B and B/A in sn-1/sn-2 configuration) coexist.
Quantitation challenges in shotgun lipidomics
The ever-increasing in the sensitivity, and improvement in resolution and the linear range of modern instruments make today’s mass spectrometry instrument a powerful tool for lipid quantitation. However, to achieve accuracy and precision in shotgun lipidomic quantitation requires not only the specific details in execution of the experiments, but also a long length of process time that against the norm of shotgun lipidomics. A complete coverage of shotgun lipidomic quantitation is another subject matter; and will not be addressed in detail in this review. An insightful article covering all aspects of lipidomic quantitation by Wang and coworkers is recommended to readers [80].
To obtain absolute or relative quantitation, internal standard(s) has to be added before lipid extraction. Ideally, a stable isotope labeled analogous molecule, in particular, 13C-labeled counterpart can be used because of its unique property that can behave in the same manner as the analyate during sample preparation and MS analysis (this quantitation strategy is coined as “stable isotope dilution”). For global lipid quantitative analysis, however, it is not possible that all the stable isotope standards are available and can be added simultaneously. Hence, the stable isotope dilution strategy can only be suitable for very few targeted lipid quantitation, and can only be fulfilled with a higher cost (isotope labeled standard is usually expensive), if available.
A compromised approach without using stable isotope internal standards to achieve a more accurate quantitation is the use of non-isotope labeled internal standards such as homologous lipids which are either chain shortened species or odd carbon number fatty acyl containing species that normally are either rare or absent in the biological samples. The short-chain homolog internal standards, for example, 1,2-dimyristoryl (14:0) or 1,2-dimyristoleoyl (14:1) [13,144,84] containing phospholipid, is typically chosen so that the molecular weight of the internal standard is away from but close to that of the endogenous species. Thereby, a narrower mass scan range (more sensitivity due to increased duty cycle) and less discriminatory scan (less chain length dependency) can be performed.
Not all lipid molecular species can be detected with equal efficiency, i.e., the response of mass spectrometer to the lipid is dependent on the lipid class, the chain length, the lipid concentration, and the unsaturation state of the acyl chain of the molecule [80,145]. To address this problem, a minimum of two internal standards or three with one (di)unsaturated fatty acyl chain that cover the entire mass range have been suggested to be included for each lipid class to correct the dependency problems [80,145]. However, the inclusion of so many internal standards adds the complexity, significantly increases the data analysis time. Additionally, it is also time consuming to prepare a cocktail including optimal amount of all the internal standards to be added (i.e., trial and error work up procedure is required).
Recently, shotgun lipidomics with ion-mobility adopting the standard shotgun lipidomics workflows was implemented, enabling to separate and identify isomeric and isobaric lipids independent of the resolution settings of the MS analysis to improve the accuracy in quantitation [27]. This approach leads to highly comprehensive and quantitative lipidomic analysis via Q1 or MRM scan in a triple quadrupole instrument for rapid lipid profiling. The MRM approach is complimentary to the high resolution MS approach without adding much analysis time and significantly increase the sensitivity and specificity. Despite the improvement by addition of the separation step, the inclusion of internal standard(s) for precise quantitation is inevitable.
Absolute quantitation remains a significant challenge even if reference compounds are available and thus the response factors for all the lipid species to be measured can be precisely estimated. In contrast, relative quantitation, e.g., assessing fold change in the biological study, where the signal of the target lipid relative to the internal standard is to be evaluated, even a single internal standard could possibly be used for correction of the variations caused by sample preparation, ionization process, or CID ion chemistry. This is by far the most reachable goal for modern shotgun lipidomic quantitation.
Conclusions
“Shotgun lipidomics” intends to achieve quantitative and qualitative analysis of the heterogeneous lipids of biological origin within a short period of time using mass spectrometric techniques without chromatographic separation. The power of this techniques can be envisioned by the completion of the entire lipidome of various cells [146–148,43,13,149]. The technique combined with other “-omic” techniques such as genomics, has also led to the realization of many important roles that lipids play in the biological system [15,37,150–154,39].
As described, each shotgun lipidomic method has its advantages, disadvantages and limitations. “Shotgun lipidomics” mainly addresses all the major lipid content and the targeted lipids; and minor species and the unexpected new lipids are often left unreported. LC/MS lipidomic approach, on the other hand, adds another dimension in the analysis, thus, crossover lipid class interference, dimer formation across different lipid classes and adduct ion formations that often confound structural analysis can be minimized and more structural coverage and more accurate structural assignment can be achieved. The advance of liquid chromatography-ion mobility-mass spectrometry (LC-IM-MS) offers an additional dimension to separate lipid species by molecular size, shape, and charge. Thereby, more structural information and more confident structural assignments can be accomplished [31]. Nevertheless, the addition of HPLC or other separation methods for more complete lipidomic analysis can only come with a trade-off of the “speed”, which is hallmark of “shotgun lipidomics”.
Nowadays many Web resources such as cyberlipid center (http://www.cyberlipid.org/) and AOCS lipid library (http://lipidlibrary.aocs.org/) provide invaluable information for lipid studies. To fulfill high throughput mass spectrometry lipidomic analysis, database search to enable quickly retrieve relevant information from thousands of records in a lipid database becomes increasingly important. Tools that have been developed for analysis of MS based lipidomic data include MS and MS/MS data by various labs [88,155–158], and lipid consortium such as LIPID MAPS Lipidomics Gateway (www.lipidmaps.org/resources/tutorials/databases.html), and National Institute of Standards and Technology (NIST) (http://chemdata.nist.gov/mass-spc/ms search); and commercialized software such as Lipidyzer™ (https://sciex.com/applications/life-science-research/lipidomics/lipidyzer-platform), LipidSearch™ (https://www.thermofisher.com/order/catalog/product), and SimLipid® (www.premierbiosoft.com) also become available. However, user discretion is advised to avoid data misinterpretation.
The continuous advance in mass spectrometry techniques and development in bioinformatics, and more importantly, the ceaseless efforts of many elite researchers in this field make shotgun lipidomics a reality. However, caution should be exercised to avoid false-positive and false negative identification in the shotgun lipidomic analysis (As a reviewer for many prestigious journals in the field of lipidomics for many years, this author has received many manuscripts that contained errors in the assignment of lipid structures, utilizing database tools including both free online search such as LIPIDMAP and commercial database. The errors mainly stemmed from authors who are lack of basic knowledge in either MS or lipid biochemistry, and some errors are inconceivable). After all, insight into the exact biochemical events and complex biochemical interactions taken place at the cellular level is more than lipidomic analysis, which is far beyond being a layman’s term.
Acknowledgments
This work is supported by US Public Health Service Grants P41-GM103422, P60-DK-20579, P30-DK56341, 4R33HL120760-03 and R01AI130454. The author acknowledges Dr. Cheryl Frankfater and the reviewers for proofreading of the manuscript.
Abbreviations:
- FFA
free fatty acid
- PC
phosphatidylcholine
- PE
phosphatidylethanolamine
- PS
phosphatidylserine
- pPS
plasmalogen phosphatidylserine
- PG
phosphatidylglycerol
- PI
phosphatidylinositol
- PA
phosphatidic acid
- SM
sphingomyelin
- Sulf
sulfatide
- Cer
ceramide
- Cer[OH]
ω-hydroxy fatty acyl containing ceramide
- Cer[AS]
α-hydroxy fatty acyl containing ceramide
- Cer[AdS]
α-hydroxy fatty acyl containing dihydrosphingosine ceramide
- GalCer
galactosylceramide
- GlcCer
glucosylceramide
- TAG
triacylglycerol
- DAG
diacylglycerol
- CL
cardiolipin
- DGDG
diglycosyldiacylglycerol
- ESI
electrospray ionization
- MS
mass spectrometry
- TSQ
triple stage quadrupole
- FT ICR
Fourier transform ion cyclotron resonance
- MALDI
matrix assisted laser desorption ionization
- TOF
time-of-flight
- FAB
fast atom bombardment
- PIS
precursor ion scan
- NLS
neutral loss scan
- CID
collision induced dissociation
- HR
high resolution
- LC
liquid chromatography
- TLC
thin layer chromatography
- IM
ion mobility
- SFC
supercritical fluid chromatography
Footnotes
The author declares no conflict of interest.
References:
- 1.Fenn JB, Mann M, Meng CK, Wong SF, Whitehouse CM (1989) Electrospray ionization for mass spectrometry of large biomolecules. Science 246 (4926):64–71 [DOI] [PubMed] [Google Scholar]
- 2.Whitehouse CM, Dreyer RN, Yamashita M, Fenn JB (1985) Electrospray interface for liquid chromatographs and mass spectrometers. Anal Chem 57 (3):675–679 [DOI] [PubMed] [Google Scholar]
- 3.Weintraub ST, Pinckard RN, Hail M (1991) Electrospray ionization for analysis of platelet-activating factor. Rapid Commun Mass Spectrom 5 (7):309–311 [DOI] [PubMed] [Google Scholar]
- 4.Kim HY, Wang TC, Ma YC (1994) Liquid chromatography/mass spectrometry of phospholipids using electrospray ionization. Anal Chem 66 (22):3977–3982 [DOI] [PubMed] [Google Scholar]
- 5.Han X, Gross RW (1995) Structural determination of picomole amounts of phospholipids via electrospray ionization tandem mass spectrometry. J Am Soc Mass Spectrom 6 (12):1202–1210 [DOI] [PubMed] [Google Scholar]
- 6.Han X, Gross RW (2005) Shotgun lipidomics: electrospray ionization mass spectrometric analysis and quantitation of cellular lipidomes directly from crude extracts of biological samples. Mass Spectrom Rev 24 (3):367–412 [DOI] [PubMed] [Google Scholar]
- 7.Han X, Gross RW (1994) Electrospray ionization mass spectroscopic analysis of human erythrocyte plasma membrane phospholipids. Proc Natl Acad Sci U S A 91 (22):10635–10639 [DOI] [PMC free article] [PubMed] [Google Scholar]
- 8.Pulfer M, Murphy RC (2003) Electrospray mass spectrometry of phospholipids. Mass Spectrom Rev 22 (5):332–364 [DOI] [PubMed] [Google Scholar]
- 9.Hsu F-F, Turk J (2009) Electrospray Ionization with Low-energy Collisionally Activated Dissociation Tandem Mass Spectrometry of Glycerophospholipids: Mechanisms of Fragmentation and Structural Characterization. J Chromatogr B, Analytical technologies in the biomedical and life sciences 877 (26):2673–2695. 10.1016/j.jchromb.2009.02.033 [DOI] [PMC free article] [PubMed] [Google Scholar]
- 10.Zemski Berry KA, Hankin JA, Barkley RM, Spraggins JM, Caprioli RM, Murphy RC (2011) MALDI Imaging of Lipid Biochemistry in Tissues by Mass Spectrometry. Chemical Reviews 111 (10):6491–6512. 10.1021/cr200280p [DOI] [PMC free article] [PubMed] [Google Scholar]
- 11.Murphy RC, Gaskell SJ (2011) New Applications of Mass Spectrometry in Lipid Analysis. J Biol Chem 286 (29):25427–25433. 10.1074/jbc.R111.233478 [DOI] [PMC free article] [PubMed] [Google Scholar]
- 12.Brügger B, Erben G, Sandhoff R, Wieland FT, Lehmann WD (1997) Quantitative analysis of biological membrane lipids at the low picomole level by nano-electrospray ionization tandem mass spectrometry. Proc Natl Acad Sci USA 94 (6):2339–2344 [DOI] [PMC free article] [PubMed] [Google Scholar]
- 13.Han X, Gross RW (2003) Global analyses of cellular lipidomes directly from crude extracts of biological samples by ESI mass spectrometry: a bridge to lipidomics. J Lipid Res 44 (6):1071–1079 [DOI] [PubMed] [Google Scholar]
- 14.Han X, Gross RW (2005) Shotgun lipidomics: multidimensional MS analysis of cellular lipidomes. Expert Rev Proteomics 2 (2):253–264 [DOI] [PubMed] [Google Scholar]
- 15.Welti R, Wang X (2004) Lipid species profiling: a high-throughput approach to identify lipid compositional changes and determine the function of genes involved in lipid metabolism and signaling. Current Opin Plant Biol 7 (3):337–344. 10.1016/j.pbi.2004.03.011 [DOI] [PubMed] [Google Scholar]
- 16.Han X, Jiang X (2009) A review of lipidomic technologies applicable to sphingolipidomics and their relevant applications. Eur J Lipid Sci Technol 111 (1):39–52 [DOI] [PMC free article] [PubMed] [Google Scholar]
- 17.Yang K, Cheng H, Gross RW, Han X (2009) Automated lipid identification and quantification by multidimensional mass spectrometry-based shotgun lipidomics. Anal Chem 81 (11):4356–4368 [DOI] [PMC free article] [PubMed] [Google Scholar]
- 18.Ståhlman M, Ejsing CS, Tarasov K, Perman J, Borén J, Ekroos K (2009) High-throughput shotgun lipidomics by quadrupole time-of-flight mass spectrometry. J Chromatogr B 877 (26):2664–2672. 10.1016/j.jchromb.2009.02.037 [DOI] [PubMed] [Google Scholar]
- 19.Blanksby SJ, Mitchell TW (2010) Advances in mass spectrometry for lipidomics. Annu Rev Anal Chem 3:433–465 [DOI] [PubMed] [Google Scholar]
- 20.Leiker TJ, Barkley RM, Murphy RC (2011) Analysis of Diacylglycerol Molecular Species in Cellular Lipid Extracts by Normal-Phase LC-Electrospray Mass Spectrometry. Int J Mass Spectrom 305 (2–3):103–109 [DOI] [PMC free article] [PubMed] [Google Scholar]
- 21.Schwudke D, Schuhmann K, Herzog R, Bornstein SR, Shevchenko A (2011) Shotgun Lipidomics on High Resolution Mass Spectrometers. Cold Spring Harbor Perspectives in Biology 3 (9):a004614 10.1101/cshperspect.a004614 [DOI] [PMC free article] [PubMed] [Google Scholar]
- 22.Murphy RC, Leiker TJ, Barkley RM (2011) Glycerolipid and Cholesterol Ester Analyses in Biological Samples by Mass Spectrometry. Biochimica et Biophysica Acta 1811 (11):776–783. 10.1016/j.bbalip.2011.06.019 [DOI] [PMC free article] [PubMed] [Google Scholar]
- 23.Köfeler HC, Fauland A, Rechberger GN, Trötzmüller M (2012) Mass Spectrometry Based Lipidomics: An Overview of Technological Platforms. Metabolites 2 (1):19. [DOI] [PMC free article] [PubMed] [Google Scholar]
- 24.Schuhmann K, Almeida R, Baumert M, Herzog R, Bornstein SR, Shevchenko A (2012) Shotgun lipidomics on a LTQ Orbitrap mass spectrometer by successive switching between acquisition polarity modes. J Mass Spectrom 47 (1):96–104. 10.1002/jms.2031 [DOI] [PubMed] [Google Scholar]
- 25.Han X, Yang K, Gross RW (2012) Multi-dimensional mass spectrometry-based shotgun lipidomics and novel strategies for lipidomic analyses. Mass Spectrom Rev 31 (1):134–178 [DOI] [PMC free article] [PubMed] [Google Scholar]
- 26.Brügger B (2014) Lipidomics: Analysis of the lipid composition of cells and Subcellular organelles by Electrospray ionization mass spectrometry. Annu Rev Biochem, vol 83 10.1146/annurev-biochem-060713-035324 [DOI] [PubMed] [Google Scholar]
- 27.Lintonen TP, Baker PR, Suoniemi M, Ubhi BK, Koistinen KM, Duchoslav E, Campbell JL, Ekroos K (2014) Differential mobility spectrometry-driven shotgun lipidomics. Anal Chem 86 (19):9662–9669 [DOI] [PubMed] [Google Scholar]
- 28.Papan C, Penkov S, Herzog R, Thiele C, Kurzchalia T, Shevchenko A (2014) Systematic Screening for Novel Lipids by Shotgun Lipidomics. Anal Chem 86 (5):2703–2710. 10.1021/ac404083u [DOI] [PubMed] [Google Scholar]
- 29.Roberg-Larsen H, Lund K, Vehus T, Solberg N, Vesterdal C, Misaghian D, Olsen PA, Krauss S, Wilson SR, Lundanes E (2014) Highly automated nano-LC/MS-based approach for thousand cell-scale quantification of side chain-hydroxylated oxysterols. J Lipid Res 55 (7):1531–1536. 10.1194/jlr.D048801 [DOI] [PMC free article] [PubMed] [Google Scholar]
- 30.Lisa M, Holcapek M (2015) High-Throughput and Comprehensive Lipidomic Analysis Using Ultrahigh-Performance Supercritical Fluid Chromatography-Mass Spectrometry. Anal Chem 87 (14):7187–7195 [DOI] [PubMed] [Google Scholar]
- 31.Paglia G, Kliman M, Claude E, Geromanos S, Astarita G (2015) Applications of ion-mobility mass spectrometry for lipid analysis. Anal Bioanal Chem 407 (17):4995–5007. 10.1007/s00216-015-8664-8 [DOI] [PubMed] [Google Scholar]
- 32.Groessl M, Graf S, Knochenmuss R (2015) High resolution ion mobility-mass spectrometry for separation and identification of isomeric lipids. Analyst 140 (20):6904–6911. 10.1039/c5an00838g [DOI] [PubMed] [Google Scholar]
- 33.Surma MA, Herzog R, Vasilj A, Klose C, Christinat N, Morin-Rivron D, Simons K, Masoodi M, Sampaio JL (2015) An automated shotgun lipidomics platform for high throughput, comprehensive, and quantitative analysis of blood plasma intact lipids. Eur J Lipid Sci Technol 117 (10):1540–1549. 10.1002/ejlt.201500145 [DOI] [PMC free article] [PubMed] [Google Scholar]
- 34.Wang C, Wang M, Han X (2015) Applications of mass spectrometry for cellular lipid analysis. Mol Biosyst 11 (3):698–713 [DOI] [PMC free article] [PubMed] [Google Scholar]
- 35.Almeida R, Pauling JK, Sokol E, Hannibal-Bach HK, Ejsing CS (2015) Comprehensive Lipidome Analysis by Shotgun Lipidomics on a Hybrid Quadrupole-Orbitrap-Linear Ion Trap Mass Spectrometer. J Am Soc Mass Spectrom 26 (1):133–148. 10.1007/s13361-014-1013-x [DOI] [PubMed] [Google Scholar]
- 36.Ghaste M, Mistrik R, Shulaev V (2016) Applications of Fourier Transform Ion Cyclotron Resonance (FT-ICR) and Orbitrap Based High Resolution Mass Spectrometry in Metabolomics and Lipidomics. International Journal of Molecular Sciences 17 (6):816 10.3390/ijms17060816 [DOI] [PMC free article] [PubMed] [Google Scholar]
- 37.Han X (2016) Lipidomics for studying metabolism. Nat Rev Endocrinol 12 (11):668–679 [DOI] [PubMed] [Google Scholar]
- 38.Ma X, Chong L, Tian R, Shi R, Hu TY, Ouyang Z, Xia Y (2016) Identification and quantitation of lipid C=C location isomers: A shotgun lipidomics approach enabled by photochemical reaction. Proc Natl Acad Sci USA 113 (10):2573–2578. 10.1073/pnas.1523356113 [DOI] [PMC free article] [PubMed] [Google Scholar]
- 39.Wang M, Wang C, Han RH, Han X (2016) Novel advances in shotgun lipidomics for biology and medicine. Prog Lipid Res 61:83–108 [DOI] [PMC free article] [PubMed] [Google Scholar]
- 40.Yang K, Han X (2016) Lipidomics: Techniques, Applications, and Outcomes Related to Biomedical Sciences. Trends Biochem Sci 41 (11):954–969 [DOI] [PMC free article] [PubMed] [Google Scholar]
- 41.Triebl A, Hartler J, Trotzmuller M, Kofeler HC (2017) Lipidomics: Prospects from a technological perspective. Biochim Biophys Acta 22 (17):30052–30055 [DOI] [PMC free article] [PubMed] [Google Scholar]
- 42.Wang C, Wang M, Han X (2015) Comprehensive and quantitative analysis of lysophospholipid molecular species present in obese mouse liver by shotgun lipidomics. Anal Chem 87 (9):4879–4887. 10.1021/acs.analchem.5b00410 [DOI] [PMC free article] [PubMed] [Google Scholar]
- 43.Ejsing CS, Sampaio JL, Surendranath V, Duchoslav E, Ekroos K, Klemm RW, Simons K, Shevchenko A (2009) Global analysis of the yeast lipidome by quantitative shotgun mass spectrometry. Proc Natl Acad Sci USA 106 (7):2136–2141 [DOI] [PMC free article] [PubMed] [Google Scholar]
- 44.Merrill AH Jr., Sullards MC, Allegood JC, Kelly S, Wang E (2005) Sphingolipidomics: high-throughput, structure-specific, and quantitative analysis of sphingolipids by liquid chromatography tandem mass spectrometry. Methods 36 (2):207–224 [DOI] [PubMed] [Google Scholar]
- 45.Yang K, Han X (2011) Accurate Quantification of Lipid Species by Electrospray Ionization Mass Spectrometry — Meets a Key Challenge in Lipidomics. Metabolites 1 (1):21–40. 10.3390/metabo1010021 [DOI] [PMC free article] [PubMed] [Google Scholar]
- 46.Laboureur L, Ollero M, Touboul D, Astarita G (2015) Lipidomics by Supercritical Fluid Chromatography. Int J Mol Sci 16 (6):13868–13884. 10.3390/ijms160613868 [DOI] [PMC free article] [PubMed] [Google Scholar]
- 47.Yamada T, Uchikata T, Sakamoto S, Yokoi Y, Nishiumi S, Yoshida M, Fukusaki E, Bamba T (2013) Supercritical fluid chromatography/Orbitrap mass spectrometry based lipidomics platform coupled with automated lipid identification software for accurate lipid profiling. J Chromatogr A 2:237–242 [DOI] [PubMed] [Google Scholar]
- 48.Taki T (2012) An approach to glycobiology from glycolipidomics: ganglioside molecular scanning in the brains of patients with Alzheimer’s disease by TLC-blot/matrix assisted laser desorption/ionization-time of flight MS. Biol Pharm Bull 35 (10):1642–1647 [DOI] [PubMed] [Google Scholar]
- 49.Schwudke D, Liebisch G, Herzog R, Schmitz G, Shevchenko A (2007) Shotgun Lipidomics by Tandem Mass Spectrometry under Data Dependent Acquisition Control. Methods in Enzymology 433:175–191. 10.1016/S0076-6879(07)33010-3 [DOI] [PubMed] [Google Scholar]
- 50.Ryan E, Reid GE (2016) Chemical Derivatization and Ultrahigh Resolution and Accurate Mass Spectrometry Strategies for “Shotgun” Lipidome Analysis. Acc Chem Res 49 (9):1596–1604 [DOI] [PubMed] [Google Scholar]
- 51.Baker PRS, Armando AM, Campbell JL, Quehenberger O, Dennis EA (2014) Three-dimensional enhanced lipidomics analysis combining UPLC, differential ion mobility spectrometry, and mass spectrometric separation strategies. J Lipid Res 55 (11):2432–2442. 10.1194/jlr.D051581 [DOI] [PMC free article] [PubMed] [Google Scholar]
- 52.Watson AD (2006) Thematic review series: Systems Biology Approaches to Metabolic and Cardiovascular Disorders. Lipidomics: a global approach to lipid analysis in biological systems. J Lipid Res 47 (10):2101–2111. 10.1194/jlr.R600022-JLR200 [DOI] [PubMed] [Google Scholar]
- 53.Poad BLJ, Zheng X, Mitchell TW, Smith RD, Baker ES, Blanksby SJ (2018) Online Ozonolysis Combined with Ion Mobility-Mass Spectrometry Provides a New Platform for Lipid Isomer Analyses. Anal Chem 90 (2):1292–1300. 10.1021/acs.analchem.7b04091 [DOI] [PMC free article] [PubMed] [Google Scholar]
- 54.Thomas MC, Mitchell TW, Harman DG, Deeley JM, Nealon JR, Blanksby SJ (2008) Ozone-Induced Dissociation: Elucidation of Double Bond Position within Mass-Selected Lipid Ions. Anal Chem 80 (1):303–311. 10.1021/ac7017684 [DOI] [PubMed] [Google Scholar]
- 55.Fahy E, Subramaniam S, Brown HA, Glass CK, Merrill AH Jr, Murphy RC, Raetz CR, Russell DW, Seyama Y, Shaw W, Shimizu T, Spener F, van Meer G, VanNieuwenhze MS, White SH, Witztum JL, Dennis EA (2005) A comprehensive classification system for lipids. J Lipid Res 46 (5):839–861 [DOI] [PubMed] [Google Scholar]
- 56.Han X, Yang K, Yang J, Fikes KN, Cheng H, Gross RW (2006) Factors influencing the electrospray intrasource separation and selective ionization of glycerophospholipids. J Am Soc Mass Spectrom 17 (2):264–274 [DOI] [PubMed] [Google Scholar]
- 57.Hsu FF, Turk J (2010) Electrospray ionization multiple-stage linear ion-trap mass spectrometry for structural elucidation of triacylglycerols: assignment of fatty acyl groups on the glycerol backbone and location of double bonds. J Am Soc Mass Spectrom 21 (4):657–669 [DOI] [PMC free article] [PubMed] [Google Scholar]
- 58.Hsu FF, Turk J (2000) Structural determination of sphingomyelin by tandem mass spectrometry with electrospray ionization. J Am Soc Mass Spectrom 11 (5):437–449 [DOI] [PubMed] [Google Scholar]
- 59.Hsu FF, Turk J (2001) Structural determination of glycosphingolipids as lithiated adducts by electrospray ionization mass spectrometry using low-energy collisional-activated dissociation on a triple stage quadrupole instrument. J Am Soc Mass Spectrom 12 (1):61–79 [DOI] [PubMed] [Google Scholar]
- 60.Lin MH, Miner JH, Turk J, Hsu FF (2017) Linear ion-trap MSn with high-resolution MS reveals structural diversity of 1-O-acylceramide family in mouse epidermis. J Lipid Res 58 (4):772–782 [DOI] [PMC free article] [PubMed] [Google Scholar]
- 61.Han X (2002) Characterization and direct quantitation of ceramide molecular species from lipid extracts of biological samples by electrospray ionization tandem mass spectrometry. Anal Biochem 302 (2):199–212 [DOI] [PubMed] [Google Scholar]
- 62.Hsu FF, Turk J (2002) Characterization of ceramides by low energy collisional-activated dissociation tandem mass spectrometry with negative-ion electrospray ionization. J Am Soc Mass Spectrom 13 (5):558–570 [DOI] [PubMed] [Google Scholar]
- 63.Hsu FF, Turk J (2005) Tandem mass spectrometry with electrospray ionization of sulfatides In: Caprioli R, Gross ML (eds) The Encyclopedia of Mass Spectrometry. Applications in Biochemistry, Biology, and Medicine, vol 3, Part A. Elsevier Science, New York, pp 473–497 [Google Scholar]
- 64.Hsu FF, Turk J (2004) Studies on sulfatides by quadrupole ion-trap mass spectrometry with electrospray ionization: structural characterization and the fragmentation processes that include an unusual internal galactose residue loss and the classical charge-remote fragmentation. J Am Soc Mass Spectrom 15 (4):536–546 [DOI] [PubMed] [Google Scholar]
- 65.Hsu FF, Turk J (2000) Characterization of phosphatidylinositol, phosphatidylinositol-4-phosphate, and phosphatidylinositol-4,5-bisphosphate by electrospray ionization tandem mass spectrometry: a mechanistic study. J Am Soc Mass Spectrom 11 (11):986–999 [DOI] [PubMed] [Google Scholar]
- 66.Hsu FF, Turk J, Rhoades ER, Russell DG, Shi Y, Groisman EA (2005) Structural characterization of cardiolipin by tandem quadrupole and multiple-stage quadrupole ion-trap mass spectrometry with electrospray ionization. J Am Soc Mass Spectrom 16 (4):491–504 [DOI] [PubMed] [Google Scholar]
- 67.Hsu FF, Turk J (2005) Tandem mass spectrometry with electrospray ionization of sphingomyelins In: Caprioli R, Gross ML (eds) The Encyclopedia of Mass Spectrometry. Applications in Biochemistry, Biology, and Medicine, vol 3, Part A. Elsevier Science, New York, pp 430–447 [Google Scholar]
- 68.Hsu FF, Turk J, Zhang K, Beverley SM (2007) Characterization of inositol phosphorylceramides from Leishmania major by tandem mass spectrometry with electrospray ionization. J Am Soc Mass Spectrom 18 (9):1591–1604 [DOI] [PMC free article] [PubMed] [Google Scholar]
- 69.Hsu FF, Turk J (2000) Characterization of phosphatidylethanolamine as a lithiated adduct by triple quadrupole tandem mass spectrometry with electrospray ionization. J Mass Spectrom 35 (5):595–606 [DOI] [PubMed] [Google Scholar]
- 70.Kamel AM, Brown PR, Munson B (1999) Effects of Mobile-Phase Additives, Solution pH, Ionization Constant, and Analyte Concentration on the Sensitivities and Electrospray Ionization Mass Spectra of Nucleoside Antiviral Agents. Anal Chem 71 (24):5481–5492. 10.1021/ac9906429 [DOI] [PubMed] [Google Scholar]
- 71.Schuhmann K, Herzog R, Schwudke D, Metelmann-Strupat W, Bornstein SR, Shevchenko A (2011) Bottom-up shotgun lipidomics by higher energy collisional dissociation on LTQ Orbitrap mass spectrometers. Anal Chem 83 (14):5480–5487 [DOI] [PubMed] [Google Scholar]
- 72.Liebisch G, Drobnik W, Lieser B, Schmitz G (2002) High-throughput quantification of lysophosphatidylcholine by electrospray ionization tandem mass spectrometry. Clin Chem 48 (12):2217–2224 [PubMed] [Google Scholar]
- 73.Liebisch G, Binder M, Schifferer R, Langmann T, Schulz B, Schmitz G (2006) High throughput quantification of cholesterol and cholesteryl ester by electrospray ionization tandem mass spectrometry (ESI-MS/MS). Biochim Biophys Acta 1:121–128 [DOI] [PubMed] [Google Scholar]
- 74.Liebisch G, Drobnik W, Reil M, Trumbach B, Arnecke R, Olgemoller B, Roscher A, Schmitz G (1999) Quantitative measurement of different ceramide species from crude cellular extracts by electrospray ionization tandem mass spectrometry (ESI-MS/MS). J Lipid Res 40 (8):1539–1546 [PubMed] [Google Scholar]
- 75.Lydic TA, Busik JV, Esselman WJ, Reid GE (2009) Complementary precursor ion and neutral loss scan mode tandem mass spectrometry for the analysis of glycerophosphatidylethanolamine lipids from whole rat retina. Anal Bioanal Chem 394 (1):267–275 [DOI] [PMC free article] [PubMed] [Google Scholar]
- 76.Hsu FF, Turk J (2000) Charge-remote and charge-driven fragmentation processes in diacyl glycerophosphoethanolamine upon low-energy collisional activation: a mechanistic proposal. J Am Soc Mass Spectrom 11 (10):892–899 [DOI] [PubMed] [Google Scholar]
- 77.Han X, Yang K, Cheng H, Fikes KN, Gross RW (2005) Shotgun lipidomics of phosphoethanolamine-containing lipids in biological samples after one-step in situ derivatization. J Lipid Res 46 (7):1548–1560. 10.1194/jlr.D500007-JLR200 [DOI] [PMC free article] [PubMed] [Google Scholar]
- 78.Hsu F- F, Turk J, Stewart ME, Downing DT (2002) Structural studies on ceramides as lithiated adducts by low energy collisional-activated dissociation tandem mass spectrometry with electrospray ionization. J Am Soc Mass Spectrom 13 (6):680–695. 10.1016/s1044-0305(02)00362-8 [DOI] [PubMed] [Google Scholar]
- 79.Gu M, Kerwin JL, Watts JD, Aebersold R (1997) Ceramide Profiling of Complex Lipid Mixtures by Electrospray Ionization Mass Spectrometry. Anal Biochem 244 (2):347–356. 10.1006/abio.1996.9915 [DOI] [PubMed] [Google Scholar]
- 80.Wang M, Wang C, Han X (2017) Selection of internal standards for accurate quantification of complex lipid species in biological extracts by electrospray ionization mass spectrometry – What, how and why? Mass Spectrom Rev 36 (6):693–714. 10.1002/mas.21492 [DOI] [PMC free article] [PubMed] [Google Scholar]
- 81.Hsu FF, Kuhlmann FM, Turk J, Beverley SM (2014) Multiple-stage linear ion-trap with high resolution mass spectrometry towards complete structural characterization of phosphatidylethanolamines containing cyclopropane fatty acyl chain in Leishmania infantum. J Mass Spectrom 49 (3):201–209 [DOI] [PMC free article] [PubMed] [Google Scholar]
- 82.Hsu FF, Turk J (2005) Studies on phosphatidylserine by tandem quadrupole and multiple stage quadrupole ion-trap mass spectrometry with electrospray ionization: structural characterization and the fragmentation processes. J Am Soc Mass Spectrom 16 (9):1510–1522 [DOI] [PubMed] [Google Scholar]
- 83.Hsu F- F, Bohrer A, Turk J (1998) Formation of lithiated adducts of glycerophosphocholine lipids facilitates their identification by electrospray ionization tandem mass spectrometry. J Am Soc Mass Spectrom 9 (5):516–526. 10.1016/s1044-0305(98)00012-9 [DOI] [PubMed] [Google Scholar]
- 84.Yang K, Zhao Z, Gross RW, Han X (2009) Systematic analysis of choline-containing phospholipids using multi-dimensional mass spectrometry-based shotgun lipidomics. J Chromatogr B. Analyt Technol Biomed Life Sci 877 (26):2924–2936 [DOI] [PMC free article] [PubMed] [Google Scholar]
- 85.Yost RA, Enke CG (1979) Triple quadrupole mass spectrometry for direct mixture analysis and structure elucidation. Anal Chem 51 (12):1251–1264 [DOI] [PubMed] [Google Scholar]
- 86.Singleton KE, Cooks RG, Wood KV (1983) Utilization of natural isotopic abundance ratios in tandem mass spectrometry. Anal Chem 55 (4):762–764. 10.1021/ac00255a039 [DOI] [Google Scholar]
- 87.Snyder DT, Cooks RG (2017) Single Analyzer Neutral Loss Scans in a Linear Quadrupole Ion Trap Using Orthogonal Double Resonance Excitation. Anal Chem 89 (15):8148–8155. 10.1021/acs.analchem.7b01963 [DOI] [PubMed] [Google Scholar]
- 88.Song H, Hsu FF, Ladenson J, Turk J (2007) Algorithm for processing raw mass spectrometric data to identify and quantitate complex lipid molecular species in mixtures by data-dependent scanning and fragment ion database searching. J Am Soc Mass Spectrom 18 (10):1848–1858 [DOI] [PMC free article] [PubMed] [Google Scholar]
- 89.Han X, Gross RW (2001) Quantitative analysis and molecular species fingerprinting of triacylglyceride molecular species directly from lipid extracts of biological samples by electrospray ionization tandem mass spectrometry. Anal Biochem 295 (1):88–100 [DOI] [PubMed] [Google Scholar]
- 90.Hsu FF, Turk J (1999) Structural characterization of triacylglycerols as lithiated adducts by electrospray ionization mass spectrometry using low-energy collisionally activated dissociation on a triple stage quadrupole instrument. J Am Soc Mass Spectrom 10 (7):587–599 [DOI] [PubMed] [Google Scholar]
- 91.Murphy RC, James PF, McAnoy AM, Krank J, Duchoslav E, Barkley RM (2007) Detection of the Abundance of Diacylglycerol and Triacylglycerol Molecular Species in Cells Using Neutral Loss Mass Spectrometry. Anal Biochem 366 (1):59–70. 10.1016/j.ab.2007.03.012 [DOI] [PMC free article] [PubMed] [Google Scholar]
- 92.Li M, Baughman E, Roth MR, Han X, Welti R, Wang X (2014) Quantitative profiling and pattern analysis of triacylglycerol species in Arabidopsis seeds by electrospray ionization mass spectrometry. Plant J 77 (1):160–172 [DOI] [PubMed] [Google Scholar]
- 93.Li M, Butka E, Wang X (2014) Comprehensive quantification of triacylglycerols in soybean seeds by electrospray ionization mass spectrometry with multiple neutral loss scans. Sci Rep 4 (6581) [DOI] [PMC free article] [PubMed] [Google Scholar]
- 94.Andrikopoulos NK (2002) Chromatographic and Spectroscopic Methods in the Analysis of Triacylglycerol Species and Regiospecific Isomers of Oils and Fats. Critical Rev Food Sci Nutr 42 (5):473–505. 10.1080/20024091054229 [DOI] [PubMed] [Google Scholar]
- 95.Triacylglycerol Regioisomers Analysis. http://lipidlibrary.aocs.org/Analysis/content.cfm?ItemNumber=41146.
- 96.Schuhmann K, Thomas H, Ackerman JM, Nagornov KO, Tsybin YO, Shevchenko A (2017) Intensity-Independent Noise Filtering in FT MS and FT MS/MS Spectra for Shotgun Lipidomics. Anal Chem 89 (13):7046–7052. [DOI] [PubMed] [Google Scholar]
- 97.Markarov A, Cousijn E, Cantebury J, Denisov E, Thoeing C, Lange O, Kreutzman A, Ayzikov K, Damoc E, Tabiwang A, Xuan Y, Sharma S, Huguet R, McAlister G, Senko M, Zabrouskov V, Harder A Extension of Orbitrap capabilities to enable new applications In: 65th Conference on Mass Spectrometry and Allied Topics, Indianapolis, IN, June 4 2017. [Google Scholar]
- 98.Wang M, Huang Y, Han X (2014) Accurate mass searching of individual lipid species candidates from high-resolution mass spectra for shotgun lipidomics. Rapid Commun Mass Spectrom 28 (20):2201–2210. 10.1002/rcm.7015 [DOI] [PMC free article] [PubMed] [Google Scholar]
- 99.Bielow C, Mastrobuoni G, Orioli M, Kempa S (2017) On Mass Ambiguities in High-Resolution Shotgun Lipidomics. Anal Chem 89 (5):2986–2994 [DOI] [PubMed] [Google Scholar]
- 100.Hsu F-F, Lodhi IJ, Turk J, Semenkovich CF (2014) Structural Distinction of Diacyl-, Alkylacyl, and Alk-1-Enylacyl Glycerophosphocholines as [M – 15]– Ions by Multiple-Stage Linear Ion-Trap Mass Spectrometry with Electrospray Ionization. J Am Soc Mass Spectrom 25 (8):1412–1420. 10.1007/s13361-014-0908-x [DOI] [PMC free article] [PubMed] [Google Scholar]
- 101.Snyder DT, Szalwinski LJ, Cooks RG (2017) Simultaneous and Sequential MS/MS Scan Combinations and Permutations in a Linear Quadrupole Ion Trap. Anal Chem 89 (20):11053–11060. 10.1021/acs.analchem.7b03064 [DOI] [PubMed] [Google Scholar]
- 102.Fuchs B, Suss R, Schiller J (2010) An update of MALDI-TOF mass spectrometry in lipid research. Prog Lipid Res 49 (4):450–475 [DOI] [PubMed] [Google Scholar]
- 103.Schiller J, Suss R, Arnhold J, Fuchs B, Lessig J, Muller M, Petkovic M, Spalteholz H, Zschornig O, Arnold K (2004) Matrix-assisted laser desorption and ionization time-of-flight (MALDI-TOF) mass spectrometry in lipid and phospholipid research. Prog Lipid Res 43 (5):449–488 [DOI] [PubMed] [Google Scholar]
- 104.Schiller J, Arnhold J, Benard S, Müller M, Reichl S, Arnold K (1999) Lipid Analysis by Matrix-Assisted Laser Desorption and Ionization Mass Spectrometry: A Methodological Approach. Anal Biochem 267 (1):46–56. 10.1006/abio.1998.3001 [DOI] [PubMed] [Google Scholar]
- 105.Li YL, Gross ML, Hsu FF (2005) Ionic-liquid matrices for improved analysis of phospholipids by MALDI-TOF mass spectrometry. J Am Soc Mass Spectrom 16 (5):679–682 [DOI] [PubMed] [Google Scholar]
- 106.Jackson SN, Ugarov M, Egan T, Post JD, Langlais D, Schultz JA, Woods AS (2007) MALDI-ion mobility-TOFMS imaging of lipids in rat brain tissue. J Mass Spectrom 42 (8):1093–1098. 10.1002/jms.1245 [DOI] [PMC free article] [PubMed] [Google Scholar]
- 107.Rujoi M, Estrada R, Yappert MC (2004) In situ MALDI-TOF MS regional analysis of neutral phospholipids in lens tissue. Anal Chem 76 (6):1657–1663 [DOI] [PubMed] [Google Scholar]
- 108.McDonnell LA, Heeren RM (2007) Imaging mass spectrometry. Mass Spectrom Rev 26 (4):606–643 [DOI] [PubMed] [Google Scholar]
- 109.Wu Q, Chu JL, Rubakhin SS, Gillette MU, Sweedler JV (2017) Dopamine-modified TiO(2) monolith-assisted LDI MS imaging for simultaneous localization of small metabolites and lipids in mouse brain tissue with enhanced detection selectivity and sensitivity †Electronic supplementary information (ESI) available. See DOI: 10.1039/c7sc00937b Click here for additional data file. Chem Sci 8 (5):3926–3938. 10.1039/c7sc00937b [DOI] [PMC free article] [PubMed] [Google Scholar]
- 110.Petkovic M, Schiller J, Muller M, Benard S, Reichl S, Arnold K, Arnhold J (2001) Detection of individual phospholipids in lipid mixtures by matrix-assisted laser desorption/ionization time-of-flight mass spectrometry: phosphatidylcholine prevents the detection of further species. Anal Biochem 289 (2):202–216 [DOI] [PubMed] [Google Scholar]
- 111.Zhou P, Altman E, Perry MB, Li J (2010) Study of Matrix Additives for Sensitive Analysis of Lipid A by Matrix-Assisted Laser Desorption Ionization Mass Spectrometry. Appl Environ Microbiol 76 (11):3437–3443. 10.1128/aem.03082-09 [DOI] [PMC free article] [PubMed] [Google Scholar]
- 112.Hsu F-F, Turk J, Owens RM, Rhoades ER, Russell DG (2007) Structural Characterization of Phosphatidyl-myo-inositol Mannosides from Mycobacterium bovis Bacillus Calmette Guérin by Multiple-Stage Quadrupole Ion-Trap Mass Spectrometry with Electrospray Ionization. I. PIMs and Lyso-PIMs. J Am Soc Mass Spectrom 18 (3):466–478. 10.1016/j.jasms.2006.10.012 [DOI] [PMC free article] [PubMed] [Google Scholar]
- 113.Soltwisch J, Kettling H, Vens-Cappell S, Wiegelmann M, Müthing J, Dreisewerd K (2015) Mass spectrometry imaging with laser-induced postionization. Science 348 (6231):211–215. 10.1126/science.aaa1051 [DOI] [PubMed] [Google Scholar]
- 114.Ellis SR, Soltwisch J, Paine MRL, Dreisewerd K, Heeren RMA (2017) Laser post-ionisation combined with a high resolving power orbitrap mass spectrometer for enhanced MALDI-MS imaging of lipids. Chem Commun 53 (53):7246–7249. 10.1039/c7cc02325a [DOI] [PubMed] [Google Scholar]
- 115.Pittenauer E, Allmaier G (2009) The renaissance of high-energy CID for structural elucidation of complex lipids: MALDI-TOF/RTOF-MS of alkali cationized triacylglycerols. J Am Soc Mass Spectrom 20 (6):1037–1047. 10.1016/j.jasms.2009.01.009 [DOI] [PubMed] [Google Scholar]
- 116.Pittenauer E, Rehulka P, Winkler W, Allmaier G (2015) Collision-induced dissociation of aminophospholipids (PE, MMPE, DMPE, PS): an apparently known fragmentation process revisited. Anal Bioanal Chem 407 (17):5079–5089 [DOI] [PubMed] [Google Scholar]
- 117.Trimpin S, Clemmer DE, McEwen CN (2007) Charge-Remote Fragmentation of Lithiated Fatty Acids on a TOF-TOF Instrument Using Matrix-Ionization. J Am Soc Mass Spectrom 18 (11):1967–1972. 10.1016/j.jasms.2007.08.013 [DOI] [PubMed] [Google Scholar]
- 118.Spengler B (1997) Post-source Decay Analysis in Matrix-assisted Laser Desorption/Ionization Mass Spectrometry of Biomolecules. J Mass Spectrom 32:1019–1036 [Google Scholar]
- 119.Cotter RJ, Gardner BD, Iltchenko S, English RD (2004) Tandem time-of-flight mass spectrometry with a curved field reflectron. Anal Chem 76 (7):1976–1981 [DOI] [PubMed] [Google Scholar]
- 120.Cornish TJ, Cotter RJ (1993) A curved-field reflectron for improved energy focusing of product ions in time-of-flight mass spectrometry. Rapid Commun Mass Spectrom 7 (11):1037–1040 [DOI] [PubMed] [Google Scholar]
- 121.Belgacem O, Pittenauer E, Openshaw ME, Hart PJ, Bowdler A, Allmaier G (2016) Axial spatial distribution focusing: improving MALDI-TOF/RTOF mass spectrometric performance for high-energy collision-induced dissociation of biomolecules. Rapid Commun Mass Spectrom 30 (3):343–351. 10.1002/rcm.7458 [DOI] [PMC free article] [PubMed] [Google Scholar]
- 122.Suckau D, Resemann A, Schuerenberg M, Hufnagel P, Franzen J, Holle A (2003) A novel MALDI LIFT-TOF/TOF mass spectrometer for proteomics. Anal Bioanal Chem 376 (7):952–965. 10.1007/s00216-003-2057-0 [DOI] [PubMed] [Google Scholar]
- 123.Frankfater C, Jiang X, Hsu FF (2018) Characterization of long-chain fatty acid as N-(4-aminomethylphenyl) pyridinium derivative by MALDI LIFT-TOF/TOF mass spectrometry J Am Soc Mass Spectrom 29 (8):1688–1699. 10.1007/s13361-018-1993-z Erratum in: J Am Soc Mass Spectrom. 2018 Aug 27 [DOI] [PMC free article] [PubMed] [Google Scholar]
- 124.Satoh T, Sato T, Kubo A, Tamura J (2011) Tandem time-of-flight mass spectrometer with high precursor ion selectivity employing spiral ion trajectory and improved offset parabolic reflectron. J Am Soc Mass Spectrom 22 (5):797–803 [DOI] [PubMed] [Google Scholar]
- 125.Yan Y, Ubukata M, Cody RB, Holy TE, Gross ML (2014) High-energy Collision-induced Dissociation by MALDI TOF/TOF Causes Charge-Remote Fragmentation of Steroid Sulfates. J Am Soc Mass Spectrom 25 (8):1404–1411. 10.1007/s13361-014-0901-4 [DOI] [PMC free article] [PubMed] [Google Scholar]
- 126.Shimma S, Kubo A, Satoh T, Toyoda M (2012) Detailed Structural Analysis of Lipids Directly on Tissue Specimens Using a MALDI-SpiralTOF-Reflectron TOF Mass Spectrometer. PLoS ONE 7 (5):e37107 10.1371/journal.pone.0037107 [DOI] [PMC free article] [PubMed] [Google Scholar]
- 127.Peršurić Ž, Osuga J, Galinac Grbac T, Peter-Katalinić J, Kraljević Pavelić S (2016) MALDI-SpiralTOF technology for assessment of triacylglycerols in Croatian olive oils. Eur J Lipid Sci Technol.:n/a-n/a 10.1002/ejlt.201500375 [DOI] [Google Scholar]
- 128.Kubo A, Satoh T, Itoh Y, Hashimoto M, Tamura J, Cody RB (2013) Structural Analysis of Triacylglycerols by Using a MALDI-TOF/TOF System with Monoisotopic Precursor Selection. J Am Soc Mass Spectrom 24 (5):684–689. 10.1007/s13361-012-0513-9 [DOI] [PMC free article] [PubMed] [Google Scholar]
- 129.Lydic TA, Goo Y- H (2018) Lipidomics unveils the complexity of the lipidome in metabolic diseases. Clin Translational Med 7:4 10.1186/s40169-018-0182-9 [DOI] [PMC free article] [PubMed] [Google Scholar]
- 130.Abbassi-Ghadi N, Jones EA, Gomez-Romero M, Golf O, Kumar S, Huang J, Kudo H, Goldin RD, Hanna GB, Takats Z (2016) A Comparison of DESI-MS and LC-MS for the Lipidomic Profiling of Human Cancer Tissue. J Am Soc Mass Spectrom 27 (2):255–264 [DOI] [PubMed] [Google Scholar]
- 131.Strittmatter N, Lovrics A, Sessler J, McKenzie JS, Bodai Z, Doria ML, Kucsma N, Szakacs G, Takats Z (2016) Shotgun Lipidomic Profiling of the NCI60 Cell Line Panel Using Rapid Evaporative Ionization Mass Spectrometry. Anal Chem 88 (15):7507–7514. 10.1021/acs.analchem.6b00187 [DOI] [PubMed] [Google Scholar]
- 132.Li L- H, Hsieh H- Y, Hsu C-C (2017) Clinical Application of Ambient Ionization Mass Spectrometry. Mass Spectrometry 6 (Spec Iss):S0060 10.5702/massspectrometry.S0060 [DOI] [PMC free article] [PubMed] [Google Scholar]
- 133.Luptakova D, Pluhacek T, Palyzova A, Prichystal J, Balog J, Lemr K, Juranek I, Havlicek V (2017) Meet interesting abbreviations in clinical mass spectrometry: from compound classification by REIMS to multimodal and mass spectrometry imaging (MSI). Acta Virol 61 (3):353–360 [DOI] [PubMed] [Google Scholar]
- 134.Takats Z, Strittmatter N, McKenzie JS (2017) Ambient Mass Spectrometry in Cancer Research. Adv Cancer Res 134:231–256 [DOI] [PubMed] [Google Scholar]
- 135.Zhang X, Reid GE (2006) Multistage tandem mass spectrometry of anionic phosphatidylcholine lipid adducts reveals novel dissociation pathways. Int J Mass Spectrom 252 (3):242–255. 10.1016/j.ijms.2006.04.001 [DOI] [Google Scholar]
- 136.Hsu F-F (2016) Complete structural characterization of ceramides as [M – H](−) ions by multiple-stage linear ion trap mass spectrometry. Biochimie 130:63–75. 10.1016/j.biochi.2016.07.012 [DOI] [PMC free article] [PubMed] [Google Scholar]
- 137.Tatituri RV, Wolf BJ, Brenner MB, Turk J, Hsu FF (2015) Characterization of polar lipids of Listeria monocytogenes by HCD and low-energy CAD linear ion-trap mass spectrometry with electrospray ionization. Anal Bioanal Chem 407 (9):2519–2528 [DOI] [PMC free article] [PubMed] [Google Scholar]
- 138.Baba T, Campbell JL, Le Blanc JCY, Baker PRS (2017) Distinguishing Cis and Trans Isomers in Intact Complex Lipids Using Electron Impact Excitation of Ions from Organics Mass Spectrometry. Anal Chem 89 (14):7307–7315 [DOI] [PubMed] [Google Scholar]
- 139.Poad BL, Pham HT, Thomas MC, Nealon JR, Campbell JL, Mitchell TW, Blanksby SJ (2010) Ozone-induced dissociation on a modified tandem linear ion-trap: observations of different reactivity for isomeric lipids. J Am Soc Mass Spectrom 21 (12):1989–1999 [DOI] [PubMed] [Google Scholar]
- 140.Hsu FF, Turk J (2008) Structural characterization of unsaturated glycerophospholipids by multiple-stage linear ion-trap mass spectrometry with electrospray ionization. J Am Soc Mass Spectrom 19 (11):1681–1691 [DOI] [PMC free article] [PubMed] [Google Scholar]
- 141.Yang K, Dilthey BG, Gross RW (2013) Identification and Quantitation of Fatty Acid Double Bond Positional Isomers: A Shotgun Lipidomics Approach Using Charge-Switch Derivatization. Anal Chem 85 (20):9742–9750. 10.1021/ac402104u [DOI] [PMC free article] [PubMed] [Google Scholar]
- 142.Wang M, Han RH, Han X (2013) Fatty Acidomics: Global Analysis of Lipid Species Containing a Carboxyl Group with a Charge-Remote Fragmentation-Assisted Approach. Anal Chem 85 (19):9312–9320. 10.1021/ac402078p [DOI] [PMC free article] [PubMed] [Google Scholar]
- 143.Bollinger JG, Thompson W, Lai Y, Oslund RC, Hallstrand TS, Sadilek M, Turecek F, Gelb MH (2010) Improved Sensitivity Mass Spectrometric Detection of Eicosanoids by Charge Reversal Derivatization. Anal Chem 82 (16):6790–6796. 10.1021/ac100720p [DOI] [PMC free article] [PubMed] [Google Scholar]
- 144.Hsu F-F, Bohrer A, Wohltmann M, Ramanadham S, Ma Z, Yarasheski K, Turk J (2000) Electrospray ionization mass spectrometric analyses of changes in tissue phospholipid molecular species during the evolution of hyperlipidemia and hyperglycemia in Zucker diabetic fatty rats. Lipids 35 (8):839–852. 10.1007/S11745-000-0593-z [DOI] [PubMed] [Google Scholar]
- 145.Koivusalo M, Haimi P, Heikinheimo L, Kostiainen R, Somerharju P (2001) Quantitative determination of phospholipid compositions by ESI-MS: effects of acyl chain length, unsaturation, and lipid concentration on instrument response. J Lipid Res 42 (4):663–672 [PubMed] [Google Scholar]
- 146.Sampaio JL, Gerl MJ, Klose C, Ejsing CS, Beug H, Simons K, Shevchenko A (2011) Membrane lipidome of an epithelial cell line. Proc Natl Acad Sci USA 108 (5):1903–1907. 10.1073/pnas.1019267108 [DOI] [PMC free article] [PubMed] [Google Scholar]
- 147.Kalvodova L, Sampaio JL, Cordo S, Ejsing CS, Shevchenko A, Simons K (2009) The Lipidomes of Vesicular Stomatitis Virus, Semliki Forest Virus, and the Host Plasma Membrane Analyzed by Quantitative Shotgun Mass Spectrometry. J Virol 83 (16):7996–8003. 10.1128/jvi.00635-09 [DOI] [PMC free article] [PubMed] [Google Scholar]
- 148.Bilgin M, Nylandsted J, Jäättelä M, Maeda K (2017) Quantitative profiling of lysosomal lipidome by shotgun lipidomics. Methods in Molecular Biology, vol 1594 10.1007/978-1-4939-6934-0_2 [DOI] [PubMed] [Google Scholar]
- 149.Rolim AEH, Henrique-Araújo R, Ferraz EG, de Araújo Alves Dultra FK, Fernandez LG (2015) Lipidomics in the study of lipid metabolism: Current perspectives in the omic sciences. Gene 554 (2):131–139. 10.1016/j.gene.2014.10.039 [DOI] [PubMed] [Google Scholar]
- 150.Forrester JS, Milne SB, Ivanova PT, Brown HA (2004) Computational lipidomics: a multiplexed analysis of dynamic changes in membrane lipid composition during signal transduction. Mol Pharmacol 65 (4):813–821 [DOI] [PubMed] [Google Scholar]
- 151.Milne S, Ivanova P, Forrester J, Alex Brown H (2006) Lipidomics: an analysis of cellular lipids by ESI-MS. Methods 39 (2):92–103 [DOI] [PubMed] [Google Scholar]
- 152.Gross RW, Han X (2009) Shotgun lipidomics of neutral lipids as an enabling technology for elucidation of lipid-related diseases. Am J Physiol Endocrinol Metab 297 (2):6. [DOI] [PMC free article] [PubMed] [Google Scholar]
- 153.Wenk MR (2010) Lipidomics: New Tools and Applications. Cell 143 (6):888–895. 10.1016/j.cell.2010.11.033 [DOI] [PubMed] [Google Scholar]
- 154.Wenk MR (2005) The emerging field of lipidomics. Nat Rev Drug Discov 4 (7):594–610 [DOI] [PubMed] [Google Scholar]
- 155.Taguchi R, Ishikawa M (2010) Precise and global identification of phospholipid molecular species by an Orbitrap mass spectrometer and automated search engine Lipid Search. J Chromatogr A 18 (25):4229–4239 [DOI] [PubMed] [Google Scholar]
- 156.Herzog R, Schuhmann K, Schwudke D, Sampaio JL, Bornstein SR, Schroeder M, Shevchenko A (2012) LipidXplorer: a software for consensual cross-platform lipidomics. PLOS ONE 7 (1):17. [DOI] [PMC free article] [PubMed] [Google Scholar]
- 157.Husen P, Tarasov K, Katafiasz M, Sokol E, Vogt J, Baumgart J, Nitsch R, Ekroos K, Ejsing CS (2013) Analysis of lipid experiments (ALEX): a software framework for analysis of high-resolution shotgun lipidomics data. PLOS ONE 8 (11) [DOI] [PMC free article] [PubMed] [Google Scholar]
- 158.Kind T, Liu KH, Lee DY, DeFelice B, Meissen JK, Fiehn O (2013) LipidBlast in silico tandem mass spectrometry database for lipid identification. Nat Methods 10 (8):755–758 [DOI] [PMC free article] [PubMed] [Google Scholar]