Abstract
GABAergic interneurons regulate neural circuit activity in the mammalian cerebral cortex. These cortical interneurons are structurally and functionally diverse. Here we use single-cell transcriptomics to study the origins of this diversity in mouse. We identify distinct types of progenitor cells and newborn neurons in the ganglionic eminences, the embryonic proliferative regions that give rise to cortical interneurons. These embryonic precursors show temporally and spatially restricted transcriptional patterns that lead to different classes of interneurons in the adult cerebral cortex. Our findings suggest that shortly after the interneurons become postmitotic, their diversity is already patent in their diverse transcriptional programs which subsequently guide further differentiation in the developing cortex.
The mammalian cerebral cortex contains over two dozen GABAergic cell types with unique morphological, electrophysiological and molecular characteristics (1–3). Interneuron diversity has evolved to increase the repertoire of cortical computational motifs through a division of labor, which allows individual classes of interneurons control information flow in cortical circuits (4–6). Although a picture about cortical interneuron cell types is emerging (7, 8), the mechanisms that generate interneuron diversity remain controversial. One model proposes that interneurons acquire the potential to differentiate into a distinct subtype at the level of progenitors or shortly after becoming postmitotic, before they migrate; the competing model postulates that interneuron identity is established relatively late in development, after they have migrated to their final location, through interactions with the cortical environment (9).
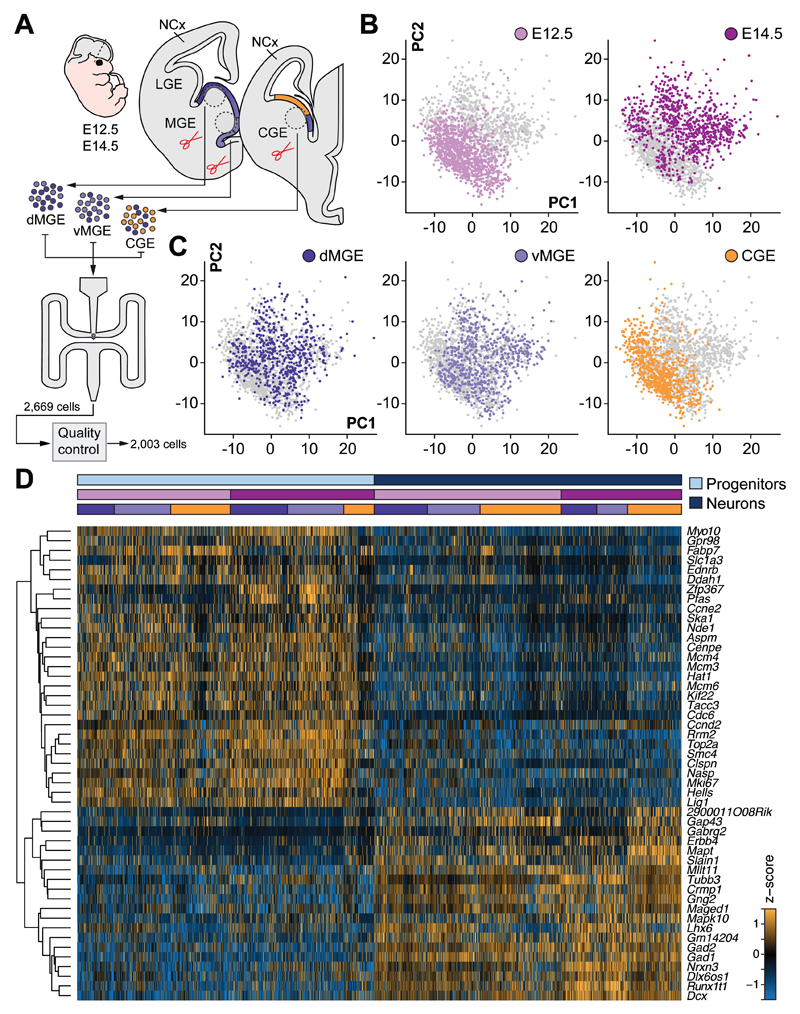
To study cell diversity in the germinal regions of cortical interneurons (10), we dissected tissue from three regions in the mouse subpallium, the dorsal and ventral medial ganglionic eminence (dMGE and vMGE, respectively) and the caudal ganglionic eminence (CGE), across two stages that coincide with the peak of neurogenesis for cortical interneurons [embryonic (E) days 12.5 and E14.5] (11) (Fig. 1A). We prepared single cell suspensions and sequenced the transcriptome of individual cells, which following quality control (fig. S1, A to E) led to a final dataset of 2,003 cells (fig. S1F), covering on average about 3,200 genes per cell. We performed regression analysis on these cells to remove the influence of cell cycle-dependent genes in cell type identification (fig. S1G).
Fig. 1. Major sources of transcriptional heterogeneity among single cells from mouse MGE and CGE.
(A) Schematic illustrating sample collection, sequencing and single-cell RNA-seq analysis workflow. Single cells from E12.5 and E14.5 dMGE, vMGE and CGE were isolated and subjected to cDNA synthesis using a Fluidigm C1 system and RNA-seq. (B to C) Visualization of stage and region of origin variation in single cells using PCA. (D) RF classification of cells into progenitor or neuronal identity. The heatmap illustrates expression of genes selected by RF analysis that best represent progenitor or neuronal identity. Colored bars above the heatmap indicate cell identity, stage and region of origin.
We used principal component analysis (PCA) to identify the most prominent sources of variation. We found that developmental stage and anatomical source contribute to cell segregation (Fig. 1, B and C, and figs. S2 and S3). To distinguish between dividing and postmitotic cells, we conducted random forest (RF) feature selection and classification starting with a list of established genes to sort cells into these categories (Fig. 1D). Subsequently, we reduced the dimensionality of our data using t-SNE (t-Distributed Stochastic Neighbor Embedding) to visualize the segregation of progenitor cells from neurons (figs. S4A and S5A). These analyses revealed gene expression patterns that distinguish progenitor cells and neurons at each developmental stage (figs. S4B and S5B).
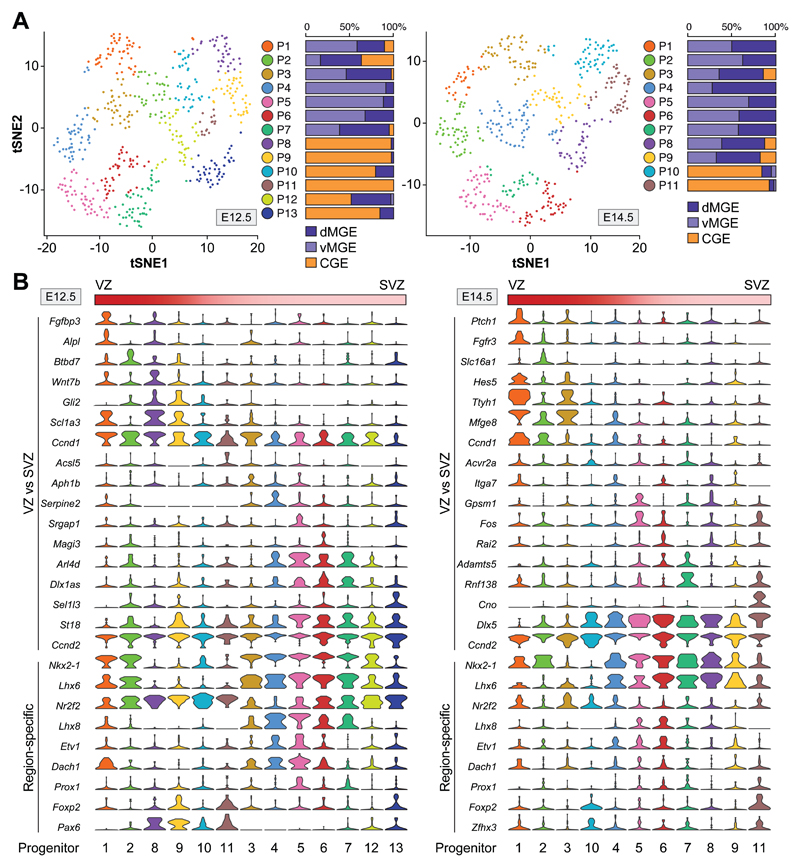
We took a semi-supervised clustering approach to explore variation across all progenitor cells and identified progenitor clusters with unique regional and developmental patterns (fig. S6, A to D). This analysis revealed a prominent temporal segregation of progenitor clusters (fig. S6, B and D), which suggests that progenitor cells in the ganglionic eminences (GE) may have a rapid turnover during embryonic development. To identify distinctive features of E12.5 and E14.5 progenitor cells, we further investigate progenitor cell diversity at each stage individually. We first used RF feature selection and classification starting with a list of established genes to distinguish between ventricular zone (VZ) radial glial cells and subventricular zone (SVZ) intermediate progenitors (12, 13) (fig. S7A). We then carried out semi-supervised clustering and distinguished VZ and SVZ progenitor clusters at both developmental stages (Fig. 2A and fig. S7B), independent of their cell cycle state (fig. S8), and found unique patterns of gene expression (figs. S9). Cross-validation using MetaNeighbor (14) confirmed cluster robustness and identity (fig. S10A). Many progenitor clusters found at E12.5 did not seem to have a direct transcriptional equivalent at E14.5 (fig. S10B), which reinforces the notion that the GE contains highly dynamic pools of progenitor cells during development.
Fig. 2. Characterization of progenitor cell types in the embryonic germinal zones.
(A) Visualization of progenitor cell diversity by t-SNE. Histograms illustrate the relative contribution of dMGE, vMGE and CGE cells to each progenitor cluster. (B) Violin plots depict the expression of marker genes that distinguish VZ/SVZ identities and patterning information in progenitor clusters.
Analysis of progenitor cell clusters confirmed that radial glial cells and intermediate progenitors have distinct identities across different regions of the subpallium, with characteristic and often complementary expression of transcription factors (e.g., Nkx2-1 and Pax6 in VZ, Lhx6 and Foxp2 in SVZ) (Fig. 2B and figs. S11 and S12). Although the molecular diversity of VZ cells was more limited than anticipated (15, 16), this analysis revealed diversity among SVZ progenitors (Fig. 2B and figs. S11 to S14). Thus, based on transcriptomic signatures, the diversification of progenitor cells in the GE seems to emerge primarily within the highly neurogenic SVZ.
We next turned our attention to the neurons that are being generated in the GE during this temporal window of high progenitor cell diversity. The MGE and CGE generate different groups of cortical interneurons (17–19). Most parvalbumin (PV)-expressing and somatostatin (SST)-expressing interneurons are born in the MGE, whereas the CGE is the origin of vasoactive intestinal peptide (VIP)-expressing interneurons and neurogliaform (NDNF+) cells (20). We took a completely unsupervised approach to explore the emergence of neuronal diversity in the GE. Unbiased clustering of all neurons identified 13 groups of newborn neurons with distinctive gene expression profiles, as well as unique temporal and regional identities (figs. S15, A to D and S16). This analysis revealed that regional identity segregates more clearly among E14.5 neuronal clusters (figs. S15C), which suggests that neurons become more transcriptionally heterogeneous over time. Similar results were obtained when neuronal clusters were identified for both stages separately (fig. S17).
GO enrichment analysis revealed different states of maturation across neuronal clusters (fig. S15E), which suggests that some aspects of this diversity might be linked to the differentiation of newborn neurons and not cell identity. Analysis of the expression of region- and cell type-specific genes revealed the emerging signature of the main groups of cortical interneurons (fig. S15F). For example, clusters primarily populated by MGE-derived cells can be further segregated into those with features of SST+ interneurons (N3 and N4) and those without (N1, N2 and N9), which presumably include neurons that will differentiate into PV+ interneurons. The profile of emerging CGE-specific interneuron classes, such as those characterized by the expression of Meis2 (21), is also delineated at this stage. This analysis also revealed that the CGE gives rise to neurons with molecular profile of SST+ interneurons (N13), which reinforces the view that this anatomical region contains a molecularly heterogeneous pool of progenitor cells (15).
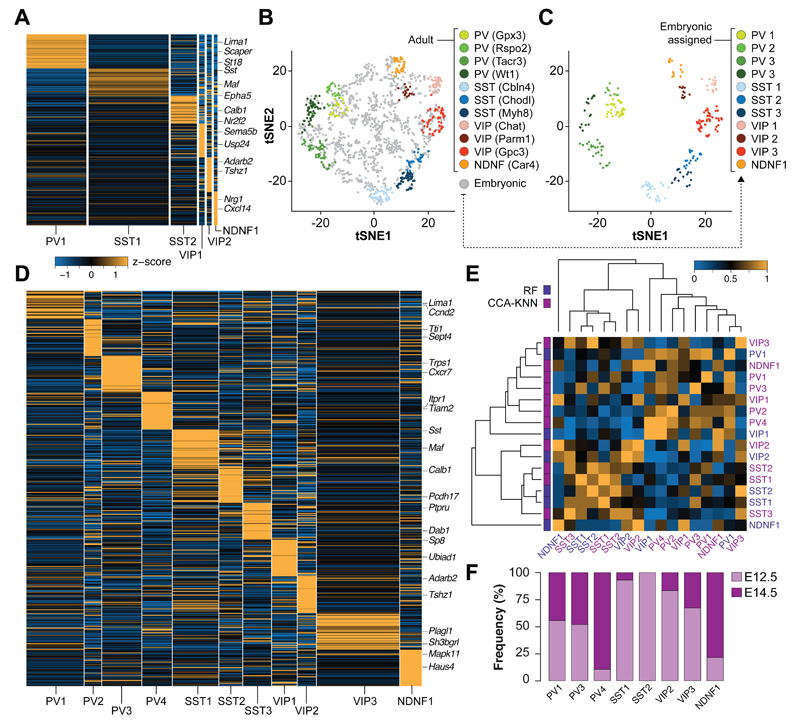
The adult mouse cerebral cortex contains over 20 distinct classes of interneurons with unique transcriptional profiles (7, 8). We asked whether any of these classes of interneurons would be identifiable shortly after becoming postmitotic in the GE. To this end, we used a publicly available single-cell RNA-seq dataset of 761 adult GABAergic interneurons from the adult mouse visual cortex (8) and identified highly variable genes in both adult and embryonic datasets. We employed the resulting dataset to identify the features that best represent each of the 23 interneuron cell types found in the adult mouse cortex (8). We then carried out RF feature selection and classification based on those features to assign the identity of adult interneurons into distinct cell types. We were unable to identify all cell types originally described in the adult dataset (8), which suggests a difference in transcriptomic and cell-type diversity between embryo and adult. We then used the identified adult interneuron cell types to annotate the embryonic dataset using the RF classification workflow and found 6 prospective interneuron subtypes among embryonic neurons (Fig. 3A and fig. S18). Cross-dataset validation between the emerging embryonic subtypes and adult interneurons confirmed the robustness of these annotations (fig. S19).
Fig. 3. Emergence of cortical interneuron diversity in the ganglionic eminences.
(A) Heatmap showing average expression of differentially expressed (DE) genes among six classes of interneurons identified by RF classification of embryonic neurons. (B) Integration of embryonic neurons and adult cortical interneurons in t-SNE space following canonical correlation analysis (CCA). (C) Embryonic neurons assigned to specific interneuron lineages by knn analysis are depicted in the same t-SNE space. Unassigned embryonic neurons are omitted. (D) Heatmap illustrating the expression of DE genes among the eleven classes of interneurons identified by CCA. (E) Heatmap of mean AUROC scores for assigned interneuron cell types using the two independent approaches (RF and CCA). AUROC scores of eight conserved interneuron subtypes: PV1RF-PV1CCA = 0.95; PV1RF-PV3CCA = 0.90; PV1RF-PV4CCA = 0.90; SST1RF-SST1CCA = 1; SST2RF-SST2CCA = 0.95; VIP2RF-VIP2CCA = 0.90; VIP2RF-VIP3CCA = 0.85; NDNF1RF-NDNF1CCA = 0.7. (F) Histogram illustrating the relative contribution of E12.5 and E14.5 neurons to conserved interneuron subtypes.
We used a second, independent approach to assign embryonic neurons to adult interneuron subtypes. In brief, we conducted canonical correlation analysis (CCA) to identify the sources of variation that are shared between embryonic and adult neurons. To this end, we first reduced the dimensionality of both datasets onto the same two-dimensional space using t-SNE, which allowed the identification of 11 clusters of adult interneurons based on the expression of variable genes shared between both datasets (Fig. 3B). These groups correspond to anatomically and electrophysiologically defined classes of cortical interneurons, including several types of PV+ basket cells, SST+ Martinotti and non-Martinotti cells, VIP+ basket and bipolar interneurons, and neurogliaform cells (8, 22). We then assigned prospective identities to embryonic neurons based on transcriptional similarity with adult interneurons. This analysis provided evidence for early cell type differentiation: all 11 classes of cortical interneurons were identified among embryonic neurons (Fig. 3C), which exhibit unique patterns of gene expression (Fig. 3D and fig. S20) and robustness in cross-validation analyses (fig. S21). Comparison between the two independent approaches identified 8 conserved interneuron subtypes among the assigned embryonic neurons (Fig. 3E). Analysis of the contribution of E12.5 and E14.5 neurons to these identities revealed timing biases for the generation or maturation of some interneuron subtypes (Fig. 3F and fig. S22). Altogether, these results strongly suggested that interneurons exhibit a great diversity of transcriptional signatures shortly after becoming postmitotic in the GE.
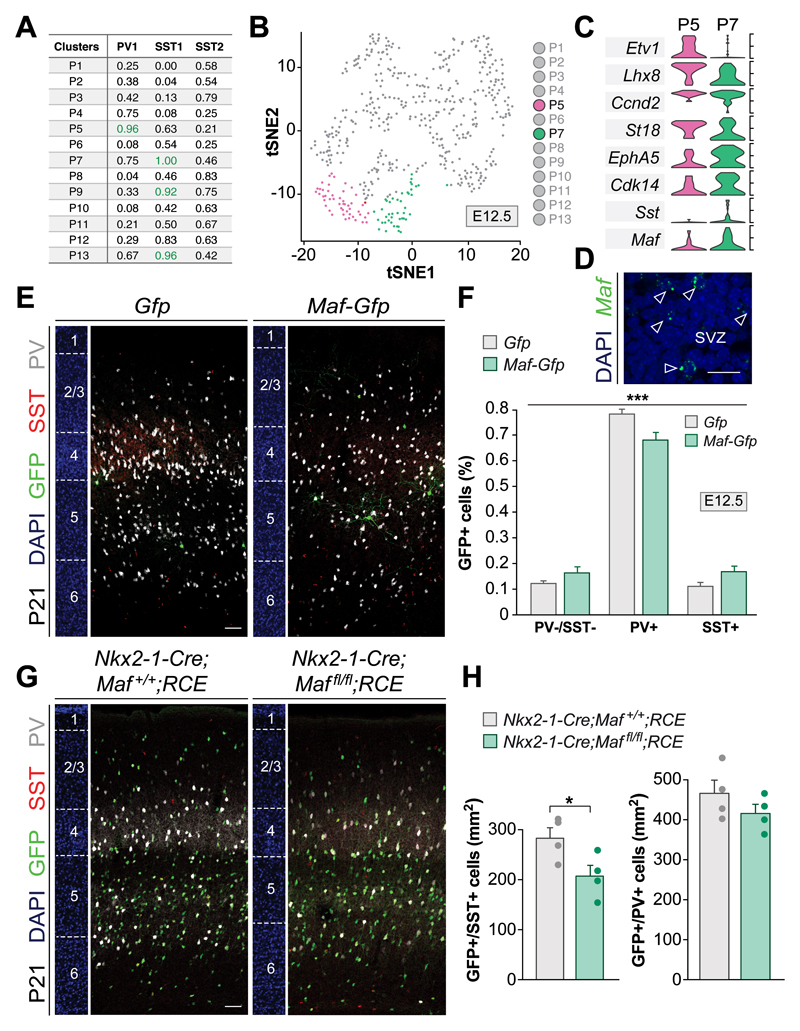
We hypothesized that the patterns of gene expression identified in progenitor cells and newborn neurons delineate specific lineages of cortical interneurons. To test this idea, we limited our analysis to embryonic neurons that were assigned to the same subtype identity by both RF and CCA methods, which we named “consensus” neurons and belong to three interneuron subtypes: PV1, SST1 and SST2. We conducted MetaNeighbor analysis to identify possible links between progenitor cell clusters and consensus neurons. This analysis revealed putative SST+ and PV+ progenitor cell clusters at E12.5 and E14.5 (Fig. 4A and fig. S23). We then carried out differential gene expression between E12.5 progenitor clusters P5 and P7 (Fig. 4B), which exhibited the highest association with PV1 and SST1, respectively (Fig. 4A). We found early PV (Ccnd2 and St18) and SST markers (Epha5, Cdk14 and Maf) in these progenitor pools (Fig. 4, C and D), which are subsequently maintained in specific subtypes of newborn interneurons (Fig. 3, A and D). To validate these observations, we investigated the function of Maf in the delineation of MGE interneuron lineages. We infected progenitor cells in Nkx2-1-Cre embryos with conditional retroviruses expressing Cre-dependent control or Maf vectors during the period of SST+ interneuron production (E12.5) (23) and explored the identity of labeled interneurons in the cortex of young adult mice (Fig. 4E and fig. S24, A and B). We found that widespread expression of Maf in MGE progenitors increases the relative proportion of SST+ interneurons at the expense of PV+ cells (Fig. 4F and fig. S24C). Conversely, conditional loss of Maf from MGE progenitor cells decreases the density of cortical SST+ interneurons (Fig. 4, G and H). We also observed that over-expression of Maf at the peak of PV neurogenesis (E14.5) (23) repress PV+ interneuron fates (fig. S24, D and E). Altogether, these results indicated that Maf regulates the potential of interneurons to acquire SST+ interneuron identity.
Fig. 4. Maf regulates SST+ interneuron fate.
(A) AUROC values for putative lineages linking E12.5 progenitor clusters (P) with specific interneuron subtypes (AUROC scores above 0.9). (B) t-SNE plot illustrating progenitor cell clusters at E12.5. Two SVZ clusters, P5 and P7, are highlighted by color. (C) Violin plots for selected DE genes between P5 and P7 clusters. (D) RNAscope labeling of MGE SVZ progenitors cells with a Maf probe. (E) Coronal sections through the somatosensory cortex of P21 mice following viral infection with Gfp or Maf-P2A-Gfp retroviruses in the MGE at E12.5. (F) Quantification of the proportion of PV-/SST-, PV+ and SST+ interneurons; n = 5; X2-square test, ***p < 0.001. Post-hoc was performed with binomial pairwise comparison with adjusted p-value by Bonferroni correction; PV-/SST- vs PV+ ***p < 0.001; PV+ vs SST+ **p < 0.01. (G) Coronal sections through the somatosensory cortex of P21 control and conditional Maf mutants. (H) Quantification of the density of GFP+/SST+ and GFP+/PV+ interneurons; n = 4, one-way ANOVA with Tukey correction, *p < 0.05. Scale bars equal 15 µm (D) and 100 µm (E, G).
Our study reveals that GABAergic interneurons have a propensity towards a defined fate long before they occupy their final position in the cerebral cortex during early postnatal development. This suggests that interneuron diversity does not emerge in response to activity-dependent mechanisms in the cortex (1, 9), but rather is established early, before these cells reach the cortex, by specific transcriptional programs that then unfold over the course of several weeks. Activity-dependent mechanisms undoubtedly influence development, maturation and plasticity of cortical interneurons (24–26), but most aspects that are directly linked to the functional diversity of cortical interneurons seem to be intrinsically determined (14, 27).
Our analysis identifies early markers for many different classes of cortical interneurons, whose functional validation may eventually illuminate the mechanisms regulating the differentiation of GABAergic interneurons into specific subtypes and, through comparative analyses, inform the use of stem cell biology for the generation of distinct classes of human cortical interneurons (28, 29). Thus, core aspects of interneuron identity are drafted early in development, forming the foundation on which later interactions with other neurons must function.
Supplementary Material
Acknowledgements
We thank S.E. Bae and M. Fernández for technical assistance. We are grateful to M. Zhong at Yale Stem Cell Center Genomics and Bioinformatics Core for conducting RNA sequencing, N. Flames and B. Rico for critical reading of the manuscript, S. Anderson, C. Birchmeier, F. Cage and G. Fishell for reagents and mouse strains, and members of the Marín, Rico and Sestan laboratories for stimulating discussions and ideas.
Funding: This work was supported by grants from the Wellcome Trust (103714MA) to O.M., the National Institute for Health (NS095654 and MH106934) to N.S., and the Medical Research Council (N012291) and the Biotechnology and Biological Sciences Research Council (N006542) to D.J.P., Y.Y. and T.P. L.L. was supported by an EMBO postdoctoral fellowship. O.M. is a Wellcome Trust Investigator.
Footnotes
Authors contributions: D.M. and O.M. designed the study. Single-cell experiments were performed by D.M., Z.L., and T.G. Functional validation experiments were performed by L.L. and M.M. Data management and read processing was performed by M.L. Data analysis was performed by D.M., Z.L., L.L., M.M., Y.Y., and T.X.H. The study was supervised by D.M., Z.L., T.P., D.J.P., N.S., and O.M. This manuscript was prepared by D.M., Z.L., and O.M., with feedback from all authors.
Competing interests: None declared.
Data and materials availability: Sequencing data have been deposited at the National Center for Biotechnology Information BioProjects Gene Expression Omnibus and are accessible through GEO Series accession number GSE109796. c-Maf flox mice are available from Prof. Carmen Birchmeier under a material agreement with the Max-Delbrück-Centrum for Molekulare Medizin (Berlin). The Supplementary Materials contain additional data. All data needed to evaluate the conclusions in the paper are present in the paper or the Supplementary Materials.
References and Notes
- 1.Kepecs A, Fishell G. Interneuron cell types are fit to function. Nature. 2014;505:318–326. doi: 10.1038/nature12983. [DOI] [PMC free article] [PubMed] [Google Scholar]
- 2.Klausberger T, Somogyi P. Neuronal diversity and temporal dynamics: the unity of hippocampal circuit operations. Science. 2008;321:53–57. doi: 10.1126/science.1149381. [DOI] [PMC free article] [PubMed] [Google Scholar]
- 3.Jiang X, et al. Principles of connectivity among morphologically defined cell types in adult neocortex. Science. 2015;350:aac9462. doi: 10.1126/science.aac9462. [DOI] [PMC free article] [PubMed] [Google Scholar]
- 4.Muñoz W, Tremblay R, Levenstein D, Rudy B. Layer-specific modulation of neocortical dendritic inhibition during active wakefulness. Science. 2017;355:954–959. doi: 10.1126/science.aag2599. [DOI] [PubMed] [Google Scholar]
- 5.Hu H, Gan J, Jonas P. Fast-spiking, parvalbumin(+) GABAergic interneurons: from cellular design to microcircuit function. Science. 2014;345:1255263. doi: 10.1126/science.1255263. [DOI] [PubMed] [Google Scholar]
- 6.Pi HJ, et al. Cortical interneurons that specialize in disinhibitory control. Nature. 2013;503:521–524. doi: 10.1038/nature12676. [DOI] [PMC free article] [PubMed] [Google Scholar]
- 7.Zeisel A, et al. Cell types in the mouse cortex and hippocampus revealed by single-cell RNA-seq. Science. 2015;347:1138–1142. doi: 10.1126/science.aaa1934. [DOI] [PubMed] [Google Scholar]
- 8.Tasic B, et al. Adult mouse cortical cell taxonomy revealed by single cell transcriptomics. Nat Neurosci. 2016;19:335–346. doi: 10.1038/nn.4216. [DOI] [PMC free article] [PubMed] [Google Scholar]
- 9.Wamsley B, Fishell G. Genetic and activity-dependent mechanisms underlying interneuron diversity. Nat Rev Neurosci. 2017;18:299–309. doi: 10.1038/nrn.2017.30. [DOI] [PubMed] [Google Scholar]
- 10.Anderson SA, Eisenstat DD, Shi L, Rubenstein JLR. Interneuron migration from basal forebrain to neocortex: dependence on Dlx genes. Science. 1997;278:474–476. doi: 10.1126/science.278.5337.474. [DOI] [PubMed] [Google Scholar]
- 11.Miyoshi G, Butt SJ, Takebayashi H, Fishell G. Physiologically distinct temporal cohorts of cortical interneurons arise from telencephalic Olig2-expressing precursors. J Neurosci. 2007;27:7786–7798. doi: 10.1523/JNEUROSCI.1807-07.2007. [DOI] [PMC free article] [PubMed] [Google Scholar]
- 12.Smart IH. A pilot study of cell production by the ganglionic eminences of the developing mouse brain. J Anat. 1976;121:71–84. [PMC free article] [PubMed] [Google Scholar]
- 13.Gotz M, Huttner WB. The cell biology of neurogenesis. Nat Rev Mol Cell Biol. 2005;6:777–788. doi: 10.1038/nrm1739. [DOI] [PubMed] [Google Scholar]
- 14.Paul A, et al. Transcriptional architecture of synaptic communication delineates GABAergic neuron identity. Cell. 2017;171:522–539 e520. doi: 10.1016/j.cell.2017.08.032. [DOI] [PMC free article] [PubMed] [Google Scholar]
- 15.Flames N, et al. Delineation of multiple subpallial progenitor domains by the combinatorial expression of transcriptional codes. J Neurosci. 2007;27:9682–9695. doi: 10.1523/JNEUROSCI.2750-07.2007. [DOI] [PMC free article] [PubMed] [Google Scholar]
- 16.Silberberg SN, et al. Subpallial Enhancer Transgenic Lines: a Data and Tool Resource to Study Transcriptional Regulation of GABAergic Cell Fate. Neuron. 2016;92:59–74. doi: 10.1016/j.neuron.2016.09.027. [DOI] [PMC free article] [PubMed] [Google Scholar]
- 17.Sussel L, Marín O, Kimura S, Rubenstein JL. Loss of Nkx2.1 homeobox gene function results in a ventral to dorsal molecular respecification within the basal telencephalon: evidence for a transformation of the pallidum into the striatum. Development. 1999;126:3359–3370. doi: 10.1242/dev.126.15.3359. [DOI] [PubMed] [Google Scholar]
- 18.Nery S, Fishell G, Corbin JG. The caudal ganglionic eminence is a source of distinct cortical and subcortical cell populations. Nat Neurosci. 2002;5:1279–1287. doi: 10.1038/nn971. [DOI] [PubMed] [Google Scholar]
- 19.Wichterle H, Garcia-Verdugo JM, Herrera DG, Alvarez-Buylla A. Young neurons from medial ganglionic eminence disperse in adult and embryonic brain. Nat Neurosci. 1999;2:461–466. doi: 10.1038/8131. [DOI] [PubMed] [Google Scholar]
- 20.Gelman DM, Marín O. Generation of interneuron diversity in the mouse cerebral cortex. Eur J Neurosci. 2010;31:2136–2141. doi: 10.1111/j.1460-9568.2010.07267.x. [DOI] [PubMed] [Google Scholar]
- 21.Frazer S, et al. Transcriptomic and anatomic parcellation of 5-HT3AR expressing cortical interneuron subtypes revealed by single-cell RNA sequencing. Nat Commun. 2017;8:14219. doi: 10.1038/ncomms14219. [DOI] [PMC free article] [PubMed] [Google Scholar]
- 22.Tremblay R, Lee S, Rudy B. GABAergic interneurons in the neocortex: From cellular properties to circuits. Neuron. 2016;91:260–292. doi: 10.1016/j.neuron.2016.06.033. [DOI] [PMC free article] [PubMed] [Google Scholar]
- 23.Wonders CP, Anderson SA. The origin and specification of cortical interneurons. Nat Rev Neurosci. 2006;7:687–696. doi: 10.1038/nrn1954. [DOI] [PubMed] [Google Scholar]
- 24.Bortone D, Polleux F. KCC2 expression promotes the termination of cortical interneuron migration in a voltage-sensitive calcium-dependent manner. Neuron. 2009;62:53–71. doi: 10.1016/j.neuron.2009.01.034. [DOI] [PMC free article] [PubMed] [Google Scholar]
- 25.De Marco Garcia NV, Karayannis T, Fishell G. Neuronal activity is required for the development of specific cortical interneuron subtypes. Nature. 2011;472:351–355. doi: 10.1038/nature09865. [DOI] [PMC free article] [PubMed] [Google Scholar]
- 26.Dehorter N, et al. Tuning of fast-spiking interneuron properties by an activity-dependent transcriptional switch. Science. 2015;349:1216–1220. doi: 10.1126/science.aab3415. [DOI] [PMC free article] [PubMed] [Google Scholar]
- 27.Bartolini G, Ciceri G, Marín O. Integration of GABAergic interneurons into cortical cell assemblies: lessons from embryos and adults. Neuron. 2013;79:849–864. doi: 10.1016/j.neuron.2013.08.014. [DOI] [PubMed] [Google Scholar]
- 28.Close JL, et al. Single-cell profiling of an in vitro model of human interneuron development reveals temporal dynamics of cell type production and maturation. Neuron. 2017;93:1035–1048. doi: 10.1016/j.neuron.2017.02.014. [DOI] [PMC free article] [PubMed] [Google Scholar]
- 29.Maroof AM, et al. Directed differentiation and functional maturation of cortical interneurons from human embryonic stem cells. Cell Stem Cell. 2013;12:559–572. doi: 10.1016/j.stem.2013.04.008. [DOI] [PMC free article] [PubMed] [Google Scholar]
- 30.Xu Q, Tam M, Anderson SA. Fate mapping Nkx2.1-lineage cells in the mouse telencephalon. J Comp Neurol. 2008;506:16–29. doi: 10.1002/cne.21529. [DOI] [PubMed] [Google Scholar]
- 31.Wende H, et al. The transcription factor c-Maf controls touch receptor development and function. Science. 2012;335:1373–1376. doi: 10.1126/science.1214314. [DOI] [PubMed] [Google Scholar]
- 32.Dobin A, et al. STAR: ultrafast universal RNA-seq aligner. Bioinformatics. 2013;29:15–21. doi: 10.1093/bioinformatics/bts635. [DOI] [PMC free article] [PubMed] [Google Scholar]
- 33.Habegger L, et al. RSEQtools: a modular framework to analyze RNA-Seq data using compact, anonymized data summaries. Bioinformatics. 2011;27:281–283. doi: 10.1093/bioinformatics/btq643. [DOI] [PMC free article] [PubMed] [Google Scholar]
- 34.Li H, et al. The Sequence Alignment/Map format and SAMtools. Bioinformatics. 2009;25:2078–2079. doi: 10.1093/bioinformatics/btp352. [DOI] [PMC free article] [PubMed] [Google Scholar]
- 35.Satija R, Farrell JA, Gennert D, Schier AF, Regev A. Spatial reconstruction of single-cell gene expression data. Nat Biotechnol. 2015;33:495–502. doi: 10.1038/nbt.3192. [DOI] [PMC free article] [PubMed] [Google Scholar]
- 36.Tirosh I, et al. Dissecting the multicellular ecosystem of metastatic melanoma by single-cell RNA-seq. Science. 2016;352:189–196. doi: 10.1126/science.aad0501. [DOI] [PMC free article] [PubMed] [Google Scholar]
- 37.van der Maaten L, Hinton G. Visualizing Data using t-SNE. J Mach Learn Res. 2008;9:2579–2605. [Google Scholar]
- 38.Breiman L. Random forests. Mach Learn. 2001;45:5–32. [Google Scholar]
- 39.Lake BB, et al. Neuronal subtypes and diversity revealed by single-nucleus RNA sequencing of the human brain. Science. 2016;352:1586–1590. doi: 10.1126/science.aaf1204. [DOI] [PMC free article] [PubMed] [Google Scholar]
- 40.Chen YJ, et al. Single-cell RNA sequencing identifies distinct mouse medial ganglionic eminence cell types. Sci Rep. 2017;7:45656. doi: 10.1038/srep45656. [DOI] [PMC free article] [PubMed] [Google Scholar]
- 41.Zechel S, Zajac P, Lonnerberg P, Ibanez CF, Linnarsson S. Topographical transcriptome mapping of the mouse medial ganglionic eminence by spatially resolved RNA-seq. Genome Biol. 2014;15:486. doi: 10.1186/s13059-014-0486-z. [DOI] [PMC free article] [PubMed] [Google Scholar]
- 42.Wagner F. GO-PCA: An Unsupervised Method to Explore Gene Expression Data Using Prior Knowledge. PLoS One. 2015;10:e0143196. doi: 10.1371/journal.pone.0143196. [DOI] [PMC free article] [PubMed] [Google Scholar]
- 43.Zhao S, Guo Y, Sheng Q, Shyr Y. Advanced heat map and clustering analysis using heatmap3. Biomed Res Int. 2014;2014:986048. doi: 10.1155/2014/986048. [DOI] [PMC free article] [PubMed] [Google Scholar]
- 44.Tashiro A, Sandler VM, Toni N, Zhao C, Gage FH. NMDA-receptor-mediated, cell-specific integration of new neurons in adult dentate gyrus. Nature. 2006;442:929–933. doi: 10.1038/nature05028. [DOI] [PubMed] [Google Scholar]
Associated Data
This section collects any data citations, data availability statements, or supplementary materials included in this article.


