

Abstract
As a fundamental unit of life, the cell has rightfully been the subject of intense investigation throughout the history of biology. Technical innovations now make it possible to assay cellular features at genomic scale, yielding breakthroughs in our understanding of the molecular organization of tissues, and even whole organisms. As these data accumulate we will soon be faced with a new challenge: making sense of the plethora of results. Early investigations into the replicability of cell type profiles inferred from single cell RNA-sequencing data have indicated that this is likely to be surprisingly straightforward due to consistent gene co-expression. In this opinion we discuss the evidence for this claim, and its implications for interpreting cell type-specific gene expression.
Keywords: single-cell, RNA-seq, co-expression, transcriptome, replicability, cell type
Single Cell Rising
Single cell RNA-sequencing (scRNA-seq) technologies have exponentially increased in capacity over a few short years. Far from early studies of a few hand-picked cells, individual experiments now routinely run to thousands or even hundreds of thousands of cells [1]. This technical progress has fostered biological discovery at the single-cell level, including impressive approaches for whole organism profiling [2–4] and cell lineage tracing [5]. Computational methods have proliferated in turn, and already more than 200 analysis tools have been catalogued as part of the scRNA-tools database [6].
Previous review articles have emphasized the novelty of the analytic challenges posed by single-cell data (e.g., [7, 8]). By contrast, in this opinion we aim to show the deep roots of scRNA-seq within the greater history of expression analysis, and particularly co-expression network analysis. We are motivated by recent evidence that single-cell studies show surprising replicability in spite of technical issues. Our thesis is that this can only be explained by robust gene co-expression. We will discuss the link between low-dimensionality in scRNA-seq and gene co-expression, as well as previous efforts to use co-expression for sample characterization in cancer. This will clarify the major limitation of relying on co-expression for single-cell analysis: collinearity confounds gene-level inference (Box 1). For convenience, we focus on the simpler case of linear relationships, although more complex dependencies can be explored within the same framework. We conclude with a discussion of outstanding questions within this young field, and highlight possible avenues for progress.
Box 1 –
Key Concepts
Collinearity and co-expression
Collinearity (or multicollinearity) occurs when one explanatory variable can be linearly predicted using one or more of the other explanatory variables. In expression analysis, genes are the explanatory variables that characterize differences between sample groups and they will be collinear if their expression profiles are correlated across samples. Correlation between genes is also known as co-expression, which is a well-established feature of high-throughput expression data. While perfectly benign as an observation, collinearity has important consequences for interpreting results. If 100 genes are correlated with cell differentiation, which gene is the driver? The data alone cannot tell us.
Low-dimensionality
If we consider expression data as a matrix with the form N columns x P rows, where the columns give different samples, and the rows are genes, the dimension of each sample is P, the number of attributes listed for that sample. Most human scRNA-seq experiments use polyA-selection methods and map to protein-coding genes, making P ≈ 20,000, which is high relative to the number of samples (historically). Yet because genes are co-expressed, the number of dimensions necessary to characterize each sample is lower than it might at first appear – some of the dimensions (genes) are redundant. Principal component analysis (PCA) and other dimension reduction methods aim to extract the maximal amount of variability from a matrix using the fewest dimensions. Because these methods have been so successful at separating cell types, often requiring only 10–100 dimensions depending on the tissue and number of samples, there is a strong claim that cell types are low-dimensional.
The Surprising Replicability of scRNA-Seq
Many single-cell studies are motivated by the hypothesis that characterizing the extent and causes of cellular heterogeneity will enable deeper understanding of biological systems [9]. One particular hope of single-cell approaches is that they will resolve the long-standing issue of whether differential expression in bulk tissue results from unequal cell type proportions or from changes to gene regulation within a cell type across samples. In recent years scRNA-seq has gained enormous popularity thanks to advances in microfluidics technology that enable high-throughput liquid handling and an economy of scale through barcoding strategies [1]. Some of the most prominent applications of scRNA-seq have been attempts to define all cell types within a tissue as a sort of molecular census [10–13] (Box 2). The early success of these strategies has prompted even greater interest in this approach, and the Human Cell Atlas project is a notable example of a large-scale effort to catalog cell types with single-cell technology [14].
Box 2 –
Inferring cell types from expression data
One of the primary tasks in single cell transcriptomics has been to use expression data to characterize the heterogeneity of cells within a given cell type or tissue. A common workflow for this is to group the cells by their expression profiles, and then compare expression values between groups. But what are these groups? Do they represent novel cell types or subtypes? Answering these questions requires us to formally define these terms, and field-wide standards in nomenclature have yet to be achieved. A standard working definition would discriminate between two key aspects of cell identity: cell type and cell state. Cell type refers to more permanent features of a cell’s identity (a neuron does not become a red blood cell), whereas cell states are more variable and often reflect temporally limited processes (circadian rhythm, cell cycle). In this article we are primarily concerned with studies that aim to define cell types from single cell data, which are often organized in a hierarchical taxonomy that can be further divided into subtypes.
The basic steps involved in scRNA-sequencing are the following: cells are captured, lysed and mRNA is reverse transcribed to generate cDNA libraries, often including cell and molecular barcodes for multiplexing and reducing PCR-amplification bias, respectively, then sequencing proceeds as usual. After quality control and normalization, sample clustering is a key step of almost any single cell analysis pipeline. To obtain a robust representation of the underlying data, analysts rely on dimension reduction techniques such as PCA, often calculated based on a subset of highly variable genes.
Distances are measured between cells based on their co-ordinates within this reduced space and cells are counted as similar if they occupy similar positions (i.e., cluster).
This is the area of single cell analysis that receives the most attention, and yet it is often the most opaque. Published protocols and bioinformatics packages suggest choosing the number of clusters that “agrees with your intuition” [71] or that maximizes some measure of modularity [12, 72]. Still others suggest taking the consensus across multiple parameter choices [73, 74]. Without external data for validation, clustering is necessarily exploratory rather than confirmatory, and the risk of overfitting (finding idiosyncratic clusters) is high. These issues are partially resolved by resampling within the data but are best addressed through cross-dataset replicability analysis. Transcriptome-based classifications ultimately require biological validation via independent assays into cell identity and function.
Alongside the many advances have come a greater appreciation of the potential pitfalls of low-input RNA-sequencing, including technical variation caused by PCR amplification or signal drop-out [15–17] and prominent batch effects [18]. Further questions have been raised regarding appropriate normalization and handling of biological confounders like the cell cycle or transcriptional bursting [19–21]. In spite of these challenges, it is becoming increasingly clear that cell profiles can be aligned across technical and biological sources of variation [22–29], and our own work has indicated that more than half of the computationally identified interneuron subtype profiles are highly replicable [30]. We and others [29] have also demonstrated high replicability among five studies of the human pancreas. How can these unexpected successes be explained?
Cell Types are Low-Dimensional
One plausible reason is that cell identity signals are highly robust. For example, we know a principal source of noise in single-cell data is incomplete sampling of the total mRNA pool, which means that a high proportion of genes are not detected within an individual sample. However, if many genes encode cell identity, then we will be able to read out this property regardless of individual gene dropouts (Figure 1). The robustness of cell type transcriptional profiles was first suggested by early downsampling and multiplexing experiments, which showed that cell type identification was possible with quite a small number of reads [31, 32] and this message has been re-iterated by Drop-seq proponents [12, 24].
Figure 1 – Cell type identity is encoded in many genes.
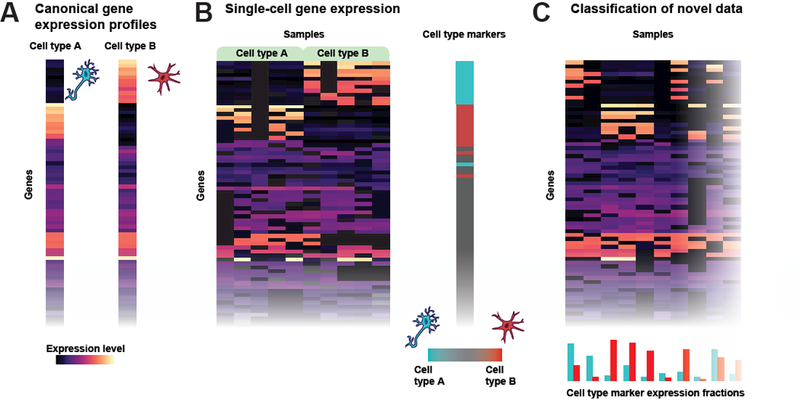
A – Schematic depiction of ground-truth expression profiles for two cell types, A and B, where each row is a cell and the color indicates the expression level. Many genes are similarly expressed in both cell types, but a handful of markers are expressed exclusively in one cell type or the other. B – A heatmap of single-cell RNA-seq data comparing five A cells and five B cells. While many genes are not detected, the aggregate signals across genes still provide sufficient information to differentiate between the two cell types, even when cells have perfectly mutually exclusive marker expression as in the first two columns of cell type B. C – A heatmap of single-cell data from unlabeled samples. Aggregate marker gene expression for each sample is plotted below the heatmap. Cell type identity can be inferred in noisy data because it is encoded in many genes.
In their 2016 paper, Heimberg and colleagues explored the conceptual basis of this phenomenon in detail [33]. Taking inspiration from signal processing where it is known that many natural signals can be modeled in low-dimensional space, the authors propose that expression data may also have this property. So just as images can be reconstructed from low dimensions thanks to high correlations between adjacent pixels, the authors argue that gene co-regulatory modules may be recoverable from high gene-gene correlations, effectively reducing the search space from 20000 genes to a space of a few principal components that capture co-expressed gene modules. This is similar to the motivation behind the L1000 platform, designed to measure the expression of 1000 “landmark” genes that recover a large fraction of information from the full transcriptome [34] and earlier work on expression imputation more broadly [35, 36].
In a series of downsampling experiments, Heimberg et al. provide evidence that top principal components are robust to noise induced by signal loss, with robustness scaling with the proportion of variance explained. As such, they find that low depth transcriptome coverage (~100 genes detected) is sufficient to characterize cell type differences that are represented within only a single principal component (glia vs. neurons), but that higher depth (~1000 genes detected) is required to accurately recover cell types that differ along the top three principal components (between neuronal subtypes). These results nicely fit our intuitions about cell types, and can be modeled to help researchers make decisions about experimental design. This low-dimensionality also allows us to ground single-cell research in an area of expression analysis that has been of interest for decades: co-expression.
Linking Co-expression to Single-Cell Analysis
The observation that many genes jointly vary between cell types can be generalized to any source of conditional variation between samples, such as differences in age, treatment or disease. Under any condition, genes that co-vary, or “co-expressed” genes, can be identified by their significantly similar patterns of expression across samples, often assessed genome-wide between all possible gene pairs. Importantly, genes which are grouped by their expression profiles share molecular and biological functions, as shown in Eisen et al.’s seminal 1998 paper [37]. For example, members of the same protein complex, like the proteasome, often have highly correlated gene expression. Co-expression links between genes are usefully visualized and analyzed as networks. While gene-gene networks often appear complex, they are motivated by the simple principle that genes with similar functions are preferentially connected [38]. As in single-cell analysis, the known functional groupings defined within these networks also imply lower dimensionality of transcriptional data relative to the number of genes. A natural question is whether the low-dimensionality in single-cell data is directly linked to the low-dimensionality implied by co-expression in bulk data.
This can be addressed by comparing co-expression networks built from bulk RNA-seq to those built from single-cell data. Here, the question is more precisely framed: are the co-expression patterns observed in single-cell data unique, or do they overlap with the modules found in bulk RNA-seq networks? In an analysis of more than 400 bulk and single-cell co-expression networks our group found very similar results across the two data types [39], thus confirming a link between the low-dimensionality of bulk and single-cell data. We also found that single-cell networks increasingly strengthen connections between known gene modules as data is aggregated across individual experiments. Taken together, these two results support the strong conclusion that there exists a shared low-dimensional space that underlies cell identification across experiments, and that these dimensions are observable in bulk co-expression. However, co-expression signals are strikingly weak in individual scRNA-seq datasets [40], regardless of the number of samples or the extent of cell type heterogeneity. This may be due to technical issues like gene drop-out, or to biological features like transcriptional bursting, which can reduce the signal-to-noise ratio for cell type-relevant genes [41]. Even though cell type variation can be observed, a great deal of information is likely to be missing from any individual dataset.
To date, most co-expression applications in the single cell field have been targeted toward correcting expression data for sample inference [19, 42–44]. Eventually gene-targeted evaluation will be the goal. Here, again, prior experience from bulk analysis can help to guide us. We discuss this in more detail in the following section.
Co-expression Implies Collinearity: Lessons from Bulk Expression Analysis
As we have discussed, co-expression is inherent to expression data, provides low-dimensional properties and makes characterization of samples robust, as in single cell RNA-seq. These are useful features but it is important to understand their full implications in order to accurately model and interpret results. For this, we can learn from previous work to analyze gene expression data over the past decades, which highlighted the conceptual and statistical pitfalls that arise when co-expression is neglected, and genes are treated as independent variables. Gene collinearity complicates inference (Figure 2).
Figure 2 – The implications of multi-gene encoding of cell type.

A single-cell expression dataset is shown in the top left of the schematic, where each row is a gene and each column is a cell. In this example, the three cell types (indicated by their distinct morphologies and colors) are distinguishable by their expression of two sets of genes, one set is expressed in cell types A and C, and one set is expressed in cell types B and C. This has three corollaries (clockwise from right): 1 – Co-expression: The genes that characterize cell types show correlated expression across samples, thus forming clustered modules; 2 – Low-dimensionality: Cell types are easily separated in low-dimensional space; and 3 – Collinearity: Many gene pairs are equally predictive of cell type. This illustrates the importance of gene-gene relationships for cell identification, and suggests caution when interpreting the significance of individual genes.
One area where this has been of particular importance is cancer subtyping. Similar to scRNA-seq applications, cancer researchers have aimed to define substructure among samples through unsupervised clustering approaches [45]. Rather than defining cell types, here the goal has been to define tumor subtypes, and use these to predict patient specific features like prognosis or drug response. In breast cancer, for example, only a subset of patients respond to anti-estrogen therapy [46]. Could microarray technology determine the molecular characteristics of tumors that are unresponsive to known therapies? To an extent, the answer was yes: clustering did reveal structure among tumors, and the identified marker genes predicted patient survival [47, 48]. Yet it came as a surprise when it was discovered that almost any set of genes could predict outcome [49]. This finding can readily be explained by co-expression. If co-expression is common, then each marker gene can be regarded as a stand-in for some module of genes with related expression profiles. If these modules are large (i.e., expression data is low-dimensional), then a random set of genes will sample from these modules, and therefore capture much of the performance historically observed by any marker set. Concretely, we might imagine that only two gene programs drive cancer progression: increased cell proliferation and reduced apoptosis. If 10% of genes were involved in each process, then randomly sampling even a hundred genes leaves one quite likely to obtain useful markers. In such a scenario, the exact genes chosen as markers are only a broad clue into the molecular processes important for phenotype.
These examples illustrate that it is critical to determine whether a gene is co-expressed or independent in order to correctly interpret its significance, and suggest caution for the interpretation of markers derived from single-cell data. We discuss this and related issues in more detail below.
Limitations of Co-expression for scRNA-seq
There is a strong expectation that single-cell RNA-seq will continue to yield insights into the cellular composition of tissues, and certainly in those that have yet to be profiled. The evidence from the single-cell literature supports the notion that many cell types can be identified on the basis of broad changes in gene co-expression, and that this underlies the success of droplet-based high-throughput sequencing approaches that only shallowly sample from the total RNA pool. Yet there are clear limitations that arise from relying on co-expression as our saving grace.
Firstly, if cell types do not conform to expectations of characteristically broad changes in gene co-expression then current approaches will fail. In the simplest case, where cell types differ from their nearest relatives via the expression of only a small number of genes, we will be hard-pressed to find them if there are too few genes captured per cell or if too few cells are sampled. This has nicely been discussed by Torre et al in their recent comparison of single cell RNA-seq and single-molecule RNA FISH [50]. When designing single-cell experiments, it is therefore important to have a clear hypothesis and goal in mind, as one size will not fit all.
On the other hand, if cell identification truly does require the co-expression of hundreds or thousands of genes, this creates an important conceptual problem as we have discussed. In this case, nearly all genes are potential markers. Collinearity between genes makes it difficult at least, and meaningless at worst, to prioritize one as the most significant for cell function [51]. For this reason, although we may be able to identify cells from their co-expression patterns, we may not be characterizing them very much. Intuitively, if only a few randomly chosen genes are ever necessary to identify a cell, mechanistic understandings of cell identity are likely to remain out of reach using current data. However, what collinearity may lack in explanatory power on a per-gene basis, it may compensate for in practical utility. In addition to enabling sparse representations of biological processes that describe cell types or cell states [52], taking advantage of co-expression would allow researchers to tap into the same information that is encoded in multiple genes by targeting the select few with pre-existing tools like Cre-driver lines or monoclonal antibodies. As long as the notion of a marker is clearly defined as ‘one of many equivalents’ we should be safe from making conceptual errors when interpreting results.
Finally, we must note that in spite of its utility for cell identification, gene co-expression cannot be assumed to make up for all of the missing data. Currently scRNA-seq is not a transcriptome-wide method but rather a method to sample the transcriptome. Estimates from single molecule FISH suggest that only ~10–20% of the transcriptome is assayed with single cell RNA-sequencing [50, 53]. The investigation of regulatory and network information from single cells is compromised by this inherent low coverage. If broad co-expression is used to impute missing data, as in the MAGIC pipeline [54] or with autoencoder approaches [55, 56], we are unlikely to detect subtle changes from expectation, which may be necessary as the field progresses. Indeed, after imputation the assessment of gene-gene similarity is partially circular, exaggerating the similarity of gene expression profiles and the apparent significance of resulting co-expression relationships. Unless transcriptome coverage increases dramatically it will be necessary to return to pooled samples or targeted assays in order to make any statement about individual genes. Of course this already occurs through cluster-based differential expression, and with newer approaches to smooth single cell expression profiles by averaging across nearest neighbors [57, 58]. Whether it will be possible to define co-expression that is both genome-wide and driven by variation between single cells remains to be seen.
Concluding Remarks and Future Perspectives
Early single cell experiments have been remarkably successful thanks to gene co-expression within individual cells and cell types: co-expression has been our saving grace. Yet the field’s reliance on gene-gene covariation has been largely implicit, putting us at risk of misinterpreting results and transforming co-expression into our original sin. To move the field forward it will be important to evaluate covariation directly, as this will provide greater insight into both the successes and failures of scRNA-seq, as well as our understanding of cell types and cell states (see Outstanding Questions). Indeed, over-reliance on global variance measures may cause us to miss rare events, such as dysregulation limited to a small total number of genes. As a start, we suggest that low dimensional plots of single data should report what the dimensions represent. The trend of displaying cells with tSNE has been a roadblock to obtaining replicable features since the method is stochastic and does not consistently represent cluster variability or distances [59]. More clarity in underlying methods will improve our collective intuition about the quality of single cell data and clustering solutions.
Understanding the mechanisms of cell identity, as opposed to just their correlates, will ultimately require controlled perturbation experiments to characterize gene-drivers of cell phenotype. This is already beginning to be possible in a high-throughput way through Perturb-seq [60], CRISP-seq [61] and CROP-seq [62], and we are excited to see future application and refinement of these techniques. We note that while broad co-expression underlies the success and replicability of current cell clusters, new data may reveal that other classes of variation are important for cell type characterization. Combining scRNA-seq with other techniques like multiplexed fluorescence in situ hybridization [63], epitope-barcoding [64, 65], and for neurons, projection mapping [66, 67] and patch-clamp recording [68–70], may show that expression is low-dimensional even when cell identity is not, thus limiting the resolution of unsupervised techniques based on expression data alone. External validation, beyond expression data, will be the ultimate arbiter as researchers begin to unravel whether the cell types identified through large-scale gene co-expression are useful for understanding the organization and function of biological systems.
Highlights.
Single cell RNA-sequencing approaches are vastly increasing in scale, with individual experiments routinely profiling thousands or even hundreds of thousands of cells.
In spite of technical limitations associated with low-input sequencing, cell classification through unsupervised clustering is surprisingly replicable across studies. This can be attributed to the intrinsic low dimensionality of cell types dominating the variability seen in expression profiles.
Low dimensionality of expression profiles implies gene co-expression. An exploration of the history of co-expression highlights the perils of making gene-level inferences in light of collinearity, an issue that has previously arisen in cancer subtyping analysis.
Co-expression has been both the saving grace and original sin of single cell RNA-seq: enabling sample characterization at the cost of gene-level inference.
Outstanding Questions.
Are all cell type differences distributed across many genes? Most current expression protocols rely on this, but some important heterogeneity between cells might be reflected in the differential expression of just a few genes, or from differential isoform usage.
What are the dimensions of cell identity? How well do these generalize across all cell types, conditions, species? Under what conditions does differential co-expression occur? Individual studies may be low-dimensional only because they each sample from a relatively narrow space of existing cell phenotypes.
How useful are discrete transcriptional types for explaining and predicting cell function? Continuous gradients naturally occur in tissues and will also be reflected by co-expression. Are cells better modeled by continuous processes? How would this help guide further experimentation?
What genes are most important for determining cell identity? Marker genes are necessary for targeting cell types but may not be required for cell phenotype or function. What genes are co-expressed with known markers? How much do known markers explain results?
Footnotes
Publisher's Disclaimer: This is a PDF file of an unedited manuscript that has been accepted for publication. As a service to our customers we are providing this early version of the manuscript. The manuscript will undergo copyediting, typesetting, and review of the resulting proof before it is published in its final citable form. Please note that during the production process errors may be discovered which could affect the content, and all legal disclaimers that apply to the journal pertain.
Contributor Information
Megan Crow, Cold Spring Harbor Laboratory, One Bungtown Road, Cold Spring Harbor, NY 11724, USA.
Jesse Gillis, Cold Spring Harbor Laboratory, One Bungtown Road, Cold Spring Harbor, NY 11724, USA.
References
- 1.Svensson V et al. (2018) Exponential scaling of single-cell RNA-seq in the past decade. Nature Protocols 13, 599. [DOI] [PubMed] [Google Scholar]
- 2.Cao J et al. (2017) Comprehensive single-cell transcriptional profiling of a multicellular organism. Science 357 (6352), 661–667. [DOI] [PMC free article] [PubMed] [Google Scholar]
- 3.Plass M et al. (2018) Cell type atlas and lineage tree of a whole complex animal by single-cell transcriptomics. Science. [DOI] [PubMed] [Google Scholar]
- 4.Fincher CT et al. (2018) Cell type transcriptome atlas for the planarian Schmidtea mediterranea. Science. [DOI] [PMC free article] [PubMed] [Google Scholar]
- 5.McKenna A et al. (2016) Whole-organism lineage tracing by combinatorial and cumulative genome editing. Science 353 (6298), aaf7907. [DOI] [PMC free article] [PubMed] [Google Scholar]
- 6.Zappia L et al. (2018) Exploring the single-cell RNA-seq analysis landscape with the scRNA-tools database. PLOS Computational Biology 14 (6), e1006245. [DOI] [PMC free article] [PubMed] [Google Scholar]
- 7.Stegle O et al. (2015) Computational and analytical challenges in single-cell transcriptomics. Nat Rev Genet 16 (3), 133–45. [DOI] [PubMed] [Google Scholar]
- 8.Wagner A et al. (2016) Revealing the vectors of cellular identity with single-cell genomics. Nat Biotech 34 (11), 1145–1160. [DOI] [PMC free article] [PubMed] [Google Scholar]
- 9.Shapiro E et al. (2013) Single-cell sequencing-based technologies will revolutionize whole-organism science. Nature Reviews Genetics 14, 618. [DOI] [PubMed] [Google Scholar]
- 10.Zeisel A et al. (2015) Brain structure. Cell types in the mouse cortex and hippocampus revealed by single-cell RNA-seq. Science 347 (6226), 1138–42. [DOI] [PubMed] [Google Scholar]
- 11.Usoskin D et al. (2015) Unbiased classification of sensory neuron types by large-scale single-cell RNA sequencing. Nat Neurosci 18 (1), 145–53. [DOI] [PubMed] [Google Scholar]
- 12.Macosko EZ et al. (2015) Highly Parallel Genome-wide Expression Profiling of Individual Cells Using Nanoliter Droplets. Cell 161 (5), 1202–14. [DOI] [PMC free article] [PubMed] [Google Scholar]
- 13.Treutlein B et al. (2014) Reconstructing lineage hierarchies of the distal lung epithelium using single-cell RNA-seq. Nature 509 (7500), 371–5. [DOI] [PMC free article] [PubMed] [Google Scholar]
- 14.Regev A et al. (2017) The Human Cell Atlas. Elife 6 [DOI] [PMC free article] [PubMed] [Google Scholar]
- 15.Lin P et al. (2017) CIDR: Ultrafast and accurate clustering through imputation for single-cell RNA-seq data. Genome Biology 18 (1), 59. [DOI] [PMC free article] [PubMed] [Google Scholar]
- 16.Pierson E and Yau C (2015) ZIFA: Dimensionality reduction for zero-inflated single-cell gene expression analysis. Genome Biology 16, 241. [DOI] [PMC free article] [PubMed] [Google Scholar]
- 17.Risso D et al. (2018) A general and flexible method for signal extraction from single-cell RNA-seq data. Nature Communications 9 (1), 284. [DOI] [PMC free article] [PubMed] [Google Scholar]
- 18.Hicks SC et al. (2017) Missing data and technical variability in single-cell RNA-sequencing experiments. Biostatistics. [DOI] [PMC free article] [PubMed] [Google Scholar]
- 19.Buettner F et al. (2015) Computational analysis of cell-to-cell heterogeneity in single-cell RNA-sequencing data reveals hidden subpopulations of cells. Nat Biotechnol 33 (2), 155–60. [DOI] [PubMed] [Google Scholar]
- 20.McDavid A et al. (2016) The contribution of cell cycle to heterogeneity in single-cell RNA-seq data. Nature Biotechnology 34, 591. [DOI] [PMC free article] [PubMed] [Google Scholar]
- 21.Vallejos CA et al. (2017) Normalizing single-cell RNA sequencing data: challenges and opportunities. Nature methods 14 (6), 565. [DOI] [PMC free article] [PubMed] [Google Scholar]
- 22.Habib N et al. (2016) Div-Seq: Single-nucleus RNA-Seq reveals dynamics of rare adult newborn neurons. Science 353 (6302), 925–8. [DOI] [PMC free article] [PubMed] [Google Scholar]
- 23.La Manno G et al. (2016) Molecular Diversity of Midbrain Development in Mouse, Human, and Stem Cells. Cell 167 (2), 566–580.e19. [DOI] [PMC free article] [PubMed] [Google Scholar]
- 24.Shekhar K et al. (2016) Comprehensive Classification of Retinal Bipolar Neurons by Single-Cell Transcriptomics. Cell 166 (5), 1308–1323.e30. [DOI] [PMC free article] [PubMed] [Google Scholar]
- 25.Lin C et al. (2017) Using neural networks for reducing the dimensions of single-cell RNA-Seq data. Nucleic Acids Research. [DOI] [PMC free article] [PubMed] [Google Scholar]
- 26.Butler A et al. (2018) Integrating single-cell transcriptomic data across different conditions, technologies, and species. Nat Biotechnol. [DOI] [PMC free article] [PubMed] [Google Scholar]
- 27.Haghverdi L et al. (2018) Batch effects in single-cell RNA-sequencing data are corrected by matching mutual nearest neighbors. Nat Biotechnol. [DOI] [PMC free article] [PubMed] [Google Scholar]
- 28.Han X et al. (2018) Mapping the Mouse Cell Atlas by Microwell-Seq. Cell 172 (5), 1091–1107.e17. [DOI] [PubMed] [Google Scholar]
- 29.Kiselev VY et al. (2018) scmap: projection of single-cell RNA-seq data across data sets. Nature Methods. [DOI] [PubMed] [Google Scholar]
- 30.Crow M et al. (2018) Characterizing the replicability of cell types defined by single cell RNA-sequencing data using MetaNeighbor. Nature Communications 9 (1), 884. [DOI] [PMC free article] [PubMed] [Google Scholar]
- 31.Jaitin DA et al. (2014) Massively parallel single-cell RNA-seq for marker-free decomposition of tissues into cell types. Science 343 (6172), 776–9. [DOI] [PMC free article] [PubMed] [Google Scholar]
- 32.Pollen AA et al. (2014) Low-coverage single-cell mRNA sequencing reveals cellular heterogeneity and activated signaling pathways in developing cerebral cortex. Nat Biotechnol 32 (10), 1053–8. [DOI] [PMC free article] [PubMed] [Google Scholar]
- 33.Heimberg G et al. (2016) Low Dimensionality in Gene Expression Data Enables the Accurate Extraction of Transcriptional Programs from Shallow Sequencing. Cell Syst 2 (4), 239–250. [DOI] [PMC free article] [PubMed] [Google Scholar]
- 34.Subramanian A et al. (2017) A Next Generation Connectivity Map: L1000 Platform and the First 1,000,000 Profiles. Cell 171 (6), 1437–1452.e17. [DOI] [PMC free article] [PubMed] [Google Scholar]
- 35.Troyanskaya O et al. (2001) Missing value estimation methods for DNA microarrays. Bioinformatics 17 (6), 520–5. [DOI] [PubMed] [Google Scholar]
- 36.Donner Y et al. (2012) Imputing gene expression from selectively reduced probe sets. Nat Methods 9 (11), 1120–5. [DOI] [PMC free article] [PubMed] [Google Scholar]
- 37.Eisen MB et al. (1998) Cluster analysis and display of genome-wide expression patterns. Proceedings of the National Academy of Sciences of the United States of America 95 (25), 14863–14868. [DOI] [PMC free article] [PubMed] [Google Scholar]
- 38.Oliver S (2000) Guilt-by-association goes global. Nature 403, 601. [DOI] [PubMed] [Google Scholar]
- 39.Crow M et al. (2016) Exploiting single-cell expression to characterize co-expression replicability. Genome Biol 17, 101. [DOI] [PMC free article] [PubMed] [Google Scholar]
- 40.Chen S and Mar JC (2018) Evaluating methods of inferring gene regulatory networks highlights their lack of performance for single cell gene expression data. BMC Bioinformatics 19 (1), 232. [DOI] [PMC free article] [PubMed] [Google Scholar]
- 41.Raj A and van Oudenaarden A (2008) Nature, nurture, or chance: stochastic gene expression and its consequences. Cell 135 (2), 216–26. [DOI] [PMC free article] [PubMed] [Google Scholar]
- 42.van Dijk D et al. Recovering Gene Interactions from Single-Cell Data Using Data Diffusion. Cell. [DOI] [PMC free article] [PubMed] [Google Scholar]
- 43.Huang M et al. (2018) SAVER: gene expression recovery for single-cell RNA sequencing. Nature Methods. [DOI] [PMC free article] [PubMed] [Google Scholar]
- 44.Li WV and Li JJ (2018) An accurate and robust imputation method scImpute for single-cell RNA-seq data. Nat Commun 9 (1), 997. [DOI] [PMC free article] [PubMed] [Google Scholar]
- 45.Song Q et al. (2015) Cancer classification in the genomic era: five contemporary problems. Human Genomics 9 (1), 27. [DOI] [PMC free article] [PubMed] [Google Scholar]
- 46.Polyak K (2011) Heterogeneity in breast cancer. The Journal of Clinical Investigation 121 (10),3786–3788. [DOI] [PMC free article] [PubMed] [Google Scholar]
- 47.Perou CM et al. (2000) Molecular portraits of human breast tumours. Nature 406, 747. [DOI] [PubMed] [Google Scholar]
- 48.Sørlie T et al. (2001) Gene expression patterns of breast carcinomas distinguish tumor subclasses with clinical implications. Proceedings of the National Academy of Sciences 98 (19), 10869–10874. [DOI] [PMC free article] [PubMed] [Google Scholar]
- 49.Venet D et al. (2011) Most Random Gene Expression Signatures Are Significantly Associated with Breast Cancer Outcome. PLoS Comput Biol 7 (10), e1002240. [DOI] [PMC free article] [PubMed] [Google Scholar]
- 50.Torre E et al. (2018) Rare Cell Detection by Single-Cell RNA Sequencing as Guided by Single-Molecule RNA FISH. Cell Systems 6 (2), 171–179.e5. [DOI] [PMC free article] [PubMed] [Google Scholar]
- 51.Tripathy SJ et al. (2017) Transcriptomic correlates of neuron electrophysiological diversity. PLOS Computational Biology 13 (10), e1005814. [DOI] [PMC free article] [PubMed] [Google Scholar]
- 52.Furchtgott LA et al. (2017) Discovering sparse transcription factor codes for cell states and state transitions during development. Elife 6. [DOI] [PMC free article] [PubMed] [Google Scholar]
- 53.Shalek AK et al. (2013) Single-cell transcriptomics reveals bimodality in expression and splicing in immune cells. Nature 498 (7453), 236–40. [DOI] [PMC free article] [PubMed] [Google Scholar]
- 54.van Dijk D et al. (2017) MAGIC: A diffusion-based imputation method reveals gene-gene interactions in single-cell RNA-sequencing data. bioRxiv. [Google Scholar]
- 55.Lopez R et al. (2017) A deep generative model for gene expression profiles from single-cell RNA sequencing. arXiv preprint arXiv:1709.02082. [Google Scholar]
- 56.Eraslan G et al. (2018) Single cell RNA-seq denoising using a deep count autoencoder. bioRxiv. [DOI] [PMC free article] [PubMed] [Google Scholar]
- 57.Wagner F et al. (2018) K-nearest neighbor smoothing for high-throughput single-cell RNA-Seq data. bioRxiv. [Google Scholar]
- 58.La Manno G et al. (2017) RNA velocity in single cells. bioRxiv. [Google Scholar]
- 59.Maaten Lv.d. and Hinton, G. (2008) Visualizing data using t-SNE. Journal of machine learning research 9 (Nov), 2579–2605. [Google Scholar]
- 60.Dixit A et al. (2016) Perturb-Seq: Dissecting Molecular Circuits with Scalable Single-Cell RNA Profiling of Pooled Genetic Screens. Cell 167 (7), 1853–1866.e17. [DOI] [PMC free article] [PubMed] [Google Scholar]
- 61.Jaitin DA et al. (2016) Dissecting Immune Circuits by Linking CRISPR-Pooled Screens with Single-Cell RNA-Seq. Cell 167 (7), 1883–1896.e15. [DOI] [PubMed] [Google Scholar]
- 62.Datlinger P et al. (2017) Pooled CRISPR screening with single-cell transcriptome readout. Nature Methods 14, 297. [DOI] [PMC free article] [PubMed] [Google Scholar]
- 63.Codeluppi S et al. (2018) Spatial organization of the somatosensory cortex revealed by cyclic smFISH. bioRxiv. [DOI] [PubMed] [Google Scholar]
- 64.Stoeckius M et al. (2017) Simultaneous epitope and transcriptome measurement in single cells. Nat Methods 14 (9), 865–868. [DOI] [PMC free article] [PubMed] [Google Scholar]
- 65.Peterson VM et al. (2017) Multiplexed quantification of proteins and transcripts in single cells. Nature biotechnology 35 (10), 936. [DOI] [PubMed] [Google Scholar]
- 66.Tasic B et al. (2016) Adult mouse cortical cell taxonomy revealed by single cell transcriptomics. Nat Neurosci 19 (2), 335–46. [DOI] [PMC free article] [PubMed] [Google Scholar]
- 67.Chen X et al. (2018) Efficient in situ barcode sequencing using padlock probe-based BaristaSeq. Nucleic Acids Res 46 (4), e22. [DOI] [PMC free article] [PubMed] [Google Scholar]
- 68.Fuzik J et al. (2016) Integration of electrophysiological recordings with single-cell RNA-seq data identifies neuronal subtypes. Nat Biotechnol 34 (2), 175–83. [DOI] [PMC free article] [PubMed] [Google Scholar]
- 69.Cadwell CR et al. (2016) Electrophysiological, transcriptomic and morphologic profiling of single neurons using Patch-seq. Nat Biotechnol 34 (2), 199–203. [DOI] [PMC free article] [PubMed] [Google Scholar]
- 70.Foldy C et al. (2016) Single-cell RNAseq reveals cell adhesion molecule profiles in electrophysiologically defined neurons. Proc Natl Acad Sci U S A 113 (35), E5222-31. [DOI] [PMC free article] [PubMed] [Google Scholar]
- 71.Genomics, x. (2017) Cell Ranger R Kit Tutorial: Secondary Analysis on 10x Genomics Single Cell 3’ RNA-seq PBMC Data https://github.com/hb-gitified/cellrangerRkit/blob/master/vignettes/cellrangerrkit-PBMC-vignette-knitr.pdf, (accessed April 30 2018).
- 72.Grun D et al. (2015) Single-cell messenger RNA sequencing reveals rare intestinal cell types. Nature 525 (7568), 251–5. [DOI] [PubMed] [Google Scholar]
- 73.Kiselev VY et al. (2017) SC3: consensus clustering of single-cell RNA-seq data. Nat Methods 14 (5), 483–486. [DOI] [PMC free article] [PubMed] [Google Scholar]
- 74.Perraudeau F et al. (2017) Bioconductor workflow for single-cell RNA sequencing: Normalization, dimensionality reduction, clustering, and lineage inference. F1000Research 6, 1158. [DOI] [PMC free article] [PubMed] [Google Scholar]