Abstract
The molecular mechanisms leading to premature development of aortic valve stenosis (AS) in individuals with a bicuspid aortic valve are unknown. The objective of this study was to identify genes differentially expressed between calcified bicuspid aortic valves (BAVc) and tricuspid valves with (TAVc) and without (TAVn) AS using RNA sequencing (RNA-Seq). We collected 10 human BAVc and nine TAVc from men who underwent primary aortic valve replacement. Eight TAVn were obtained from men who underwent heart transplantation. mRNA levels were measured by RNA-Seq and compared between valve groups. Two genes were upregulated, and none were downregulated in BAVc compared with TAVc, suggesting a similar gene expression response to AS in individuals with bicuspid and tricuspid valves. There were 462 genes upregulated and 282 downregulated in BAVc compared with TAVn. In TAVc compared with TAVn, 329 genes were up- and 170 were downregulated. A total of 273 upregulated and 147 downregulated genes were concordantly altered between BAVc vs. TAVn and TAVc vs. TAVn, which represent 56 and 84% of significant genes in the first and second comparisons, respectively. This indicates that extra genes and pathways were altered in BAVc. Shared pathways between calcified (BAVc and TAVc) and normal (TAVn) aortic valves were also more extensively altered in BAVc. The top pathway enriched for genes differentially expressed in calcified compared with normal valves was fibrosis, which support the remodeling process as a therapeutic target. These findings are relevant to understand the molecular basis of AS in patients with bicuspid and tricuspid valves.
Keywords: calcific aortic valve disease, calcific aortic valve stenosis, transcriptome, pathways, gene expression, bicuspid aortic valve, RNA sequencing
calcific aortic valve stenosis (AS) is a progressive disease leading to the mineralization of the aortic valve leaflets that impairs the blood flow between the left ventricle and the aorta (5, 11). AS affects 2% (32) and 4% (8) of individuals of European descent older than 65 and 85 yr, respectively. Surgical and transcatheter valve replacement are the main clinical treatments for severe, symptomatic AS (25). No effective medical treatment can prevent or slow the progression of AS (21). The symptoms of AS include angina, syncope, and heart failure (14). Individuals with symptoms show a mortality rate of 25% per year (8) and a 5 yr risk of surgical valve replacement or clinical cardiovascular event of 80% (26). The aortic valve can be unicuspid, bicuspid (BAV), tricuspid (TAV), or quadricuspid (25). BAV is the most common congenital valvular heart disease affecting 0.40–2.25% of adults, with the best single estimate at 1.37% (17). Ninety-five percent of individuals older than 75 yr who developed AS present a TAV (37), while 75% of patients who underwent aortic valve replacement between 15 and 65 yr have BAV. Pathologic series have underlined that BAV represents 22–50% of surgically explanted AS valves (30, 34, 37). AS occurs about two decades earlier in BAV compared with TAV patients (14).
Histological and in vitro studies have identified potential pathways that contribute to AS development, which can be modulated by age at the presentation (2, 22, 23, 27). Specific polymorphisms in NOTCH1 were detected in families affected with BAV and left ventricle outflow tract abnormalities (13, 15). A microarray experiment comparing tricuspid valves from patients with AS and controls (7) identified nearly 1,000 genes differentially expressed between calcified and normal aortic valves including genes involved in osteogenesis and calcium regulation, several matrix metalloproteinases, cytokines, chemokines, and collagen genes. Recently, Padang et al. (28) compared the transcriptome of five BAVs and three TAVs in patients with mild to severe AS or aortic regurgitation referred for aortic valve or aortic root surgery. They found similar gene expression patterns in calcified BAV and calcified TAV leaflets with overexpression of inflammatory and calcification response genes and downregulation of NOTCH1-related signaling compared with noncalcified regurgitant valves used as controls. The latter study did not include nonmineralized aortic valves controls with normal function, which limits observations to pathologic tissues, and therefore comparisons with a normally functioning tissue cannot be evaluated.
Despite this progress, our understanding of the molecular mechanisms leading to premature development of AS in BAV individuals is still fairly limited. RNA sequencing (RNA-Seq), could provide insight into these mechanisms. The objective of this study was thus to identify differences in gene expression between calcified BAV (BAVc) and tricuspid valves with (TAVc) or without (TAVn) AS with RNA-Seq. In addition, we aimed to identify molecular pathways linking differentially expressed genes in order to understand the molecular processes involved in AS in the presence of bicuspid and tricuspid aortic valves.
METHODS
Study population.
We included 30 men aged above 18 yr in this study. Surgically explanted BAVc (n = 10) and TAVc (n = 10), with a fibro-calcific remodeling score of 3, were selected to decrease heterogeneity and variations that could occur owing to the remodeling process itself (9). The fibro-calcific remodeling score was determined as previously described (38). We selected as controls 10 individuals undergoing orthotopic heart transplantation without evidence of aortic valve disease and with a normal aortic valve function at echocardiography. Patients were recruited at the Institut universitaire de cardiologie et de pneumologie de Québec (IUCPQ) during surgeries performed between March 2005 and May 2011. The patients were matched by age ± 10 yr with respect to the controls. Only nonsmoker individuals without Type 2 diabetes, renal insufficiency (defined as a serum creatinine > 150 μmol/l), or ascending aorta replacement were included in the study. Coronary artery disease (CAD) was defined as patients presenting a history of coronary artery bypass grafting, myocardial infarction, documented myocardial ischemia or coronary artery stenosis (>50%) on coronary angiography. The mean transvalvular gradient was calculated with the modified Bernoulli equation (6) and the aortic valve area with the continuity equation (29), both based on Doppler transthoracic echocardiographic measurements. Left ventricular (LV) mass was measured by echocardiography, and LV hypertrophy was defined as a LV mass index > 115 g/m2. Hypertension was defined as blood pressure > 140/90 mmHg or the use of antihypertensive medication. Hypercholesterolemia was defined as total plasma cholesterol levels > 6.2 mmol/l or the use of cholesterol-lowering medication. Diabetes was defined as fasting glucose ≥ 7 mmol/l or the use of oral hypoglycemic or insulin medication. Clinical characteristics of patients were compared by t-test, ANOVA, or Fisher's exact tests as appropriate. Table 1 describes patient characteristics according to the three groups of valves. Written informed consent was obtained from all participants. The study was approved by the ethics committee of the IUCPQ.
Table 1.
Clinical and echocardiographic characteristics of patients according to the three groups of valves
| Bicuspid AS (n = 10) | Tricuspid AS (n = 9) | Normal (n = 8) | P | |
|---|---|---|---|---|
| Age, yr | 63.1 ± 4.3 | 64.6 ± 4.3 | 59.1 ± 4.3 | 0.044* |
| Weight, kg | 76.0 ± 13.7 | 90.6 ± 16.3 | 87.3 ± 11.6 | 0.078 |
| Waist circumference, cm | 93.8 ± 8.1 [2] | 110.4 ± 12.1 [1] | NA | 0.007 |
| Body surface area, m2 | 1.87 ± 0.18 | 2.05 ± 0.18 | 2.03 ± 0.14 | 0.058 |
| Body mass index, kg/m2 | 26.3 ± 3.7 | 29.8 ± 4.5 | 28.5 ± 2.9 | 0.150 |
| Mean gradient, mmHg | 46.9 ± 23.1 | 40.4 ± 16.5 [1] | NA | 0.495 |
| Aortic valve area, cm2 | 0.66 ± 0.16 | 0.76 ± 0.17 | NA | 0.168 |
| Indexed aortic valve area, cm2/m2 | 0.35 ± 0.06 | 0.37 ± 0.08 | NA | 0.450 |
| Left ventricular hypertrophy, % | 70 | 22 | 0 | 0.005† |
| Mild aortic valve regurgitation, % | 80 | 78 | 20 [5] | 0.061 |
| Coronary artery disease, % | 50 [6] | 50 | 25 [4] | 0.820 |
| Dyslipidemia/hypercholesterolemia, % | 70 | 100 | 75 | 0.221 |
| Hypertension, % | 50 | 78 | 37.5 | 0.241 |
Continuous variables are expressed as means ± SD. Dichotomous variables are expressed as percentage. Only male patients were included in the study. Missing data are shown inside brackets. NA, not available.
Statistically significant difference between tricuspid aortic stenosis (AS) and normal valves.
Statistically significant difference between bicuspid AS and normal valves.
Tissue description and RNA extraction.
Valves leaflets were stored at 4°C in RNAlater solution (QIAGEN) after surgery. Leaflets were then crushed, snap-frozen in liquid nitrogen, and stored in a local biobank at −80°C until RNA isolation. RNA extraction was performed on 45–100 mg and 82–192 mg of tissue from one leaflet of normal and calcified valves, respectively, under a modified TRIzol protocol (18) followed by a purification step on QIAGEN RNeasy columns (QIAGEN). The RNA integrity score ranged from 7.0 to 9.2 and was obtained with the Agilent Bioanalyzer (Agilent technologies).
RNA-Seq.
Polyadenylated (coding pre- and mature) RNAs were selected using oligodT beads (Dynabeads mRNA DIRECT kit, Invitrogen) to isolate the mRNA from the rRNA and tRNA. mRNA was fragmented into small pieces using divalent cations under elevated temperature. cDNA synthesis was carried out using the SuperScript III cDNA synthesis kit (Invitrogen) which contains random hexamers. cDNA ends were repaired using the End-It DNA End-Repair kit (Epicentre Biotechnologies). dATPs were added to the end of cDNAs using Roche dATP and Klenow DNA polymerase [Klenow Fragment (3′ to 5′ exo-), New England Biolabs]. Adapters were ligated to the cDNA to prepare hybridization to a single read flow cell (Quick Ligation kit, New England BioLabs). cDNA fragments of 150–300 bases were selected using a Pippin Prep (Sage Science) followed by manual gel extraction and purification using QIAGEN PCR columns. Phusion High-Fidelity DNA Polymerase (New England Biolabs) was used to amplify the cDNA library. Size, purity, and concentration of the libraries were verified using the Agilent TapeStation. One calcified tricuspid valve sample failed library preparation and was discarded. cDNA libraries were clustered using the Illumina cBOT automated clonal cluster generator and occurred within Illumina flow cells. We performed 50 bp length paired-end sequencing starting with 2 μg of cDNA on the Illumina HiSeq 2000 sequencing system. Sequencing runs were set up based on the HiSeq 2000 user guide using Illumina TruSeq reagents.
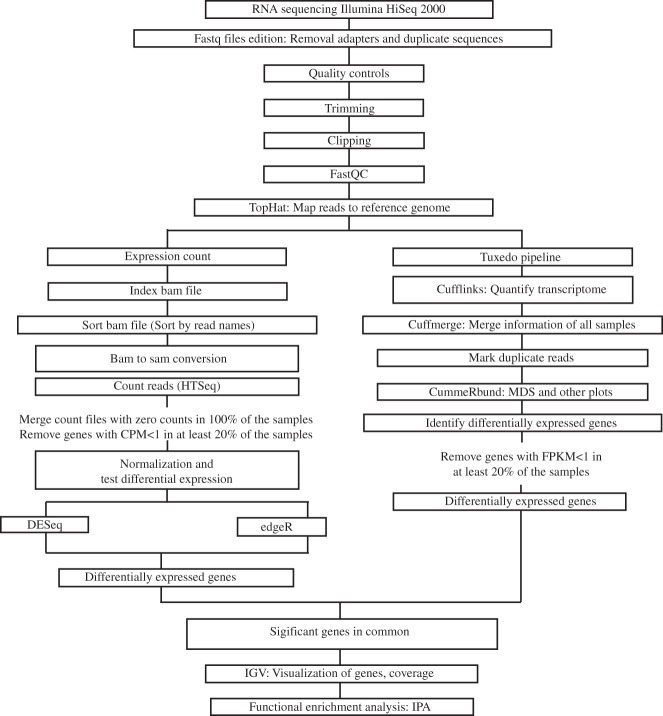
Figure 1 summarizes the analysis pipeline. The quality of the fastq data was verified using FastQC version 0.11.2 (http://www.bioinformatics.babraham.ac.uk/projects/fastqc). TopHat (35) was used to align reads of each sample to the UCSC hg19 reference using these parameters: -r150 -mate-std-dev 100. Cufflinks was used to assemble reads and estimate their abundances. Transcriptomes were quantified and gene expression levels were compared between the three groups of valves with Cuffdiff (35). Genes with fragments per kilobase of transcript per million mapped reads < 1 in more than 20% of the samples were excluded. In addition, HTSeq (4) was used to count reads aligned by TopHat. Genes with counts per million < 1 in more than 20% of the samples were excluded. Three other software programs were used to examine differential expression of count data between groups of valves: DESeq (3) version 1.16.0, edgeR (31) version 3.6.8, and SAMSeq (19) version 4.01. The function nbinomTest in DESeq and exactTest in edgeR were applied. Multidimensional scaling (MDS) plots generated with cummeRbund and edgeR identified two outliers in the normal valve group, which were excluded from further analysis. Genes with adjusted P < 0.05 according to the four software programs were considered as differentially expressed. The RNA-Seq data have been deposited in National Center for Biotechnology Information's Gene Expression Omnibus (GEO) (12) (accession number GSE76718).
Fig. 1.
Summary of the RNA sequencing pipeline. CMP, counts per million; FPKM, fragments per kilobase of transcript per million mapped reads; MDS, multidimensional scaling; IGV, Integrative Genomics Viewer; IPA, Ingenuity Pathway Analysis.
Technical validation of genes differentially expressed.
Considering the large number of genes differentially expressed between groups of valves, we have decided to provide technical validation by whole-genome gene expression analysis. In brief, the same samples used in the RNA-Seq experiment were evaluated using the HumanHT-12 v4 Expression BeadChip. Only samples that passed quality control (QC) in the RNA-Seq experiment were considered, including 10 BAVc, nine TAVc, and eight TAVn. The complete dataset was deposited in GEO with accession number GSE83453. QC was performed as described (8a). The raw data were quantile normalized after log2-transformation with the lumi package in R (10). Genes differentially expressed by microarray were identified and then overlapped with those found by RNA-Seq. All probes on the BeadChip were considered for this approach. Genes differentially expressed by microarray were identified using the significant analysis of microarrays (SAM) method (36) with the false discovery rate set at 5% and fold change threshold set at 1.2.
Mapping of genes to biological pathways.
QIAGEN'S Ingenuity Pathway Analysis (IPA) was used to integrate differentially expressed genes in biological processes as described before (16). Pathways with Benjamini and Hochberg corrected P values lower than 0.05 were called significant. For each comparison, BAVc vs. TAVn and TAVc vs. TAVn, a list of significant genes not shared between the comparisons was uploaded to ToppFun (https://toppgene.cchmc.org/enrichment.jsp) to perform gene set enrichment analysis and identify unique biological processes and molecular functions related to the nonshared genes between comparisons.
RESULTS
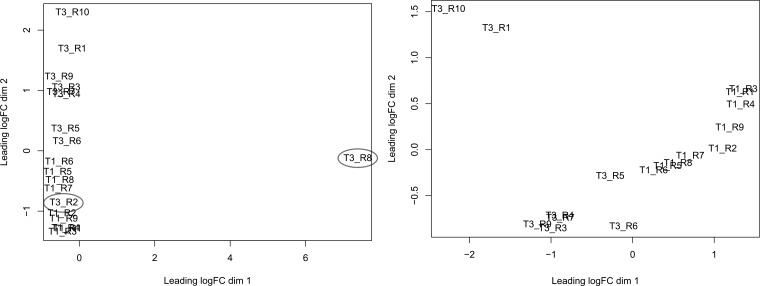
Figure 2 presents the MDS plot for the comparison between TAVc and TAVn. One TAVn sample was outside the two main clusters for calcified and normal valves. One TAVn sample clustered within the TAVc group. These two TAVn samples were discarded.
Fig. 2.
Multidimensional scaling (MDS) plot of calcified tricuspid aortic valves (TAVc) (T1) vs. normal tricuspid aortic valves (TAVn) (T3). Distances on the plot represent coefficient of variation in mRNA expression levels between samples for the top 500 genes that best distinguish the samples. Left: highlights outliers circled in gray. Right: the MDS plot after excluding the outliers. FC, fold change.
Differential expression and pathway analysis.
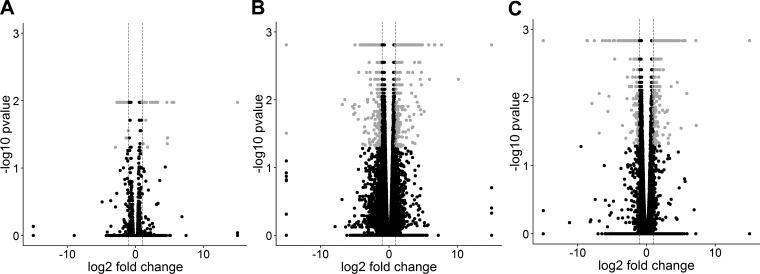
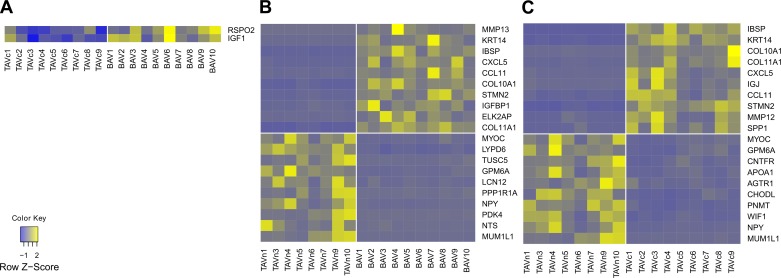
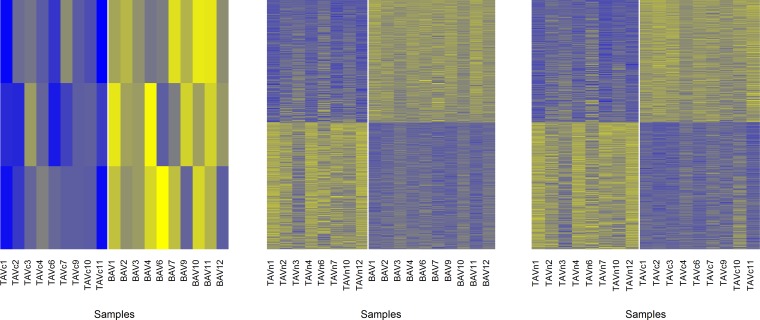
Four tools, Cuffdiff, DESeq, edgeR, and SAMSeq, were used to identify differentially expressed genes in three pairwise comparisons between BAVc, TAVc, and TAVn. The number of transcripts available for differential expression analysis after quality controls is shown in Table 2. The number of differentially expressed genes in common for the four tools is shown in Table 3 and Fig. 3. The number of differentially expressed genes per bioinformatics tool is shown in Table 4. Volcano plots based on the results of Cuffdiff are shown in Fig. 4. Three heat maps showing the top up- and downregulated genes per comparison are shown in Fig. 5.
Table 2.
Number of transcripts available for differential expression analysis
| BAVc vs. TAVc | BAVc vs. TAVn | TAVc vs. TAVn | |
|---|---|---|---|
| edgeR, DESeq, and SAMSeq | 19,973 | 19,998 | 19,969 |
| Cuffdiff | 16,956 | 24,750 | 13,306 |
BAVc, calcified bicuspid aortic valve; TAVc, calcified tricuspid aortic valve; TAVn, noncalcified tricuspid aortic valve. The results of edgeR, DESeq, and SAMSeq are based on counts obtained from HTSeq.
Table 3.
The number of differentially expressed genes in common between Cuffdiff, DESeq, edgeR, and SAMSeq
| Upregulated Genes, n | Upregulated Genes with Absolute FC >2, n | Downregulated Genes, n | Downregulated Genes with Absolute FC >2, n | |
|---|---|---|---|---|
| BAVc vs. TAVc | 2* | 0 | 0 | 0 |
| BAVc vs. TAVn | 462 | 324 | 282 | 192 |
| TAVc vs. TAVn | 329 | 245 | 170 | 121 |
FC, fold change.
Based on Cuffdiff and SAMSeq only.
Fig. 3.
Venn diagrams showing the number of genes differentially expressed in common among the 4 bioinformatics tools utilized for differential expression analysis (Cuffdiff, DESEq, edgeR, and SAMSeq). A: calcified bicuspid aortic valves (BAVc) vs. TAVc, B: BAVc vs. TAVn, C: TAVc vs. TAVn.
Table 4.
The number of differentially expressed genes per bioinformatics tool
| Tool | BAVc vs. TAVc Unique Genes, n |
BAVc vs. TAVn Unique Genes, n |
TAVc vs. TAVn Unique Genes, n |
|---|---|---|---|
| DESeq | 0 | 1,279 | 777 |
| Cuffdiff | 105 | 1,799 | 1,242 |
| edgeR | 0 | 2,861 | 2,053 |
| SAMSeq | 6 | 2,330 | 1,767 |
| Unique genes, n | 109 | 3,780 | 2,669 |
Fig. 4.
Volcano plots of the 3 pairwise comparisons based on the results of Cuffdiff. A: BAVc vs. TAVc, B: BAVc vs. TAVn, and C: TAVc vs. TAVn. The x-axis is the log2 fold change between groups. The −log10(P value) is plotted on the y-axis. Each point represents a gene. Only genes that passed quality controls were plotted. Vertical dashed lines at −log2 fold changes of −1 and 1 are plotted. Gray points indicate significant genes with q values (P corrected for multiple testing) < 0.05 and absolute fold change > 2.
Fig. 5.
Heat maps presenting the gene expression of the top 10 annotated up- and downregulated genes for each pairwise comparison. Yellow and blue indicate a high and low level of expression, respectively. The vertical white line separates the valve groups.
BAVc compared with TAVc.
Two genes were upregulated and none were downregulated in BAVc compared with TAVc. The upregulated genes are IGF1 [insulin-like growth factor 1 (somatomedin C)] and RSPO2 (R-spondin 2) with fold changes of 1.64 (q value = 0.11) and 2.03 (q value = 0.011), respectively (Table 5, Fig. 5A).
Table 5.
Top up- and downregulated genes in the three pairwise comparisons
| Symbol | Gene Name | Mean FPKM | Mean FPKM | FC | q-value |
|---|---|---|---|---|---|
| BAVc vs. TAVc | BAVc | TAVc | |||
| IGF1 | insulin-like growth factor 1 (somatomedin C) | 65.48 | 40.03 | 1.64 | 0.011 |
| RSPO2 | R-spondin 2 | 4.51 | 2.23 | 2.03 | 0.011 |
| BAVc vs. TAVn | BAVc | TAVn | |||
| MMP13 | matrix metallopeptidase 13 (collagenase 3) | 2.44 | 0.00 | INF | 0.002 |
| KRT14 | keratin 14 | 11.52 | 0.11 | 105.08 | 0.002 |
| IBSP | integrin-binding sialoprotein | 24.45 | 0.25 | 99.67 | 0.002 |
| CXCL5 | chemokine (C-X-C motif) ligand 5 | 8.12 | 0.28 | 29.48 | 0.002 |
| CCL11 | chemokine (C-C motif) ligand 11 | 5.04 | 0.19 | 26.68 | 0.006 |
| COL10A1 | collagen, type X, alpha 1 | 4.15 | 0.16 | 26.11 | 0.016 |
| STMN2 | stathmin-like 2 | 18.35 | 0.73 | 25.21 | 0.002 |
| IGFBP1 | insulin-like growth factor binding protein 1 | 2.11 | 0.10 | 22.04 | 0.002 |
| ELK2AP | ELK2A, member of ETS oncogene family, pseudogene | 609.28 | 27.79 | 21.92 | 0.002 |
| COL11A1 | collagen, type XI, alpha 1 | 4.10 | 0.21 | 19.25 | 0.002 |
| MYOC | myocilin, trabecular meshwork inducible glucocorticoid response | 10.17 | 96.52 | −9.49 | 0.002 |
| LYPD6 | LY6/PLAUR domain containing 6 | 0.09 | 0.88 | −9.70 | 0.004 |
| TUSC5 | tumor suppressor candidate 5 | 0.20 | 2.03 | −10.18 | 0.002 |
| GPM6A | glycoprotein M6A | 0.37 | 3.79 | −10.38 | 0.002 |
| LCN12 | lipocalin 12 | 0.23 | 2.47 | −10.66 | 0.002 |
| PPP1R1A | protein phosphatase 1, regulatory (inhibitor) subunit 1A | 0.24 | 2.96 | −12.44 | 0.002 |
| NPY | neuropeptide Y | 0.31 | 5.48 | −17.56 | 0.002 |
| PDK4 | pyruvate dehydrogenase kinase, isozyme 4 | 6.74 | 124.09 | −18.40 | 0.002 |
| NTS | neurotensin | 0.32 | 6.76 | −21.28 | 0.004 |
| MUM1L1 | melanoma associated antigen (mutated) 1-like 1 | 0.25 | 7.66 | −31.18 | 0.002 |
| TAVc vs. TAVn | TAVc | TAVn | |||
| IBSP | integrin-binding sialoprotein | 37.26 | 0.26 | 145.49 | 0.001 |
| KRT14 | keratin 14 | 4.47 | 0.12 | 38.34 | 0.001 |
| COL10A1 | collagen, type X, alpha 1 | 5.66 | 0.17 | 32.85 | 0.028 |
| COL11A1 | collagen, type XI, alpha 1 | 6.17 | 0.22 | 28.17 | 0.001 |
| CXCL5 | chemokine (C-X-C motif) ligand 5 | 7.10 | 0.28 | 25.16 | 0.001 |
| IGJ | immunoglobulin J polypeptide, linker protein for immunoglobulin α and μ polypeptides | 112.36 | 4.92 | 22.83 | 0.001 |
| CCL11 | chemokine (C-C motif) ligand 11 | 4.39 | 0.20 | 22.41 | 0.006 |
| STMN2 | stathmin-like 2 | 14.55 | 0.72 | 20.25 | 0.001 |
| MMP12 | matrix metallopeptidase 12 (macrophage elastase) | 8.81 | 0.54 | 16.38 | 0.001 |
| SPP1 | secreted phosphoprotein 1 | 1772.64 | 115.18 | 15.39 | 0.001 |
| MYOC | myocilin, trabecular meshwork inducible glucocorticoid response | 18.66 | 99.26 | −5.32 | 0.001 |
| GPM6A | glycoprotein M6A | 0.72 | 3.88 | −5.39 | 0.001 |
| CNTFR | ciliary neurotrophic factor receptor | 2.30 | 14.11 | −6.14 | 0.001 |
| APOA1 | apolipoprotein A-I | 2.11 | 13.87 | −6.58 | 0.001 |
| AGTR1 | angiotensin II receptor, type 1 | 0.15 | 1.04 | −6.86 | 0.005 |
| CHODL | chondrolectin | 0.27 | 2.00 | −7.36 | 0.001 |
| PNMT | phenylethanolamine N-methyltransferase | 0.28 | 2.84 | −10.20 | 0.001 |
| WIF1 | WNT inhibitory factor 1 | 0.83 | 9.07 | −10.98 | 0.001 |
| NPY | neuropeptide Y | 0.22 | 5.45 | −24.62 | 0.003 |
| MUM1L1 | melanoma associated antigen (mutated) 1-like 1 | 0.30 | 8.45 | −28.33 | 0.001 |
FC, fold change; FPKM, fragments per kilobase of transcript per million mapped reads.
BAVc compared with TAVn.
In BAVc, 462 genes were upregulated and 282 were downregulated compared with TAVn (Supplementary Table S1); 516 genes had fold changes higher than 2.0 (Table 3).1 The smallest absolute fold change was 1.45. The top upregulated genes (q value ≤ 0.006) included MMP13 [matrix metallopeptidase 13 (collagenase 3)], KRT14 (keratin 14), IBSP (integrin-binding sialoprotein), and the chemokines CXCL5 [chemokine (C-X-C motif) ligand 5] and CCL11 [chemokine (C-C motif) ligand 11]. The top downregulated genes (q value ≤ 0.004) included MUM1L1 [melanoma associated antigen (mutated) 1-like 1], NTS (Neurotensin), PDK4 (pyruvate dehydrogenase kinase, isozyme 4), NPY (neuropeptide Y), and PPP1R1A [protein phosphatase 1, regulatory (inhibitor) subunit 1A] (Table 5, Fig. 5B). Among these up- and downregulated genes, 50 (6.7%) are transcription regulators including RUNX2 (runt-related transcription factor 2) and VDR [vitamin D (1,25-dihydroxyvitamin D3) receptor], 49 (6.6%) are transmembrane receptors, 31 (4.2%) are kinases such as JAK3 (Janus kinase 3), and 13 (1.7%) are cytokines and matricellular proteins such as SPP1 (secreted phosphoprotein 1, osteopontin) (Table 6).
Table 6.
Classification of differentially expressed genes in each pairwise comparison
| Type | BAVc vs. TAVc | BAVc vs. TAVn | TAVc vs. TAVn |
|---|---|---|---|
| Other | 1 (50%) | 387 (52.0%) | 256 (51.3%) |
| Enzyme | 0 | 88 (11.8%) | 54 (10.8%) |
| Transmembrane receptor | 0 | 49 (6.6%) | 34 (6.8%) |
| Transcription regulator | 0 | 50 (6.7%) | 32 (6.4%) |
| Transporter | 0 | 37 (5.0%) | 25 (5.0%) |
| Peptidase | 0 | 32 (4.3%) | 23 (4.6%) |
| GPCR | 0 | 24 (3.2%) | 17 (3.4%) |
| Kinase | 0 | 31 (4.2%) | 17 (3.4%) |
| Ion channel | 0 | 11 (1.5%) | 14 (2.8%) |
| Cytokine | 0 | 13 (1.7%) | 9 (1.8%) |
| Growth factor | 1 (50%) | 10 (1.3%) | 7 (1.4%) |
| Phosphatase | 0 | 7 (0.9%) | 7 (1.4%) |
| Ligand-dependent nuclear receptor | 0 | 3 (0.4%) | 3 (0.6%) |
| MicroRNA | 0 | 1 (0.1%) | 1 (0.2%) |
| Translation regulator | 0 | 1 (0.1%) | 0 (0.0%) |
| Total molecules | 2 | 499 | 744 |
Type is based on IPA classification.
Thirty-one canonical pathways were significantly enriched in genes differentially expressed between BAVc vs. TAVn. Pathways contained 4–37 differentially expressed genes. Table 7 presents the top 10 enriched pathways for this comparison. There is an overrepresentation of immune-related pathways indicative of the extensive inflammatory processes taking place in calcified valves. Enriched pathways are also consistent with ongoing fibrosis and calcification processes. Other AS relevant pathways not in the top 10 are inhibition of matrix metalloproteases (P = 0.034) and cAMP-mediated signaling (P = 0.032) pathways.
Table 7.
Top 10 pathways enriched for differentially expressed genes in BAVc compared with TAVn
| Ingenuity Canonical Pathways | Significant Molecules in Pathway, % | P BAVc vs. TAVn (significant molecules, n) |
|---|---|---|
| Hepatic fibrosis/hepatic stellate cell activation | 18.78 | 1.58E-14 (37) |
| iCOS-iCOSL signaling in T helper cells | 14.81 | 2.29E-04 (16) |
| Type I diabetes mellitus signaling | 13.64 | 9.33E-04 (15) |
| Role of NFAT in regulation of the immune response | 11.11 | 9.55E-04 (19) |
| CD28 signaling in T helper cells | 12.71 | 1.12E-03 (15) |
| PKCθ signaling in T lymphocytes | 12.71 | 1.12E-03 (15) |
| Calcium-induced T lymphocyte apoptosis | 15.63 | 4.27E-03 (10) |
| T cell receptor signaling | 12.37 | 7.59E-03 (12) |
| Role of osteoblasts, osteoclasts and chondrocytes in rheumatoid arthritis | 8.68 | 1.15E-02 (19) |
| OX40 signaling pathway | 12.36 | 1.15E-02 (11) |
P, Benjamini-Hochberg multiple testing correction P value.
TAVc compared with TAVn.
A total of 329 and 170 genes were up- and downregulated in TAVc compared with TAVn, respectively (Supplementary Table S2). We found 366 genes with absolute fold changes higher than 2.0 (Table 3). The minimum absolute fold change was 1.53. The top upregulated genes (q value < 0.028) included IBSP, KRT14, COL10A1 (collagen, type X, alpha 1), COL11A1 (collagen, type XI, alpha 1), and CXCL5. The top downregulated gene (q value < 0.005) was MUM1L1. Other top downregulated genes were NPY, WIF1 (WNT inhibitory factor 1), PNMT (phenylethanolamine N-methyltransferase), CHODL (chondrolectin), AGTR1 (angiotensin II receptor, type 1), and APOA1 (apolipoprotein A-I) (Table 5, Fig. 5C). Among differentially expressed genes, 32 (6.4%) are transcription regulators including RUNX2 and VDR, 34 (6.8%) are transmembrane receptors, 17 (3.4%) are kinases such as JAK3, 14 (2.8%) are ion channels such as CACNA1C (calcium channel, voltage-dependent, L type, alpha 1C subunit), and 9 (1.8%) are cytokines and matricellular proteins such as SPP1 (secreted phosphoprotein 1, osteopontin) (Table 6).
For the comparison of TAVc and TAVn, 28 canonical pathways were significantly enriched. The top 10 pathways are presented in Table 8. The significant pathways contained 3–27 differentially expressed genes. Immune-related, inflammation, fibrosis, and calcification are the dominant biological processes most significant with the differentially expressed genes.
Table 8.
Top 10 pathways enriched for differentially expressed genes in TAVc compared with TAVn
| Ingenuity Canonical Pathways | Significant Molecules in Pathway, % | P TAVc-TAVn (significant molecules, n) |
|---|---|---|
| Hepatic fibrosis/hepatic stellate cell activation | 13.71 | 5.01E-11 (27) |
| iCOS-iCOSL signaling in T helper cells | 12.04 | 2.75E-04 (13) |
| Role of NFAT in regulation of the immune response | 8.77 | 1.32E-03 (15) |
| Calcium-induced T lymphocyte apoptosis | 14.06 | 1.32E-03 (9) |
| CD28 signaling in T helper cells | 10.17 | 1.32E-03 (12) |
| PKCθ signaling in T lymphocytes | 10.17 | 1.32E-03 (12) |
| Type I diabetes mellitus signaling | 10.00 | 2.88E-03 (11) |
| T cell receptor signaling | 10.31 | 4.27E-03 (10) |
| Glucocorticoid receptor signaling | 6.51 | 6.31E-03 (17) |
| Primary immunodeficiency signaling | 13.46 | 7.41E-03 (7) |
P, Benjamini-Hochberg multiple testing correction P value.
Technical validation of genes differentially expressed.
Gene expression arrays were used to provide technical validation of genes identified as significantly different in the RNA-Seq experiment. Genes differentially expressed by microarray data were identified and then compared with those identified by RNA-Seq. The magnitude of gene expression changes by microarray across the three comparisons is illustrated in Fig. 6. Heat maps of probes up- and downregulated in the three pairwise comparisons are also provided in Fig. 7. A total of three genes were upregulated in BAVc compared with TAVc including RSPO2 (fold change = 1.37) overlapping with the RNA-Seq results. For BAVc compared with TAVn, 321 out of 462 upregulated genes and 175 out of 282 downregulated genes identified by RNA-Seq were also found by microarray. Excluding RNA-Seq genes not interrogated on the microarray, 73.0% of upregulated genes and 66.8% of downregulated genes by RNA-Seq were also detected as differentially expressed by microarray. Details are provided in Table 9. Genes validated by microarray are indicated in Supplementary Table S1. For TAVc compared with TAVn, 214 out of 329 upregulated genes and 115 out of 170 downregulated genes identified by RNA-Seq were also found by microarray. This corresponds to 68.6 and 72.8% of up- and downregulated genes validated by microarray, respectively (Table 9). Genes validated by microarray are indicated in Supplementary Table S2.
Fig. 6.
MvA plots of gene expression levels between the 3 comparisons of human aortic valves by microarray. Each dot represents a probe. The y-axis represents fold change on a log2 scale. Up- and downregulated probes in the calcified valves are in black. Horizontal dashed lines represent absolute fold changes of 1.2, 1.5, and 2. The numbers of probes/genes significantly up- and downregulated are shown in the top right and bottom right corners of each panel.
Fig. 7.
Heat maps showing microarray probes significantly up- and downregulated in the 3 pairwise comparisons. The samples and probes are illustrated in columns and rows, respectively. Yellow indicates a high level of expression. Blue indicates a low level of expression. Left: the comparison BAVc vs. TAVc and includes 3 probes. Middle: BAVc vs TAVn and includes 1,902 up- and 1,970 downregulated probes. Right: TAVc vs TAVn and includes 1,355 up- and 1,405 downregulated probes. The vertical white lines separate the groups of valves. TAVc, calcified tricuspid aortic valve; BAVc, calcified bicuspid aortic valves; TAVn, normal tricuspid aortic valves.
Table 9.
Number and overlap of differentially expressed genes according to RNA-Seq and microarray
| RNA-Seq | Microarray | Overlap* | Overlap, % | |
|---|---|---|---|---|
| Upregulated genes | ||||
| BAVc vs. TAVc | 2 | 3 | 1 (0)/1/2 | 1/2 = 50% |
| BAVc vs. TAVn | 462 | 1,662 (1,902 probes) | 141 (22)/321/1,341 | 321/(462–22) = 73.0% |
| TAVc vs. TAVn | 329 | 1,186 (1,355 probes) | 115 (17)/214/972 | 214/(329–17) = 68.6% |
| Downregulated genes | ||||
| BAVc vs. TAVc | 0 | 0 | NA | NA |
| BAVc vs. TAVn | 282 | 1,666 (1,970 probes) | 107 (20)/175/1,491 | 175/(282–20) = 66.8% |
| TAVc vs. TAVn | 170 | 1,191 (1,405 probes) | 55 (12)/115/1,076 | 115/(170–12) = 72.8% |
RNA-Seq numbers are from Table 3.
Number of genes unique to RNA-Seq (number of genes not interrogated on the microarray)/number of genes that overlap/number of genes unique to microarray.
Shared and unique pathways.
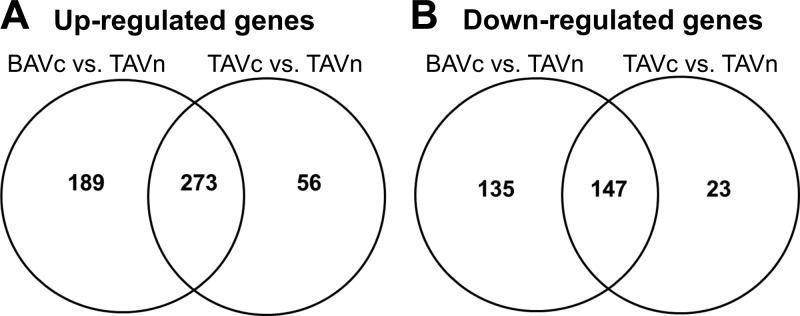
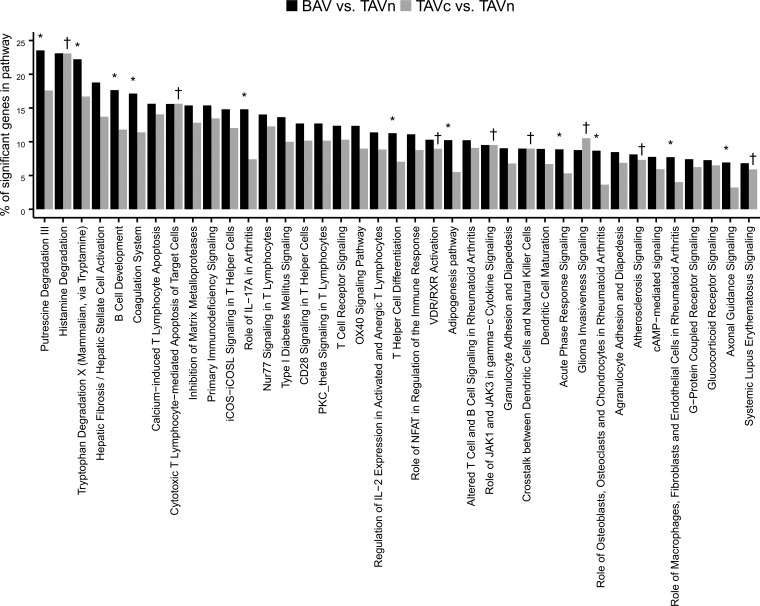
Figure 8 shows the overlap of genes upregulated and downregulated in BAVc vs. TAVn and TAVc vs. TAVn by RNA-Seq. A total of 273 upregulated genes and 147 downregulated genes were in common between these two comparisons. This represents 56% (420/744) of all significant genes in the BAVc vs. TAVn comparison and 84% (420/499) of all significant genes in the TAVc vs. TAVn comparison, suggesting that most of the molecular processes leading to TAVc are also activated in BAVc. A higher number of genes in the comparison BAVc vs. TAVn is linked to additional pathways as well as shared pathways more extensively altered in BAVc (Fig. 9).
Fig. 8.
Venn diagrams showing the number of genes differentially expressed in common between BAVc vs. TAVn and TAVc vs. TAVn by RNA-Seq.
Fig. 9.
Percentage of significant genes in IPA canonical pathways enriched for differentially expressed genes in the comparisons BAVc vs. TAVn and TAVc vs. TAVn. *Significant in the comparison BAVc vs. TAVn. †Significant in the comparison TAVc vs. TAVn.
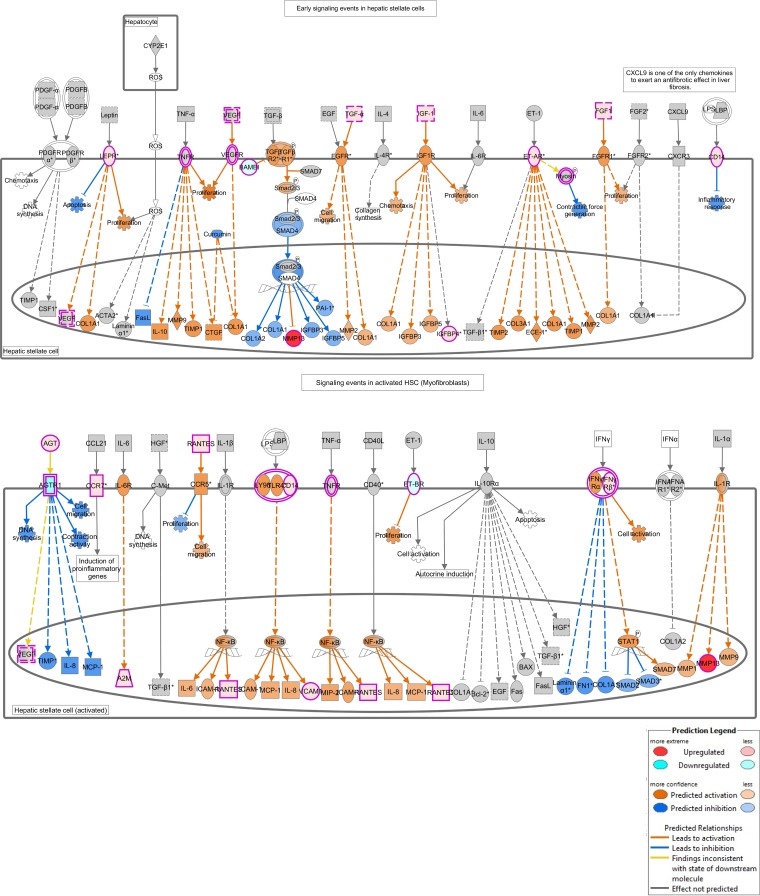
For significant pathways in the TAVc vs. TAVn comparison, 20 out of 28, including the top five, were in common with the BAVc vs. TAVn comparison. The top pathway in both comparisons was the hepatic fibrosis/hepatic stellate cell activation (Fig. 10). Canonical pathways enriched only in the TAVc vs. TAVn comparison included atherosclerosis signaling (P = 0.035), VDR/RXR activation (P = 0.035), and the role of JAK1 and JAK3 in γc cytokine signaling (P = 0.047) pathways. For significant pathways in the BAVc vs. TAVn comparison, 20 out of 31 were in common with the TAVc vs. TAVn comparison. Pathways enriched only in the BAVc vs. TAVn comparison included the adipogenesis, coagulation system, IL-17A pathway, role of osteoblasts, osteoclasts and chondrocytes in rheumatoid arthritis, and role of macrophages, fibroblasts and endothelial cells in rheumatoid arthritis pathways.
Fig. 10.
Hepatic fibrosis/hepatic stellate cell activation canonical pathway. Hepatic fibrosis shares similarities with aortic stenosis (AS) such as increased collagen synthesis, apoptosis, inflammation, and cell proliferation. Differentially expressed genes and other genes that are regulated by them as predicted by the Molecule Activity Predictor (MAP) are indicated. See key for explanation of the colors.
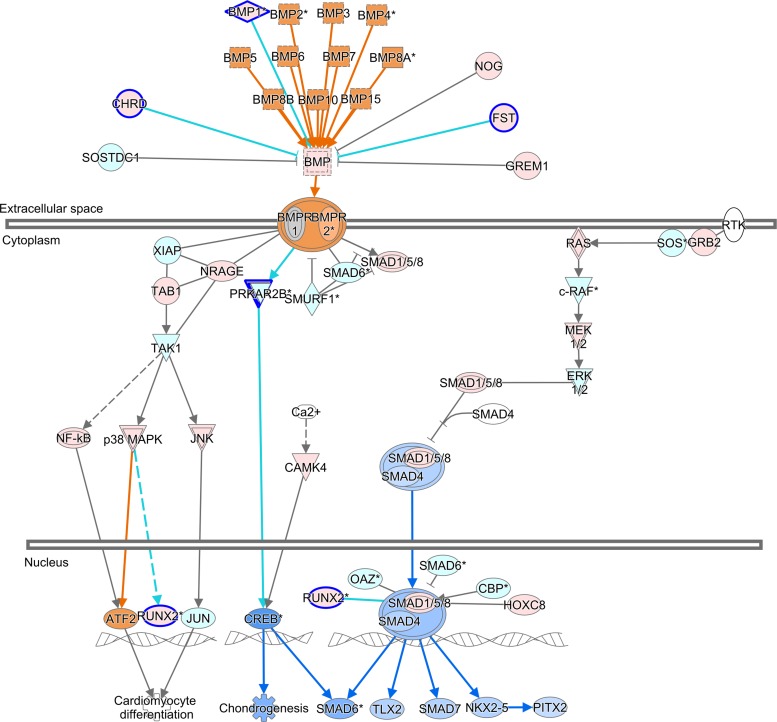
ToppFun was used to identify biological processes and molecular functions enriched with the differentially expressed genes specific to each pairwise comparison. The regulation of BMP signaling pathway and Wnt-activated receptor activity functions were enriched only in BAVc vs. TAVn. Figure 11 shows the BMP signaling pathway for the latter comparison. The calcium ion transmembrane transporter activity molecular function was significantly enriched only in TAVc vs. TAVn. Inflammatory response, angiogenesis, leukocyte and cell chemotaxis, and cell migration were biological processes common to both comparisons.
Fig. 11.
BMP signaling pathway overlapped with the results of the comparison BAVc vs. TAVn. The upstream and downstream effects were predicted with the tool Molecule Activity Predictor (MAP) in IPA. Orange, predicted activation; blue, predicted inhibition. Genes with a blue border were significantly differentially expressed (FC ≥ 2.0 and q value < 0.05). Red, upregulated gene; green, downregulated gene.
DISCUSSION
This study compares the gene expression profiles assessed by RNA-Seq of BAVc and TAVc valves with structurally normal and nonstenotic aortic valves (TAVn) from a homogenous surgical cohort of patients. Only two genes were differentially expressed in BAVc compared with TAVc: the growth factor IGF1 and RSPO2. RSPO2 encodes a protein that regulates the Wnt/beta-catenin signaling known to promote osteoblast transition and BMP2-dependent mineralization (1). More conclusively, these results demonstrate that the gene expression profile of end-stage BAVc and TAVc are highly similar. Much more differences in the number and magnitude of gene expression were found between calcified (BAVc and TAVc) and normal (TAVn) aortic valves. A total of 273 upregulated and 147 downregulated genes were concordantly regulated between BAVc vs. TAVn and TAVc vs. TAVn. Pathways enriched for differentially expressed genes were also highly concordant between these two combinations, suggesting that to some extent, there is a similar gene expression response to calcific aortic stenosis in individuals with bicuspid and tricuspid valves.
We found 420 out of 499 (84%) differentially expressed genes in the TAVc vs. TAVn comparison in common with the BAVc vs. TAVn comparison. Accordingly, degenerative calcification of BAV and TAV with the same score of fibrocalcific remodeling presents a highly similar transcriptome independent of the valve configuration. Additional unique genes and significant pathways were identified in the BAVc vs. TAVn comparison. There were 420 out of 744 (56%) differentially expressed genes in the BAVc vs. TAVn comparison common to the TAVc vs. TAVn comparison. From 39 significant pathways in at least one comparison, 20 were shared between the two comparisons, 11 were specific to BAVc vs. TAVn, and eight were specific to TAVc vs. TAVn (Fig. 9). Shared pathways had between one to six more genes significantly altered in BAVc vs. TAVn compared with TAVc vs. TAVn, suggesting that these pathways are more extensively altered in BAVc compared with TAVc. Shared and unique pathways and genes between BAVc vs. TAVn and TAVc vs. TAVn are relevant to understand the molecular basis of AS in bicuspid and tricuspid aortic valves.
Shared mechanisms leading to degenerative calcification of BAV and TAV have been reported by Padang et al. 2015 (28). In this study, RNA-Seq was performed to compare global gene expression levels of BAV (n = 5) and calcified TAV (n = 3), which were not matched for the remodeling process. Differential expression was found for 59 up- and 177 downregulated genes. Based on gene expression heterogeneity observed within the BAV group, the analyses were further refined by dividing BAV in two subgroups: regurgitant BAV (n = 3) and BAVc (n = 2). Perhaps the best comparison with the current study is BAVc (n = 2) and TAVc (n = 3). In contrast with the two genes identified in the current study, Padang et al. have identified 193 genes differentially expressed between these two groups, which do not include IGF1 and RSPO2. However, the magnitude of change for these 193 genes was lower (41% of genes had less than twofold change) compared with the two other pairwise comparisons involving the regurgitant valves. In the current study, we have been particularly stringent to call a gene differentially expressed base d on four statistical algorithms. If we take genes that were differentially expressed in at least one algorithm (109 genes between BAVc and TAVc, see Table 4), we found 13 genes in common with the 193 genes reported by Padang et al. (Supplementary Table S3). The fold change is consistent for 10 of these genes.
Hepatic fibrosis was the top canonical pathway enriched for differentially expressed genes when calcified valves (BAVc or TAVc) were compared with TAVn (Fig. 10). This pathway shares several biological processes and molecules that have been implicated in AS. Fibrosis is characterized by endothelial dysfunction, inflammation, neovascularization, and accumulation of extracellular matrix (ECM) proteins that degrade collagen (33). We have previously demonstrated that AS is associated with key genes regulating ECM production and degradation (7). In this study, four MMPs namely MMP9, MMP11, MMP12, and MMP13 were found upregulated in calcified valves (BAVc and TAVc) compared with TAVn. A higher level of proteolytic activity does seem dominant in the pathogenesis AS.
This study has limitations. We studied patients with end-stage disease (BAVc and TAVc), and intermediate phenotypes were not available. It was not possible to assess time-related changes in gene expression leading to AS. Hence, we cannot rule out the possibility that early during the process, the gene expression pattern may diverge more significantly between TAVc and BAVc. Nonetheless, after careful matching for confounding variables such as the remodeling score, we found a significant overlap in the gene expression pattern in BAVc and TAVc. The mRNA levels of significant genes in this study were confirmed by microarray. Globally ∼70% genes found differentially expressed by RNA-Seq were validated by microarray. This represents a high rate of validation compared with previous cross-platform transcriptomic studies using RNA-Seq and microarray (20, 24). However, single gene analysis by qPCR in independent samples may further confirm genes identified in this study. Finally, the protein levels of significant genes were not measured.
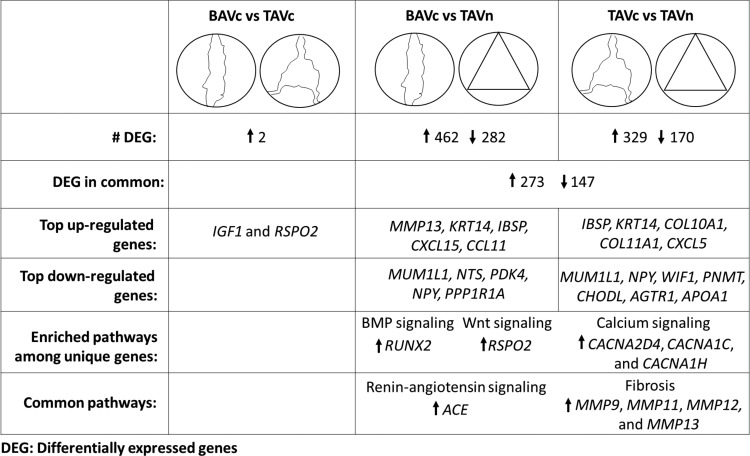
The main conclusions of this study are illustrated in Fig. 12. The expression profiles of BAVc and TAVc were highly similar. This demonstrated that genes and pathways leading to calcific AS are concordantly altered in BAV and TAV. This study also identifies gene expression differences between calcified (BAVc and TAVc) and normal tricuspid valves. Interestingly, additional unique genes were identified in the BAVc vs. TAVn comparison. In addition, compared with TAVn, BAVc presented a higher number of altered genes per enriched pathway than TAVc. These extra genes may shed light on the earlier development of AS observed in individuals with BAV. The fibrosis pathway was altered in both BAVc and TAVc compared with TAVn, which indicates a possible benefit of targeting this pathway in AS patients. Finally, these results contribute to our molecular understanding of AS development and the identification of new therapeutic agents to prevent, lessen the development, or treat AS in TAV and BAV patients.
Fig. 12.
Summary of the main results of this study. The expression profiles of BAVc and TAVc were highly similar. Additional unique genes were identified in BAVc vs. TAVn compared with TAVc vs. TAVn. Bicuspid aortic valve calcification may be mediated by BMP and Wnt signaling pathway genes. Calcium signaling pathway genes were upregulated specifically in TAVc vs. TAVn. The angiotensin and fibrosis pathways were altered in both BAVc and TAVc compared with TAVn.
GRANTS
This study was supported by the Canadian Institutes of Health Research grants MOP-102481 (Y. Bossé), MOP-79342 (P. Pibarot and P. Mathieu), and MOP-11489, MOP-245048, MOP-201503 (P. Mathieu). This study was also funded by grants from the Heart and Stroke Foundation of Canada and the Fondation de l'Institut universitaire de cardiologie et de pneumologie de Québec. S. Guauque-Olarte was a recipient of a studentship from the International Chair on Cardiometabolic Risk and a doctoral scholarship from the Centre de recherche Institut universitaire de cardiologie et de pneumologie de Québec. P. Pibarot holds the Canada Research Chair in Valvular Heart Diseases. P. Mathieu is a research scholar from the Fonds de recherche Québec - Santé (FRQS). Y. Bossé was the recipient of a Junior 2 Research Scholar from the FRQS and now holds a Canada Research Chair in Genomics of Heart and Lung Diseases.
DISCLOSURES
No conflicts of interest, financial or otherwise, are declared by the author(s).
AUTHOR CONTRIBUTIONS
S.G.-O., A.D., J.T.-M., and Y.B. analyzed data; S.G.-O., D.K., F.D., J.G.S., S.C.B., P.P., P.M., and Y.B. interpreted results of experiments; S.G.-O. and Y.B. prepared figures; S.G.-O. and Y.B. drafted manuscript; S.G.-O., A.D., J.T.-M., N.G., D.K., F.D., J.G.S., S.C.B., P.P., P.M., and Y.B. edited and revised manuscript; S.G.-O., A.D., J.T.-M., N.G., D.K., F.D., J.G.S., S.C.B., P.P., P.M., and Y.B. approved final version of manuscript; N.G. performed experiments; P.P., P.M., and Y.B. conception and design of research.
Supplemental Data
ACKNOWLEDGMENTS
The authors thank the research team at the biobank of the Institut universitaire de cardiologie et de pneumologie de Québec for valuable assistance.
Footnotes
The online version of this article contains supplemental material.
REFERENCES
- 1.Abed E, Chan TF, Delalandre A, Martel-Pelletier J, Pelletier JP, Lajeunesse D. R-spondins are newly recognized players in osteoarthritis that regulate Wnt signaling in osteoblasts. Arthritis Rheum : 3865–3875, 2011. [DOI] [PubMed] [Google Scholar]
- 2.Akat K, Borggrefe M, Kaden JJ. Aortic valve calcification: basic science to clinical practice. Heart : 616–623, 2009. [DOI] [PubMed] [Google Scholar]
- 3.Anders S, Huber W. Differential expression analysis for sequence count data. Genome Biol : R106, 2010. [DOI] [PMC free article] [PubMed] [Google Scholar]
- 4.Anders S, Pyl PT, Huber W. HTSeq-a Python framework to work with high-throughput sequencing data. Bioinformatics : 166–169, 2015. [DOI] [PMC free article] [PubMed] [Google Scholar]
- 5.Balachandran K, Sucosky P, Yoganathan AP. Hemodynamics and mechanobiology of aortic valve inflammation and calcification. Int J Inflam : 263870, 2011. [DOI] [PMC free article] [PubMed] [Google Scholar]
- 6.Baumgartner H, Hung J, Bermejo J, Chambers JB, Evangelista A, Griffin BP, Iung B, Otto CM, Pellikka PA, Quinones M. Echocardiographic assessment of valve stenosis: EAE/ASE recommendations for clinical practice. Eur J Echocardiogr : 1–25, 2009. [DOI] [PubMed] [Google Scholar]
- 7.Bosse Y, Miqdad A, Fournier D, Pepin A, Pibarot P, Mathieu P. Refining molecular pathways leading to calcific aortic valve stenosis by studying gene expression profile of normal and calcified stenotic human aortic valves. Circ Cardiovasc Genet : 489–498, 2009. [DOI] [PubMed] [Google Scholar]
- 8.Carabello BA, Paulus WJ. Aortic stenosis. Lancet : 956–966, 2009. [DOI] [PubMed] [Google Scholar]
- 8a.Chow ML, Winn ME, Li HR, April C, Wynshaw-Boris A, Fan JB, Fu XD, Courchesne E, Schork NJ. Preprocessing and quality control strategies for Illumina DASL assay-based brain gene expression studies with semi-degraded samples. Front Genet : 11, 2012. [DOI] [PMC free article] [PubMed] [Google Scholar]
- 9.Cote N, Mahmut A, Bosse Y, Couture C, Page S, Trahan S, Boulanger MC, Fournier D, Pibarot P, Mathieu P. Inflammation is associated with the remodeling of calcific aortic valve disease. Inflammation : 573–581, 2013. [DOI] [PubMed] [Google Scholar]
- 10.Du P, Kibbe WA, Lin SM. lumi: a pipeline for processing Illumina microarray. Bioinformatics : 1547–1548, 2008. [DOI] [PubMed] [Google Scholar]
- 11.Du X, Soon JL. Mild to moderate aortic stenosis and coronary bypass surgery. J Cardiol : 31–35, 2011. [DOI] [PubMed] [Google Scholar]
- 12.Edgar R, Domrachev M, Lash AE. Gene Expression Omnibus: NCBI gene expression and hybridization array data repository. Nucleic Acids Res : 207–210, 2002. [DOI] [PMC free article] [PubMed] [Google Scholar]
- 13.Foffa I, Ait Ali L, Panesi P, Mariani M, Festa P, Botto N, Vecoli C, Andreassi MG. Sequencing of NOTCH1, GATA5, TGFBR1 and TGFBR2 genes in familial cases of bicuspid aortic valve. BMC Med Genet : 44, 2013. [DOI] [PMC free article] [PubMed] [Google Scholar]
- 14.Freeman RV, Otto CM. Spectrum of calcific aortic valve disease: pathogenesis, disease progression, and treatment strategies. Circulation : 3316–3326, 2005. [DOI] [PubMed] [Google Scholar]
- 15.Garg V, Muth AN, Ransom JF, Schluterman MK, Barnes R, King IN, Grossfeld PD, Srivastava D. Mutations in NOTCH1 cause aortic valve disease. Nature : 270–274, 2005. [DOI] [PubMed] [Google Scholar]
- 16.Guauque-Olarte S, Gaudreault N, Piche ME, Fournier D, Mauriege P, Mathieu P, Bosse Y. The transcriptome of human epicardial, mediastinal and subcutaneous adipose tissues in men with coronary artery disease. PLoS One : e19908, 2011. [DOI] [PMC free article] [PubMed] [Google Scholar]
- 17.Hoffman JI, Kaplan S. The incidence of congenital heart disease. J Am Coll Cardiol : 1890–1900, 2002. [DOI] [PubMed] [Google Scholar]
- 18.Lee JTY, Tsang WH, Chow KL. Simple modifications to standard TRIzol® protocol allow high-yield RNA extraction from cells on resorbable materials. J Biomater Nanobiotechnol : 41–48, 2011. [Google Scholar]
- 19.Li J, Tibshirani R. Finding consistent patterns: a nonparametric approach for identifying differential expression in RNA-Seq data. Stat Meth Med Res : 519–536, 2013. [DOI] [PMC free article] [PubMed] [Google Scholar]
- 20.Marioni JC, Mason CE, Mane SM, Stephens M, Gilad Y. RNA-seq: an assessment of technical reproducibility and comparison with gene expression arrays. Genome Res : 1509–1517, 2008. [DOI] [PMC free article] [PubMed] [Google Scholar]
- 21.Mathieu P, Boulanger MC, Bouchareb R. Molecular biology of calcific aortic valve disease: towards new pharmacological therapies. Expert Rev Cardiovasc Ther : 851–862, 2014. [DOI] [PubMed] [Google Scholar]
- 22.Mohty D, Pibarot P, Despres JP, Cartier A, Arsenault B, Picard F, Mathieu P. Age-related differences in the pathogenesis of calcific aortic stenosis: the potential role of resistin. Int J Cardiol : 126–132, 2010. [DOI] [PubMed] [Google Scholar]
- 23.Mohty D, Pibarot P, Despres JP, Cote C, Arsenault B, Cartier A, Cosnay P, Couture C, Mathieu P. Association between plasma LDL particle size, valvular accumulation of oxidized LDL, and inflammation in patients with aortic stenosis. Arterioscler Thromb Vasc Biol : 187–193, 2008. [DOI] [PubMed] [Google Scholar]
- 24.Nookaew I, Papini M, Pornputtapong N, Scalcinati G, Fagerberg L, Uhlen M, Nielsen J. A comprehensive comparison of RNA-Seq-based transcriptome analysis from reads to differential gene expression and cross-comparison with microarrays: a case study in Saccharomyces cerevisiae. Nucleic Acids Res : 10084–10097, 2012. [DOI] [PMC free article] [PubMed] [Google Scholar]
- 25.Otto CM, Bonow RO. Valvular Heart Disease: A Companion to Braunwald's Heart Disease. Saunders Elsevier, 2009. [Google Scholar]
- 26.Otto CM, Burwash IG, Legget ME, Munt BI, Fujioka M, Healy NL, Kraft CD, Miyake-Hull CY, Schwaegler RG. Prospective study of asymptomatic valvular aortic stenosis. Clinical, echocardiographic, and exercise predictors of outcome. Circulation : 2262–2270, 1997. [DOI] [PubMed] [Google Scholar]
- 27.Otto CM, Kuusisto J, Reichenbach DD, Gown AM, O'Brien KD. Characterization of the early lesion of ‘degenerative’ valvular aortic stenosis. Histological and immunohistochemical studies. Circulation : 844–853, 1994. [DOI] [PubMed] [Google Scholar]
- 28.Padang R, Bagnall RD, Tsoutsman T, Bannon PG, Semsarian C. Comparative transcriptome profiling in human bicuspid aortic valve disease using RNA sequencing. Physiol Genomics : 75–87, 2015. [DOI] [PubMed] [Google Scholar]
- 29.Quinones MA, Otto CM, Stoddard M, Waggoner A, Zoghbi WA. Recommendations for quantification of Doppler echocardiography: a report from the Doppler Quantification Task Force of the Nomenclature and Standards Committee of the American Society of Echocardiography. J Am Soc Echocardiogr : 167–184, 2002. [DOI] [PubMed] [Google Scholar]
- 30.Roberts WC, Ko JM. Frequency by decades of unicuspid, bicuspid, and tricuspid aortic valves in adults having isolated aortic valve replacement for aortic stenosis, with or without associated aortic regurgitation. Circulation : 920–925, 2005. [DOI] [PubMed] [Google Scholar]
- 31.Robinson MD, McCarthy DJ, Smyth GK. edgeR: a Bioconductor package for differential expression analysis of digital gene expression data. Bioinformatics : 139–140, 2010. [DOI] [PMC free article] [PubMed] [Google Scholar]
- 32.Roger VL, Go AS, Lloyd-Jones DM, Adams RJ, Berry JD, Brown TM, Carnethon MR, Dai S, de Simone G, Ford ES, Fox CS, Fullerton HJ, Gillespie C, Greenlund KJ, Hailpern SM, Heit JA, Ho PM, Howard VJ, Kissela BM, Kittner SJ, Lackland DT, Lichtman JH, Lisabeth LD, Makuc DM, Marcus GM, Marelli A, Matchar DB, McDermott MM, Meigs JB, Moy CS, Mozaffarian D, Mussolino ME, Nichol G, Paynter NP, Rosamond WD, Sorlie PD, Stafford RS, Turan TN, Turner MB, Wong ND, Wylie-Rosett J. Heart disease and stroke statistics–2011 update: a report from the American Heart Association. Circulation : e18–e209, 2011. [DOI] [PMC free article] [PubMed] [Google Scholar]
- 33.Skeoch S, Bruce IN. Atherosclerosis in rheumatoid arthritis: is it all about inflammation? Nat Rev Rheumatol : 390–400, 2015. [DOI] [PubMed] [Google Scholar]
- 34.Torre M, Hwang DH, Padera RF, Mitchell RN, VanderLaan PA. Osseous and chondromatous metaplasia in calcific aortic valve stenosis. Cardiovasc Pathol : 18–24, 2016. [DOI] [PubMed] [Google Scholar]
- 35.Trapnell C, Roberts A, Goff L, Pertea G, Kim D, Kelley DR, Pimentel H, Salzberg SL, Rinn JL, Pachter L. Differential gene and transcript expression analysis of RNA-seq experiments with TopHat and Cufflinks. Nat Protoc : 562–578, 2012. [DOI] [PMC free article] [PubMed] [Google Scholar]
- 36.Tusher VG, Tibshirani R, Chu G. Significance analysis of microarrays applied to the ionizing radiation response. Proc Natl Acad Sci USA : 5116–5121, 2001. [DOI] [PMC free article] [PubMed] [Google Scholar]
- 37.Waller B, Howard J, Fess S. Pathology of aortic valve stenosis and pure aortic regurgitation. A clinical morphologic assessment–Part I. Clin Cardiol : 85–92, 1994. [DOI] [PubMed] [Google Scholar]
- 38.Warren BA, Yong JL. Calcification of the aortic valve: its progression and grading. Pathology : 360–368, 1997. [DOI] [PubMed] [Google Scholar]
Associated Data
This section collects any data citations, data availability statements, or supplementary materials included in this article.


