Abstract
Background
Sleep-disordered-breathing (SDB), which is characterized by chronic intermittent hypoxia (IH) and sleep fragmentation (SF), is a prevalent condition that promotes metabolic dysfunction, particularly among patients suffering from obstructive hypoventilation syndrome (OHS). Exosomes are generated ubiquitously, are readily present in the circulation, and their cargo may exert substantial functional cellular alterations in both physiological and pathological conditions. However, the effects of plasma exosomes on adipocyte metabolism in patients with OHS or in mice subjected to IH or SF mimicking SDB are unclear.
Methods
Exosomes from fasting morning plasma samples from obese adults with polysomnographically-confirmed OSA before and after 3 months of adherent CPAP therapy were assayed. In addition, C57BL/6 mice were randomly assigned to (1) sleep control (SC), (2) sleep fragmentation (SF), and (3) intermittent hypoxia (HI) for 6 weeks, and plasma exosomes were isolated. Equivalent exosome amounts were added to differentiated adipocytes in culture, after which insulin sensitivity was assessed using 0 nM and 5nM insulin-induced pAKT/AKT expression changes by western blotting.
Results
When plasma exosomes were co-cultured and internalized by human naïve adipocytes, significant reductions emerged in Akt phosphorylation responses to insulin when compared to exosomes obtained after 24 months of adherent CPAP treatment (n=24; p<0.001), while no such changes occur in untreated patients (n=8). In addition, OHS exosomes induced significant increases in adipocyte lipolysis that were attenuated after CPAP, but did not alter pre-adipocyte differentiation. Similarly, exosomes from SF- and IH-exposed mice induced attenuated p-AKT/total AKT responses to exogenous insulin and increased glycerol content in naïve murine adipocytes, without altering pre-adipocyte differentiation.
Conclusions
Using in vitro adipocyte-based functional reporter assays, alterations in plasma exosomal cargo occur in SDB, and appear to contribute to adipocyte metabolic dysfunction. Further exploration of exosomal miRNA signatures in either human subjects or animal models and their putative organ and cell targets appears warranted.
Keywords: Obesity hypoventilation syndrome, obstructive sleep apnea, intermittent hypoxia, sleep fragmentation, continuous positive airway pressure, extracellular vesicles, exosomes, adipocytes, insulin resistance
INTRODUCTION
Obesity is a major risk factor for the development of metabolic syndrome and insulin resistance, and is associated with an increased risk of disability and morbidity 1, 2. One of the consequences of morbid obesity is the obesity hypoventilation syndrome (OHS), which is characterized by a combination of obesity and chronic hypoventilation along with increased early mortality 3–5. It is estimated that 90% of patients with OHS also have obstructive sleep apnea (OSA) 6. The exact prevalence of OHS in the community is unclear, but is estimated to be approximately 0.15–0.6% of the general population 7, 8, 9–20% of referred obese patients, and up to 42% of referrals when BMI is >35 kg/m2 9–11. In addition, a paradoxical protective effect of OHS on cardiovascular function has been recently suggested 12, such that it is yet unclear how OHS and OSA in obese patients differ as far as their potential contributions to end-organ morbidity. Previous studies have also demonstrated that treatment with continuous positive airway pressure (CPAP) or noninvasive ventilation (NIV) in patients with OHS and OSA is beneficial, while supplemental oxygen alone does not appear to be of clinical value 13, 14.
Although metabolic dysfunction is now clearly associated with OSA, the impact of OHS on insulin resistance and dyslipidemia is still virtually unexplored 15, 16. Indeed, there have been few if any longitudinal studies evaluating the metabolic changes resulting from OHS treatment 17, and the exact molecular mechanisms of OHS-associated insulin resistance are unclear. Identification of biomarkers indicating which OHS patients are at greater metabolic risk would be extremely useful. In this setting, extracellular vesicles (EVs) or EV-associated molecules are emerging as promising biomarkers in insulin resistance, diabetes, and the metabolic syndrome 18–22. Therefore, identifying and characterizing pathways leading to insulin resistance would help in designing strategies to treat this problem.
Exosomes are very small vesicles (30–120 nm) that are present in many and perhaps all biological fluids 23–27, where they participate in a vast array of physiological processes such as cell metabolism, proliferation and differentiation 28, 29. Plasma-derived exosomes can interact with target tissues and disrupt or coordinate the enrollment of inflammatory cells such as to alter adipocyte metabolic pathways, thereby promoting the development of insulin resistance 21, 22, 30–32. Based on aforementioned considerations, we hypothesized that plasma exosomes in OHS contribute to adipose tissue insulin resistance, and that such effects will improve with treatment over time. To examine this issue, we took advantage of the Pickwick’s Spanish Sleep Network Study 17, and assessed the in vitro effects of plasma exosomes from OHS patients before and following up to 2 years of adherent CPAP treatment on insulin sensitivity and adipocyte biology in naïve human adipocytes. To further understand the potential contributions of chronic intermittent hypoxia (IH) and sleep fragmentation (SF) to circulating exosomes and their putative functional alterations, we conducted parallel and similar studies in mice (please, see Fig. S1).
MATERIALS AND METHODS
Human Subjects
The human subjects were recruited as part of a larger multicenter, randomized, controlled trial conducted in 14 Spanish teaching hospitals (NCT01405976), and patient characteristics have been described in detail elsewhere 17. Every patient underwent a diagnostic sleep study. Patients allocated to CPAP underwent a titration study on a second night. CPAP titration was performed using either conventional polysomnography or an automatic CPAP following a validated protocol 33. The subjects were evaluated at diagnosis (Pre), and after 2, 12, and 24 months after initiation of CPAP treatment (T-2, T-12, and T-24M). Adherence was defined at nightly use for at least 5.3 ± 2.1h/night throughout the duration of the study.
As controls, subjects who were diagnosed with OSA in the context of an ongoing parallel study, the EPIOSA study (NCT02131610), but who opted for not receiving treatment for 12 months were also included 34.
Murine Models of OSA
All experiments were approved by The University of Chicago Institutional Animal Care and Use Committee (IACUC protocols # 72078 and 72043). Mouse cages were randomly assigned to sleep control (CTL), sleep fragmentation (SF), room air (RA) or intermittent hypoxia (IH) conditions for periods of 1 day, 1, 2, 6 and 20 weeks.
Sleep Fragmentation (SF) and Intermittent Hypoxia (IH) (Online Supplement)
The paradigms used to induce SF and IH have been previously described 35–38.
Measurements of Metabolic Parameters
Fasting blood samples were drawn after the sleep study, and immediately centrifuged, aliquoted and stored at −80°C. Insulin concentrations were measured using ELISA kits (ALPCO Diagnostics, Salem, NH). Insulin resistance was assessed using the homeostasis model assessment (HOMA) equation (fasting insulin x fasting glucose/ 22.5) 39. Plasma levels of adiponectin were measured using commercial assay kits (BioVison Inc., Milpitas, CA), and human retinol-binding protein 4 (RBP4) was also measured using a Quantikine ELISA Kit (R&D Systems, Inc., Minneapolis, MN).
Circulating Plasma Exosome Isolation and Quantification
Exosomes were isolated from frozen plasma using the Total Exosome Isolation Kit according to the manufacturer’s protocol (Life Technologies, Grand Island, NY), as previously described 25, 40, 41, and all necessary steps were undertaken to characterize the purity of the exosomes as recommended (see below) 42.
The numbers of exosomes derived from human or mice samples were determined using the Exocet kit (System Biosciences), according to the manufacturer’s protocols. The exosomes were lysed using a gentle lysis buffer as to maintain the enzymatic activity of the exosomal Acetylcholinesterase (AChE) enzyme. A standard curve was performed using known numbers of exosomes (as measured by NanoSight) and calibrated with a recombinant AChE enzyme standard solution provided in the kit. The enzyme activities of the samples and the standards were determined by incubation in a reaction buffer in 96-well plates at room temperature for 25 mins. The optical density was measured at 406 nm by a spectrophotometric plate reader. The average of exosomes in human was 7.0–7.4x10⁷/μl, while for mice were 5.9–6.2 x10⁷/μl. Equal exosomes numbers were used for each experiment conditions.
Flow Cytometry
Different exosome surface markers were selected based on their functions including: (a) tetraspanins (CD9, CD63 and CD81), (b) targeting/adhesion (CD 31), (c) antigen presentation (HALA-G), and (d) membrane transport and fusion (Rab5a) that were bound to Exo-Flow FACS magnetic beads [(9.1μm), (SBI, System Bioscience, Mountain View, CA)]. Labeled exosomes markers were analyzed on a FACSCanto II (FACSCalibur) flow cytometer (BD Biosciences, San Jose, CA) using the FACSDiva software 2.56 (BD Biosciences).
Exosome Cellular Uptake
Purified exosomes from either human or mouse plasma samples were labeled with green fluorescent linker PKH67 (Sigma-Aldrich, St. Louis, MO), Exo-Red, and Exo-Green (System Biosciences, Mountain View, CA), and further incubated at 37°C for 10 min, until the reaction was stopped by adding ExoQuick-TC reagent. Labeled exosomes were added to either differentiated human adipocytes (# PT-5006, Lonza, Walkersville, MD) or murine 3T3-L1 cells (ATCC, Manassas, VA) for 4 hours in a cell culture incubator at 37°C. Labeled exosomes were monitored for delivery into target cells using a Leica SP5 Tandem Scanner Spectral 2-photon confocal microscope (Leica Microsystems, Inc., Buffalo Grove, IL) with a 63× oil-immersion lens.
Cell Cultures
Human Adipocytes
Human adipocytes [adipose derived stem cells, ADSCs] were purchased from Lonza (# PT-5006, Lonza, Walkersville, MD) and cultured at 37°C, 5% CO2, 95% relative humidity in pre-adipocyte basal media (PT-8202, Lonza) supplemented with 10% fetal bovine serum, FBS, (Life Technologies, Carlsbad, CA). Cells were seeded in 24-well plates with 40,000 cells per well in basal medium PGM-2 (Lonza), and after 48 h, cells were differentiated by changing to Bulletkit PGM-2 (PT-9502 & PT-8202) media containing 10% FBS, 1 μg/ml insulin, 1 μM dexamethasone (DEX), and 0.5 mM 3-isobutyl-1-methylxanthine. The medium was changed every 2 days for 12 days.
Murine Adipocytes
Mouse 3T3-L1 cells were purchased from ATCC (Manassas, VA). The cells were maintained in DMEM (Life Technologies, Grand Island, NY) supplemented with 10% (v/v) fetal calf serum, FCS, (Life Technologies), 100 U/mL penicillin, and 0.1 mg/mL streptomycin in incubator at 37°C. Day 0 was designated as the second day after the confluence of the 3T3-L1 cells. To induce differentiation, pre-adipocytes were treated for 4 days beginning on D0 with 0.5 mmol/L, isobutylmethylxanthine, 2.5 mmol/L dexamethasone and 8.7 mmol/L insulin in DMEM containing 10% fetal calf serum, F (Life Technologies). The cells were subsequently replenished with DMEM containing 10% FCS every other day.
Human and Mouse Plasma Exosomes and Pre-Adipocyte Proliferation and Differentiation
Human ADSCs cells (4 x10⁴ cells/well) or mice 3T3-L1 cells (4 x10⁴ cells/well) were cultured in 24-well plates. Exosomes from human plasma were added to ADSCs cells, and plasma exosomes from mice were added to mice 3T3-L1 cells for 3 consecutive days during proliferation. Medium was removed from the plates 24 h after adding the last exosome administration, and the monolayers were rinsed with cold PBS and 200μl of CyQUANT GR dye/cell lysis buffer (included in the CyQUANT kit, Invitrogen, Eugene, OR, USA) was added to each well. The fluorescence was measured using a microplate reader. The excitation maximum was 485 nm, and the emission maximum was 530 nm.
For differentiation assays, equivalent numbers of exosomes were added every day to the cells in the differentiation media for 3 consecutive days during the differentiation process for 3T3-L1, and every other day for human ADSCs cells. The differentiated human ADSCs or 3T3-L1 were fixed in 4% paraformaldehyde for 15 min. Isopropanol (60%) was then added in each well, and cells were then stained using 0.5% Oil Red O solution diluted (60:40, v/v) in isopropanol for 15 min at room temperature. The amount of intracellular lipid was assessed by isopropanol dissolution and optical density measurement at 490 nm.
Effects of Exosomes on Insulin Sensitivity in Naïve Adipocytes
Human pre-adipocytes or murine 3T3-L1 cells (4 x10⁴ cells/well) were grown in 24-well plates, and cells were differentiated as described above. By day of 12 of differentiation, media were replaced by growth media containing 10% depleted FBS. Exosomes were added for 24 hours and adipocytes cells were treated with 0 or 5nm insulin (Sigma-Aldrich, St. Louis, MO) at 37°C for 30min prior to lysis. Protein concentrations of the cell lysates were determined using the BCA Kit (Life Technologies, Grand Island, NY). The lysates were separated on 12% SDS-acrylamide gel and transferred to nitrocellulose membranes, incubated in blocking buffer (5% nonfat dry milk in TBST) followed by phosphoAkt (Ser473) antibody (Cell Signaling Technology, Danvers, MA) or Akt antibody (Cell Signaling Technology) overnight at 4°C. Immune-reactive bands were visualized using an enhanced chemiluminescence detection system (Chemidoc XRS+; Bio-Rad, Hercules, CA), and quantified by the Image Lab software (Bio-Rad, Hercules, CA).
Effects of Exosomes on Lipolysis
Human adipocytes or murine adipocytes cells were grown and differentiated in a 24-well cell culture plate. Cells were washed twice with 100 μl of Lipolysis Wash Buffer (# K622, Lonza, Walkersville, MD). As a positive control, 1.5 μl of 10 μM Isoproterenol (final concentration 100 nM) was added to 6-wells to stimulate lipolysis for 3 hrs. Fifty μl of the media were into 96-well plate. Glycerol released was measured by reading the absorbance (OD 570 nm) in a microtiter plate reader. Cells were also lysed and used to normalize glycerol to cellular protein content using BCA Protein Quantitation Kit (Cat. # K812).
Statistical Analysis
Data are reported as mean ± standard deviation. Comparisons between groups used unpaired Student t-test, or a non-parametric equivalent when data were not normally distributed. Comparisons between multiple groups used one-way analysis of variance (ANOVA) or Two-tailed P values that were calculated for all pairwise multiple comparison procedures using the Student-Newman-Keuls test among groups. P<0.05 was defined as achieving statistical significance.
RESULTS
Human Subjects
A total of 24 subjects with OHS (12 M and 12 F) among those who were adherent to CPAP for the complete duration of the trial were randomly selected from the database and their samples were de-identified and transferred for analyses (see reference #13 for more details on the clinical characteristics of the cohort). Mean age of male OHS subjects was 60.8 ± 12.1 years, BMI was 43.8 ± 6.0 kg/m2 and AHI 57.2 ± 32.2/hr, while female OHS subjects were 60.5 ± 15.5 year-old, with a mean BMI of 43.3 ± 5.3 kg/m2 and AHI 62.06 ± 27.7/h. Although, there were no observed clinical improvements following two months of CPAP therapy except for reductions in fasting insulin and HOMA-IR among OHS subjects, follow-up assessments at 12 and 24 months of adherent CPAP therapy revealed significant improvements in all metabolic parameters including increases in adiponectin concentrations, as well as reductions in RBP4 levels in both men and women, with no detectable differences among genders. In comparison, untreated subjects with OSA matched for age and gender showed no improvements in any of the metabolic parameters after 12 months (Table 1).
Table 1.
Metabolic parameters in 24 obesity hypoventilation syndrome (OHS) subjects before and following adherent CPAP treatment for 2 months, 1 year and 2 years, as well as 12 subjects with OSA who opted not to receive CPAP treatment and were followed for 1 year.
| Adherent | Non-adherent | |||||
|---|---|---|---|---|---|---|
| Pre- | Post-2 months | Post-12 months | Post-24 months | Pre- | FU-12 months | |
| BMI | 43.25 ± 5.27 | 43.41 ± 5.69 | 40.79 ± 6.92 | 42.04 ± 7.14 | 29.35 ± 1.81 | 29.72 ± 2.49 |
| Glucose (mg/dl) | 104.16 ± 16.13 | 111.57 ± 33.40 | 105.38 ± 23.04 | 101.69 ± 16.59 | 87.91 ± 11.77 | 90.75± 8.14 |
| Insulin (μU/mL) | 11.64 ± 8.02 | 7.08 ± 2.75 | 5.87 ± 2.12* | 4.35 ± 2.08* | 8.75 ± 2.13 | 9.78 ± 2.26 |
| Homa-IR | 1.56 ± 0.13* | 0.94 ± 0.08 | 0.79 ± 0.05 | 0.49 ± 0.03 | 1.13 ± 0.11 | 1.27 ± 0.13 |
| Adiponectin (μg/ml) | 3.49 ± 1.35 | 4.57 ± 2.36 | 5.17 ± 2.39* | 5.72 ± 2.75* | 4.18 ± 1.35 | 4.20 ± 1.85 |
| RBP4 (μg/ml) | 3.17 ± 1.19 | 2.71 ± 0.81 | 2.39 ± 0.71* | 2.21 ± 0.62* | 3.09 ± 0.04 | 3.14 ± 0.05 |
p<0.01 vs. Pre
Exosome Characterization and Cellular Uptake
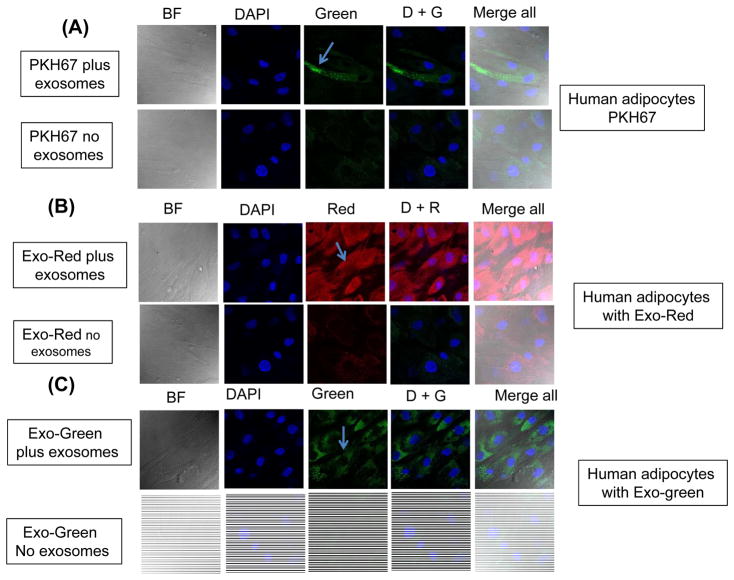
Flow cytometry of isolated exosomes derived from human OHS, OSA, or from murine models of OSA revealed the presence of tetraspanins, targeting/adhesion, and antigen presentation markers as anticipated from highly purified (>95%) exosome fractions (Figs. S2 and S3). Exosomes derived from human plasma or murine plasma were incorporated into either human or murine naïve differentiated adipocytes as shown in Fig. 1 and Fig. S4, respectively, whereas no signal was observed in cells grown in medium supplemented without exosomes to which PKH67 was also added (Fig. 1A & Fig. S4A). Of note, labeled intracellular RNAs (Exo-Red) and intracellular proteins (Exo-Green) (Fig. 1B and C), were not detectable in cells exposed to control media without exosomes (Figs. 1A– 1C; Fig. S4A–S4C). In addition, analysis of exosome uptake performed in the differentiated adipocyte cell lines by time-lapsed confocal microscopy revealed increasing uptake of labeled exosomes over time. In this setting, cells exhibiting exosome uptake showed that both RNA and protein co-localized with DAPI in the nucleus, while lipid localization was restricted to the cell membrane. Exosome uptake was also dose-dependent, as there were increased spot numbers, total fluorescence, and median pixel intensities of the dyes with increasing exosome concentrations (data not shown).
Figure 1.
Uptake of fluorescently labelled exosomes by differentiated human adipocytes cells. Confocal microscope images illustrating exosome uptake into human adipocytes cells. Exosomes were isolated from plasma of subjects with obesity hypoventilation and labeled with the PKH67 Green Fluorescent (lipophilic), Exo-Red (fluorescently-label isolated exosome RNAs), and Exo-Green (fluorescently-label isolated exosome protein). Panel (A) is a representative images of human differentiated adipocytes cells were grown on coverslips for 24 h and the labeled exosomes with PKH67 were added to the cells for 6 h at 37°C. Panel (B) a representative images of human differentiated adipocytes and the labeled exosomes with Exo-Red were added to the cells for 6 h at 37°C. Panel (C) is a representative images of human differentiated adipocytes and the labeled exosomes with Exo-Green were added to the cells for 6 h at 37°C. Cells were washed and stained with nuclei (blue) stained with DAPI, n=6, scale bar in 10 μm. As controls, no exosomes were used but PKH67 was added. The differential interference contrast (DIC) was used to visual the morphology of the cells without fluorescence.
Effects of Exosomes on Naïve Adipocytes
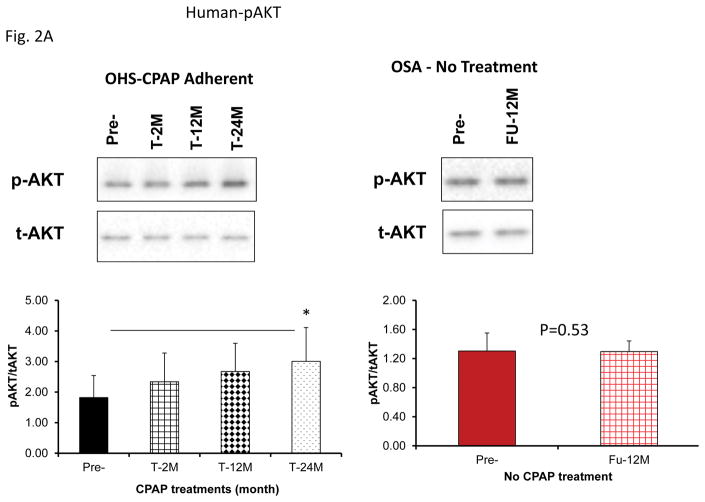
Insulin-induced pAkt level increases were markedly attenuated in adipocytes by exosomes derived from patients with OHS prior to treatment and OSA indicating the presence of insulin resistance, and significant increases in pAKT expression emerged following CPAP treatment at all time points and no gender differences were detectable (Fig. 2A; pAkt/Akt ratio for Pre-: 1.82±0.72 vs. Post-T-24M: 3.01±1.11, n=24, P<0.008). Similarly, mean pAkt/Akt ratio for untreated OSA subjects did not change over a period of 12 months (Pre-: 1.31±0.25 vs. T-12M: 1.30±0.15, n=8, P=0.95).
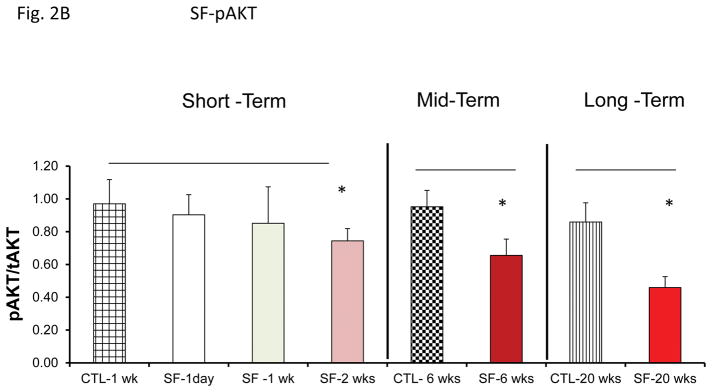
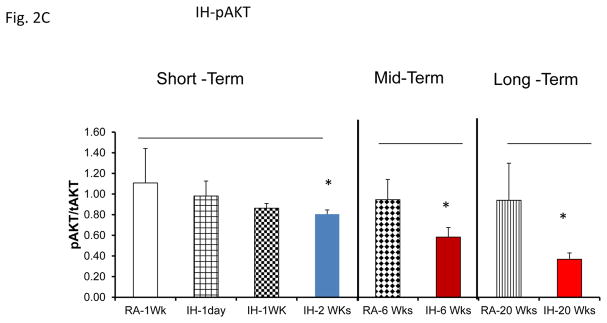
Figure 2.
Effects of exosomes derived from human subjects, adherent, (Pre- and-Post CPAP treatments), non-adherent on naïve human adipocytes, exosomes derived from mice exposed to sleep fragmentation (SF) or intermittent hypoxia (IH), respectively, using a time course of 1 day, 1 week, 2 weeks, 6 weeks and 20 weeks and sleep control (CTL) on a murine naïve adipocytes for insulin sensitivity. Panel (A) shows the average of pAKT/tAKT ratio of human exosomes derived from human (Pre- and Post-CPAP (T-2M, T-12M, and T-24M) on human adipocytes, n=24 per conditions. Panel (B) shows the average of pAKT/tAKT ratio of SF and CTL exosomes derived from SF time course on murine adipocytes (3T3-L1), n=8 per conditions. Panel (C) shows the average of pAKT/tAKT ratio of IH and RA exosomes derived from IH time course on murine adipocytes (3T3-L1), n=8 per conditions. * Indicates statistical significance, p≤ 0.05.
Mice exposed to IH or SF develops evidence of insulin resistance 38, 43–46. Here, we used plasma exosomes derived from mice exposed to SF or IH from 1 day-20 weeks to expose naïve murine differentiated adipocytes (Fig. 2B & 2C). Exosomes from SF or IH induced significant reductions in Akt phosphorylation responses to exogenous insulin after 6 and 20 weeks of exposure, while earlier time points did not exhibit significant alterations.
Effects of Exosomes on Pre-Adipocyte Proliferation and Differentiation
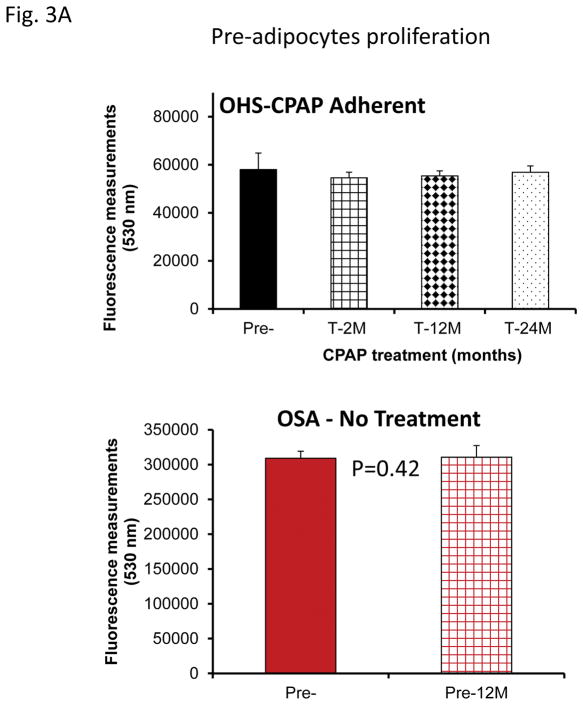
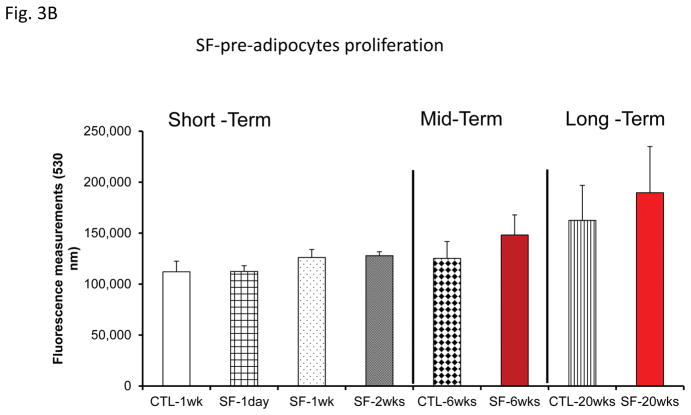
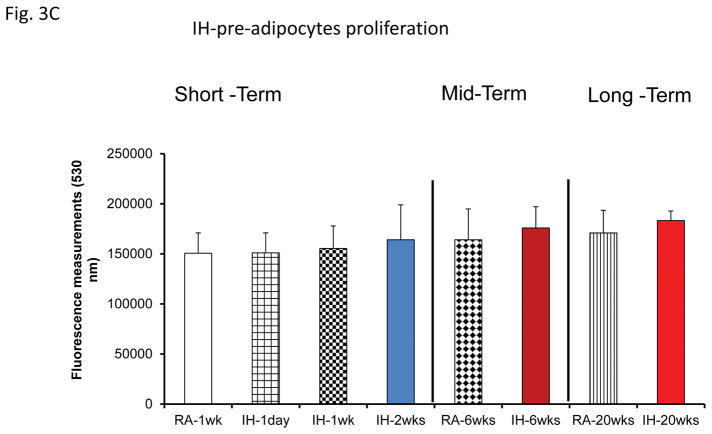
No significant differences in pre-adipocyte proliferation were detected at any of the time points (Fig. 2A). Similarly, exosomes from mice exposed to SF or IH for short-term, mid-term or long-term exposures had no discernible effects on adipocyte proliferation (Fig. 3B & 3C).
Figure 3.
Effects of exosomes derived from human subjects, adherent, (Pre- and-Post CPAP treatments), non-adherent on naïve human adipocytes, exosomes derived from mice exposed to sleep fragmentation (SF), or intermittent hypoxia (IH), respectively, using a time course of 1 day, 1 week, 2 weeks, 6 weeks and 20 weeks and sleep control (CTL) on naïve adipocytes for proliferation of pre-adipocytes. Panel (A) shows the average of proliferation values of human pre-and post-treatments (Pre- and Post-CPAP (T-2M, T-12M, and T-24M), n=24 per conditions. Panel (B) shows the average of proliferation values of SF and CTL (3T3-L1), n=8 per conditions. Panel (C) shows the average of proliferation values of IH and RA, (3T3-L1), n=8 per conditions. * Indicates statistical significance, p≤ 0.05.
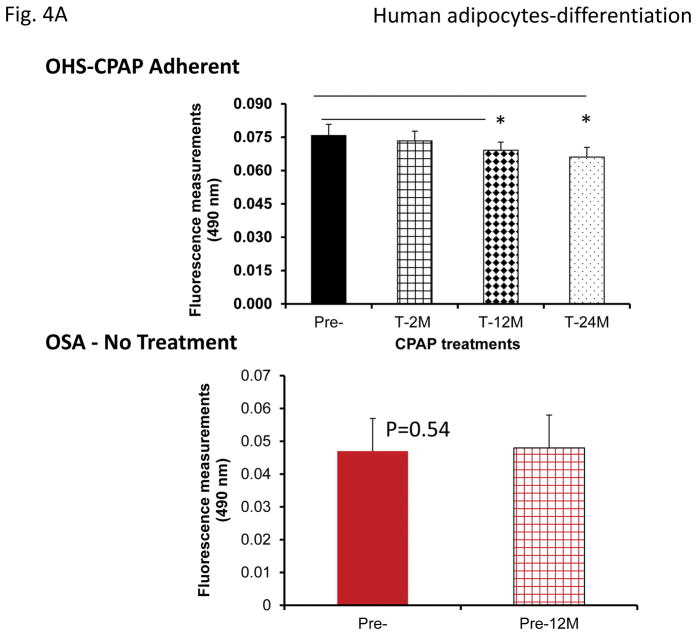
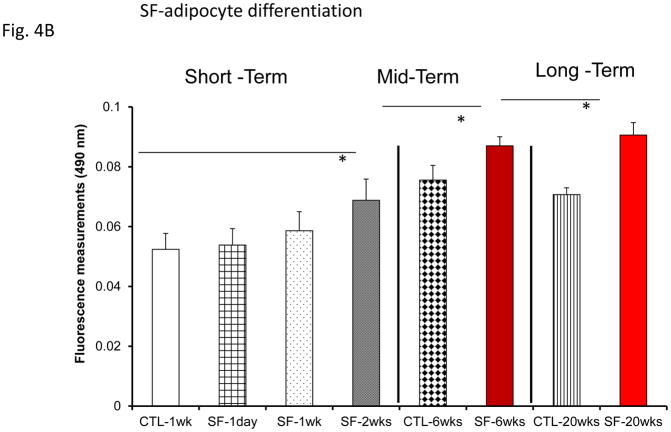
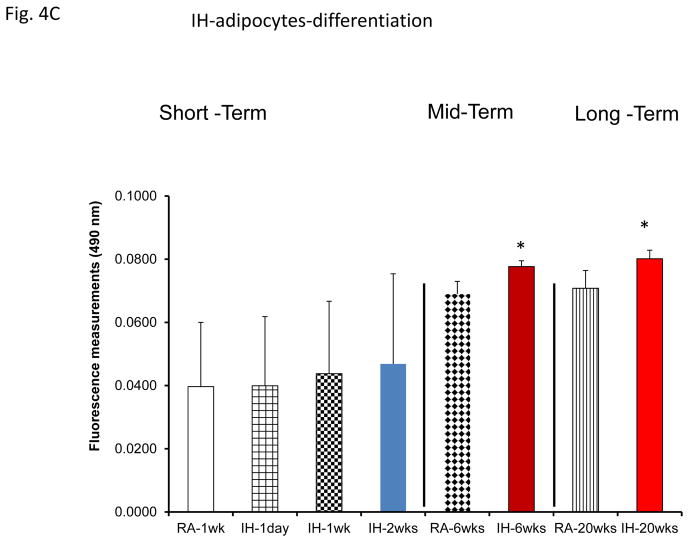
However, plasma exosomes derived from OHS subjects at baseline induced increased adipocyte lipid accumulation, an indicator of pre-adipocyte differentiation, when compared to all treatment time points, while no changes occurred in untreated OSA subjects (Fig. 4A). Moreover, plasma exosomes from either SF or IH increased adipocyte lipid accumulation when compared to their time-matched control groups, but only following mid-term and long-time exposures (Fig. 4B & 4C).
Figure 4.
Effects of exosomes derived from human subjects, adherent, (Pre- and-Post CPAP treatments), non-adherent on naïve human adipocytes, exosomes derived from mice exposed to sleep fragmentation (SF), or intermittent hypoxia (IH), respectively, using a time course of 1 day, 1 week, 2 weeks, 6 weeks and 20 weeks and sleep control (CTL) on naïve adipocytes for differentiation of adipocytes. Panel (A) shows the average of lipids released values when incubating exosomes derived from human pre-and post-treatments (Pre- and Post-CPAP (T-2M, T-12M, and T-24M) to differentiated adipocytes on human adipocytes, n=24 per conditions. Panel (B) shows the average of lipids released values when incubating exosomes derived from SF or CTL to differentiated adipocyte (3T3-L1), n=8 per conditions. Panel (C) shows the average of lipids released values when incubating exosomes derived from IH and RA to differentiated adipocytes (3T3-L1), n=8 per conditions. * Indicates statistical significance, p≤ 0.05.
Effects of Exosomes on Lipolysis
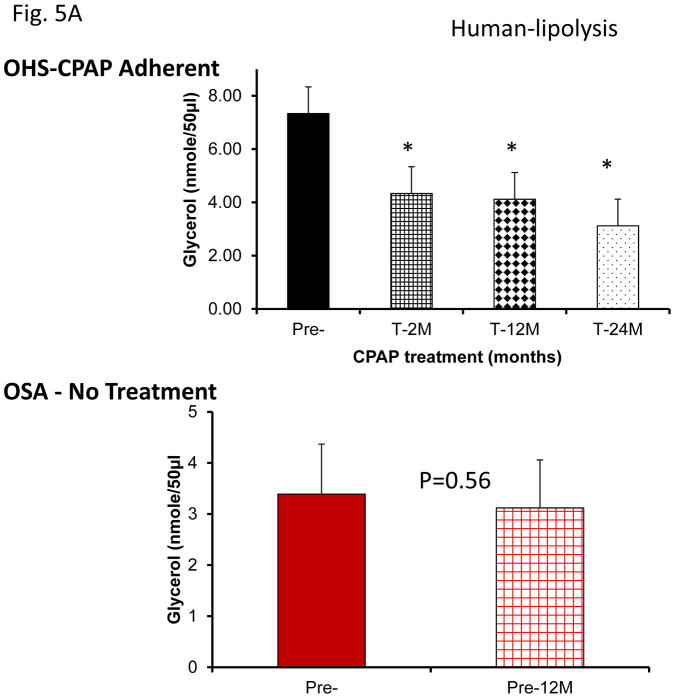
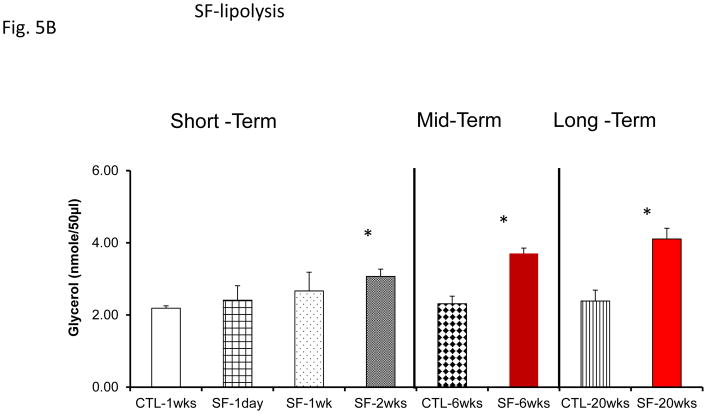
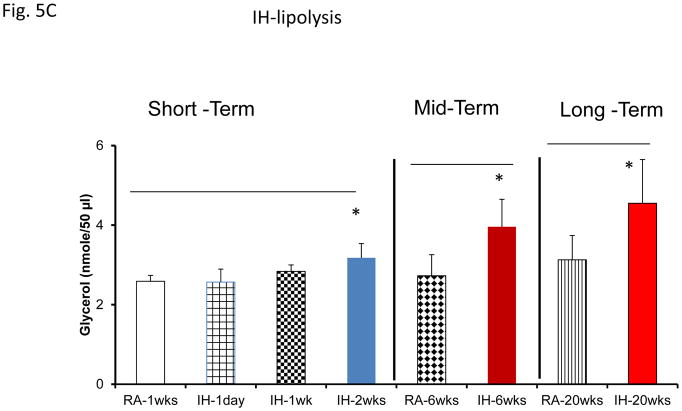
Assessment of lipolysis after exosome treatment of human adipocytes revealed increased glycerol release in Pre-treatment conditions, with significant reductions in lipolysis after CPAP treatment at all time points (Fig. 5A). No significant differences in exosome-induced lipolysis occurred in untreated subjects with sleep apnea (Fig. 5A). Notably, exosomes derived from SF or IH mice also increased lipolysis as shown by glycerol release assay (Fig. 5A & 5C). In SF- or IH-exposed mice, the lipolysis induced by exosomes was increased after mid-term and long-time exposures, but not after shorter exposures (Fig. 5B & 5C).
Figure 5.
Effects of exosomes derived from human subjects, adherent, (Pre- and-Post CPAP treatments), non-adherent on naïve adipocytes, exosomes derived from mice exposed to sleep fragmentation (SF), or intermittent hypoxia (IH), respectively, using a time course of 1 day, 1 week, 2 weeks, 6 weeks and 20 weeks and sleep control (CTL) on naïve adipocytes for lipolysis. Panel (A) the average of glycerol released when incubating exosomes derived from human subject pre-and post-CPAP treatments (Pre- and Post-CPAP (T-2M, T-12M, and T-24M) to differentiated adipocytes on human adipocytes, n=24 per conditions for lipolysis. Panel (B) shows the average of lipids released values when incubating exosomes derived from SF or CTL to differentiated adipocytes (3T3-L1). Panel (C) shows the average of glycerol released when incubating exosomes derived from SF or CTL to differentiated adipocytes (3T3-L1). * Indicates statistical significance, p≤ 0.05.
DISCUSSION
This study shows that circulating exosomes from human subjects with OHS or from mice exposed to IH/SF promote reduced insulin sensitivity in naïve adipocytes in vitro, that responds favorably to CPAP treatment, particularly after long-term adherent therapy, and such beneficial effects of CPAP are undetectable among OSA patients who opted not to receive any treatment. Furthermore, plasma exosomes from OHS increased the differentiation of pre-adipocytes but did not affect their proliferative rates, and also enhanced adipocyte lipolysis. Experiments in mice exposed for variable durations of either SF or IH further indicated that short-term exposures do not appear to alter the functional properties of exosomes, while the findings in exosomes derived from plasma of mice exposed to longer exposures closely recapitulated the results in OHS patients.
Before we discuss in more detail the potential implications of our findings, we would like to comment on the reduced insulin sensitivity elicited by plasma exosomes originating from both SF- and IH-exposed mice. We have previously shown that mice exposed to long-term SF develop increased body weight and adipose tissue mass, along with mobilization and differentiation of adipocyte precursors, and adipose tissue inflammation 35, 44, 46, 47. This is in contrast with mice exposed to chronic IH who display reductions in body weight, along with increased visceral fat inflammation 48–52, yet these two paradigms are associated with metabolic dysfunction and insulin resistance, suggesting that in the context of OSA, body weight may potentiate the effects of obesity, but is not the sole contributor to metabolic dysfunction. Here however, we explored the isolated effects of circulating exosomes on naïve adipocytes, such that all of the direct effects of either IH or SF on adipose tissue cells were essentially precluded by the experimental design, and therefore enabled parallel comparisons between the functional effects of exosomes in OHS to those of the murine models of OSA. We should also remark that we characterized plasma exosomes from human subjects with OHS as well as from both murine OSA models, which are consistently enriched for tetraspanins, and are often used as exosome biomarkers 53.
Although the majority of patients with OHS have concomitant severe OSA, nocturnal hypoventilation may be the only respiratory sleep disorder present 6. Moreover, in the largest clinical trial of OHS to date, 73% of the OHS patients suffered from severe OSA 54. It is now quite well established that OSA is independently associated with the presence of metabolic dysfunction in general, and more particularly with the presence of insulin resistance and dyslipidemia 50, 55, 56. Here we examined different biological markers for insulin resistance in OHS patients, and also evaluated circulating levels of adiponectin, which are low in patients with obesity or type-2 diabetes 57, 58, and correlate with indices of insulin sensitivity. We found that adiponectin levels were decreased in OHS, and increased following adherent CPAP treatment in the absence of significant changes in BMI after treatment.
Elevated plasma RBP4 levels have been associated with the clustering of components of the metabolic syndrome in insulin-resistant subjects, and in population-based studies 59. Plasma levels of RBP4 were higher in OHS patients, and were significantly improved with CPAP intervention over time, but did not change in those patients with OSA who were not receiving CPAP treatment. These findings provide initial evidence on the favorable impact of adherent CPAP treatment on metabolic markers in OHS.
Our findings also indicate that exosomes derived from OHS subjects at diagnosis induce insulin resistance in naïve adipocytes compared to exosomes from the same subjects following adherent CPAP treatment, particularly when the latter intervention is implemented for long periods of time (i.e., T-12M or T-24M). Such improvements were conspicuously absent in untreated OSA patients. In parallel studies, using murine circulating exosomes from both mid-term and long-term, but not short-term sleep fragmentation (SF) and intermittent hypoxia (IH), similar responses indicating insulin resistance emerged in murine adipocytes. Thus, the current findings suggest that chronic perturbations of sleep continuity or episodic hypoxia lead to altered composition of circulating exosomes, which turn alter the functional properties of target cells, i.e., adipocytes, to promote the presence of insulin resistance. Since, exosomes can be released by many cell types and are loaded with a variety of proteins, lipids, and nucleic acids (including miRNAs) 60, exploration of the potential dominant cells from which the exosomes originate to alter adipocyte insulin sensitivity is clearly beyond the scope of the present work, but certainly merits future exploration to better delineate the specific source cells and cargo elements that foster targeted disruption of insulin receptor signaling.
Current experiments illustrate for the first time that plasma exosomes of both OHS patients and from mice exposed to murine models of OSA promote the differentiation of pre-adipocytes, albeit without altering their proliferative properties, and also induce significant lipolysis. We have previously shown that chronic SF was associated with substantial increases in pre-adipocyte differentiation 35, and that such events required activation and propagation of oxidative stress via NADPH oxidase activity. Additional studies indicated that IH favors the induction of lipolysis, which in turn adversely affects insulin sensitivity 61–63, and CPAP withdrawal in patients with OSA leads to major increases in circulating free fatty acids, facilitating metabolic dysfunction 64. Taken together, circulating exosomes in the context of OHS or murine OSA may provide an inter-cellular communication vehicle that ultimately disrupts adipocyte homeostasis, resulting in altered metabolic function. It remains unclear whether exosomes derived from patients with OSA will also modify the function of other important metabolic cellular targets, such as hepatocytes, myocytes or pancreatic β cells.
Several studies have examined circulating exosomes in humans with obesity, metabolic syndrome, and diabetes 22. Severe obesity increases circulating exosomes independent of the metabolic syndrome 65, while in two recent studies ob/ob null mice displayed elevated numbers of exosomes compared to wild-type mice 66, and exosomes bearing cystatin C were positively associated with metabolic complications of obesity in patients with clinical vascular diseases 31. Several other studies have isolated exosomes that exhibit biological activity from the cell culture supernatants in a variety of settings 18, 19, 21. For example, exosomes isolated from the supernatants of visceral adipose tissue cultures showed that injection of exosomes derived from diet-induced or genetically obese mice into wild-type lean mice results in macrophage activation and insulin resistance 32. In addition, isolated exosomes from the supernatants of differentiated 3T3-L1 cells under hypoxic conditions are increased in number and also enriched in enzymes related to lipogenesis and promote lipid accumulation in recipient 3T3-L1 adipocytes 67. Exosomes have also been implicated in the regulation of energy metabolism and are effectively involved in the communication between adipocytes 68.
This study provides a compelling proof of concept illustrating that exosomes derived from OHS patients following CPAP treatment improved insulin sensitivity in naïve human adipocytes, while absence of any therapeutic intervention, which would be unethical in OHS but is deemed acceptable in the less severe OSA cases illustrates the absence of any temporal changes in the functional properties of circulating exosomes. In addition, OHS is a clinical entity characterized by the coexistence of obesity and hypoxia and hypercapnia during wakefulness, with a recent study reporting that hypercapnia promotes adipogenesis in human adipocytes 69. Accordingly, the beneficial effects of CPAP in our OHS cohort could have resulted from the improvements in both hypoxia and hypercapnia, and therefore future murine studies may need to explore both the isolated and combined role of hypercapnia to exosome biological properties in adipocytes. 69 There are several additional limitations in this study that merit discussion. First, the untreated OSA group is not entirely comparable to the OHS group, i.e., lower BMI, lower glucose and insulin levels, and slightly higher adiponectin than OHS at baseline. Nevertheless, as indicated above the ethical issues involved in purposefully withholding therapy from OHS, prompted us to at least show that no treatment in OSA resulted on significant changes over time. Second, we used lean mice on a normal chow diet and exposed them to IH and SF. This strategy was aimed to avoid additional effects of obesity and dietary components on the experiments, and enable specific evaluation of the effects of the experimental interventions. Future studies centered around the impact on exosomal content and function of genetic or dietary obesity, dietary constitutive components (e.g., fat or carbohydrate content) or physical activity should be forthcoming70, 71.
As discussed above, plasma-derived exosomes in OHS patients and in mice exposed to OSA experimental models mediate at least in part the adverse metabolic effects of these conditions as illustrated by adipocyte-based functional reporter assays. Furthermore, our results illustrate an important observation, whereby there appear to be continued improvements in metabolic dysfunction over time with adherent CPAP treatment that are both apparent in systemic metabolic function (Table 1), and are also illustrated by the functional properties of circulating exosomes on naïve adipocyte reporter assays. Thus, large clinical studies to further investigate the utility of monitoring circulating exosomes and their cargo elements as biomarkers of OHS patients and metabolic health may be an important and potentially useful approach to uncover not only the effect of treatment adherence or lack thereof, but also to identify putative therapeutic targets.
Supplementary Material
Schematic Illustration of experimental design for human and murine studies. Plasma was isolated from each subject or each mice and equal volume for each sample was used to isolate circulating exosomes. Human subjects with obesity hypoventilation syndrome (OHS) contain both male and female, and each subject was treated with CPAP for 2-, 12M and 24-M. For animal model with OSA using two different paradigms including sleep fragmentation (SF) and intermittent hypoxia (IH) for the following time points of exposures (1day, 1wks, 2wks, 6wks, and 20wks), as well as control for each time point. Mice were used were all male.
Flow cytometry detection of surface molecules on exosomes derived from human subjects with OHS. Bead flow separation data for exosomes analyzed using the various capture antibodies followed by Exo-FITC staining. The data are graphed showing forward scatter versus FITC intensity. The first panel depicts beads with no exosomes then with exosomes. The degree of flow separation is shown on the right side for each capture set. The flow cytometry analysis of purified exosome following specific isolation with magnetic beads stained with anti-CD9, CD31, HLA-G and Rab5b using FACS analysis (FACSCalibur) instrument. The Exo-Flow magnetic stand for exosome separation and FACS analysis showing the absence of exosomes (negative, Green color) and the presence of exosomes (positive, Red color) beads are displayed on the FACS plot. The FITC flow cytometric intensities are then plotted versus the number of exosome particles input into the flow reaction, n=6 for each antibody. The FITC flow cytometric intensities are then plotted versus the number of exosome particles input into the flow reaction. The data are graphed showing forward scatter versus FITC intensity. The FITC flow cytometric intensities are then plotted versus the number of exosome particles input into the flow reaction
Flow cytometry detection of surface molecules on exosomes derived from mice either exposed to SF or IH. The data are graphed showing forward scatter versus FITC intensity. The first panel depicts beads with no exosomes then with exosomes. The degree of flow separation is shown on the right side for each capture set. The flow cytometry analysis of purified exosome following specific isolation with magnetic beads stained with anti-CD9, CD31, HLA-G and Rab5b using FACS analysis (FACSCalibur) instrument. The Exo-Flow magnetic stand for exosome separation and FACS analysis showing the absence of exosomes (negative, Green color) and the presence of exosomes (positive, Red color) beads are displayed on the FACS plot. The FITC flow cytometric intensities are then plotted versus the number of exosome particles input into the flow reaction, n=6 for each antibody.
Confocal microscope images illustrating exosome uptake into murine adipocytes cells. Exosomes were isolated from mice exposed to SF or IH and labeled with the PKH67 Green Fluorescent Cell Linker Kit, Exo-Red, and Exo-Green. Panel (A) is a representative images of murine differentiated adipocytes cells were grown on coverslips for 24 h and the labeled exosomes with PKH67 were added to the cells for 6 h at 37°C. Panel (B) is a representative image of differentiated adipocytes (3T3-L1) and the labeled exosomes with Exo-Red. Panel (C) is a representative image differentiated adipocytes (3T3-L1) and the labeled exosomes with Exo-Green. Cells were washed and stained with nuclei (blue) stained with DAPI, n=6, scale bar in 10 μm. As controls, PKH67, Exo-Red or Exo-Green were added, but in the absence of exosomes. The differential interference contrast (DIC) was used to visual the morphology of the cells without fluorescence.
Acknowledgments
This study was supported by National Institutes of Health grant HL130984 (to LKG), Instituto de Salud Carlos III (Fondo de Investigaciones Sanitarias, Ministerio de Sanidad y Consumo) grant PI050402, Spanish Respiratory Foundation 2005 (FEPAR) and Air Liquide Spain.
Footnotes
Clinicaltrial.gov identifiers: NCT01405976 and NCT02131610
Conflict of Interest
All the authors declare that they have no conflicts of interest.
References
- 1.Collaborators GBDO, Afshin A, Forouzanfar MH, Reitsma MB, Sur P, Estep K, et al. Health Effects of Overweight and Obesity in 195 Countries over 25 Years. The New England journal of medicine. 2017;377(1):13–27. doi: 10.1056/NEJMoa1614362. [DOI] [PMC free article] [PubMed] [Google Scholar]
- 2.Ahima RS. Digging deeper into obesity. J Clin Invest. 2011;121(6):2076–9. doi: 10.1172/JCI58719. [DOI] [PMC free article] [PubMed] [Google Scholar]
- 3.Castro-Anon O, Perez de Llano LA, De la Fuente Sanchez S, Golpe R, Mendez Marote L, Castro-Castro J, et al. Obesity-hypoventilation syndrome: increased risk of death over sleep apnea syndrome. PLoS One. 2015;10(2):e0117808. doi: 10.1371/journal.pone.0117808. [DOI] [PMC free article] [PubMed] [Google Scholar]
- 4.Ramirez-Molina VR, Gomez-de-Terreros FJ, Barca-Duran J, Masa JF. Non-invasive Positive Airway Pressure in Obesity Hypoventilation Syndrome and Chronic Obstructive Pulmonary Disease: Present and Future Perspectives. COPD. 2017:1–11. doi: 10.1080/15412555.2017.1317730. [DOI] [PubMed] [Google Scholar]
- 5.Petitti DB, Freedman D. Dietary sodium and blood pressure. The New England journal of medicine. 2001;344(22):1717. author reply 1718–9. [PubMed] [Google Scholar]
- 6.Kessler R, Chaouat A, Schinkewitch P, Faller M, Casel S, Krieger J, et al. The obesity-hypoventilation syndrome revisited: a prospective study of 34 consecutive cases. Chest. 2001;120(2):369–76. doi: 10.1378/chest.120.2.369. [DOI] [PubMed] [Google Scholar]
- 7.Mokhlesi B. Obesity hypoventilation syndrome: a state-of-the-art review. Respir Care. 2010;55(10):1347–62. discussion 1363–5. [PubMed] [Google Scholar]
- 8.Balachandran JS, Masa JF, Mokhlesi B. Obesity Hypoventilation Syndrome Epidemiology and Diagnosis. Sleep Med Clin. 2014;9(3):341–347. doi: 10.1016/j.jsmc.2014.05.007. [DOI] [PMC free article] [PubMed] [Google Scholar]
- 9.Harada Y, Chihara Y, Azuma M, Murase K, Toyama Y, Yoshimura C, et al. Obesity hypoventilation syndrome in Japan and independent determinants of arterial carbon dioxide levels. Respirology. 2014;19(8):1233–40. doi: 10.1111/resp.12367. [DOI] [PubMed] [Google Scholar]
- 10.BaHammam AS. Prevalence, clinical characteristics, and predictors of obesity hypoventilation syndrome in a large sample of Saudi patients with obstructive sleep apnea. Saudi Med J. 2015;36(2):181–9. doi: 10.15537/smj.2015.2.9991. [DOI] [PMC free article] [PubMed] [Google Scholar]
- 11.BaHammam AS, Pandi-Perumal SR, Piper A, Bahammam SA, Almeneessier AS, Olaish AH, et al. Gender differences in patients with obesity hypoventilation syndrome. J Sleep Res. 2016;25(4):445–53. doi: 10.1111/jsr.12400. [DOI] [PubMed] [Google Scholar]
- 12.Masa JF, Corral J, Romero A, Caballero C, Teran-Santos J, Alonso-Alvarez ML, et al. Protective Cardiovascular Effect of Sleep Apnea Severity in Obesity Hypoventilation Syndrome. Chest. 2016;150(1):68–79. doi: 10.1016/j.chest.2016.02.647. [DOI] [PubMed] [Google Scholar]
- 13.Masa JF, Corral J, Romero A, Caballero C, Teran-Santos J, Alonso-Alvarez ML, et al. The Effect of Supplemental Oxygen in Obesity Hypoventilation Syndrome. J Clin Sleep Med. 2016;12(10):1379–1388. doi: 10.5664/jcsm.6194. [DOI] [PMC free article] [PubMed] [Google Scholar]
- 14.Pierce AM, Brown LK. Obesity hypoventilation syndrome: current theories of pathogenesis. Curr Opin Pulm Med. 2015;21(6):557–62. doi: 10.1097/MCP.0000000000000210. [DOI] [PubMed] [Google Scholar]
- 15.Gileles-Hillel A, Kheirandish-Gozal L, Gozal D. Biological plausibility linking sleep apnoea and metabolic dysfunction. Nature reviews Endocrinology. 2016;12(5):290–8. doi: 10.1038/nrendo.2016.22. [DOI] [PubMed] [Google Scholar]
- 16.Koren D, Dumin M, Gozal D. Role of sleep quality in the metabolic syndrome. Diabetes Metab Syndr Obes. 2016;9:281–310. doi: 10.2147/DMSO.S95120. [DOI] [PMC free article] [PubMed] [Google Scholar]
- 17.Lopez-Jimenez MJ, Masa JF, Corral J, Teran J, Ordaz E, Troncoso MF, et al. Mid- and Long-Term Efficacy of Non-Invasive Ventilation in Obesity Hypoventilation Syndrome: The Pickwick’s Study. Arch Bronconeumol. 2016;52(3):158–65. doi: 10.1016/j.arbres.2015.10.003. [DOI] [PubMed] [Google Scholar]
- 18.Borujeni MJS, Esfandiary E, Taheripak G, Codoner-Franch P, Alonso-Iglesias E, Mirzaei H. Molecular aspects of Diabetes Mellitus: Resistin, MicroRNA and Exosome. Journal of cellular biochemistry. 2017 doi: 10.1002/jcb.26271. [DOI] [PubMed] [Google Scholar]
- 19.Hubal MJ, Nadler EP, Ferrante SC, Barberio MD, Suh JH, Wang J, et al. Circulating adipocyte-derived exosomal MicroRNAs associated with decreased insulin resistance after gastric bypass. Obesity. 2017;25(1):102–110. doi: 10.1002/oby.21709. [DOI] [PMC free article] [PubMed] [Google Scholar]
- 20.Karolina DS, Tavintharan S, Armugam A, Sepramaniam S, Pek SL, Wong MT, et al. Circulating miRNA profiles in patients with metabolic syndrome. The Journal of clinical endocrinology and metabolism. 2012;97(12):E2271–6. doi: 10.1210/jc.2012-1996. [DOI] [PubMed] [Google Scholar]
- 21.Milbank E, Martinez MC, Andriantsitohaina R. Extracellular vesicles: Pharmacological modulators of the peripheral and central signals governing obesity. Pharmacology & therapeutics. 2016;157:65–83. doi: 10.1016/j.pharmthera.2015.11.002. [DOI] [PubMed] [Google Scholar]
- 22.Santovito D, De Nardis V, Marcantonio P, Mandolini C, Paganelli C, Vitale E, et al. Plasma exosome microRNA profiling unravels a new potential modulator of adiponectin pathway in diabetes: effect of glycemic control. The Journal of clinical endocrinology and metabolism. 2014;99(9):E1681–5. doi: 10.1210/jc.2013-3843. [DOI] [PubMed] [Google Scholar]
- 23.Khalyfa A, Gozal D. Exosomal miRNAs as potential biomarkers of cardiovascular risk in children. Journal of translational medicine. 2014;12:162. doi: 10.1186/1479-5876-12-162. [DOI] [PMC free article] [PubMed] [Google Scholar]
- 24.Khalyfa A, Kheirandish-Gozal L, Gozal D. Circulating exosomes in obstructive sleep apnea as phenotypic biomarkers and mechanistic messengers of end-organ morbidity. Respir Physiol Neurobiol. 2017 doi: 10.1016/j.resp.2017.06.004. [DOI] [PMC free article] [PubMed] [Google Scholar]
- 25.Khalyfa A, Kheirandish-Gozal L, Khalyfa AA, Philby MF, Alonso-Alvarez ML, Mohammadi M, et al. Circulating Plasma Extracellular Microvesicle MicroRNA Cargo and Endothelial Dysfunction in Children with Obstructive Sleep Apnea. Am J Respir Crit Care Med. 2016;194(9):1116–1126. doi: 10.1164/rccm.201602-0323OC. [DOI] [PMC free article] [PubMed] [Google Scholar]
- 26.Khalyfa A, Zhang C, Khalyfa AA, Foster GE, Beaudin AE, Andrade J, et al. Effect on Intermittent Hypoxia on Plasma Exosomal Micro RNA Signature and Endothelial Function in Healthy Adults. Sleep. 2016;39(12):2077–2090. doi: 10.5665/sleep.6302. [DOI] [PMC free article] [PubMed] [Google Scholar]
- 27.Witwer KW, Buzas EI, Bemis LT, Bora A, Lasser C, Lotvall J, et al. Standardization of sample collection, isolation and analysis methods in extracellular vesicle research. Journal of extracellular vesicles. 2013:2. doi: 10.3402/jev.v2i0.20360. [DOI] [PMC free article] [PubMed] [Google Scholar]
- 28.Colombo M, Raposo G, Thery C. Biogenesis, secretion, and intercellular interactions of exosomes and other extracellular vesicles. Annual review of cell and developmental biology. 2014;30:255–89. doi: 10.1146/annurev-cellbio-101512-122326. [DOI] [PubMed] [Google Scholar]
- 29.Kourembanas S. Exosomes: vehicles of intercellular signaling, biomarkers, and vectors of cell therapy. Annual review of physiology. 2015;77:13–27. doi: 10.1146/annurev-physiol-021014-071641. [DOI] [PubMed] [Google Scholar]
- 30.Mullins RJ, Mustapic M, Goetzl EJ, Kapogiannis D. Exosomal biomarkers of brain insulin resistance associated with regional atrophy in Alzheimer’s disease. Human brain mapping. 2017 doi: 10.1002/hbm.23494. [DOI] [PMC free article] [PubMed] [Google Scholar]
- 31.Kranendonk ME, de Kleijn DP, Kalkhoven E, Kanhai DA, Uiterwaal CS, van der Graaf Y, et al. Extracellular vesicle markers in relation to obesity and metabolic complications in patients with manifest cardiovascular disease. Cardiovasc Diabetol. 2014;13:37. doi: 10.1186/1475-2840-13-37. [DOI] [PMC free article] [PubMed] [Google Scholar]
- 32.Deng ZB, Poliakov A, Hardy RW, Clements R, Liu C, Liu Y, et al. Adipose tissue exosome-like vesicles mediate activation of macrophage-induced insulin resistance. Diabetes. 2009;58(11):2498–505. doi: 10.2337/db09-0216. [DOI] [PMC free article] [PubMed] [Google Scholar]
- 33.Masa JF, Jimenez A, Duran J, Capote F, Monasterio C, Mayos M, et al. Alternative methods of titrating continuous positive airway pressure: a large multicenter study. American journal of respiratory and critical care medicine. 2004;170(11):1218–24. doi: 10.1164/rccm.200312-1787OC. [DOI] [PubMed] [Google Scholar]
- 34.Marin JM, Artal J, Martin T, Carrizo SJ, Andres M, Martin-Burriel I, et al. Epigenetics modifications and Subclinical Atherosclerosis in Obstructive Sleep Apnea: The EPIOSA study. BMC Pulm Med. 2014;14:114. doi: 10.1186/1471-2466-14-114. [DOI] [PMC free article] [PubMed] [Google Scholar]
- 35.Khalyfa A, Wang Y, Zhang SX, Qiao Z, Abdelkarim A, Gozal D. Sleep fragmentation in mice induces nicotinamide adenine dinucleotide phosphate oxidase 2-dependent mobilization, proliferation, and differentiation of adipocyte progenitors in visceral white adipose tissue. Sleep. 2014;37(5):999–1009. doi: 10.5665/sleep.3678. [DOI] [PMC free article] [PubMed] [Google Scholar]
- 36.Nair D, Zhang SX, Ramesh V, Hakim F, Kaushal N, Wang Y, et al. Sleep fragmentation induces cognitive deficits via nicotinamide adenine dinucleotide phosphate oxidase-dependent pathways in mouse. Am J Respir Crit Care Med. 2011;184(11):1305–12. doi: 10.1164/rccm.201107-1173OC. [DOI] [PMC free article] [PubMed] [Google Scholar]
- 37.Ramesh V, Nair D, Zhang SX, Hakim F, Kaushal N, Kayali F, et al. Disrupted sleep without sleep curtailment induces sleepiness and cognitive dysfunction via the tumor necrosis factor-alpha pathway. J Neuroinflammation. 2012;9:91. doi: 10.1186/1742-2094-9-91. [DOI] [PMC free article] [PubMed] [Google Scholar]
- 38.Khalyfa A, Qiao Z, Gileles-Hillel A, Khalyfa AA, Akbarpour M, Popko B, et al. Activation of Integrated Stress Response and Metabolic Dysfunction in a Murine Model of Sleep Apnea. Am J Respir Cell Mol Biol. 2017 doi: 10.1165/rcmb.2017-0057OC. [DOI] [PMC free article] [PubMed] [Google Scholar]
- 39.Matthews DR, Hosker JP, Rudenski AS, Naylor BA, Treacher DF, Turner RC. Homeostasis model assessment: insulin resistance and beta-cell function from fasting plasma glucose and insulin concentrations in man. Diabetologia. 1985;28(7):412–9. doi: 10.1007/BF00280883. [DOI] [PubMed] [Google Scholar]
- 40.Khalyfa A, Almendros I, Gileles-Hillel A, Akbarpour M, Trzepizur W, Mokhlesi B, et al. Circulating exosomes potentiate tumor malignant properties in a mouse model of chronic sleep fragmentation. Oncotarget. 2016;7(34):54676–54690. doi: 10.18632/oncotarget.10578. [DOI] [PMC free article] [PubMed] [Google Scholar]
- 41.Almendros I, Khalyfa A, Trzepizur W, Gileles-Hillel A, Huang L, Akbarpour M, et al. Tumor Cell Malignant Properties Are Enhanced by Circulating Exosomes in Sleep Apnea. Chest. 2016;150(5):1030–1041. doi: 10.1016/j.chest.2016.08.1438. [DOI] [PubMed] [Google Scholar]
- 42.Lotvall J, Hill AF, Hochberg F, Buzas EI, Di Vizio D, Gardiner C, et al. Minimal experimental requirements for definition of extracellular vesicles and their functions: a position statement from the International Society for Extracellular Vesicles. Journal of extracellular vesicles. 2014;3:26913. doi: 10.3402/jev.v3.26913. [DOI] [PMC free article] [PubMed] [Google Scholar]
- 43.Carreras A, Zhang SX, Peris E, Qiao Z, Wang Y, Almendros I, et al. Effect of resveratrol on visceral white adipose tissue inflammation and insulin sensitivity in a mouse model of sleep apnea. International journal of obesity. 2015;39(3):418–23. doi: 10.1038/ijo.2014.181. [DOI] [PubMed] [Google Scholar]
- 44.Zhang SX, Khalyfa A, Wang Y, Carreras A, Hakim F, Neel BA, et al. Sleep fragmentation promotes NADPH oxidase 2-mediated adipose tissue inflammation leading to insulin resistance in mice. International journal of obesity. 2014;38(4):619–24. doi: 10.1038/ijo.2013.139. [DOI] [PMC free article] [PubMed] [Google Scholar]
- 45.Gharib SA, Khalyfa A, Abdelkarim A, Bhushan B, Gozal D. Integrative miRNA-mRNA profiling of adipose tissue unravels transcriptional circuits induced by sleep fragmentation. PLoS One. 2012;7(5):e37669. doi: 10.1371/journal.pone.0037669. [DOI] [PMC free article] [PubMed] [Google Scholar]
- 46.Poroyko VA, Carreras A, Khalyfa A, Khalyfa AA, Leone V, Peris E, et al. Chronic Sleep Disruption Alters Gut Microbiota, Induces Systemic and Adipose Tissue Inflammation and Insulin Resistance in Mice. Scientific reports. 2016;6:35405. doi: 10.1038/srep35405. [DOI] [PMC free article] [PubMed] [Google Scholar]
- 47.Gozal D, Khalyfa A, Qiao Z, Akbarpour M, Maccari R, Ottana R. Protein-Tyrosine Phosphatase-1B Mediates Sleep Fragmentation-Induced Insulin Resistance and Visceral Adipose Tissue Inflammation in Mice. Sleep. 2017 doi: 10.1093/sleep/zsx111. [DOI] [PubMed] [Google Scholar]
- 48.Murphy AM, Thomas A, Crinion SJ, Kent BD, Tambuwala MM, Fabre A, et al. Intermittent hypoxia in obstructive sleep apnoea mediates insulin resistance through adipose tissue inflammation. Eur Respir J. 2017;49(4) doi: 10.1183/13993003.01731-2016. [DOI] [PubMed] [Google Scholar]
- 49.Gozal D, Gileles-Hillel A, Cortese R, Li Y, Almendros I, Qiao Z, et al. Visceral White Adipose Tissue after Chronic Intermittent and Sustained Hypoxia in Mice. Am J Respir Cell Mol Biol. 2017;56(4):477–487. doi: 10.1165/rcmb.2016-0243OC. [DOI] [PubMed] [Google Scholar]
- 50.Gileles-Hillel A, Almendros I, Khalyfa A, Nigdelioglu R, Qiao Z, Hamanaka RB, et al. Prolonged Exposures to Intermittent Hypoxia Promote Visceral White Adipose Tissue Inflammation in a Murine Model of Severe Sleep Apnea: Effect of Normoxic Recovery. Sleep. 2017;40(3) doi: 10.1093/sleep/zsw074. [DOI] [PubMed] [Google Scholar]
- 51.Almendros I, Gileles-Hillel A, Khalyfa A, Wang Y, Zhang SX, Carreras A, et al. Adipose tissue macrophage polarization by intermittent hypoxia in a mouse model of OSA: effect of tumor microenvironment. Cancer letters. 2015;361(2):233–9. doi: 10.1016/j.canlet.2015.03.010. [DOI] [PubMed] [Google Scholar]
- 52.Carreras A, Zhang SX, Almendros I, Wang Y, Peris E, Qiao Z, et al. Resveratrol attenuates intermittent hypoxia-induced macrophage migration to visceral white adipose tissue and insulin resistance in male mice. Endocrinology. 2015;156(2):437–43. doi: 10.1210/en.2014-1706. [DOI] [PMC free article] [PubMed] [Google Scholar]
- 53.Roma-Rodrigues C, Fernandes AR, Baptista PV. Exosome in tumour microenvironment: overview of the crosstalk between normal and cancer cells. BioMed research international. 2014;2014:179486. doi: 10.1155/2014/179486. [DOI] [PMC free article] [PubMed] [Google Scholar]
- 54.Masa JF, Corral J, Alonso ML, Ordax E, Troncoso MF, Gonzalez M, et al. Efficacy of Different Treatment Alternatives for Obesity Hypoventilation Syndrome. Pickwick Study. Am J Respir Crit Care Med. 2015;192(1):86–95. doi: 10.1164/rccm.201410-1900OC. [DOI] [PubMed] [Google Scholar]
- 55.Drager LF, Polotsky VY, O’Donnell CP, Cravo SL, Lorenzi-Filho G, Machado BH. Translational approaches to understanding metabolic dysfunction and cardiovascular consequences of obstructive sleep apnea. Am J Physiol Heart Circ Physiol. 2015;309(7):H1101–11. doi: 10.1152/ajpheart.00094.2015. [DOI] [PMC free article] [PubMed] [Google Scholar]
- 56.Kent BD, McNicholas WT, Ryan S. Insulin resistance, glucose intolerance and diabetes mellitus in obstructive sleep apnoea. Journal of thoracic disease. 2015;7(8):1343–57. doi: 10.3978/j.issn.2072-1439.2015.08.11. [DOI] [PMC free article] [PubMed] [Google Scholar]
- 57.Hotta K, Funahashi T, Arita Y, Takahashi M, Matsuda M, Okamoto Y, et al. Plasma concentrations of a novel, adipose-specific protein, adiponectin, in type 2 diabetic patients. Arterioscler Thromb Vasc Biol. 2000;20(6):1595–9. doi: 10.1161/01.atv.20.6.1595. [DOI] [PubMed] [Google Scholar]
- 58.Lindsay RS, Funahashi T, Hanson RL, Matsuzawa Y, Tanaka S, Tataranni PA, et al. Adiponectin and development of type 2 diabetes in the Pima Indian population. Lancet. 2002;360(9326):57–8. doi: 10.1016/S0140-6736(02)09335-2. [DOI] [PubMed] [Google Scholar]
- 59.Verges B, Guiu B, Cercueil JP, Duvillard L, Robin I, Buffier P, et al. Retinol-binding protein 4 is an independent factor associated with triglycerides and a determinant of very low-density lipoprotein-apolipoprotein B100 catabolism in type 2 diabetes mellitus. Arterioscler Thromb Vasc Biol. 2012;32(12):3050–7. doi: 10.1161/ATVBAHA.112.255190. [DOI] [PubMed] [Google Scholar]
- 60.Raposo G, Stoorvogel W. Extracellular vesicles: exosomes, microvesicles, and friends. The Journal of cell biology. 2013;200(4):373–83. doi: 10.1083/jcb.201211138. [DOI] [PMC free article] [PubMed] [Google Scholar]
- 61.Mahat B, Chasse E, Mauger JF, Imbeault P. Effects of acute hypoxia on human adipose tissue lipoprotein lipase activity and lipolysis. Journal of translational medicine. 2016;14(1):212. doi: 10.1186/s12967-016-0965-y. [DOI] [PMC free article] [PubMed] [Google Scholar]
- 62.Weiszenstein M, Shimoda LA, Koc M, Seda O, Polak J. Inhibition of Lipolysis Ameliorates Diabetic Phenotype in a Mouse Model of Obstructive Sleep Apnea. Am J Respir Cell Mol Biol. 2016;55(2):299–307. doi: 10.1165/rcmb.2015-0315OC. [DOI] [PMC free article] [PubMed] [Google Scholar]
- 63.Briancon-Marjollet A, Monneret D, Henri M, Hazane-Puch F, Pepin JL, Faure P, et al. Endothelin regulates intermittent hypoxia-induced lipolytic remodelling of adipose tissue and phosphorylation of hormone-sensitive lipase. The Journal of physiology. 2016;594(6):1727–40. doi: 10.1113/JP271321. [DOI] [PMC free article] [PubMed] [Google Scholar]
- 64.Chopra S, Rathore A, Younas H, Pham LV, Gu C, Beselman A, et al. Obstructive Sleep Apnea Dynamically Increases Nocturnal Plasma Free Fatty Acids, Glucose, and Cortisol during Sleep. The Journal of clinical endocrinology and metabolism. 2017 doi: 10.1210/jc.2017-00619. [DOI] [PMC free article] [PubMed] [Google Scholar]
- 65.Smith JA, Leonardi T, Huang B, Iraci N, Vega B, Pluchino S. Extracellular vesicles and their synthetic analogues in aging and age-associated brain diseases. Biogerontology. 2015;16(2):147–85. doi: 10.1007/s10522-014-9510-7. [DOI] [PMC free article] [PubMed] [Google Scholar]
- 66.Phoonsawat W, Aoki-Yoshida A, Tsuruta T, Sonoyama K. Adiponectin is partially associated with exosomes in mouse serum. Biochem Biophys Res Commun. 2014;448(3):261–6. doi: 10.1016/j.bbrc.2014.04.114. [DOI] [PubMed] [Google Scholar]
- 67.Sano S, Izumi Y, Yamaguchi T, Yamazaki T, Tanaka M, Shiota M, et al. Lipid synthesis is promoted by hypoxic adipocyte-derived exosomes in 3T3-L1 cells. Biochem Biophys Res Commun. 2014;445(2):327–33. doi: 10.1016/j.bbrc.2014.01.183. [DOI] [PubMed] [Google Scholar]
- 68.Muller G. Let’s shift lipid burden--from large to small adipocytes. Eur J Pharmacol. 2011;656(1–3):1–4. doi: 10.1016/j.ejphar.2011.01.035. [DOI] [PubMed] [Google Scholar]
- 69.Kikuchi R, Tsuji T, Watanabe O, Yamaguchi K, Furukawa K, Nakamura H, et al. Hypercapnia Accelerates Adipogenesis: A Novel Role of High CO2 in Exacerbating Obesity. Am J Respir Cell Mol Biol. 2017;57(5):570–580. doi: 10.1165/rcmb.2016-0278OC. [DOI] [PubMed] [Google Scholar]
- 70.Goldbart AD, Row BW, Kheirandish-Gozal L, Cheng Y, Brittian KR, Gozal D. High fat/refined carbohydrate diet enhances the susceptibility to spatial learning deficits in rats exposed to intermittent hypoxia. Brain Res. 2006;1090(1):190–6. doi: 10.1016/j.brainres.2006.03.046. [DOI] [PubMed] [Google Scholar]
- 71.Gozal D, Nair D, Goldbart AD. Physical activity attenuates intermittent hypoxia-induced spatial learning deficits and oxidative stress. Am J Respir Crit Care Med. 2010;182(1):104–12. doi: 10.1164/rccm.201001-0108OC. [DOI] [PMC free article] [PubMed] [Google Scholar]
Associated Data
This section collects any data citations, data availability statements, or supplementary materials included in this article.
Supplementary Materials
Schematic Illustration of experimental design for human and murine studies. Plasma was isolated from each subject or each mice and equal volume for each sample was used to isolate circulating exosomes. Human subjects with obesity hypoventilation syndrome (OHS) contain both male and female, and each subject was treated with CPAP for 2-, 12M and 24-M. For animal model with OSA using two different paradigms including sleep fragmentation (SF) and intermittent hypoxia (IH) for the following time points of exposures (1day, 1wks, 2wks, 6wks, and 20wks), as well as control for each time point. Mice were used were all male.
Flow cytometry detection of surface molecules on exosomes derived from human subjects with OHS. Bead flow separation data for exosomes analyzed using the various capture antibodies followed by Exo-FITC staining. The data are graphed showing forward scatter versus FITC intensity. The first panel depicts beads with no exosomes then with exosomes. The degree of flow separation is shown on the right side for each capture set. The flow cytometry analysis of purified exosome following specific isolation with magnetic beads stained with anti-CD9, CD31, HLA-G and Rab5b using FACS analysis (FACSCalibur) instrument. The Exo-Flow magnetic stand for exosome separation and FACS analysis showing the absence of exosomes (negative, Green color) and the presence of exosomes (positive, Red color) beads are displayed on the FACS plot. The FITC flow cytometric intensities are then plotted versus the number of exosome particles input into the flow reaction, n=6 for each antibody. The FITC flow cytometric intensities are then plotted versus the number of exosome particles input into the flow reaction. The data are graphed showing forward scatter versus FITC intensity. The FITC flow cytometric intensities are then plotted versus the number of exosome particles input into the flow reaction
Flow cytometry detection of surface molecules on exosomes derived from mice either exposed to SF or IH. The data are graphed showing forward scatter versus FITC intensity. The first panel depicts beads with no exosomes then with exosomes. The degree of flow separation is shown on the right side for each capture set. The flow cytometry analysis of purified exosome following specific isolation with magnetic beads stained with anti-CD9, CD31, HLA-G and Rab5b using FACS analysis (FACSCalibur) instrument. The Exo-Flow magnetic stand for exosome separation and FACS analysis showing the absence of exosomes (negative, Green color) and the presence of exosomes (positive, Red color) beads are displayed on the FACS plot. The FITC flow cytometric intensities are then plotted versus the number of exosome particles input into the flow reaction, n=6 for each antibody.
Confocal microscope images illustrating exosome uptake into murine adipocytes cells. Exosomes were isolated from mice exposed to SF or IH and labeled with the PKH67 Green Fluorescent Cell Linker Kit, Exo-Red, and Exo-Green. Panel (A) is a representative images of murine differentiated adipocytes cells were grown on coverslips for 24 h and the labeled exosomes with PKH67 were added to the cells for 6 h at 37°C. Panel (B) is a representative image of differentiated adipocytes (3T3-L1) and the labeled exosomes with Exo-Red. Panel (C) is a representative image differentiated adipocytes (3T3-L1) and the labeled exosomes with Exo-Green. Cells were washed and stained with nuclei (blue) stained with DAPI, n=6, scale bar in 10 μm. As controls, PKH67, Exo-Red or Exo-Green were added, but in the absence of exosomes. The differential interference contrast (DIC) was used to visual the morphology of the cells without fluorescence.


