Significance
Reports of copy number variations (CNVs) within single human brain cells have been limited to megabase-scale alterations in relatively few cells, leaving unclear when CNVs first arise and whether their generation is regulated. Answering these questions has been limited by an absence of experimentation with model organisms that allow developmental assessments infeasible with human samples. Here, we identify the existence and developmental dynamics of cerebral cortical CNVs in mouse, showing that their prevalence increases through midneurogenesis. Our improved sequencing approach also allowed characterization of previously undocumented neural CNVs below 1 Mb in size, comprising half of all alterations. These data demonstrate the existence of myriad CNVs, which genomically diversify neural cells before incorporation into the mature organization of the brain.
Keywords: single-cell sequencing, CNV, genomic mosaicism, brain development, machine learning
Abstract
Somatic copy number variations (CNVs) exist in the brain, but their genesis, prevalence, forms, and biological impact remain unclear, even within experimentally tractable animal models. We combined a transposase-based amplification (TbA) methodology for single-cell whole-genome sequencing with a bioinformatic approach for filtering unreliable CNVs (FUnC), developed from machine learning trained on lymphocyte V(D)J recombination. TbA–FUnC offered superior genomic coverage and removed >90% of false-positive CNV calls, allowing extensive examination of submegabase CNVs from over 500 cells throughout the neurogenic period of cerebral cortical development in Mus musculus. Thousands of previously undocumented CNVs were identified. Half were less than 1 Mb in size, with deletions 4× more common than amplification events, and were randomly distributed throughout the genome. However, CNV prevalence during embryonic cortical development was nonrandom, peaking at midneurogenesis with levels triple those found at younger ages before falling to intermediate quantities. These data identify pervasive small and large CNVs as early contributors to neural genomic mosaicism, producing genomically diverse cellular building blocks that form the highly organized, mature brain.
Cellular diversity in the brain has long been recognized; however, its basis is incompletely understood. A variable that may contribute to diversity is genomic mosaicism (GM): intraindividual cell-to-cell DNA variability (1, 2). Neural GM was first identified as aneuploidies, the largest form of copy number variations (CNVs), with smaller CNVs, retrotransposition events, and single-nucleotide variations (SNVs) reported subsequently (3–7). GM was initially characterized by chromosomal approaches like spectral karyotyping as well as fluorescent in situ hybridization (1, 2, 6–8) and flow cytometry that reported DNA content variation (9). More recently, advances in single-cell whole-genome sequencing (scWGS) have offered DNA sequence information across the genome within single cells (10, 11), making feasible the investigation of CNVs.
Indeed, several recent studies have reported somatic CNVs in adult human cerebral cortical neurons (12–14). However, these studies reported variable findings—a range of 0.2–3.4 CNVs per cell affecting between 9 and 68% of neurons—and no CNVs below 2 Mb (12–14). These discrepancies could be due to multiple factors, including different sample types and preparations, nonstandardized informatics, and an absence of somatically generated CNV positive controls. Furthermore, limitations of using human brain have precluded a rigorous assessment of developmental variation in CNVs. Use of Mus musculus as a model system could provide developmental insights into the generation of neural CNVs. However, mouse brain analyses by scWGS have been limited to a single study of 159 cells of unclear developmental age and neuroanatomical origin (15).
When do neural CNVs arise? What sizes and forms do they take? Does their production vary developmentally? To answer these basic questions of mosaic CNV generation, we combined DNA amplification [transposase-based amplification (TbA)] and data analysis [filtering unreliable CNVs (FUnC)] methods that enabled examination of hundreds of single cells from the fetal mouse cerebral cortex throughout neurogenesis [from embryonic day 11.5 (E11.5) to E19.5] (16), a period that is known to be associated with GM through neural progenitor cell (NPC) aneuploidies (6, 7, 17). Generation and analysis of ∼500 single-cell datasets from NPCs, adult cortical neurons, and splenocyte controls (Table 1) identified thousands of CNVs at or below 1 Mb. CNVs were distributed throughout the genome, yet showed quantitative variation during key stages of development.
Table 1.
Samples prepared and analyzed for somatic CNVs
| Group | Animals* | Method | Samples amplified/analyzed | No. of CNVs |
| E11.5 | 5 | TbA | 44/38 | 232 |
| E12.5 | 4 | GP | 39/28 | 227 |
| TbA | 38/28 | 314 | ||
| E13.5 | 14 | GP | 35/29 | 120 |
| TbA | 74/56 | 1093 | ||
| E14.5 | 8 | GP | 37/26 | 134 |
| TbA | 74/56 | 1093 | ||
| E16.5 | 5 | TbA | 46/39 | 540 |
| E19.5 | 4 | TbA | 47/32 | 302 |
| Adult neurons | 1 | TbA | 59/55 | 524 |
| Splenic cells | 2 | GP | 28/9 | 25 |
| TbA | 129/188 | 837 | ||
| Totals | 43 | GP | 139/92 | 506 |
| TbA | 519/396 | 4888 | ||
| All | 658/488 | 5394 |
Samples analyzed/amplified indicates both to the total number of datasets produced and the number passing QC requirements (Reads > 600,000; MAPD < 0.40; confidence score > 0.80). GP, GenomePlex (Sigma).
Multiple brains from one litter were pooled for embryonic samples.
Results
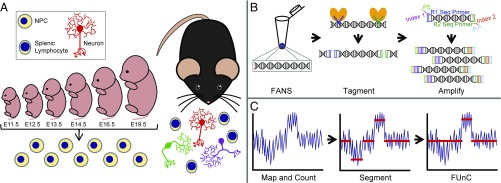
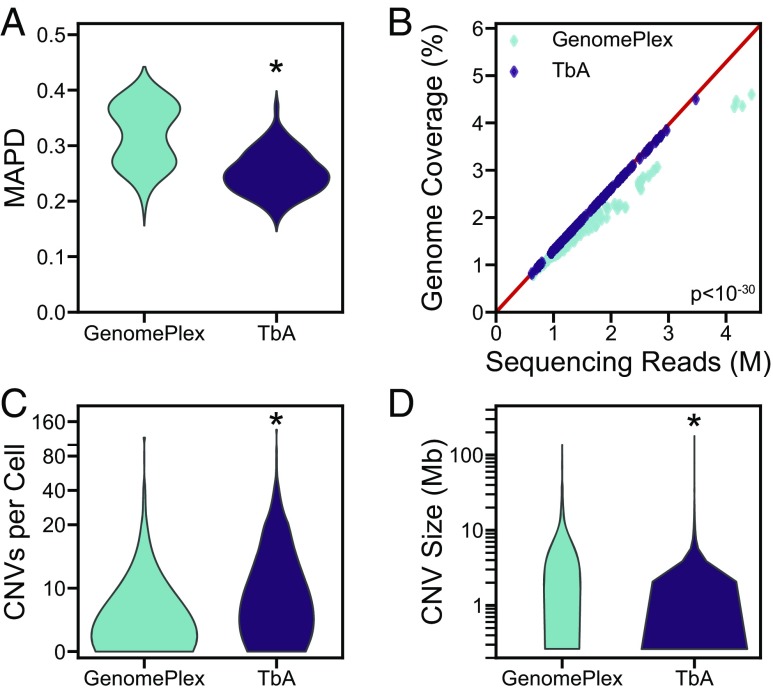
To obtain a rigorous assessment of CNV presence in the developing cerebral cortex, samples were obtained from 43 animals, primarily fetal cortices from timed-pregnant mice throughout the period of cerebral cortical neurogenesis, along with samples of cortical neurons and splenocytes from adults for control comparison (Fig. 1A). The DNA from a total of 658 single cells was amplified, from which 488 cells passed dataset quality controls (QCs) for further interrogations (Table 1). To obtain sufficient DNA from a single cell for sequencing, we utilized TbA, which integrates whole-genome amplification and sequencing library preparation, analogous to optimizing the Nextera library preparation approach for scWGS applications (Fig. 1B). To assess the appropriateness of this method for accurate identification of CNVs, we compared samples collected from the same biological preparation but amplified by TbA vs. GenomePlex (Sigma), as the latter kit has been the most widely applied amplification methodology for CNV analysis in neural tissue (12–15). TbA generated datasets with consistently lower noise (Fig. 2A), which appears to be due to increased library complexity as indicated by higher genomic coverage per read (Fig. 2B). This allowed more and smaller CNVs to be identified when using TbA (Fig. 2 C and D).
Fig. 1.
Overview of study design and methods. (A) An extensive range of murine tissue samples was collected for analysis, including NPCs at six embryonic ages, adult cortical neurons, and adult splenocytes. (B) The TbA method to amplify genomic DNA was performed on single nuclei isolated by FANS, which involves tagmentation—enzymatic DNA fragmentation via insertion of universal sequencing adapters—followed by PCR with unique sample indexes. (C) Bioinformatic processing of data begins with calculating sequencing depth in ∼0.1-Mb genomic regions, followed by CNV calling with the CBS algorithm, and finished with application of FUnC, which removes CNV calls that do not conform sufficiently to an integer copy number state.
Fig. 2.
TbA improves CNV detection capabilities. Comparisons were made between nuclei isolated from the same biological preparations and amplified using either the GenomePlex method from Sigma (n = 91) or TbA (n = 155). (A) Noise, measured by MAPD, is lower when using TbA. (B) This corresponds with increased genomic coverage. The red line shows the maximum coverage possible, to which TbA samples conform closely. The use of degenerate oligonucleotides for PCR in GenomePlex is less able to amplify unique genomic regions. (C and D) TbA detects more CNVs per cell (C) because many more small CNVs can be identified with the reduced noise (D). *P < 10−8.
While developing our data analysis pipeline, we discovered that cells with highly altered genomes were erroneously subject to being discarded by several widely applied QC noise metrics (12–15). Specifically, male samples exhibited consistently higher values for two noise measurements, median absolute difference (MAD) and variability score (VS) (SI Appendix, Fig. S1A). This was caused by a systematically higher variability in normalized read depth across the monosomic X chromosome (SI Appendix, Fig. S1B). This increased noise appeared to be a technical artifact of hypoploidy: when data from two separately amplified, monosomic X chromosomes were combined, there was a reduction in read depth fluctuations to that of a disomic, female X chromosome (SI Appendix, Fig. S1C). This phenomenon was confirmed by analyzing independently generated aneuploid datasets (SRP041670; NCBI SRA) (15); cells containing at least one hypoploidy had significantly higher MAD and VS scores (SI Appendix, Fig. S1D). These results suggest that independent amplification of homologous chromosomes creates an averaging effect that produces a reduced error profile for disomic chromosomes. Since the median absolute pairwise difference (MAPD) noise statistic was the least impacted by hypoploidy across all assessments, it was selected for noise quantification in subsequent analyses (18).
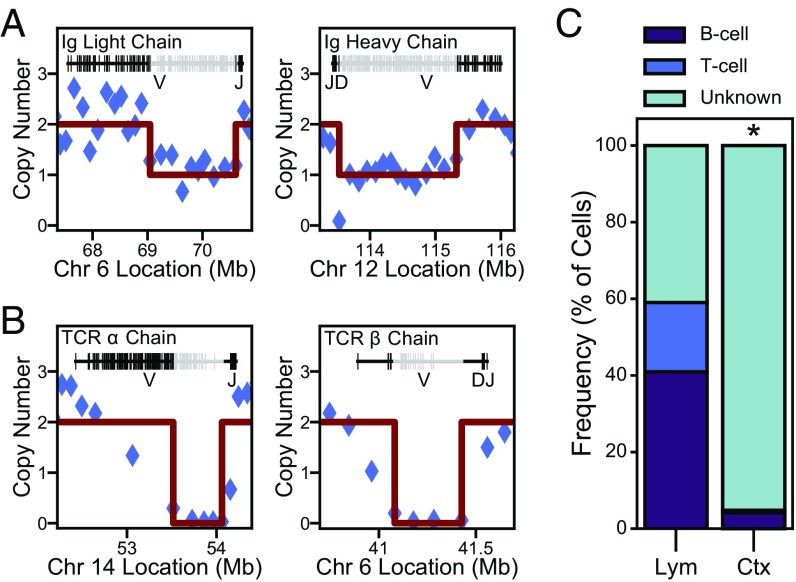
Use of appropriate controls is critical in scWGS because the methodology destroys the original template, precluding direct replication of findings. Prior scWGS studies have used cells with constitutively present CNVs or aneuploidies to assess technical sensitivity (12–15, 19–21); however, constitutive CNVs are not somatically produced and may create analytical bias for the detection of a singular form of identical size and genomic location. We therefore established a positive control for stochastically generated CNVs by using splenic immune cells, which include B and T lymphocytes that have undergone somatic DNA recombination by means of V(D)J recombination and (for B cells) heavy chain class switching. Blinded assessments of these cells identified deletions (≤2.5 Mb) mapping to the known V(D)J recombination loci for B and T cells (Fig. 3), including the expected size range and chromosomal location. A total of 68 distinct recombination events were identified in 51 TbA-amplified splenocytes, forming the largest stochastically generated positive control dataset involving normal (not genetically diseased) cells to calibrate identification of somatic, neural CNVs. These controls were used both to determine appropriate QC thresholds (SI Appendix, Fig. S2) and to characterize the appearance of genuine CNV events.
Fig. 3.
Identification of somatic V(D)J recombination in lymphocytes. (A) A B cell identified by deletions in Ig light and heavy chain regions. (B) A T cell identified by deletions in the T cell receptor variable loci. This example shows biallelic deletion (copy number = 0), which was observed for select B and T cells and is consistent with nonproductive recombination in overlapping regions. (C) The majority of splenocytes (Lym, n = 105) are classified as either B or T cells, while cortical cells of all ages assessed (Ctx, n = 438) are not. The small population of cortical cells exhibiting deletions in V(D)J loci are artifactually due to low-quality data (see SI Appendix, Figs. S2E and S3C after removal of such instances). *P < 10−30.
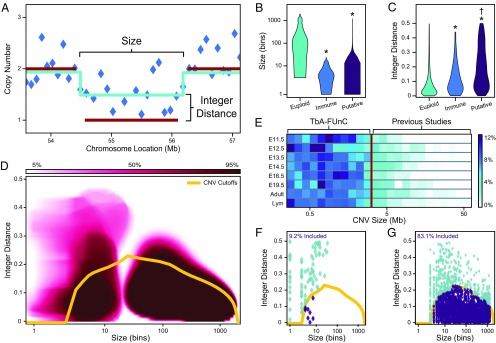
Another major challenge in scWGS is identifying and excluding false positives; therefore, FUnC was developed to filter unreliable CNV calls (Fig. 1C). Size has typically been the primary factor in removing uncertain CNV calls (12–14, 20) (Fig. 4A). However, V(D)J recombination events are comparatively small (Fig. 4B), and essentially all would be excluded by applying the previously published size cutoffs. To overcome this problem, we introduced the metric integer distance (intD), which reflects the difference between sequencing depth and integer copy number (Fig. 4A). Smaller values indicate higher quality. intD is typically close to 0 for positive controls of V(D)J recombination and euploid regions, but is higher for novel CNV calls, which are a mixture of genuine alterations and false positives (Fig. 4C).
Fig. 4.
Machine learning on true positive copy number assignments allows reliable analysis of sub-Mb somatic CNVs. (A) Illustration of metrics used to describe CNV calls. Size is measured in “bins,” ∼0.1-Mb intervals of equal mappability (blue diamonds). The pale blue lines show the average read-depth in segments (contiguous regions predicted to have the same copy number state by the circular binary segmentation algorithm), and the dark red lines show the predicted copy number states; intD is the difference between these lines. (B and C) Segment size (B) and intD (C) follow distinct distributions for euploid genomic regions (n = 3,174), immune recombination events (n = 68), and putative CNVs (n = 1,711). (D) Results after 10,000 iterations of building one-class support vector machines by bootstrapping the immune recombination events or euploid regions. Darker background colors indicate more frequent model inclusion; the creation of separate models accounts for the artificial gap between small and large sizes. The yellow line is a combined 95% confidence interval, used by FUnC as the maximum allowable intD for a given CNV size. (E) CNV size distributions for all biological groups assessed. The red line indicates the interpreted average minimum size of previously reported neural CNVs (3.5 Mb), which excludes >85% of CNVs identified here. Sample sizes are listed in Table 1. (F and G) Computationally simulated false positives (F; n = 87) rarely pass FUnC while simulated true positive CNVs (G; n = 2,910) fit well within the reliable-CNV bounds. *P < 0.0001 vs. euploid; †P < 10−6 vs. immune.
We then employed a machine-learning approach to combine size and intD in an unbiased, nonlinear fashion. Separate models were built from euploid and V(D)J segments (from distinct chromosomal loci for Ig or T cell receptor recombination) with bagging (bootstrap aggregation) of one-class support vector machines (SVMs) to define the variable space within which reliable CNV calls appeared (Dataset S1). FUnC uses the 95% confidence interval around these models as cutoffs to assess the validity of CNV calls made by circular binary segmentation (CBS) (Fig. 4D and Dataset S2). Differences in intD were minimized after FUnC, but size distributions were nominally impacted (SI Appendix, Fig. S3 A and B). Critically, this strategy enabled assessment of CNVs as small as 0.25 Mb, an order of magnitude smaller than most previous reports (average ∼3.5 Mb) (12–14). TbA combined with FUnC identified myriad CNVs during cortical neurogenesis, only 12% of which were ≥3.5 Mb (Fig. 4E and Dataset S3).
We obtained multiple lines of evidence to validate use of FUnC. First, FUnC had little impact on our ability to classify splenocytes (SI Appendix, Fig. S3C). Second, splenocytes prepared by a different researcher after FUnC development showed a high rate of positive control CNV inclusion (SI Appendix, Fig. S3D). Third, when analyzing an independent dataset (SRP041670; NCBI SRA) (13), FUnC retained nearly all constitutive, validated CNVs from characterized cell lines (SI Appendix, Fig. S3E) and excluded a majority of likely false-positive CNVs (SI Appendix, Fig. S3F). Fourth, simulated datasets were created to generate large numbers of false-and true-positive CNVs (Datasets S4 and S5). FUnC eliminated 90.8% of false positives, reducing the false discovery rate from 56.2 to 4.9% (Fig. 4F). In contrast, only 16.9% of true positives were excluded by FUnC, causing the false-negative rate to increase from 16.0 to 30.2% (Fig. 4G).
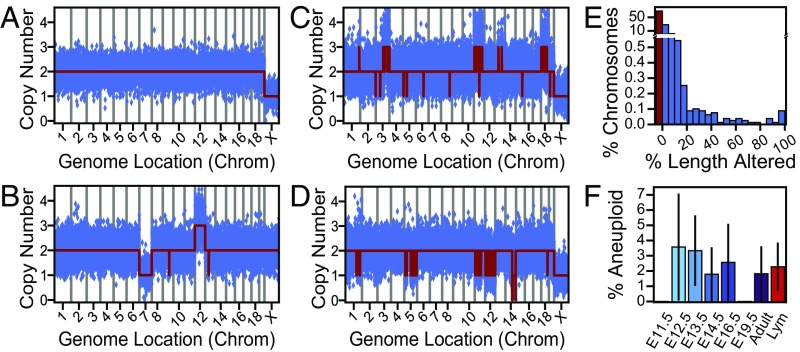
Our large sample size and moderate sequencing depth provided an opportunity to assess a topic of controversy, aneuploidy in nonmitotic NPCs. The gender of nonmitotic (interphase and postmitotic) cells and nuclei—which contain uncondensed DNA and an intact nuclear envelope sufficient to allow fluorescence-activated nuclear sorting (FANS)—could be clearly identified by sex chromosome aneuploidies (male) (Fig. 5A). These samples also produced identifiable but rare cells that were fully aneuploid (two cells) (Fig. 5B), consistent with the pattern predicted by metaphase spread imaging. However, cells much more often displayed one or more of what could be called “fragmented aneuploidies”: numerous CNVs along large, distinct chromosome regions, reminiscent of chromothryptic chromosomes in RPE-1 cell lines (5) (Fig. 5 C and D). If aneuploidy arbitrarily included cells with ≥50% of a chromosome altered (14), aneuploidy rates increased threefold, to ∼2% of all cells (Fig. 5 E and F), with higher frequencies at younger ages consistent with prior studies (2, 6, 7).
Fig. 5.
Aneuploidy follows a fragmented pattern. (A) A euploid male cell, where monosomy X is identified as a single copy number state. (B) An E16.5 NPC with classical, whole-chromosome aneuploidy. (C and D) Numerous CNVs along distinct chromosomes—fragmented aneuploidies—creates either apparent hyperploidies (C) or hypoploidies (D). (E) The amount of a chromosome altered by CNVs forms a continuous distribution (n = 7,920; chromosomes from all high-quality TbA-amplified samples). (F) Aneuploidy rates when considering chromosomes with ≥50% amplified or deleted to be aneuploid. Error bars show SEM; sample sizes are listed in Table 1.
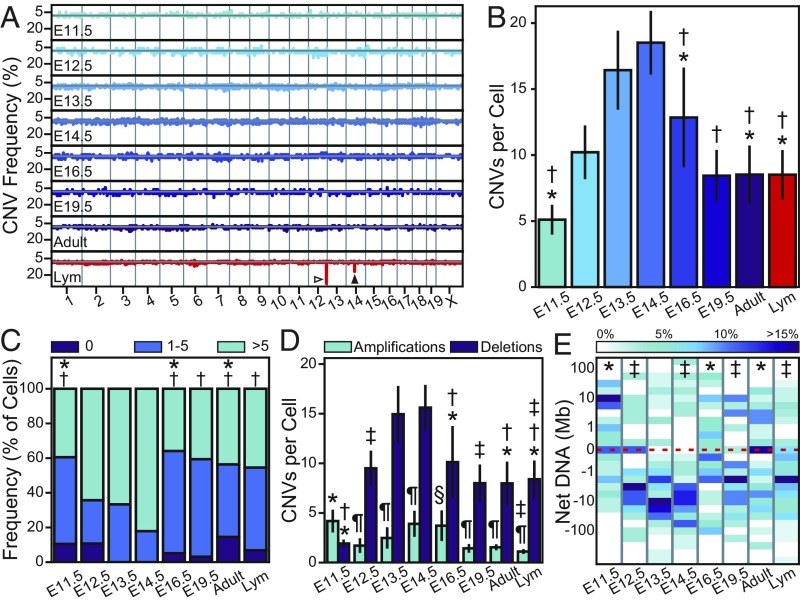
Cortical CNVs followed a genome-wide, apparently random distribution, in clear contrast with V(D)J recombination (Fig. 6A). The absence of obvious genomic hot spots affected by CNVs was confirmed by hierarchical clustering of genome-wide copy number profiles: only B and T cell loci formed compelling clusters (SI Appendix, Fig. S4). Likewise, dimensionality reduction of the genomic element composition of CNV loci could not distinguish between sample types any better when using true data than randomly selected genomic regions (SI Appendix, Fig. S5 A and B). Lymphocyte deletions showed elevated vertebrate evolutionary conservation because of the highly conserved recombination signal sequences in V(D)J loci (SI Appendix, Fig. S5D) (22, 23). At younger ages, amplification events were weakly enriched for S-phase genomic regions associated with early DNA replication, consistent with the increased proportion of proliferating NPCs at such ages (SI Appendix, Fig. S5C) (24). Otherwise, only centromeres and telomeres were consistently more affected by CNVs than expected by chance.
Fig. 6.
CNVs are generated and developmentally varied during cortical neurogenesis. (A) The frequency with which each genomic locus is affected by an amplification (above the gray line) or deletion (below the gray line) event. The Ig heavy chain and TCR α chain are indicated by open and closed arrowheads, respectively. (B) The number of CNVs per cell increases through E14.5. (C) The proportion of cells containing 0, moderate (≤5), or extreme CNV numbers. (D) Amplification and deletion events per cell showing a preference for DNA loss. (E) Heatmap of net DNA change per cell. The dashed line indicates 0, an equal quantity of DNA amplified and deleted. All error bars show SEM; sample sizes are listed in Table 1; *P < 0.05 vs. E13.5; †P < 0.01 vs. E14.5; ‡P < 0.01 vs. E11.5; §P < 0.01 vs. Lym; ¶P < 0.001 vs. deletions.
The most remarkable aspect of CNV prevalence was variation during cerebral cortical neurogenesis. The number of CNVs per cell increased until midneurogenesis (E14.5), peaking at double the average adult neuron rate, and triple that observed at E11.5 (Fig. 6B). Over 93% of samples contained one or more CNVs, and elevated rates corresponded with an increase in the proportion of cells containing high, rather than moderate, numbers of CNVs (Fig. 6C). While both amplifications and deletions increased with CNV frequency, deletions predominated (Fig. 6D) and produced a cumulative DNA loss from E12.5 to E14.5 (Fig. 6E). Multiple biological preparations of E13.5, E14.5, and lymphocyte samples confirmed the differences among age groups (SI Appendix, Fig. S6).
Discussion
The use of both the TbA whole-genome amplification technique and unbiased modeling of true positive CNVs (to create FUnC) expanded the range of detectable neural GM, particularly allowing the identification of submegbase (sub-Mb) CNVs that were invisible to previous approaches and revealing many more CNV-positive neural cells than previously recognized. It is virtually certain that even more CNVs exist below 0.25 Mb, especially considering the nonidentical alterations (e.g., SNVs) observed by higher depth sequencing after massive amplification or clonal expansion (4, 25).
Within the field of single-cell genomics, there has been a trend toward collecting ultra-low-coverage data to screen very large numbers of cells for CNVs (20, 26). This approach is advantageous when CNVs are prevalent, large, and clonal. That does not describe the characteristics that we have observed in cortical samples, where nearly half of all CNVs were small; medium-resolution, low-noise data were essential to identify such alterations. CNVs have been considered by some as unimportant for neuroscience (13, 15, 20) based upon studies limited to multimegabase-sized CNVs. However, our findings support a marked prevalence of sub-Mb alterations, suggesting their potential to alter neural phenotypes. Indeed, proof-of-concept for physiological roles of small, somatically arising mosaic CNVs was reported in sporadic Alzheimer’s disease neurons through CNV gains in the pathogenic gene, amyloid precursor protein (APP) (3), presaging roles for this and other small CNVs in brain development, function, and disease.
The observed developmental differences in CNV prevalence have parallels to DNA double-strand break generation, programmed cell death, and aneuploidy. Nonhomologous end joining (NHEJ) proteins are essential for viable cortical neurogenesis at similar developmental stages as the peak in CNV prevalence and can play a role in CNV generation (5, 8, 27, 28). Further research to elucidate the potential mechanistic involvement of NHEJ pathways in cortical CNV presence could provide insights into the importance of these somatic alterations.
Programmed cell death is elevated around E14 in the cortex (17, 29), and while the CNVs reported here are much larger than DNA fragments associated with apoptosis (29), some cells with a high CNV burden probably die (17, 30). Cell death might in part explain the developmental reduction in CNVs reported here. In further support of this relationship, very large CNVs that are aneuploidies (2) are altered in form and number by inhibiting apoptosis via caspase genetic deletion or pharmacological inhibition (30). Notably, the peaks of programmed cell death (17, 29) and CNV prevalence coincide, implicating a relationship between these two phenomena in the embryonic cerebral cortex. The genome-wide location of CNVs throughout neurogenesis does not point to a specific locus promoting cell death, being more consistent with the concept of a quantitative threshold of CNV production beyond which cell death occurs.
Aneuploidy, as detected in metaphase spreads, is not only altered by cell death, but also prevalent in the embryonic cortex (∼30% of NPC metaphase spreads) and preferentially involves DNA loss (1, 6, 7). The relationship between aneuploidy in metaphase spreads versus interphase scWGS is unknown; however, similarities between rates of metaphase spread aneuploidies and CNVs reported here along with the mutual preference for DNA loss, support an association between previously reported aneuploidies and the CNVs identified in this study. To match the reported metaphase aneuploidy rates (7, 30), nonmitotic chromosomes with ≥2% of their length affected by CNVs would need to be considered aneuploid. The relationship between the historical gold standard of metaphase spread aneuploidy and nonmitotic, TbA-identified fragmented aneuploidy is not known. However, it is conceivable that fragmented aneuploidies formed by many small CNVs as noted here could manifest as metaphase aneuploidy upon chromosome condensation. Indeed, this possibility is supported by reported chromosomal aberrations affecting ∼65% of neuronal nuclei following somatic cell nuclear transfer to allow chromosomal condensation (31), implicating a linkage between fragmented aneuploidies in nonmitotic neural cells, as this approach provides a snapshot of how an interphase NPC could appear if instantaneously condensed to a metaphase spread.
CNV prevalence peaks during midcortical neurogenesis, strongly supporting their initial, but not exclusive, generation during prenatal life. Additionally, both the deletion predominance and the apparently random genomic localization that we have observed in mouse are consistent with scWGS studies in the human cerebral cortex (12–15). Use of array-comparative genomic hybridization revealed more prevalent clonal CNVs in the elderly human brain (32), which might be explained by technical and/or biological differences. Our use of fetal mouse brain cells limited to a mean of ∼20 cells per brain likely missed low-frequency clones that were initiating expansion and/or that were not sampled.
Our data identify CNVs as a universal feature of neural cells in the mammalian cerebral cortex that varies developmentally and, with aneuploidies and likely other sequence forms (2), contributes to neural GM. Although mechanisms regulating CNV generation, cell-type specificity, and their functional significance remain to be determined, our data indicate the existence of a vast range of previously unrecognized, smaller CNVs that can occur throughout the genome, a number that will surely increase as the resolution of scWGS improves. The alteration of CNVs during development supports involvement of regulatory mechanisms within the normally developing brain that could also be disrupted by environmental perturbations and disease, which likely affect specific genes.
Materials and Methods
Detailed descriptions of methods are presented in SI Appendix.
Sample Isolation.
All animal protocols were approved by the Institutional Animal Care and Use Committee at The Scripps Research Institute and conform to National Institutes of Health guidelines. Embryonic cortices were collected from timed-pregnant dams, cortical neurons, and splenocytes from adult C57BL/6J mice. Nuclei isolation was performed as described previously (3, 9). Samples were sorted into sterile, low-bind, DNase/RNase-free strip tubes containing 2.5 μL sterile PBS and stored at −80 °C.
TbA Sequencing Library Preparation.
All pre-PCR reagents were manufactured in a clean room using aseptic techniques. Genomic DNA released from cells was directly tagmented in the context of the cell lysate by adding Tagment DNA Buffer (5×; Illumina, Inc.) and Nextera transposomes (2 nM; Illumina, Inc.) for a total volume of 20 µL, followed by a 5-min incubation at 55 °C. After tagmentation, the reaction was stopped by adding 5 µL of 0.11% SDS and incubated for 5 min at room temperature. The library fragments were subsequently amplified by adding 15 µL PCR master mix composed of KAPA HiFi Fidelity buffer (3.33×; Kapa Biosystems), 1 mM dNTPs, and KAPA HiFi DNA Polymerase (0.03 U/µL; Kapa Biosystems) and 5 µL each of Nextera i5 and i7 PCR primers with barcodes (4 µM; Illumina, Inc.). PCR parameters were the following: 72 °C for 3 min, 98 °C for 30 s, then 20 cycles of 98 °C for 10 s, 60 °C for 30 s, and 72 °C for 30 s, and a final 72 °C for 5 min. PCR products were purified with AMPure XP beads (0.6×; Beckman Coulter) followed by library normalization and pooling of up to 96 uniquely barcoded samples, as with Nextera XT (Illumina, Inc.).
Data Analysis.
Sequencing data were processed by standard methods (10, 33) to obtain copy number profiles (25,000 bins of ∼0.1 Mb). intD was calculated for each CNV call and compared with the threshold value for its size. CNV calls exceeding the cutoff were converted to the euploid copy number value. As data were not normally distributed, nonparametric statistical comparisons were applied. All statistical testing was two-tailed, and multiple comparisons were adjusted with the Bonferroni–Holm method.
Supplementary Material
Acknowledgments
We thank Andrew Richards and Kun Zhang for informatics advice. This work was supported in part by the University of California, San Diego Graduate Training Program in Cellular and Molecular Pharmacology institutional training Grant T32 GM007752 from the National Institute of General Medical Sciences (to S.R. and C.S.L.); in part by The Shaffer Family Foundation (S.R. and B.S.); and by National Institute on Alcohol Abuse and Alcoholism Grant R01AA021402 (to J.C.).
Footnotes
Conflict of interest statement: S.R., C.A., and F.K. declare competing financial interests in the form of paid employment by Illumina, Inc. One or more embodiments of one or more patents and patent applications filed by Illumina may encompass the methods, reagents, and data disclosed in this article. Some work in this study is related to technology described in patent applications 2010/0120098, 2011/0287435, 2013/0196860, and US2015/0376608.
This article is a PNAS Direct Submission.
Data deposition: Sequencing data have been deposited in the National Center for Biotechnology Information Sequence Read Archive database, accession no. SRP121019.
This article contains supporting information online at www.pnas.org/lookup/suppl/doi:10.1073/pnas.1812702115/-/DCSupplemental.
References
- 1.Bushman DM, Chun J. The genomically mosaic brain: Aneuploidy and more in neural diversity and disease. Semin Cell Dev Biol. 2013;24:357–369. doi: 10.1016/j.semcdb.2013.02.003. [DOI] [PMC free article] [PubMed] [Google Scholar]
- 2.Rohrback S, Siddoway B, Liu CS, Chun J. Genomic mosaicism in the developing and adult brain. Dev Neurobiol. 2018 doi: 10.1002/dneu.22626. [DOI] [PMC free article] [PubMed] [Google Scholar]
- 3.Bushman DM, et al. Genomic mosaicism with increased amyloid precursor protein (APP) gene copy number in single neurons from sporadic Alzheimer’s disease brains. eLife. 2015;4:e05116. doi: 10.7554/eLife.05116. [DOI] [PMC free article] [PubMed] [Google Scholar]
- 4.Evrony GD, et al. Cell lineage analysis in human brain using endogenous retroelements. Neuron. 2015;85:49–59. doi: 10.1016/j.neuron.2014.12.028. [DOI] [PMC free article] [PubMed] [Google Scholar]
- 5.Zhang CZ, et al. Chromothripsis from DNA damage in micronuclei. Nature. 2015;522:179–184. doi: 10.1038/nature14493. [DOI] [PMC free article] [PubMed] [Google Scholar]
- 6.Yurov YB, et al. Aneuploidy and confined chromosomal mosaicism in the developing human brain. PLoS One. 2007;2:e558. doi: 10.1371/journal.pone.0000558. [DOI] [PMC free article] [PubMed] [Google Scholar]
- 7.Rehen SK, et al. Chromosomal variation in neurons of the developing and adult mammalian nervous system. Proc Natl Acad Sci USA. 2001;98:13361–13366. doi: 10.1073/pnas.231487398. [DOI] [PMC free article] [PubMed] [Google Scholar]
- 8.McConnell MJ, et al. Failed clearance of aneuploid embryonic neural progenitor cells leads to excess aneuploidy in the Atm-deficient but not the Trp53-deficient adult cerebral cortex. J Neurosci. 2004;24:8090–8096. doi: 10.1523/JNEUROSCI.2263-04.2004. [DOI] [PMC free article] [PubMed] [Google Scholar]
- 9.Westra JW, et al. Neuronal DNA content variation (DCV) with regional and individual differences in the human brain. J Comp Neurol. 2010;518:3981–4000. doi: 10.1002/cne.22436. [DOI] [PMC free article] [PubMed] [Google Scholar]
- 10.Baslan T, et al. Genome-wide copy number analysis of single cells. Nat Protoc. 2012;7:1024–1041. doi: 10.1038/nprot.2012.039. [DOI] [PMC free article] [PubMed] [Google Scholar]
- 11.Navin NE. The first five years of single-cell cancer genomics and beyond. Genome Res. 2015;25:1499–1507. doi: 10.1101/gr.191098.115. [DOI] [PMC free article] [PubMed] [Google Scholar]
- 12.Cai X, et al. Single-cell, genome-wide sequencing identifies clonal somatic copy-number variation in the human brain. Cell Rep. 2014;8:1280–1289. doi: 10.1016/j.celrep.2014.07.043. [DOI] [PMC free article] [PubMed] [Google Scholar]
- 13.Knouse KA, Wu J, Amon A. Assessment of megabase-scale somatic copy number variation using single-cell sequencing. Genome Res. 2016;26:376–384. doi: 10.1101/gr.198937.115. [DOI] [PMC free article] [PubMed] [Google Scholar]
- 14.McConnell MJ, et al. Mosaic copy number variation in human neurons. Science. 2013;342:632–637. doi: 10.1126/science.1243472. [DOI] [PMC free article] [PubMed] [Google Scholar]
- 15.Knouse KA, Wu J, Whittaker CA, Amon A. Single cell sequencing reveals low levels of aneuploidy across mammalian tissues. Proc Natl Acad Sci USA. 2014;111:13409–13414. doi: 10.1073/pnas.1415287111. [DOI] [PMC free article] [PubMed] [Google Scholar]
- 16.Custo Greig LF, Woodworth MB, Galazo MJ, Padmanabhan H, Macklis JD. Molecular logic of neocortical projection neuron specification, development and diversity. Nat Rev Neurosci. 2013;14:755–769. doi: 10.1038/nrn3586. [DOI] [PMC free article] [PubMed] [Google Scholar]
- 17.Blaschke AJ, Staley K, Chun J. Widespread programmed cell death in proliferative and postmitotic regions of the fetal cerebral cortex. Development. 1996;122:1165–1174. doi: 10.1242/dev.122.4.1165. [DOI] [PubMed] [Google Scholar]
- 18.Affymetrix 2008. Median of the absolute values of all pairwise differences and quality control on affymetrix genome-wide human SNP array 6.0.
- 19.Gole J, et al. Massively parallel polymerase cloning and genome sequencing of single cells using nanoliter microwells. Nat Biotechnol. 2013;31:1126–1132. doi: 10.1038/nbt.2720. [DOI] [PMC free article] [PubMed] [Google Scholar]
- 20.van den Bos H, et al. Single-cell whole genome sequencing reveals no evidence for common aneuploidy in normal and Alzheimer’s disease neurons. Genome Biol. 2016;17:116. doi: 10.1186/s13059-016-0976-2. [DOI] [PMC free article] [PubMed] [Google Scholar]
- 21.Evrony GD, et al. Single-neuron sequencing analysis of L1 retrotransposition and somatic mutation in the human brain. Cell. 2012;151:483–496. doi: 10.1016/j.cell.2012.09.035. [DOI] [PMC free article] [PubMed] [Google Scholar]
- 22.Das S, Hirano M, Tako R, McCallister C, Nikolaidis N. Evolutionary genomics of immunoglobulin-encoding loci in vertebrates. Curr Genomics. 2012;13:95–102. doi: 10.2174/138920212799860652. [DOI] [PMC free article] [PubMed] [Google Scholar]
- 23.Parra ZE, et al. Comparative genomic analysis and evolution of the T cell receptor loci in the opossum Monodelphis domestica. BMC Genomics. 2008;9:111. doi: 10.1186/1471-2164-9-111. [DOI] [PMC free article] [PubMed] [Google Scholar]
- 24.Cohen SM, Furey TS, Doggett NA, Kaufman DG. Genome-wide sequence and functional analysis of early replicating DNA in normal human fibroblasts. BMC Genomics. 2006;7:301. doi: 10.1186/1471-2164-7-301. [DOI] [PMC free article] [PubMed] [Google Scholar]
- 25.Hazen JL, et al. The complete genome sequences, unique mutational spectra, and developmental potency of adult neurons revealed by cloning. Neuron. 2016;89:1223–1236. doi: 10.1016/j.neuron.2016.02.004. [DOI] [PMC free article] [PubMed] [Google Scholar]
- 26.Vitak SA, et al. Sequencing thousands of single-cell genomes with combinatorial indexing. Nat Methods. 2017;14:302–308. doi: 10.1038/nmeth.4154. [DOI] [PMC free article] [PubMed] [Google Scholar]
- 27.Gu Y, et al. Defective embryonic neurogenesis in Ku-deficient but not DNA-dependent protein kinase catalytic subunit-deficient mice. Proc Natl Acad Sci USA. 2000;97:2668–2673. doi: 10.1073/pnas.97.6.2668. [DOI] [PMC free article] [PubMed] [Google Scholar]
- 28.Hastings PJ, Lupski JR, Rosenberg SM, Ira G. Mechanisms of change in gene copy number. Nat Rev Genet. 2009;10:551–564. doi: 10.1038/nrg2593. [DOI] [PMC free article] [PubMed] [Google Scholar]
- 29.Staley K, Blaschke AJ, Chun J. Apoptotic DNA fragmentation is detected by a semi-quantitative ligation-mediated PCR of blunt DNA ends. Cell Death Differ. 1997;4:66–75. doi: 10.1038/sj.cdd.4400207. [DOI] [PubMed] [Google Scholar]
- 30.Peterson SE, et al. Aneuploid cells are differentially susceptible to caspase-mediated death during embryonic cerebral cortical development. J Neurosci. 2012;32:16213–16222. doi: 10.1523/JNEUROSCI.3706-12.2012. [DOI] [PMC free article] [PubMed] [Google Scholar]
- 31.Osada T, Kusakabe H, Akutsu H, Yagi T, Yanagimachi R. Adult murine neurons: Their chromatin and chromosome changes and failure to support embryonic development as revealed by nuclear transfer. Cytogenet Genome Res. 2002;97:7–12. doi: 10.1159/000064037. [DOI] [PubMed] [Google Scholar]
- 32.Villela D, et al. Increased DNA copy number variation mosaicism in elderly human brain. Neural Plast. 2018;2018:2406170. doi: 10.1155/2018/2406170. [DOI] [PMC free article] [PubMed] [Google Scholar]
- 33.Olshen AB, Venkatraman ES, Lucito R, Wigler M. Circular binary segmentation for the analysis of array-based DNA copy number data. Biostatistics. 2004;5:557–572. doi: 10.1093/biostatistics/kxh008. [DOI] [PubMed] [Google Scholar]
Associated Data
This section collects any data citations, data availability statements, or supplementary materials included in this article.


